A novel validated stability Indicating RP-HPLC Method Development for the estimation of Certinib in...
13
Available online at www.scholarsresearchlibrary.com Scholars Research Library Der Pharmacia Lettre, 2014, 6 (5):339-351 (http://scholarsresearchlibrary.com/archive.html) ISSN 0975-5071 USA CODEN: DPLEB4 339 Scholar Research Library A novel validated stability indicating RP-HPLC method development for the estimation of ceritinib in it’s bulk and finished dosage form as per ICH guidelines 1 Ch. Naveen Kumar*, 1 V. Prathyusha and 2 N. Kannappan 1 Teegala Krishna Reddy College of Pharmacy, Department of Pharmaceutical Aanalysis & Quality Assurance, Medbowli, Meerpet, Saroornagar, Hyderabad, Telangana, India 2 Department of Pharmacy, Faculty of Engineering and Technology, Annamalainagar, Annamalai University, Chidambaram,Tamilnadu, India _____________________________________________________________________________________________ ABSTRACT A simple, stability indicating,selective, reproducible, economic, selective,RP- HPLC method has been developed and validated as per ICH guidelines for the estimation of Ceritinib (CER) both in bulk drug and in capsule dosage forms in the presence of degradation products. Reversed-phase chromatography was performed on a Kromosil C 18 column with mobile phase Methanol: water (65:35 v/v) at a flow rate of 1.0 ml min -1 . Detection was performed at 265nm and a sharp peak was obtained for CER at a retention time of 2.585 min. The method was validated for, precision, specificity and selectivity, accuracy, robustness, detection and quantification limits, and system suitability in accordance with ICH guidelines. Linear regression analysis data for the calibration plot showed there was a good linear relationship between response and concentration in the range 30- 150 ppm; the regression coefficient was 0.998 and the detection (LOD) and quantification (LOQ) limits were found to be 2.97 and 9.92 μg/ ml -1 , respectively. Statistical analysis had proved the method was precise, reproducible, selective, specific, and accurate for analysis of CER. In order to determine whether the analytical method and assay were stability-indicating, CER was stressed under various conditions to conduct forced degradation studies. stability indicating forced degradation established studies show results that there is no interference of any degraded products or external environmental conditions and it did not interfere with the detection of CER and the performed assay is thus specific stability- indicating . The wide linearity range, sensitivity, accuracy, short retention time, and simple mobile phase imply the method is suitable for routine quantification of CER with high precision and accuracy. Keywords: Stability-indicating; Reversed-phase chromatography; Ceritinib; forced degradation studies. _____________________________________________________________________________________________ INTRODUCTION Ceritinib (CER) is a 5-Chloro-N4-[2-[(1-methylethyl)sulfonyl]phenyl]-N2-[5- methyl-2-(1-methylethoxy)-4-(4- piperidinyl)phenyl 2,4- pyrimidinediamine. Empirical formula of C 28 H 36 N 5 O 3 ClS[1]. It is an Antineoplastic and kinase inhibitor indicated for the treatment of patients with anaplastic lymphoma kinase (ALK)-positive metastatic non-small cell lung cancer (NSCLC) who have progressed on or are intolerant to crizotinib [2]. There are no novel analytical methods developed for the estimation of ceritinib in pharmaceutical dosage forms as it is newly approved by FDA (April 29 th , 2014)[3]. Except that the clinical and non clinical related studies [4] performed. Hence, there was a need to develop simple, precise,accurate, robust and conventional method for the determination of CER. The
-
Upload
naveen-chennamaneni -
Category
Science
-
view
53 -
download
12
Transcript of A novel validated stability Indicating RP-HPLC Method Development for the estimation of Certinib in...
Available online at www.scholarsresearchlibrary.com
Scholars Research Library
Der Pharmacia Lettre, 2014, 6 (5):339-351
(http://scholarsresearchlibrary.com/archive.html)
ISSN 0975-5071 USA CODEN: DPLEB4
339 Scholar Research Library
A novel validated stability indicating RP-HPLC method development for the estimation of ceritinib in it’s bulk and finished dosage form as per ICH
guidelines
1Ch. Naveen Kumar*, 1V. Prathyusha and 2N. Kannappan
1 Teegala Krishna Reddy College of Pharmacy, Department of Pharmaceutical Aanalysis & Quality Assurance, Medbowli, Meerpet, Saroornagar, Hyderabad, Telangana, India
2Department of Pharmacy, Faculty of Engineering and Technology, Annamalainagar, Annamalai University, Chidambaram,Tamilnadu, India
_____________________________________________________________________________________________ ABSTRACT A simple, stability indicating,selective, reproducible, economic, selective,RP- HPLC method has been developed and validated as per ICH guidelines for the estimation of Ceritinib (CER) both in bulk drug and in capsule dosage forms in the presence of degradation products. Reversed-phase chromatography was performed on a Kromosil C18 column with mobile phase Methanol: water (65:35 v/v) at a flow rate of 1.0 ml min-1. Detection was performed at 265nm and a sharp peak was obtained for CER at a retention time of 2.585 min. The method was validated for, precision, specificity and selectivity, accuracy, robustness, detection and quantification limits, and system suitability in accordance with ICH guidelines. Linear regression analysis data for the calibration plot showed there was a good linear relationship between response and concentration in the range 30- 150 ppm; the regression coefficient was 0.998 and the detection (LOD) and quantification (LOQ) limits were found to be 2.97 and 9.92 µg/ ml -1, respectively. Statistical analysis had proved the method was precise, reproducible, selective, specific, and accurate for analysis of CER. In order to determine whether the analytical method and assay were stability-indicating, CER was stressed under various conditions to conduct forced degradation studies. stability indicating forced degradation established studies show results that there is no interference of any degraded products or external environmental conditions and it did not interfere with the detection of CER and the performed assay is thus specific stability- indicating . The wide linearity range, sensitivity, accuracy, short retention time, and simple mobile phase imply the method is suitable for routine quantification of CER with high precision and accuracy. Keywords: Stability-indicating; Reversed-phase chromatography; Ceritinib; forced degradation studies. _____________________________________________________________________________________________
INTRODUCTION Ceritinib (CER) is a 5-Chloro-N4-[2-[(1-methylethyl)sulfonyl]phenyl]-N2-[5- methyl-2-(1-methylethoxy)-4-(4-piperidinyl)phenyl 2,4- pyrimidinediamine. Empirical formula of C28H36N5O3ClS[1]. It is an Antineoplastic and kinase inhibitor indicated for the treatment of patients with anaplastic lymphoma kinase (ALK)-positive metastatic non-small cell lung cancer (NSCLC) who have progressed on or are intolerant to crizotinib [2]. There are no novel analytical methods developed for the estimation of ceritinib in pharmaceutical dosage forms as it is newly approved by FDA (April 29th, 2014)[3]. Except that the clinical and non clinical related studies [4] performed. Hence, there was a need to develop simple, precise,accurate, robust and conventional method for the determination of CER. The

Ch. Naveen Kumar et al Der Pharmacia Lettre, 2014, 6 (5):339-351 ______________________________________________________________________________
340 Scholar Research Library
aim of the present work is to develop an accurate, selective, precise and robust RP-HPLC method for the determination of CER both in bulk drug and in powder formulation. The proposed method was validated as per ICH guidelines [5,6] and its updated international convention regulatory discussions.
MATERIALS AND METHODS
Materials Pure Ceritinib (CER) was purchased from Novartis. Methanol and Water HPLC grade were used. Nylon 0.22µm- 45 mm membrane filter HPLC grade were used. And all other chemicals and reagents were of GR grade. Standard, sample, mobile phase and diluent preparation: Diluent: Methanol & Mobile phase are used as diluents. Preparation of mobile phase:Accurately weigh and transfer about 1.5 grams of Potassium di-hydrogen phosphate in 500 mL of purified water, added 0.5 mL of Triethylamine and adjusted the pH to 4.5 (±0.05) with dilute orthophosphoric acid and sonicated to enhance the solubility and degas. Preparation of standard stock solution Accurately weighed 10 mg CER was transferred to 10 ml volumetric flask, dissolved in7 ml diluent and sonicate it. And it is further diluted up to make with solvent. Preparation of sample stock solution The capsule powder, equivalent to 10 mg of CER was transferred into a 10ml volumetric flask and 1ml diluents were added. The content of the flask was sonicated for 10min and diluted to volume with the mobile phase. The above sample solution was filtered through Whatmann filter paper No. 22 prior to injection. To ensure, the solution was filtered again through 0.22 µ filter paper. Method development A Waters HPLC (module 2695) with photodiode array (PDA) detector and auto injector was used. Separation was performed on kromosil RPC18 4.5×150mm 5.0 µm maintained at room temperature. A variety of mobile phases were investigated in the development of an HPLC method suitable for analysis of CER in the bulk drug and in capsule powder. It consisting of different ratio of Methanol: water and MeOH: KH2PO4 buffer pH 4.5. The mobile phase was filtered through nylon 0.22 µm - 45 mm membrane filter. Flow rate was adjusted to 1.0 ml min-1 and wavelength lamda max was observed at 265 nm. Method validation Linearity and range Solutions of different concentration (30- 150µg ml-1) are used for construction of calibration plots were prepared from the standard stock solution. The mobile phase was filtered through a 0.45 µ membrane filter and delivered at 1.0 ml min-1 for column equilibration; the baseline was monitored continuously during this process. The detection wave-length was 265 nm. The prepared dilutions were injected in series, peak area was calculated for each dilution, and concentration was plotted against peak area. Data was analyzed through linear regression. Accuracy (as % Recovery) Accuracy was determined by the standard addition method. Previously analyzed samples (CER 90 µg ml-1) were spiked with 50, 100 and 150% extra CER standard and the mixtures were analyzed by the proposed method. The experiment was performed in triplicate. Recovery (%), SD (%) and % CV were calculated for each concentration. Precision Precision was determined as both repeatability (Method precision) and intermediate precision, in accordance with ICH recommendations. The repeatability was checked by repeatedly injecting (n = 5) solution of CER (90µg ml-1). The results were reported in terms of % coefficient of variance (% CV) should not be more than 2 %. Intermediate precision was evaluated in terms of intra-day and inter-day precision. For both intra-day and inter-day variation, replicate analysis of solutions of CER at three different concentrations (60, 90 and 120µg ml-1) were carried out for six times. The results were reported in terms of % coefficient of variance (% CV).

Ch. Naveen Kumar et al Der Pharmacia Lettre, 2014, 6 (5):339-351 ______________________________________________________________________________
341 Scholar Research Library
Specificity and selectivity The specificity of the method was established through resolution factor of the drug peak from the nearest resolving peak and also among all other peaks. Selectivity was confirmed through peak purity data using a PDA detector. To assess the method specificity, capsule without CER (placebo) was prepared with the excipients as per commercial preparation and compared with respective CER standard to evaluate specificity of the method. Representative chromatograms of placebo and standard were compared for retention time, resolution factor and purity. Robustness The robustness of the developed method was determined to assess the effect of small but deliberate variation of the chromatographic conditions on the determination of CER. Robustness was determined by changing ratio of mobile phase, column own temperature, wave-length, and injection volume. Detection (LOD) and Quantification (LOQ) Limits LOD and LOQ were determined by the standard deviation (Sy/x) method. Blank samples were injected in triplicate and the peak area of this blank was calculated. LOD and LOQ were determined from the slope, S, of the calibration plot and the standard deviation of the response for the blank sample, Sy/x, by use of the formulae LOD = 3.3 × Sy/x/S and LOQ = 10 × Sy/x/S. System suitability As system suitability test was an integral part of chromatographic methods development and was used to verify that the system is adequate for the analysis to be performed, the system suitability parameters for CER were evaluated. The suitability of the chromatographic system was demonstrated by comparing the obtained parameter values, with the acceptance criteria of the ICH guidelines. Solution stability The stability of the drug in solution during analysis was determined by repeated analysis of samples during the course of experimentation on the same day and also after storage of the drug solution for 24 hrs under laboratory bench conditions (32 ± 1°C) and under refrigeration (8 ± 0.5°C). Forced degradation study In order to determine whether the analytical method and assay were stability-indicating, CER was stressed under various conditions to conduct forced degradation studies. Methanol was used as solvent in all studies, as CER is freely soluble in methanol. In all cases, contents equivalent to 10 mg CER was accurately weighed and solutions were prepared as previously described using suitable solvent, to yield starting concentration 90 µg ml-1 of CER for analysis. Sample solution was exposed to hydrolytic (acid and base), thermal (dry heat), oxidative and photolytic stress conditions and, the stressed samples were analyzed by the proposed method. Acid degradation To check the stability in acidic condition hydrochloric acid was used in different strength. Solution of CER is used for acid degradation. It was done by using 0.1N hydrochloric acid in methanol and the resultant solution was refluxed at 60 ºC for around 12 hours to facilitate acid degradation of CER. Alkali degradation To check the stability in alkaline condition sodium hydroxide was used. Solution of CER is used for alkali degradation. It was done by using 1N NaOH in methanol and the resultant solution was refluxed at 600 C for around 12hours to facilitate alkali degradation of CER. Wet heat (Hydrolysis) Solution of CER (90µg ml-1) for wet heat degradation study was prepared using HPLC grade water and the resultant solution was refluxed at 60 ºC for 12 hours to facilitate hydrolysis of CER. Dry heat Solution for dry heat study were prepared by exposing approximately 10 mg of powder in aluminum foil to dry heat in an oven at 60 ºC for 2hours to facilitates dry heat degradation of CER. The powder was removed from oven and the content of powder equivalent to 10 mg of CER was accurately weighed and transferred to volumetric flask to make the final concentration 90 µg ml-1 of CER.

Ch. Naveen Kumar et al Der Pharmacia Lettre, 2014, 6 (5):339-351 ______________________________________________________________________________
342 Scholar Research Library
Oxidation To check the stability in oxidative condition hydrogen peroxide was used in different strength. Solution of CER (90µg ml-1) for oxidation study was prepared using 30 % H2O2 in methanol and the resultant solution was refluxed at 60 ºC for 12 hours to facilitate oxidation of CER. Photo stability (Sun light and UV light) Powder was exposed to sunlight to determine the effects of light irradiation on the stability of CER. Approximately 100 mg of CER powder was spread on a glass dish in a layer that was less than 2 mm thick. Sample for photo stability testing is placed in direct sunlight exposed for 12 hours. The powder is removed from the sun light and the contents of powder equivalent to 10 mg of CER was accurately weighed and transferred to volumetric flask to make the final concentration 90 µg ml-1 of CER. Control samples which were protected with aluminum foil were also placed in the light cabinet and exposed concurrently. Following removal from the light cabinet, all samples were prepared for analysis as previously described. Analysis of Ceritinib in powder Zykadia powder was used for analysis. Appropriate three different aliquots from sample solution (90 µg ml-1) were suitably diluted with mobile phase in such a way to get concentrations in a range of 30 to 150 ppm for CER. The finally prepared solutions were analysed under proposed chromatographic condition. The amount of CER present in sample solution was determined by fitting the area response into the regression equation of CER in the method.
RESULTS AND DISCUSSION
Method optimization Initial studies to develop the method involved the use of C18 column with various mobile phases ratio containing MeOH: KH2PO4 buffer. Almost every system studied, while the separation of more polar compounds was in some instance obtained, CER showed a retention time steady baseline required for the analysis of CER in presence of degraded impurities with an acceptable retention time. It was observed that satisfactory resolution of CER and its degradation products formed under various conditions and present in the mixture of stressed samples were achieved. The method was optimized to separate major degradation products formed under various conditions. The optimized chromatographic conditions are mentioned in Table 1. Resolution was also checked on mixture of the degradation samples to confirm the separation behaviour. It indicates that the gradient method was successful in separation of drug and all degradation products. A representative chromatogram is shown in Figure 1, which satisfies all the system suitability criteria, better resolution of the peak from solvent peak with clear base line separation was found
[Table 1: showing Optimized method parameters]
Parameters Description Column kromosil RPC18 4.5×150mm5.0 µm Column temperature 27 ± 10C Mobile phase MeOH : H2O (65:35%v/v) Description Photodiode array detection at 265 nm Injection volume 20 µl Flow rate 1.0 ml min-1
Figure 1: Chromatogram of CER (1 µg m-1) standard with corresponding retention time at 265 nm by stability indicating RP-HPLC method
Ch. Naveen Kumar et al Der Pharmacia Lettre, 2014, 6 (5):339-351 ______________________________________________________________________________
343 Scholar Research Library
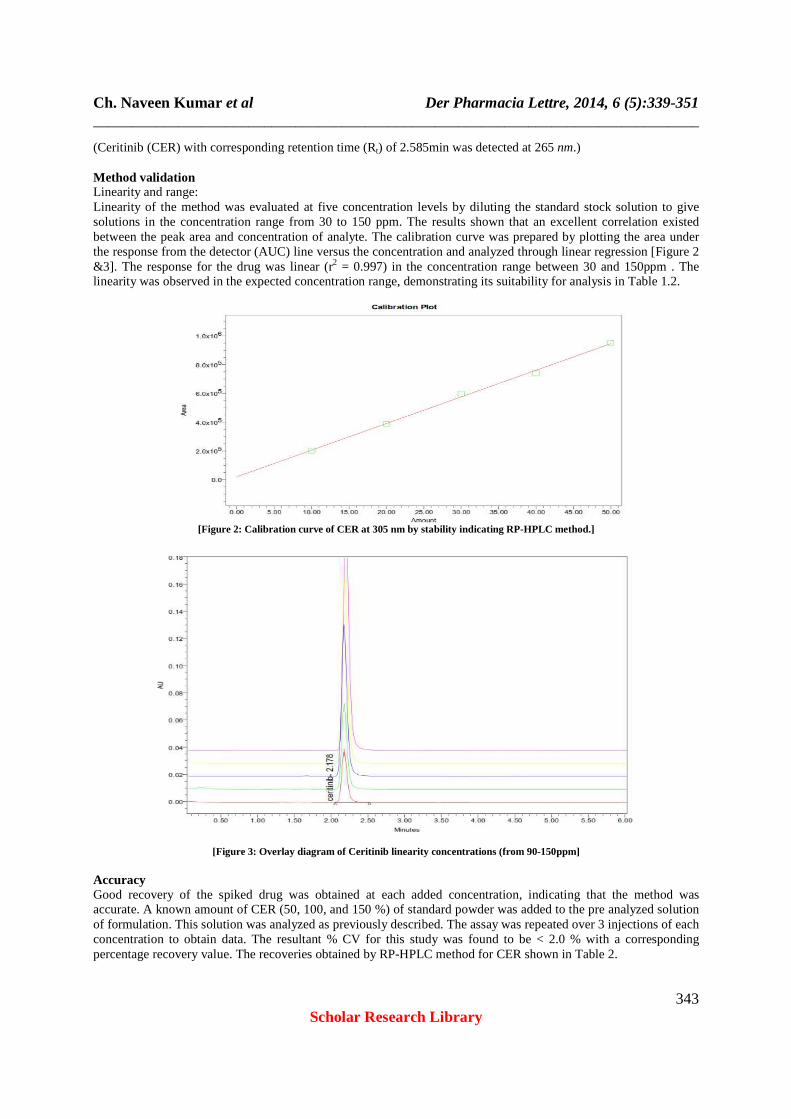
(Ceritinib (CER) with corresponding retention time (Rt) of 2.585min was detected at 265 nm.) Method validation Linearity and range: Linearity of the method was evaluated at five concentration levels by diluting the standard stock solution to give solutions in the concentration range from 30 to 150 ppm. The results shown that an excellent correlation existed between the peak area and concentration of analyte. The calibration curve was prepared by plotting the area under the response from the detector (AUC) line versus the concentration and analyzed through linear regression [Figure 2 &3]. The response for the drug was linear (r2 = 0.997) in the concentration range between 30 and 150ppm . The linearity was observed in the expected concentration range, demonstrating its suitability for analysis in Table 1.2.
[Figure 2: Calibration curve of CER at 305 nm by stability indicating RP-HPLC method.]
[Figure 3: Overlay diagram of Ceritinib linearity c oncentrations (from 90-150ppm] Accuracy Good recovery of the spiked drug was obtained at each added concentration, indicating that the method was accurate. A known amount of CER (50, 100, and 150 %) of standard powder was added to the pre analyzed solution of formulation. This solution was analyzed as previously described. The assay was repeated over 3 injections of each concentration to obtain data. The resultant % CV for this study was found to be < 2.0 % with a corresponding percentage recovery value. The recoveries obtained by RP-HPLC method for CER shown in Table 2.
Ch. Naveen Kumar et al Der Pharmacia Lettre, 2014, 6 (5):339-351 ______________________________________________________________________________
344 Scholar Research Library
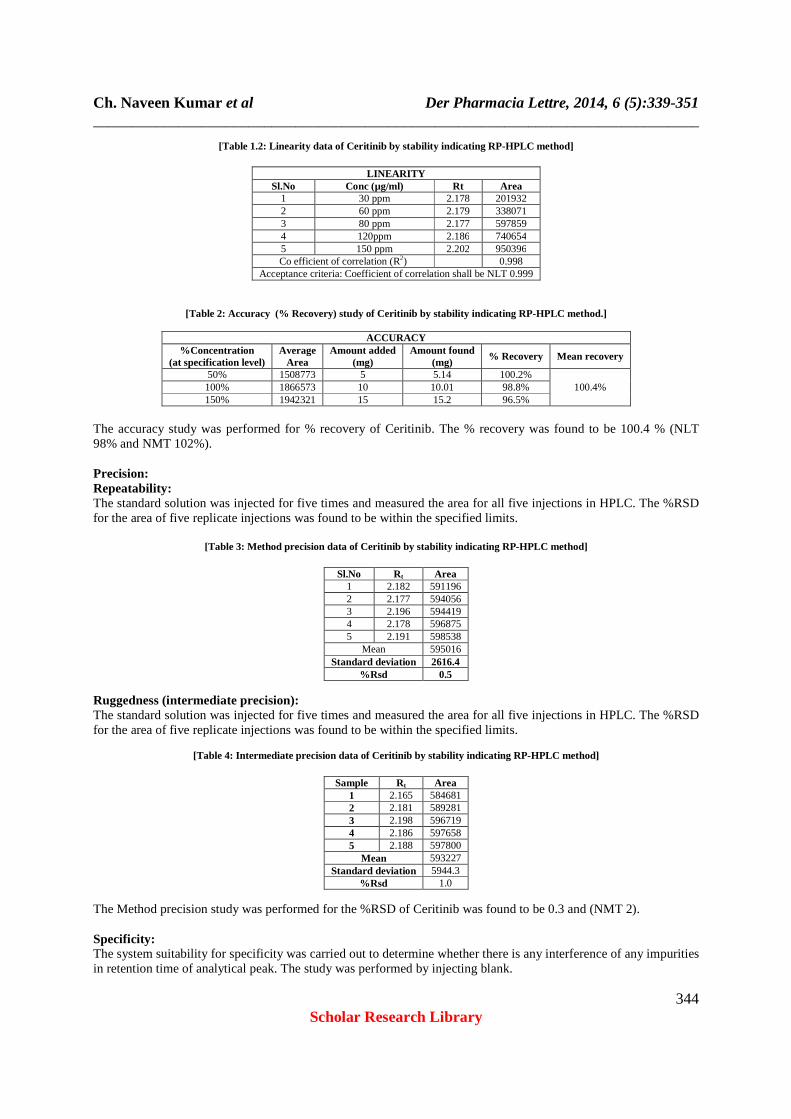
[Table 1.2: Linearity data of Ceritinib by stabilit y indicating RP-HPLC method]
LINEARITY Sl.No Conc (µg/ml) Rt Area
1 30 ppm 2.178 201932 2 60 ppm 2.179 338071 3 80 ppm 2.177 597859 4 120ppm 2.186 740654 5 150 ppm 2.202 950396 Co efficient of correlation (R2) 0.998
Acceptance criteria: Coefficient of correlation shall be NLT 0.999
[Table 2: Accuracy (% Recovery) study of Ceritinib by stability indicating RP-HPLC method.]
ACCURACY %Concentration
(at specification level) Average
Area Amount added
(mg) Amount found
(mg) % Recovery Mean recovery
50% 1508773 5 5.14 100.2% 100.4% 100% 1866573 10 10.01 98.8%
150% 1942321 15 15.2 96.5%
The accuracy study was performed for % recovery of Ceritinib. The % recovery was found to be 100.4 % (NLT 98% and NMT 102%). Precision: Repeatability: The standard solution was injected for five times and measured the area for all five injections in HPLC. The %RSD for the area of five replicate injections was found to be within the specified limits.
[Table 3: Method precision data of Ceritinib by stability indicating RP-HPLC method]
Sl.No Rt Area 1 2.182 591196 2 2.177 594056 3 2.196 594419 4 2.178 596875 5 2.191 598538
Mean 595016 Standard deviation 2616.4
%Rsd 0.5 Ruggedness (intermediate precision): The standard solution was injected for five times and measured the area for all five injections in HPLC. The %RSD for the area of five replicate injections was found to be within the specified limits.
[Table 4: Intermediate precision data of Ceritinib by stability indicating RP-HPLC method]
Sample Rt Area 1 2.165 584681 2 2.181 589281 3 2.198 596719 4 2.186 597658 5 2.188 597800
Mean 593227 Standard deviation 5944.3
%Rsd 1.0 The Method precision study was performed for the %RSD of Ceritinib was found to be 0.3 and (NMT 2). Specificity: The system suitability for specificity was carried out to determine whether there is any interference of any impurities in retention time of analytical peak. The study was performed by injecting blank.

Ch. Naveen Kumar et al Der Pharmacia Lettre, 2014, 6 (5):339-351 ______________________________________________________________________________
345 Scholar Research Library
[Figure 4: Chromatogram showing blank (mobile phase preparation)
[Figure 5: chromatogram showing standard injection] Robustness: The robustness was performed for the flow rate variations from 0.8ml/min to 1.2 ml/min and mobile phase ratio variation from more organic phase to less organic phase ratio for Ceritinib. The method is robust only in less flow condition and the method is robust even by change in the Mobile phase ±5%.
[Table 5: Showing system suitability results for Ceritinib]
S. No Flow rate (ml/min) System suitability results
USP Plate Count USP Tailing 1 0.7 4352 1.1 2 0.8 4024 1.2 3 0.9 3730 1.2
Detection limit: LOD’s can be calculated based on the standard deviation of the response (SD) and the slope of the calibration curve (S) at levels approximating the LOD according to the formula. The standard deviation of the response can be determined based on the standard deviation of y-intercepts of regression lines. Formula:
Where
- Standard deviation (SD) S - Slope.

Ch. Naveen Kumar et al Der Pharmacia Lettre, 2014, 6 (5):339-351 ______________________________________________________________________________
346 Scholar Research Library
[Figure 6: Chromatogram Showing results for Limit of Detection].
[Table 6: showing values of LOD]
Drug name Standard deviation(ó) Slope(s) LOD(µg)
Ceritinib 371827.90 563365963 2.97
Quantitation limit: LOQ’s can be calculated based on the standard deviation of the response (SD) and the slope of the calibration curve (S) according to the formula. Again, the standard deviation of the response can be determined based on the standard deviation of y-intercepts of regression lines. Formula:
Where
- Standard deviation S - Slope.
[Figure 7: Chromatogram Showing results for Limit of Quantitation].
[Table.7: Showing results for Limit of Quantitation].
Drug name Standard deviation(ó) Slope(s) LOQ(µg) Ceritinib 371827.90 563365963 9.92

Ch. Naveen Kumar et al Der Pharmacia Lettre, 2014, 6 (5):339-351 ______________________________________________________________________________
347 Scholar Research Library
System suitability:
[Table.8: Showing system suitability results for Ceritinib]
S. No Change in organic composition in the mobile phase System suitability results
USP Plate Count USP Tailing 1 10 % less 4331 1.20 2 *Actual 4024 0.87 3 10% more 3693 1.26
Forced degradation of Ceritinib:
1. Acid degradation:
[Figure 8: Chromatogram Showing Acid degradation of ceritinib]. [Figure 9: Chromatogram Showing Purity plot].
[Figure 10: Chromatogram of spectrum Index plot].
[Table.9: Showing results for Acid degradation].

Ch. Naveen Kumar et al Der Pharmacia Lettre, 2014, 6 (5):339-351 ______________________________________________________________________________
348 Scholar Research Library
2. Base degradation:
[Figure 11: Chromatogram Showing Base degradation of ceritinib]. [Figure 12: Chromatogram Showing purity plot].
[Figure 13: Chromatogram of spectrum Index plot].
[Table.10: Showing results for Base degradation of Ceritinib].
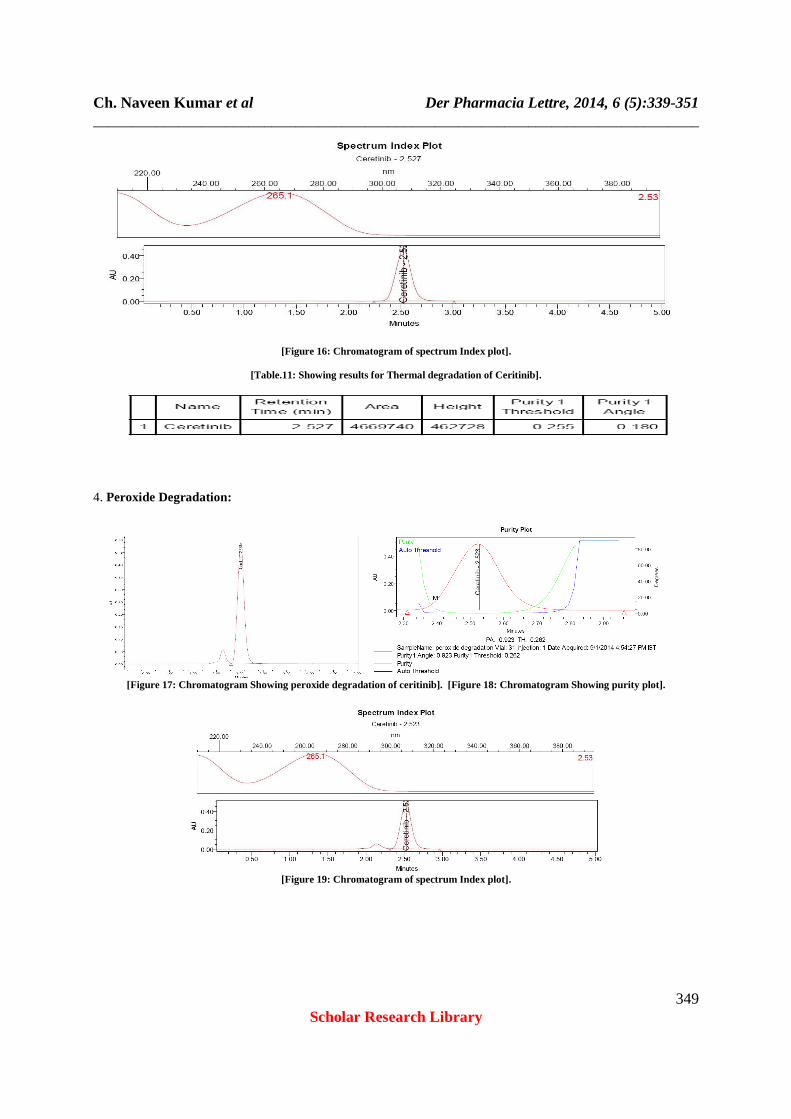
3. Thermal Degradation:
[Figure 14: Chromatogram Showing Thermal degradation of ceritinib]. [Figure 15: Chromatogram Showing purity plot].
Ch. Naveen Kumar et al Der Pharmacia Lettre, 2014, 6 (5):339-351 ______________________________________________________________________________
349 Scholar Research Library
[Figure 16: Chromatogram of spectrum Index plot].
[Table.11: Showing results for Thermal degradation of Ceritinib].
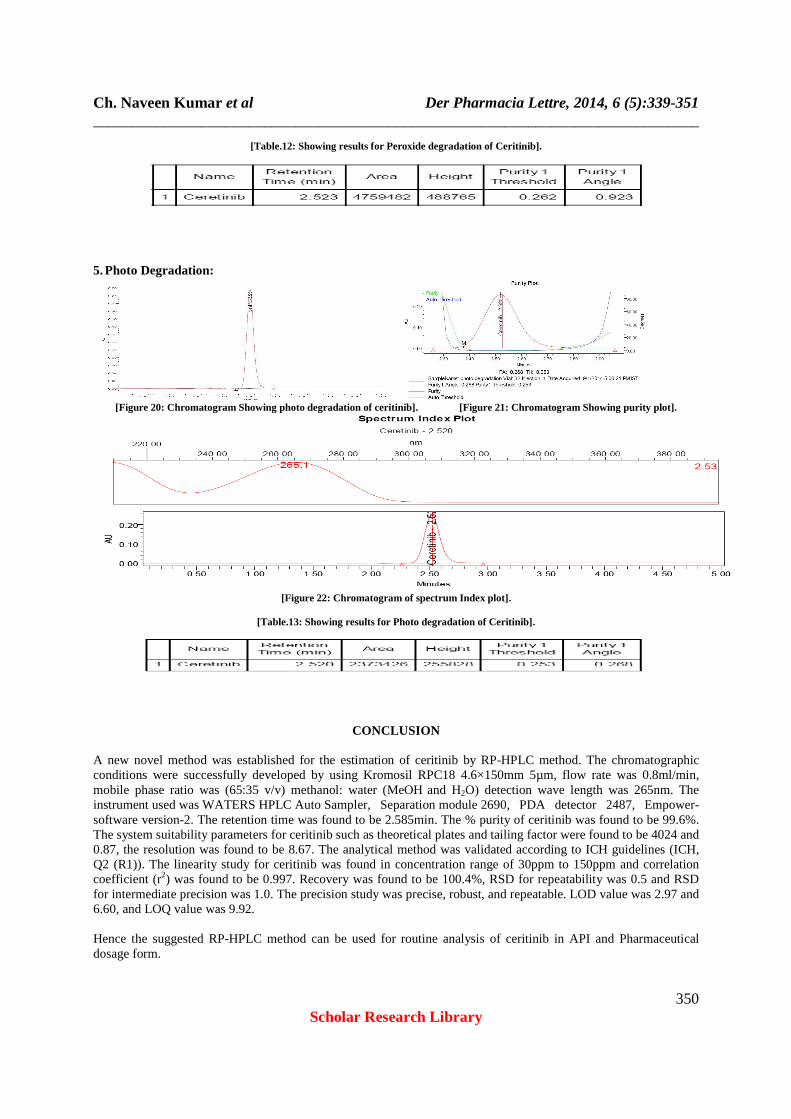
4. Peroxide Degradation:
[Figure 17: Chromatogram Showing peroxide degradation of ceritinib]. [Figure 18: Chromatogram Showing purity plot].
[Figure 19: Chromatogram of spectrum Index plot].
Ch. Naveen Kumar et al Der Pharmacia Lettre, 2014, 6 (5):339-351 ______________________________________________________________________________
350 Scholar Research Library
[Table.12: Showing results for Peroxide degradation of Ceritinib].
5. Photo Degradation:
[Figure 20: Chromatogram Showing photo degradation of ceritinib]. [Figure 21: Chromatogram Showing purity plot].
[Figure 22: Chromatogram of spectrum Index plot].
[Table.13: Showing results for Photo degradation of Ceritinib].
CONCLUSION
A new novel method was established for the estimation of ceritinib by RP-HPLC method. The chromatographic conditions were successfully developed by using Kromosil RPC18 4.6×150mm 5µm, flow rate was 0.8ml/min, mobile phase ratio was (65:35 v/v) methanol: water (MeOH and H2O) detection wave length was 265nm. The instrument used was WATERS HPLC Auto Sampler, Separation module 2690, PDA detector 2487, Empower-software version-2. The retention time was found to be 2.585min. The % purity of ceritinib was found to be 99.6%. The system suitability parameters for ceritinib such as theoretical plates and tailing factor were found to be 4024 and 0.87, the resolution was found to be 8.67. The analytical method was validated according to ICH guidelines (ICH, Q2 (R1)). The linearity study for ceritinib was found in concentration range of 30ppm to 150ppm and correlation coefficient (r2) was found to be 0.997. Recovery was found to be 100.4%, RSD for repeatability was 0.5 and RSD for intermediate precision was 1.0. The precision study was precise, robust, and repeatable. LOD value was 2.97 and 6.60, and LOQ value was 9.92. Hence the suggested RP-HPLC method can be used for routine analysis of ceritinib in API and Pharmaceutical dosage form.

Ch. Naveen Kumar et al Der Pharmacia Lettre, 2014, 6 (5):339-351 ______________________________________________________________________________
351 Scholar Research Library
REFERENCES
1[1]http://www.druginformation.com/RxDrugs/C/Ceritinib%20Capsules.html [2]http://www.pharma.us.novartis.com/product/pi/pdf/zykadia.pdf. [3]http://www.drugs.com/newdrugs/fda-approves-zykadia-ceritinib-metastatic-non-small-cell-lung-cancer-035.html. [4]http://www.rxlist.com/zykadia-drug/clinical-pharmacology.htm [5]ICH, Validation of analytical procedure: Methodology Q2A, International Conference on Harmonization, Geneva; 1994. [6]ICH, Validation of analytical procedure: Methodology Q2B, International Conference on Harmonization, Geneva; 1996.


![November 12, 2018 Pharmaceuticals and Medical Devices Agency · identification (HPLC and ultraviolet-visible spectrum [UV/VIS]), purity (enantiomers [HPLC]), uniformity of dosage](https://static.fdocuments.in/doc/165x107/5f4351075c90a95d9d55a2b1/november-12-2018-pharmaceuticals-and-medical-devices-agency-identification-hplc.jpg)


