A Novel “Single-Path” vs. “Few-Path” Test Based on Higher ... · order statistics to...
13
Journal of Applied Research and Technology 7 A Novel “Single-Path” vs. “Few-Path” Test Based on Higher Order Statistics to Possibly Start-Up Coherent Combining F. Benedetto*, G. Giunta and E. Guzzon Signal Processing for Telecommunications and Economics (SP4TE) Lab University of ROMA TRE, via Vito Volterra 62 00146 Rome, Italy *[email protected] ABSTRACT This paper focuses on an innovative hypothesis test for discrimination of wireless mobile channels based on higher order statistics to possibly start-up coherent combining. We have devised a new testing procedure, namely the Rakeness test, that statistically measures how much the series under investigation (amplitude samples of matched filter receiver's output) fits Rice vs. non-Rice models. This is equivalent to discriminate between the cases of a channel with one single dominant path (strong propagation), or with few dominant paths (weak propagation). Then, mathematical expressions for the bias and variance of the new testing variable are derived, by a 3-D reduced Taylor’s expansion up to the second order. The achieved results, obtained throughout theory and simulations, evidence the robustness of this innovative test. Our test can hence be used as a preliminary signal processing method to decide if simpler choices (i.e. matched filters) or cumbersome coherent combining strategies (i.e. Rake receivers) can be effectively implemented at the receiver’s side. Keywords: Wireless channel modeling, Hypothesis testing, Higher order statistics, Coherent combining, Rake receiver. 1. Introduction Wireless has recently become an increasingly viable option for indoor communication systems [1, and references therein]. Multi-path interference, or interference due to the reception of multiple copies of a signal due to reflections and/or diffractions, is known to be a problem in all types of indoor communication channels [2]. As a result, the study of indoor propagation characteristics has become an area of increased importance [3]. The location methods time-of-arrival (TOA) and time-difference- of-arrival (TDOA) will become essential for position computation in these wireless scenarios [4]. A major disadvantage of TOA and TDOA is that these methods require line-of-sight (LOS) propagation. In fact, as stated in [5], an important assumption for all time measurements is LOS. If LOS is not available, that is in non-LOS (NLOS) conditions, timing errors occur when these methods are applied. The popular LOS/NLOS identification methods introduced in the literature take into account some channel parameters to form a binary hypothesis test [6]. The channel marginal probability density function (PDF) reduces to the Rayleigh distribution in case of NLOS propagation [7]. Although important, the results for Rayleigh channels cannot describe communication environments with LOS components, which is the case of microcells in mobile systems [8]. A Rice fading model is more appropriate as it includes the LOS components. However, for most purposes, the Rayleigh and Rice cases are not sufficient to characterize the performance of systems in mobile channels: in fact, some channels are neither Rice nor Rayleigh [1]. An alternative distribution is known as the Nakagami-m distribution. This assumes that the received signal is a sum of vectors with random magnitude and random phases, leading to more flexibility and potentially more accuracy in matching experimental data than the use of Rayleigh or Rician distributions. In addition, it is well known that the short-term fading conditions of the received envelope in wireless communications channels can be modeled by means of the Nakagami-m distribution [1]. Conversely, the Rice distribution gives the exact distribution of the amplitude of a non-zero-mean
Transcript of A Novel “Single-Path” vs. “Few-Path” Test Based on Higher ... · order statistics to...

Journal of Applied Research and Technology 7
A Novel “Single-Path” vs. “Few-Path” Test Based on Higher Order Statistics to Possibly Start-Up Coherent Combining F. Benedetto*, G. Giunta and E. Guzzon Signal Processing for Telecommunications and Economics (SP4TE) Lab University of ROMA TRE, via Vito Volterra 62 00146 Rome, Italy *[email protected] ABSTRACT This paper focuses on an innovative hypothesis test for discrimination of wireless mobile channels based on higher order statistics to possibly start-up coherent combining. We have devised a new testing procedure, namely the Rakeness test, that statistically measures how much the series under investigation (amplitude samples of matched filter receiver's output) fits Rice vs. non-Rice models. This is equivalent to discriminate between the cases of a channel with one single dominant path (strong propagation), or with few dominant paths (weak propagation). Then, mathematical expressions for the bias and variance of the new testing variable are derived, by a 3-D reduced Taylor’s expansion up to the second order. The achieved results, obtained throughout theory and simulations, evidence the robustness of this innovative test. Our test can hence be used as a preliminary signal processing method to decide if simpler choices (i.e. matched filters) or cumbersome coherent combining strategies (i.e. Rake receivers) can be effectively implemented at the receiver’s side. Keywords: Wireless channel modeling, Hypothesis testing, Higher order statistics, Coherent combining, Rake receiver. 1. Introduction Wireless has recently become an increasingly viable option for indoor communication systems [1, and references therein]. Multi-path interference, or interference due to the reception of multiple copies of a signal due to reflections and/or diffractions, is known to be a problem in all types of indoor communication channels [2]. As a result, the study of indoor propagation characteristics has become an area of increased importance [3]. The location methods time-of-arrival (TOA) and time-difference-of-arrival (TDOA) will become essential for position computation in these wireless scenarios [4]. A major disadvantage of TOA and TDOA is that these methods require line-of-sight (LOS) propagation. In fact, as stated in [5], an important assumption for all time measurements is LOS. If LOS is not available, that is in non-LOS (NLOS) conditions, timing errors occur when these methods are applied. The popular LOS/NLOS identification methods introduced in the literature take into account some channel parameters to form a binary hypothesis test [6]. The channel marginal probability density function (PDF)
reduces to the Rayleigh distribution in case of NLOS propagation [7]. Although important, the results for Rayleigh channels cannot describe communication environments with LOS components, which is the case of microcells in mobile systems [8]. A Rice fading model is more appropriate as it includes the LOS components. However, for most purposes, the Rayleigh and Rice cases are not sufficient to characterize the performance of systems in mobile channels: in fact, some channels are neither Rice nor Rayleigh [1]. An alternative distribution is known as the Nakagami-m distribution. This assumes that the received signal is a sum of vectors with random magnitude and random phases, leading to more flexibility and potentially more accuracy in matching experimental data than the use of Rayleigh or Rician distributions. In addition, it is well known that the short-term fading conditions of the received envelope in wireless communications channels can be modeled by means of the Nakagami-m distribution [1]. Conversely, the Rice distribution gives the exact distribution of the amplitude of a non-zero-mean
A Novel “Single-Path” vs. “Few-Path” Test Based on Higher Order Statistics to Possibly Start-Up Coherent Combining, F. Benedetto et al. / 7-19
Vol. 13, February 2015 8
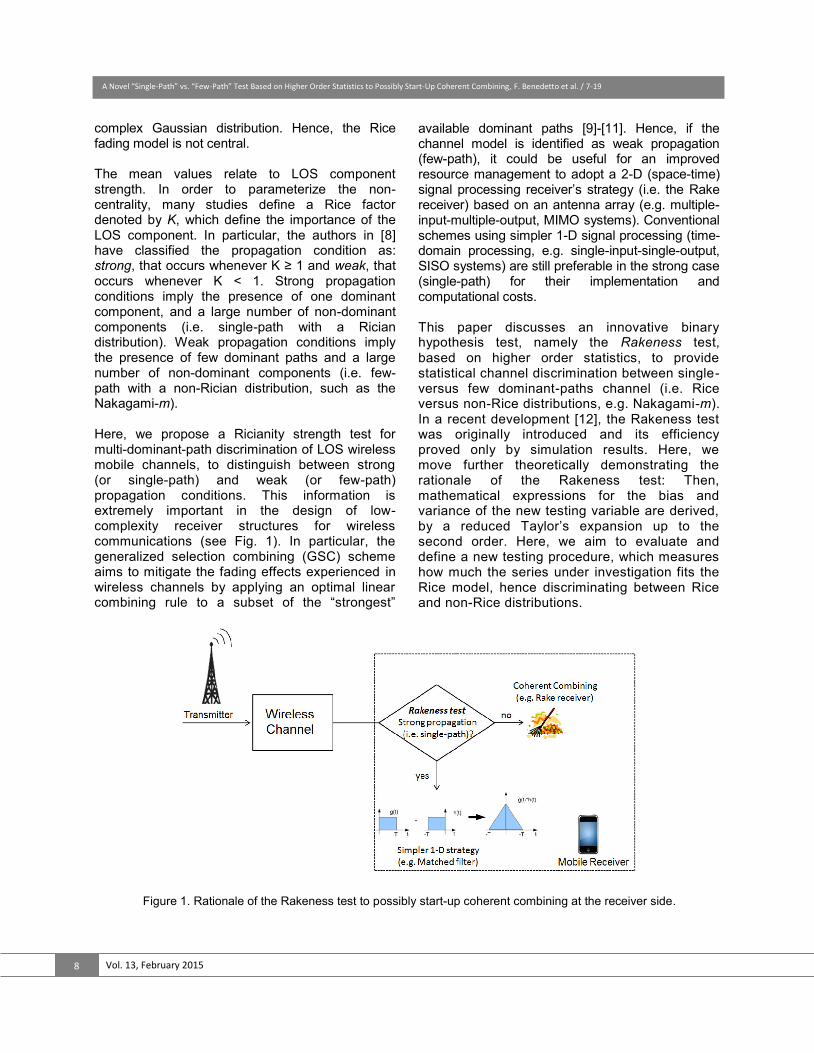
complex Gaussian distribution. Hence, the Rice fading model is not central. The mean values relate to LOS component strength. In order to parameterize the non-centrality, many studies define a Rice factor denoted by K, which define the importance of the LOS component. In particular, the authors in [8] have classified the propagation condition as: strong, that occurs whenever K ≥ 1 and weak, that occurs whenever K < 1. Strong propagation conditions imply the presence of one dominant component, and a large number of non-dominant components (i.e. single-path with a Rician distribution). Weak propagation conditions imply the presence of few dominant paths and a large number of non-dominant components (i.e. few-path with a non-Rician distribution, such as the Nakagami-m). Here, we propose a Ricianity strength test for multi-dominant-path discrimination of LOS wireless mobile channels, to distinguish between strong (or single-path) and weak (or few-path) propagation conditions. This information is extremely important in the design of low-complexity receiver structures for wireless communications (see Fig. 1). In particular, the generalized selection combining (GSC) scheme aims to mitigate the fading effects experienced in wireless channels by applying an optimal linear combining rule to a subset of the “strongest”
available dominant paths [9]-[11]. Hence, if the channel model is identified as weak propagation (few-path), it could be useful for an improved resource management to adopt a 2-D (space-time) signal processing receiver’s strategy (i.e. the Rake receiver) based on an antenna array (e.g. multiple-input-multiple-output, MIMO systems). Conventional schemes using simpler 1-D signal processing (time-domain processing, e.g. single-input-single-output, SISO systems) are still preferable in the strong case (single-path) for their implementation and computational costs. This paper discusses an innovative binary hypothesis test, namely the Rakeness test, based on higher order statistics, to provide statistical channel discrimination between single- versus few dominant-paths channel (i.e. Rice versus non-Rice distributions, e.g. Nakagami-m). In a recent development [12], the Rakeness test was originally introduced and its efficiency proved only by simulation results. Here, we move further theoretically demonstrating the rationale of the Rakeness test: Then, mathematical expressions for the bias and variance of the new testing variable are derived, by a reduced Taylor’s expansion up to the second order. Here, we aim to evaluate and define a new testing procedure, which measures how much the series under investigation fits the Rice model, hence discriminating between Rice and non-Rice distributions.
Figure 1. Rationale of the Rakeness test to possibly start-up coherent combining at the receiver side.

A Novel “Single-Path” vs. “Few-Path” Test Based on Higher Order Statistics to Possibly Start-Up Coherent Combining, F. Benedetto et al. / 7-19
Journal of Applied Research and Technology 9
The remainder of this paper is organized as follows. Section 2 highlights both the motivations and system model that form the basis of the proposed innovative test, whose implementation is described in Section 3. Performance analysis is carried out in Section 4 by means of a 3-D reduced Taylor’s expansion up to the second order Discussions and numerical results, from theory and simulations are outlined in Section 5. Finally, our conclusions are depicted in Section 6. 2. Materials and methods 2.1 Motivations We have searched through the literature, finding many works about statistical discrimination of mobile wireless channels (see for example [5], [6], [13]-[15] and references therein). They are all accounting for statistical discrimination between LOS and NLOS propagation. Here, we move further not considering the discrimination between a physical LOS or NLOS connection. Conversely, we focus on which can be the most suited signal processing strategy at the receiver’s side, discriminating between channels with one or few dominant paths without stating if the channel is LOS or NLOS. As one can easily imagine, the case of few dominant paths typically characterizes NLOS propagation. Nonetheless, even a LOS channel can present few dominant paths. In fact, let us now consider the Digital Video Broadcasting—Handheld (DVB-H) standard [16], where multiple antenna transmission is exploited (see Fig. 2). Hence, it is possible to have more dominant paths arriving at the receiver side, where each dominant path corresponds to a LOS transmission by a different antenna [17]. This technique is used to overcome fading and reach the receiver also inside buildings, guaranteeing high quality of service communications [18]. Moreover, it has to be noted that also the case of one single dominant path can correspond to NLOS as well as to LOS conditions. In fact, the single dominant path can be originated, in NLOS cases, from strong reflections and/or diffractions with obstacles (see Fig. 3). Hence, the Rakeness test is here not used for a LOS/NLOS
decision but rather to preliminary assess the best signal processing receiver strategy.
Figure 2. DVB-H equipment receiving few LOS dominant paths by multiple antenna
transmission (i.e. antenna diversity).
Figure 3. Single NLOS dominant path originated from strong reflections and/or diffractions with obstacles.
2.2 System Model Nakagami-m distributions are used to model dense scatters (few-path), while Rician distributions model fading with a single dominant path. The Nakagami-m distribution has been used extensively in the literature to model complicated fading channels. The PDF of the Nakagami-m distribution is given by [1]:
2
2 12 , 0m m r
mR
mp r r e rm
(1)

A Novel “Single-Path” vs. “Few-Path” Test Based on Higher Order Statistics to Possibly Start-Up Coherent Combining, F. Benedetto et al. / 7-19
Vol. 13, February 2015 10
where (•) is the well-known Gamma function, is the second moment (i.e. = E[r 2]) and the m parameter defines the fade depth. The value of the m parameter, also called shape factor, indicates the severity of multipath fading, and is a measure of channel quality, making its estimation necessary in many applications. The Nakagami-m distribution covers a wide range of fading conditions and, in particular, can be reduced to the Rayleigh distribution if m = 1(and
= 2 2), while it is a one sided Gaussian distribution if m = 0.5 [1]. Conventional testing methods for the presence of a pilot synchronization signal (with a given spreading code offset) distinguish between two different hypotheses: the in-sync condition (hypothesis H1), which corresponds to the case of presence of the tested code with the offset detected by the receiver’s systematic timing offset; and the out-of-sync case (hypothesis H0) which conversely states the absence of that code with the considered offset [19]. The constant false alarm rate (CFAR) criterion, often employed to perform effective tests, is adopted to determine the threshold value. The two opposite cases of acquired or mismatched code offset are often referred to as in-sync and out-of-sync conditions. These cases differ because the output of a matched filter is ideally constant in the former condition, while it randomly varies in the latter one. In fact, it is well known that the user codes employed are orthogonal only if the users are chip-synchronized with each other [20]. In practice, any pair of codes may present a relevant cross-correlation for nonzero chip offset. Such a residual correlation acts as a random variable (the codes are usually modulated by independent data streams), characterized by a noise-plus-interference variance depending on the effective time synchronization. In addition, let us consider an additive independent and identically distributed (i.i.d.) zero-mean complex Gaussian random series, say a = [a1, …, ai]T, with variance 2σ2, that affects the estimated cross-correlation sample. It accounts for both the background noise and the random interference effects of the same code with erroneous shift (self-interference) or other co-users in the same cell (multi-user interference) [19]. Because we aim to perform a testing procedure suited in the presence of a large number of interferers, the Gaussianity of the
series can be asymptotically assumed as a direct consequence of the central limit theorem. We are then assuming that the series at the output of a non-coherent correlator, matching the correct code shift, referred as Γ'=[│μ+ε'1│, …,│μ+ε'i│]T with mean μ≠ 0, is corrupted by the zero-mean complex i.i.d. Gaussian random noise '=[│ε'1│, …,│ε'i│]T with variance 2σ'2. Testing for the presence of useful signal should discriminate over the following two hypotheses operating on the observed series Γ = [│R1│, …, │Ri│]T: H1 stands for the in-sync case (i.e. presence of signal, LOS component), while H0 represents the out-of-sync case (i.e. absence of signal, NLOS propagation). The statistical distribution of the observed variable is the Rice probability density function (PDF) in the former hypothesis, while becomes the Nakagami-m PDF in the latter case. As a consequence, the hypothesis testing is equivalent to decide for the “best fitting” statistical model of the real and positive-valued observed series Γ = [│R1│, …, │Ri│]T between the Nakagami-m and the Rice cases. 2.3 The Rakeness Test Referring to the same system model of the previous Section, let us now consider for sake of notational convenience and without loss of generality in the following |Ri|= |R| and:
2 4 62 4 6, ,A E R A E R A E R (2)
Then, the fourth order of a real positive Rice random variable, ideally generated as the magnitude of a random complex Gaussian variable, depends on the second-order moment according to the following [21]
4 2 2 22 4 2 4
2 2 22 2 2 4
2 , 2
2 2
A A A A
A A A A (3)
where = E[|R|] and 2 stands for the mean value and variance, respectively, of the observed series. Now, using (3) in (2), after some algebra the sixth order moment rewrites as:
6 4 2 2 4 66 18 72 48A (4)

A Novel “Single-Path” vs. “Few-Path” Test Based on Higher Order Statistics to Possibly Start-Up Coherent Combining, F. Benedetto et al. / 7-19
Journal of Applied Research and Technology 11
Then, using (3), equation (4) can be rewritten as:
12 2 2
6 2 4 2 4
32 2 4
4 2 2
12 9
A A A A A
A A A (5)
From (5), it follows:
2 33 26 2 2 4 2 412 9 16 2A A A A A A (6)
and finally, we have the decision variable for the new test expressed as follows:
2 33 26 2 2 4 2 412 9 16 2A A A A A A (7)
We can divide each member of (7) by the variance of R and, after some algebra, we can obtain the testing variable of the normalized Rakeness test as follows:
2 33 26 2 2 4 2 4
62
12 9 16 2A A A A A AA (8)
In this way, from (8) we obtain a normalized version of the new test expressed by (7), that now avoids the evaluation of the variance of the received symbols, i.e. the test is self-tunable in respect to the power of the received signal. Hence, the estimation of (8) is our new testing variable according to the following:
2 33 26 2 2 4 2 4
62
ˆ ˆ ˆ ˆ ˆ ˆ12 9 16 2ˆ
ˆA A A A A A
A (9)
where the estimates 2A , 4A , and 6A of the second, fourth, and sixth order moments are obtained, respectively, as
22
1
44
1
66
1
1ˆ
1ˆ
1ˆ .
N
nnN
nnN
nn
A RN
A RN
A RN
(10)
Then, considering a threshold , the test is finally expressed as follows:
0
1
ˆ: , ˆ: .
H
H (11)
It means that if the testing variable is greater than the threshold value, then the algorithm decides for the hypothesis H0, otherwise the choice is for H1. 3. Performance Analysis In order to statistically quantify the estimation error we are now considering the mean value and the variance of the testing variable in (8). Let us define, for the sake of compactness and following the same approach as in [22]:
2 2 2ˆ ˆA [A ]E ,
4 4 4ˆ ˆA [A ]E ,
6 6 6ˆ ˆA [A ]E ,
as the three moment-estimation’s errors, which are assumed to be zero-mean random variables. Then, under the assumption of small errors for the high-order moment estimators ( 2 4 6
ˆ ˆ ˆA ,A ,A ), the bias and variance of the estimation error can be accordingly evaluated by a three-dimensional (3-D) reduced Taylor expansion up to the second order as follows, respectively [23]:
2 4 6 2 4 6
2 4 62 4 6
2 4 6 2
2 2
22 22 40 0
4
2
626 2 4 00
2 4
2 62 6 4 60
ˆ ˆ1 1ˆ ˆ[ ] var[A ]ˆ ˆ2 2A A
ˆ var[A ]ˆ ˆ1 1ˆ var[A ]ˆ ˆ ˆ2 2A A A
ˆ ˆ cov[A A ]ˆ ˆ1 1ˆ ˆ cov[A A ]ˆ ˆ ˆ ˆ2 2A A A A
E
4 6 0
4 6ˆ ˆ cov[A A ]
(12)

A Novel “Single-Path” vs. “Few-Path” Test Based on Higher Order Statistics to Possibly Start-Up Coherent Combining, F. Benedetto et al. / 7-19
Vol. 13, February 2015 12
2 4 6 2 4 6
2 4 6
2 4 6 2 4 6
2 4 6
2 2
22 4
0 0
2
4 66
0
2 42 40 0
2 60
ˆ ˆˆ ˆvar[ ] var[A ]ˆ ˆA A
ˆˆ ˆ var[A ] var[A ]A
ˆ ˆ ˆ ˆ cov[A A ]ˆ ˆA A
ˆ ˆ ˆ ˆA A
2 4 6
2 4 6 2 4 6
2 6
0
4 64 60 0
ˆ ˆcov[A A ]
ˆ ˆ ˆ ˆ cov[A A ]ˆ ˆA A
(13) where var[·] and cov[·] stand for variance and covariance, respectively. The partial derivatives, in (12) and (13), are given by:
4 2 22 4 2 47
22
3 3 24 2 6 2 4 6 6
ˆ 1 48 60A
96 72 90 6
A A A AA
A A A A A A A (14)
4 2 22 2 4 4 2 6
624
ˆ 24 30 48 18A
A A A A A AA (15)
32 2 4 6
626
ˆ 24 18 2A
A A A AA
(16)
2
4 2 2 32 4 2 4 48
22
3 22 6 2 4 6 6
ˆ 1 144 300 672A
288 540 42
A A A A AA
A A A A A A (17)
222 4
624
ˆ 30 96A
A AA (18)
2
626
ˆ 2A A (19)
4 2 22 2 4 2 2 6
722 4
ˆ 48 120 288 90ˆ ˆA A
A A A A A AA (20)
524 6
ˆ 18ˆ ˆA A A
(21)
32 2 4 6
722 6
ˆ 72 15 2ˆ ˆA A
A A A AA (22)
Then, let us focus in the evaluation of the expressions for the mean values, the variances and the covariances of the estimators. In particular, since E[ i] = 0 with i = 2, 4, 6, for the mean values we have:
2 22 2
4 2 2 44 4
6 4 2 2 4 46 6
ˆ[A ] 2ˆ[A ] 8 8ˆ[A ] 18 72 48
E A
E A
E A
Then, the variances of the estimators can be derived by means of the following [24]:
2 22
1 1ˆvar A [ ]i i i iE A AN N (24)
with i = 2, 4, and 6. In the same way, the covariances of the estimators can be derived according to [24]:
2 21 1ˆ ˆcov A A [ ] A A A ,
with 2, 4, 6, 2, 4, 6, and
i j i j i j i jEN N
i j i j (25)
Now, we note that to evaluate the variances in (24) and the covariances in (25), the eighth (A8), tenth (A10) and twelfth (A12) order moments need to be calculated. Recalling the system model previously described and following the same approach as before, the above mentioned high-order moments can be easily derived as follows:
(23)

A Novel “Single-Path” vs. “Few-Path” Test Based on Higher Order Statistics to Possibly Start-Up Coherent Combining, F. Benedetto et al. / 7-19
Journal of Applied Research and Technology 13
8 6 2 4 48
2 6 8
32 288
768 348
A
10 8 2 6 410
4 6 2 8 10
50 800
4800 9600 3840
A
12 10 2 8 412
6 12 4 8
2 10 12
72 1800
19200 86400 138240 46080
A
(26) Finally, the variances are now given by:
2 2 42
1ˆvar 4 4AN
6 2 4 44
2 6 8
1ˆvar 16 208
640 320
AN
10 2 8 46
6 6 4 8
2 10 12
1ˆvar 36 1332
16512 79488
131328 43776
AN
(27) While the covariances are as follows:
4 2 2 4 62 4
1ˆ ˆcov 8 48 32A AN
8 2 6 44 6
4 6 2 8
10
1ˆ ˆcov 24 576
4032 8640
3456
A AN
6 2 4 42 6
2 6 8
1ˆ ˆcov 12 180
576 288
A AN
(28) Finally, the desired expressions of (12) and (13) can be obtained as follows:
12 2 10 472 2
8 6 6 8 4 10
2 12 14
1ˆ 300 80762
77928 343872 684672
596736 170496
EN
(29)
12 210 8 2
122 2
6 4 2 8 10
768ˆvar 9 2312
2288 17280 7104
N (30)
It has to be noted that both the estimations in (29) and (30) vary with 1/N, meaning that the estimator is consistent (i.e. as N becomes larger and larger, the estimates tend to the true value). Then, the test threshold can be asymptotically tuned from a straightforward evaluation of the Gaussian integral for a fixed probability of false alarm, under the null-hypothesis [25]:
11ˆ[ ] (2 )ˆ2var[ ]
FAE erfc P (31)
where erfc-1(·) is the complementary inverse of the error function, and PFA is the false alarm probability. The probability of detection PD is determined in the H1 hypothesis as [26]:
ˆ12 ˆ2
D
EP = erfc
var (32)
Finally the probability of Miss-detection is obtained as:
ˆ11 12 ˆ2
M D
EP P = erfc
var (33)
4. Numerical Results and Discussion The parameter m of Nakagami-m statistical model is closely related with the Rician parameter K of Rician fading statistical model as follows [27]:
2
2, 1m m
K mm m m
(34)
and inverting (34) we can write the following:
21 2 , 0.1 2K Km KK (35)

A Novel “Single-Path” vs. “Few-Path” Test Based on Higher Order Statistics to Possibly Start-Up Coherent Combining, F. Benedetto et al. / 7-19
Vol. 13, February 2015 14
Now, it is interesting to underline some considerations about our innovative test, depending on the values assumed by the parameter m (or K). In particular, when m = 1 (i.e. K = 0) the distributions of Rice and Nakagami-m tilt towards the Rayleigh distribution. In fact, a value of K = 0, means that no single dominant path exists, and all the power is dispersed on the multi-path components. Then, increasing the value of m, from m = 1 to m = 4/3 (i.e. from K = 0, to K = 1) corresponds to a change in the propagation conditions (from multi-path to few-path) meaning that the distribution is well fitted by a Nakagami-m instead of a simpler Rayleigh distribution. In particular, a value of the Rician factor K = 1 means that there are few dominant paths (more than one single dominant path). Then, increasing the value of the Rician factor K, (i.e. for K >> 1) means that the propagation conditions can be considered evolving towards a strong propagation environment: a stronger single-path corresponds to the increasing of the value of K (from K = 1 to K >> 1), i.e. the power on this single dominant path is always greater that the power on all the other components. All these situations are illustrated in Fig. 4 and related with the behavior we expect from our test, in terms of PD. In fact, as we can easily see from Fig. 4, when the Rician K factor is equal to 0, the Rice, Nakagami-m and Rayleigh distributions are perfectly overlapped. Then, for 0 < K < 1, our test is expected to show better
detection performances because the channel tends to the few dominant path condition and its distribution tends to a Nakagami-m from a Rayleigh distribution. For K >> 1 the Nakagami-m distribution tends to the Rice distribution (see again Fig. 4, where the curves referring to Nakagami-m and Rice distributions are perfectly overlapped for K >> 1) and hence the performances of our test are expected to decreases in terms of detection. In particular, we expect that in this case the PD tends to the PFA since we are verifying the hypothesis H1 that is now equal to the hypothesis H0 (i.e. the searched distribution is a Rice distribution and not a Nakagami-m distribution). In conclusion, our PD is hence defined as the probability of finding a weak propagation condition (i.e. a Nakagami distribution). Several trials were performed to validate the statistical model assumptions (here derived) on the asymptotic performance of the proposed testing method. We show the performance of the system in terms of miss-detection probability, PM, for different values of practical interest of the parameter N (i.e. the number of samples) and of the Rician factor, K, here considered as a quality measure of the propagation condition strength (i.e. weak or strong propagation). Fig. 5 shows the probability of miss-detection evaluated versus the values of the number of samples for different false alarm probabilities (from 10-3 to 10-6) and with a Rician factor K = 1.
Figure 4. Discrimination between the single- and few-path propagation conditions in terms of probability distributions by the Rakeness test.

A Novel “Single-Path” vs. “Few-Path” Test Based on Higher Order Statistics to Possibly Start-Up Coherent Combining, F. Benedetto et al. / 7-19
Journal of Applied Research and Technology 15
As we can see, the behavior of the curves for different PFA is very similar, hence, in all the following results we adopt the value of PFA = 10-3, as done in the operating modes, to obtain miss-detection probabilities of practical interest. Then, in all the following results we have evaluated the miss-detection PM both in an analytic way, i.e. using equation (33), and by means of simulations. In particular, the theoretical curves have been obtained by exploiting (33), where the mean value and the variance of the testing variable are provided by (29) and (30), respectively, while (31) gives us the threshold value according to the
CFAR criterion. This means that, once we have fixed the target false alarm probability and the Rician factor, we are able to theoretical evaluate all the higher order moments of interest to be used in the theoretical expressions. Fig. 6 shows the probability of miss-detection obtained with a PFA equal to 10-3 and for different values of the Rician factor. As we can easily see from the graph, the simulation results (dots) well match the theoretical ones (solid lines) ensuring the correctness of the adopted mathematical model and assumptions of the previous Sections.
Figure 5. Theoretical (Theor.) and simulated (Sim.) results of the miss-detection (PM =1- PD) for several values of the probability of false alarm versus the number of samples.
Figure 6. Theoretical (Theor.) and simulated (Sim.) results of the miss-detection (PM =1- PD) for several values of the Rician factor (with K > 1) versus the number of samples.

A Novel “Single-Path” vs. “Few-Path” Test Based on Higher Order Statistics to Possibly Start-Up Coherent Combining, F. Benedetto et al. / 7-19
Vol. 13, February 2015 16
Then, we have focused our attention only on values of the Rician factor between 0 and 1 because, as stated in [6], for typical urban macro cellular environments with a root mean square delay spread on the order of 1 s, 1, i.e. power on the main path equal to the power of the diffusive (multi-path) components. Fig. 7 reports the probability of miss-detection obtained with a PFA equal to 10-3 and for different values of the Rician factor between 0 and 1. The best working point on the graph is represented by the best trade-off between the computational complexity of the algorithm (i.e. the values of the requested number N of samples) and the values of the probability of detection in bad cases (i.e. with low values of the Rician factor). We can see that for low values of the Rician factor, we always need a greater number of samples to obtain detection probability of practical interest. This is a consequence of the fact that, in typical urban environments, the power on the main path equals the power of the diffusive (multi-path) components. This means that the proposed test needs more samples before a correct acquisition is identified because of the dense structure of the multi-path propagation under investigation. Finally, let us now have a look about the computational complexity of the proposed technique by analyzing the required number of performed operations, in terms of real sums and
multiplications. In particular, let us focus on the evaluation of the three higher order moments in (2), while the further evaluation of (9) and (11) represents a negligible increasing of the system computational complexity. The overall number of operations required to perform the moments’ estimations in (10) is represented by (see Tab. 1) 3•N real sums and 10•N real multiplications. This means that our method improves the system acquisition performances with a small increasing of the system computation complexity. For the sake of the compactness, in Tab. 1 we have reported only the number of real products and sums, assuming that: --in sequential implementation, the time of one complex product is the same as four real products and two real sums, whereas the time of one complex sum time is equivalent to two real sums; –-in parallel implementation, the time of one complex product is the same as one real product and one real sum, whereas the time of one complex sum time is equivalent to one real sum However, it is opinion of the authors that the implementation of the proposed technique is going to be feasible on a mobile device as the mobile receiver, in a short time, will host large processing capabilities because of the monotonically decreasing cost of very large-scale integration as well as the ever increasing running speed.
Figure 7. Theoretical (Theor.) and simulated (Sim.) results of the miss-detection (PM =1- PD) for several values of the Rician factor (with K > 1) versus the number of samples.

A Novel “Single-Path” vs. “Few-Path” Test Based on Higher Order Statistics to Possibly Start-Up Coherent Combining, F. Benedetto et al. / 7-19
Journal of Applied Research and Technology 17
Sequential processing
Parallel processing
# real sums 3•N N
# real products 10•N N
Table 1. Operations required by the Rakeness test.
As a final conclusion, it has to be noted that, even if the Rake should always be used, since its hardware is already ready, this is not always the best receiving strategy. In [28], it is shown that the advantages and disadvantages of a rake receiver, as compared with a simpler 1-D correlation receiver, depend greatly on the fading characteristics of the individual multipath components. In general, rake receivers are more appropriate for direct sequence (DS) systems with a smaller number of chips per data symbol and for channels that have only diffuse, Rayleigh fading multipath components. On the other hand, a correlation receiver is preferred for DS systems with a large number of chips per data symbol if the channel has a strong specular multipath component in addition to one or more diffuse components. Moreover, in wideband CDMA applications, the number of available correlators will limit the number of multi-paths that can be utilized in a typical rake combiner [9]. In fact, if the signal at the receiver can be resolved into several components, a decision must be made as to which components, and how many, the rake receiver should attempt to capture [28]. One approach is to collect the greatest passible amount of energy by using the same number of tap as the number of signal components that can be resolved, up to the limit of the number of taps available. If square-law combining is employed, it cannot be stated a priori that this approach gives the best performance. The optimal detection of multipath components to be combined depends on the characteristics of the multipath channel; in particular, the inclusion of additional components does not necessarily improve performance [28]. In addition, even if the use of extra taps improves performance, the performance gains may not justify the required increase in receiver complexity. In conclusion, the benefit of employing multiple taps in a rake receiver depends upon the characteristics of the channels that will be encountered by the system. For a low chip rate the use of multiple taps is beneficial with many channel containing strong
specular components. In contrast, the correlation receiver may be the best choice for use with a high chip rate if the channel has a significant specular component, even if less than one-half of the energy is in that component. Hence, discriminating between a weak or strong propagation case would be very relevant in order to adopt the optimal receiving strategy, regardless of the required computational complexity. 5. Conclusions An innovative Ricianity strength test for few-single-dominant-path discrimination of (weak/strong) wireless mobile channels was here presented, to possibly start-up coherent combining. The decision between Rice and non-Rice (e.g. Nakagami-m) distributions is made exploiting higher order statistics of the series under investigation. Then, mathematical expressions for the bias and variance of the new testing variable are derived, by a 3-D reduced Taylor’s expansion up to the second order. The theoretical results substantiated by computer simulations have evidenced the robustness of this innovative test, to discriminate the best signal processing receiving strategy. In fact, different strategies could be employed at the receiver’s side: conventional 1-D systems in the case of strong or single-path propagation (i.e. Rician distributions) or 2-D (Rake) receivers in the case of weak or few-path propagation (i.e. non-Rice distributions).
A Novel “Single-Path” vs. “Few-Path” Test Based on Higher Order Statistics to Possibly Start-Up Coherent Combining, F. Benedetto et al. / 7-19
Vol. 13, February 2015 18
References [1]-A. Molisch, Channel Models, in Wireless Communications, pp. 125 – 143, 2011. [2] S. Draganov et al., “Synthetic aperture navigation in multipath environments”, IEEE Wireless Commun., vol. 18, no. 2, pp. 52 – 58, 2011. [3]-D. Hill, “Indoor Wireless Propagation”, in Electromagnetic Fields in Cavities: Deterministic and Statistical Theories, pp. 203 – 230, 2009. [4] F. Tsai et al., “A positioning scheme combining location tracking with vision assisting for wireless sensor networks”, J. of Applied Research and Techn. (JART), vol. 11, no. 2, pp. 292-300, 2013. [5] G. Sun et al., “Signal processing techniques in network-aided positioning”, IEEE Sign. Proc. Mag., vol. 22, issue 4, pp. 12-23, July 2005. [6] W. Xu, et al., “Non-line-of-sight identification via phase difference statistics across two-antenna elements”, IET Commun., vol.5, no. 13, pp. 1814 – 1822, 2011. [7] F. Benedetto et al., "Dynamic LOS/NLOS Statistical Discrimination of Wireless Mobile Channels ", in Proc. of the 2007 IEEE 65th Vehicular Technology Conf. VTC2007 Spring, 23-25 Apr. 2007. [8] V. M. Vergara and S. E. Barbin, “LOS and NLOS capacity components in MIMO Rice fading channels”, in Proc. of the 2010 Asia-Pacific Proc. of Microwave Conf., pp. 1589 – 1592, 2010. [9] A. Annamalai et al., “Analysis of Generalized Selection Diversity Systems in Wireless Channels”, IEEE Trans. on Vehic. Techn., vol. 55, no. 6, pp. 1765 – 1775, 2006. [10] J. MinChul et al., “Opportunistic Source/Destination Cooperation in Cooperative Diversity Networks”, IEEE Trans. on Wireless Commun., vol. 9, no. 12, pp. 3822 – 3837, 2010. [11] A.E.-S. El-Mahdy, “Adaptive generalised selection-combining receiver over time-varying mobile communication channel”, IET Sign. Proc., vol. 6, no. 1, pp. 64–71, 2012. [12] F. Benedetto et al., “A Rakeness Test for Coherent Signal Combining in Mobile Receivers”, in Proc. of the 2013 36th Int. Conf. on Telecommunications and Signal Processing (TSP), pp. 47-51, July 2013.
[13] F. Benedetto et al., “LOS/NLOS detection by the normalized Rayleigh-ness test”, in Proc. of the 17th European Signal Processing Conference, EUSIPCO 2009, Glasgow (Scotland), 2009. [14] K. Yu and Y. J. Guo, “Statistical NLOS Identification Based on AOA, TOA, and Signal Strength”, IEEE Trans. on Vehic, Techn., vol. 58, no. 1, pp. 274 – 286, 2009. [15] J. Yan et al., “Non-Line-of-Sight Identification for Indoor Positioning Using Ultra-WideBand Radio Signals”, Navigation, vol. 60, no. 2, pp 97–111, 2013. [16] R. Tamayo-Fernández et al., “An architecture for design and planning of mobile television networks”, J. of Applied Research and Techn. (JART), vol. 9, no. 3, pp. 277-290, 2011. [17] J. Penttinen et al., “The DVB-H Handbook: The Functioning and Planning of Mobile TV”, Wiley-Blackwell, 2009. [18] C.-H. Hsu and M. Hefeeda, “Flexible Broadcasting of Scalable VideoStreams to Heterogeneous Mobile Devices”, IEEE Trans. on Mobile Computing, vol. 10, no. 3, pp. 406-418, March 2011. [19] F. Babich and G. Lombardi, “Statistical analysis and characterization of the indoor propagation channel”, IEEE Trans. on Commun., vol. 48, no. 3, pp. 455 – 464, 2000. [20] F. Benedetto et al., “A Blind Equalization Algorithm Based on Minimization of Normalized Variance for DS/CDMA Communications”, IEEE Trans. on Vehic. Techn., vol. 57, no. 6, pp. 3453-3461, Nov. 2008. [21] G. Giunta and L. Vandendorpe, “A ‘Rayleigh-ness’ Test for DS/SS Code Acquisition”, IEEE Trans. on Commun., vol. 51, no. 9, pp.1492-1501, Sept. 2003. [22] G. Giunta, “Fine Estimators of Two-Dimensional Parameters and Application to Spatial Shift Estimation”, IEEE Trans. Signal Proc.,vol.47, no.12, pp. 3201-3207, 1999. [23] F. Benedetto and G. Giunta, “A self-synchronizing method for asynchronous code acquisition in band-limited spread spectrum communications”, IEEE Trans. on Commun., vol. 57, no. 8, pp. 2410-2419, 2009. [24] F. Benedetto et al., “Effective Monitoring of Freeloading User in the Presence of Active User in Cognitive Radio Networks”, IEEE Trans. on Vehic. Techn., in press, 2013.

A Novel “Single-Path” vs. “Few-Path” Test Based on Higher Order Statistics to Possibly Start-Up Coherent Combining, F. Benedetto et al. / 7-19
Journal of Applied Research and Technology 19
[25] E. Guzzon et al., “A New Test for Initial Code Acquisition of Correlated Cells, IEEE Trans. on Vehic. Techn., vol. 62, no. 5, pp. 2349-2358, 2013. [26] F. Benedetto et al., “A Fast Unambiguous Acquisition algorithm for BOC-Modulated Signals”, IEEE Trans. on Vehic. Techn., vol. 62, no. 3, pp. 1350-1355, 2013. [27] M. Nakagami, "The m-Distribution, a general formula of intensity of rapid fading", in William C. Hoffman, editor, Statistical Methods in Radio Wave Propagation, pp 3-36. Pergamon Press, June 18-20, 1958. [28] D. L. Noneaker, M. B. Pursley, “Rake reception for a CDMA mobile communication system with multipath fading”, in Proc. of the IEEE 3rd Int. Symp. on Spread Spectrum Techniques and Applications, vol. 1, pp. 98-104, 1994.