A Novel of Approach for the Identification of Lipid … The author is deeply indebted to Prof....
172
Instructions for use Title A Novel of Approach for the Identification of Lipid Molecular Species : Application of High Performance Liquid Chromatography on Fish Muscle Lecithin Molecular Species Analysis Author(s) Koretaro, Takahashi Issue Date 1984-12-25 Doc URL http://hdl.handle.net/2115/42778 Type theses (doctoral) Additional Information There are other files related to this item in HUSCAP. Check the above URL. File Information takahashi_thesis.pdf Hokkaido University Collection of Scholarly and Academic Papers : HUSCAP
Transcript of A Novel of Approach for the Identification of Lipid … The author is deeply indebted to Prof....

Instructions for use
Title A Novel of Approach for the Identification of Lipid Molecular Species : Application of High Performance LiquidChromatography on Fish Muscle Lecithin Molecular Species Analysis
Author(s) Koretaro, Takahashi
Issue Date 1984-12-25
Doc URL http://hdl.handle.net/2115/42778
Type theses (doctoral)
Additional Information There are other files related to this item in HUSCAP. Check the above URL.
File Information takahashi_thesis.pdf
Hokkaido University Collection of Scholarly and Academic Papers : HUSCAP

A NOVEL
OF
App1ication of
on Ftsh Muscle
APPROACH FOR THE IDENTIFICATION
LIPID MOLECULAR SPECIES
Htgh Performance Liquid ChromatogrGphy
Lecithtn Molecular Species Analysis
KORETARO TAKAHASHI
1984

ACKNOWLEDGMENTS
The author is deeply indebted to Prof. K'o'ichi Zarna under
whese •supervision this investigation was conducted. His ideas
and advices throughout the study were invaluable.
The useful suggestions of Prof. T6ru Takagi in preparation
of this manuscript are greatly appreciated.
As'sociate Prof. Mutsuo Hatano kindly accepted the reviewer,
Sincere gratitude to Associate Prof. Ko-zo- Takama for guiding
and for drawing the authors attention to this problem. ' This work would not have been possible without the help
of Mr. Tsugihiko Hirano.
The author was favored to have the assistance of Mr.
Hideaki Ebina.
Mr. Makoto Egi did the computer programming.
Thanks are due to Dr. Masahiko Kunimoto and to Mr. Seiichi 'Ando for the encouragement.
ii

CONTENTS
ACKNOWLEDGIbC[ENTS •••••••••••••••••••e•••••••••••••e•••••••
NOMENCLATURE AND ABBREVrATIONS ..........................
GENERAL INTRODUCTION .................................... 'CHAPTER I. rDENTTFrCATrON OF LECrTH:N MOLECULAR S'PECZES ON REVERSED-PHASE HIGH PERFORIY[ANCE LrQUrD CHROMATOGRAPHY: A New Coneept that Helps the Molecular Species Determination .......
Section 1. Experimental ............................
Seetion 2. Results .................................
Section 3. Discussion ..............................
CHAPTER !I. A NOVEL APPROACH FOR THE TDENTrFrCATTON OF TRTGLYCERrDE MOLECULAR SPECIES ON REVERSED- PHASE HZGH PERFORb,VNNCE L!QUZD CHROMATOGRAPHY
Seetion 1. Experimental ............................
Section 2. Results .................................
Seetion 3. 'Discussion .................e.....v..e.•
LECITH!N MOLECULAR SPECTES TDENTTFrCATTON •CHAPTER TZr. PROGRAM'FOR THE PERSONAL COMPUTER .........
Section 1.
Section 2.
CHAPTER ZV.
Section 1.
Section 2.
Section 3.
Section 4.
CHAPTER V.
REFERENCES ee
.
.
.
o
.
.
.
.
.
.
e+
Lecithin Molecular Speeies Tdentification Program Version r. ....•.........••••.e...
Lecithin Moleeular Species rdentification Program Version Ir. ......................
MOLECULAR SPECIES OF FrSH MUSCLE LECITHZN ..
Experimental ................e...•........
Characteristics of Muscle Lecithin of Fish ....."••••....•••...•.""'''''"''' Principal Component Analysis of Fish Muscle Lecithin ..........................
Changes in Fish Muscle Lecithin of Chum Salmon during Migration .............
GENERAL SUMMARY AND CONCLUSrONS ............
eeeeeeeee-e-e-oe-ott----eeeeee' --e--eee--e-e-e
PLegie
ii
. IV
1
5
5
11
27
32
34
36
43
54
54
56
63
63
66
107
130
152
lsg
iii

NOMENCLATUREANDABBREVrATIONS
22:6
GLCHPLCJIc
:!
kE,
29
TFGFA
::T
8:
::N
X2,,
faeA
.it(-C•
DM
WM
PCAACC.
represents a fatty aeid with a chain lengthcarbon atoms with six double bonds Gas liquid chromatography High perÅíormance liquid chromatography Thin layer ehromatography Phospholipid Lecithin, Phosphatidylcholine Phosphatidylserine Phosphatidylethanolamine Non phospholipid Diglyceride Sterol Free fatty acid Triglyceride Molecular species Relative retention time Total acyl carbon number Number of total double bonds Partition number Equivalent carbon number Effective carbon nurnber Acyl group
Glycerol residue
a belongs to A Chemical potential Dark muscle White muscle Principal component analysis % AccuTnulative value of the eontributiOn.
of 22
iv

1
GENERAL rNTRODUCT!ON
Analytical techniques or instruments have been developed
for fatty acid analysis. Resultingly, many knowledge has
been achieved on the study of fatty aeid snalysis.
In contrast to this, the study of molecular species, 'namely, the study of the intact or unmodified lipid is still
away behind of development. This might be due to the limited
and time consuming conventional techniques represented by
silver nitrate impregnated thin layer chromatography (Ag+
-TLC) followed by gas liquid chromatographic analysis (GLC),
(••such exsmples are too numerous to mention ). Generally
speeking, Ag+ -TLC can separate only up to heptaene. And GLC
can analyze qu'antitatively only up to 700•v800 molecular
weight. If the sample contains highly unsaturated fatty acids
such as 20:4, 20:5 or 22:6, the degree of unsaturation will
drastically increase and exceeds the analytical limit of the
Ag"-TLC.
Fats and oils from marine sources are rich in highly
unsaturated fatty acidsi Accordingly, it is almost impossible
to analyze the molecular species from these sources by the 1)conventional method. ' ' High performance liquid chromatograph has become the
most expected instrument in separating the nonvolatile or
high molecular weight compound. Since there are significant
amount of triglycerides in marine lipid that exceed the 'molecular weight of 800 which is the limit of GLC, the
utilization of high performance liquid chromatography (HPLC)
is expected to separate the molecular species of lipids from

2
these sources. The reversed-phase type HpLc2"V4)is becoming the
main analytical type in separating the most analogouscompounds?) The earlier workers in this field tried to
characterize the chromatographic rules such ss partition 8) 6,7) or effective carbon number (EC) which arenumber (PN)
defined as PN=CN--2•DB and EC=CN-DB, respectively, in the
elution of trigiyceride or lecithin molecular species. CN is
the total acyl carbon number and DB is the total double bonds
in the molecule. This empirical equatÅ}ons were useful in
predicting the approximate retention value ( in practical
cases, retention time or retention volume ) though these
equations lacked the theoritical background. In the same 9,10)year, Plattner et al. has proposed equivalent carbon number
(ECN) which is' the same concept with PN. And recently, in
accordance with the improvement of separation on HPLC,
theoritical carbon number (TCN) has been proposed by Perkins 11) rn 1982, the generalized form of ECN (or PN) and ECet al. 12)has been presented by Compton et al. that can be written as
Iu=Is-CDb, where !s is the carbon number of the standard
alkane, Db is the total double bonds in the molecule and Iu
is the index observed for unsaturated triglyceride and
phospholipid molecular species by the coefficient of C.
In this study, the forrnulae that control the sequence of
elution of lipid molecular species on reversed-phase HPLC
are proposed. The theoritical aspect of the presented
formulae has been discussed in relation to ECN (or PN). And
it is demonstrated that the formulae proposed in this study
might be invariant rules.
Lecithin (phosphatidylcholine) were analyzed by HPLC

3
from various sources including those from fish muscle. Though
there are some reports concerning the phospholipid molecular 13i-2O) t . the studyspecies analysis by HPLC from land sources
done by the author might be the only example that have worked 'on the phospholipid molecular species enalysis on HPLC from
fish lipid except the conventional way of analysis based on
the probability simulation done by Oshima et al. , ' rn chapter r, it is demonstrated that the modification
of lecithin into diglyceride acetate via diglyceride is 'necessary for the reversed-phase type HPLC analysis in order
to have a sufficient separation between the critical pairs
that have the same ECN, PN or EC. And a new matrix model is
proposed instead of the ECN, PN or EC concept.
rn chapter rl, the proposed matrix model that exhibits
the chromatographic rules of diacyl type molecular species is
developed into the rules for triacyl type molecular species
such as triglycerides. And the physicochemical background, as
well as the theoritical relationship between the ECN (or PN)
and the new matrix model, is demonstrated.
Xn chapter :rr, the lipid molecular species 'identification software.is destgnated for the personal
computer. The accumuiated data were fully utilized for the
actual identification since the equation that regulates the
sequence of molecular species inevitably contains errors due
to the deviation of relative retention time (RRT) on HPLC.
In chapter !V, characteristics of several kinds of fish 'including cartilaginous fish, as well as fresh water fish,
are discussed from the view point of muscle lecithin. ' Zn the final chapter, summary and conclusion of this

4
work •is described with a few supplemental discussion.

5
CHAPTER r
:DENTIFrCATION OF LECrTHIN MOLECULAR SPECIES ON
REVERSED-PHASE HIGH PERFORMANCE LIQU!D
CHROMATOGRAPHY
A New Concept that Helps the Molecular
Species Determination
A satisfactory separation of lecithin molecular species
from natntal sourees including those from marine sources was
msde by modifying the lecithin into diglyceride acetate for
'HPLC analysis.
Tn this chapter, the neeessity of modificstion of
lecithin into diglyceride acetate through the hydrolysis by
phospholipase C and the subsequent acetylation by acetic
anhydride are discussed. And also the discovery of a new
empirical equation instead of the former ECN or PN for the '
identification of molecular species of lecithin is discussed.
Section 1. ExperÅ}mental
:P!l!.s22A.!:AS2,gg-g21-Lgg!,!ib2,!!ti fLthi
Total lipids were obtained from the fish muscle
tabulated in Table r-1, according to the method of Bligh &
Dyer. Soybean lecithin was purchased from Wako Pure Chemical
rndustries, Ltd., Osaka, and egg yolk lecithin was kindly
supplied by Asahi Chemical Industry Ltd., Tokyo. These total
lipid and crude lecithin were subjected to a column
chromatography which has been successfully done by Lands etal.2 ,6) namely, aliquot amount of total lipid was dissolved

Tab
le I
-- 1
.F
ish
exam
ined
Spe
cies
Mea
nbo
dy le
ngth
and
wei
gh.t
Loca
lity
ofca
tch
Dat
eof
cat
chC
hum
sal
mon
(S
umm
er)*
65cm
, 3.5
kg, (
1)**
The
offi
ng o
f
H
okka
ido
Akk
eshi
,Ju
ne19
80
Chu
m s
alm
on (
Fal
1)*
Qm
mnc
tBLs
!kss
!Lgt
Big
-eye
d tu
na
thun
nus
obes
usA
lask
a po
llack
ITLg
guep
a-ha
raua
hl
72cm
, 4.5
kg, (
1)
110c
m, 2
0kg,
(1)
Car
p
44cm
, 61O
g,
23cm
, 175
g,
(10)
(5)
The
Moh
eji
Hok
katd
oP
urch
ased
Mar
ket.
Ri•v
er,
from
The
Uch
iura
Hok
kaid
o
Cu1
ture
d
the
Bay
,
Nov
. 198
1
Dec
.
sep
1981
. 198
0pm
t sgg
!r:R
2.s2
1
* M
ale.
** N
os. o
f ind
ivid
ual
used
.
pt

into double volume of diethyl ether/ethanol ( 9:1, v/v ) and
then applied to the silica gel column. And elutions were done
through diethyl etherlethanol ( 9:1, v/v ), diethyl ether/
ethanol ( 1:1, vlv ), ethanollrnethano.1 ( 9:1, v!v ) and
finally by 100Z methanol. The 100Z methanol fraction was
collected with a fraction collecter, monitored by TLC, and
lecithin of more than 95Z purity was collected.
Purification of Di 1 ceride Acetate from Lecithin
Pure lecithin was hydrolyzed with phospholipase C
( Clostridium perfringence, P-•L Biochernical :nc.,Milwaukii ), according to the method of Renkonei.7) :t was
done in the following manner. First, 50 to 100 mg of lecithin
was dissolved in 10 to 15 ml of diethyl ether. Then, 10 to
IS ml of 1 molar Tris buffer (pH 7.3) including calcium
chloride with 5 mg of phospholipase C was added to the ether
solution. The head space gas of the container was filled with
nitrogen gas and the hydrolysis of lecithin was continued
for four hours under room temperature. The hydrolysate was
washed several times with water and diglyceride was purified
by s preparative TLC from this hydrolysate. The developing
solvent was n-hexane/diethyl ether ( 1:1, v/v ).
Acetylation was performed by adding an appropriate
amount of acetic anhydride to the solution of diglyceride in
pyridine, and by standing it for 12 hours at roomtemperature28.)The resulting diglyceride acetates were purified
by the method of preparative TLC by using the solvent
n--hexane ldiethyl ether ( 75:25, v/v ). Finally, they were
filtered through a O.457eLtype FP-45 Fluoropore filter
( Sumitomo Electric !ndustry, Ltd., Osaka ) and subjected to
7

8
HPLC.
HPLC Fractionation of the Molecular S ecies of
Diglyceride Acetate Derived from Lecithin
The diglyceride acetates were fractionated into major 'molecular species on twin 8x2SO mm LiChrosorb RP-18 ( Merck,
West Germany ) co:umns which vere connected in series. A
Hitachi Liquid Chromatograph Model 638--50 ( Hitachi Ltd.,
Tokyo ) equipped with a Shodex R: detector Model SE-11
( Showa Denko Ltd., Tokyo ) was used. The eluting solvent
used was isopropanol!acetone/methsnollacetonitrile ( 1:1:3:4,
v/v ). Diglyceride acetates were dissolved into five volumes
of tetrahydrofuran, and 25/tLl of these solutions were
applied to the column under room temperature ( lower the
better ) and qt a fiew rate of 1.5 ml!min.
Identification of Molecular S ecies of Each Peak
on HPLC . Peaks on HPLC chromatograms were numbered in sequence of
elution. The fatty acid composition of each collected
predominant peak was analyzed by gas chromatography. The
analytical conditions for fatty acids were as follows:
Gas chromatograph: Hitachi 063, Column: Unisole 3000
( Gasukuro K6gy6 Ltd., Tokyo ), Glass column O.2x200 cm,
Column temp.: 220eC, Detector: F:D, Detector temp.: 250"C,
Xnjeetion temp.: 280"C, Cerrier gas: Ns, Flew rate: 20 ml
Methyl esters of fatty acids were prepared according to
the method of Christopher and Glass described by Prevot andMofdret2.9) An aiiquot amount ( less than 2o mg ) of lipid was
dissolved in 1 ml n-hexane and O.2 ml of methanolic 2N--NaOH

9
solution was added. After shaking this mixture, it was stand
for 20 seconds under 500C and then O.2 ml of methanolic '2N-•HCI solution was added. The n-hexane layer was collected
and then concentrated. Methyl esters prepared as described
above were subjected to a GLC.
The small peaks which have critical pairs were first 'subjected to Ag"-TLC. The developing solvent used was 30)benzene1diethyl ether ( 4:1, v/v ). The band obtained by Ag'
-TLC were then eluted with diethyl ether containing
dotriacontane 'which was used as •an internal standard, and
then applied to fatty scid anslysis and total acyl carbon
number analysis. The analytical conditions for total acyl
csrbon number analysis were as follows:
Gas chromatograph: Hitachi 063, Column: OV-101
( Gasukuro K6gy6 Ltd., Tokyo ), Steel column O.3x50 cm,
Column temp.: 300.v330eC, programed as 1"C/min, Detector: F:D,
Detector temp.: 340eC, :njection temp.: 345'C, Carrier gas: 'Na, Flow rate: 60 ml/min.
H drol sis of Di 1 ceride Acetate Derived from Lecithin 2bz-tea.g!:.gg!i.iLsi-b!:l.2A.E9P tiLi
Fraction of the molecular species of
and 22:6 in position 2, that is, (16:O)(22
by HPLC. This lipid ( less than 5 mg ) was
shaking vigorously in a mixture of 1 rnolar
pH 8 (lml), 2.2Z calcium chloride (O.1 ml)
taurochorate (O.25.ml) at,40eC for 1 min.
pancreatic lipase ( Calbiochem, San Diego,
added to the mixture and the reaction was
min at 40eC by shaking it vigorously. The
16:O in position 1
:6) was collected
then suspended by
Tris-HCI buffer,
, and O.05Z sodium
Then, 40 mg of
Calif. 92112 ) was
processed for 4
reaction was

10
stopped by adding 1 ml of ethanol and 1 ml of
hydrolysate was extract•ed with diethyl ether
using a preparative TLC with n-hexane/diethyl
acid ( 40:10:1, v/v ) as developing solvent.
were the modified form of the experiment donea13.1)
6N-HCI. The
and purified by
ether/formic
These procedures
by Kosugi et

11
Section 2. Results
Figure r-1 shows the comparison of separation on HPLC by
the differences in the molecular form which has the same
acyl combination. Examples here are of soybean lecithin: 'A : Intact lecithin,
Developing solvent: methanol/water ( 95:S, vlv )
methanol 100, gradient, UV detector.
B : 1,2-Diglyceride i.e. the hydrelysate of lecithin,
Developing solvent: methanollwater ( 9S:S, v/v )
methanol 100, gradient, UV detector.
C : 1,2-Diglyceride acetate derived from lecithin,
Developing solvent: methanol/water ( 97:3, v!v )
methanol 100, gradient, UV detector.
D : 1,2-Diglyceride acetate derived from lecithin,
Developing solvent: isopropanollacetone/methanoll
acetonitrile ( 1:1:3:4, v/v ), R: detector.
As it is clear from this figure, the acetate form is the
best in separation on HPLC followed by diglyceride. The
intact lecithin is the worst among these three. It is
considered that the very high polarity of phosphorylchorine
group interferes with the interactions between the acyl
groups and the stationary phase of HPLC. Although the
polarity of hydroxy group is not so high as those of
phosphorylcholine, this group also interferes with the
interactions between the acyl groups and the stationary
phase, resulting on the poor separation on HPLC as shown in
chromatograms A and B. The combination of four solvent$ are
better than that of two solvents for the elution of

Fig
.Z
•-1.
A
c
Com
paris
onof
sep
arat
ion
D
on H
PLC
by
A
B
pc
1,2-
DG
der
ived
fror
a P
C m
etha
nol/w
ater
(95
:5, v
lv).
met
hano
l 100
Line
ar G
radi
ent 9
0 m
in
c
1,2
-DG
ace
tate
der
ived
from
PC
met
hano
l/wat
er (
97:3
, vlv
)Am
etha
nol 1
00
Li
near
Gra
dien
t 60
min
i,2-
DG
ace
tate
D d
eriv
ed fr
om p
c '
iso
prop
anol
lace
tone
!met
hano
l/ace
toni
tri1
e
(1:1
:3:4
, v!v
), ls
ocra
tic
A
, B, C
: D
etec
ted
by U
V d
etec
tor,
215
nm
D
: D
etec
ted
by R
I det
ecto
r, 2
00C
'
the
diffe
renc
es in
the
mol
ecul
ar fo
rrn.
'.

Fig.
li'
i• l t,tu-tltte ,` li: l''lt--'t l.l :ltIitilltttiI!̀ifr;"t-!Li• lli:11i •;•
ipa2
ll
llg i 1l i•
lii314
i#i
ki
lli
Ie
i•
l'
lg
l't
1.l
i
sl•
i't
;
,1-
ti
i
s
f
5
I
ll
'
il#
};,
1,
1
ii
Rxi'I'
,Ltl
u'k,
•i
Sequence
F=: Nunber of doubleDeveloping solvent:
r-•2. Ag+-TLC of
soybean lecithin
e+
l•
e
l
a
1llilIi'
ei ; ,
: ' ! l 1•
9i
on
A
,"
ll
Si
l :.
i i t i'
F
l 5 l t,i, i, g, :. 518 6 11
HPLC
il'ifisl1
tl
i;l
l
5
llll
l•
I•
•l
' l 111l iil
6 7i8 i12 Iiof elution -----i
bonds. benzenldiethyl ether
diglyceride acetate separated by HPLC.
•e,
13
{'i
Ii,
ili•
Iei
l
} FQ •-• 1
F 2•-4
F 4,v
(4:1
derived
, v/v)
frorn
13

14
A
20 4e 60 ea 1oo min
20 40 co eo 1oo
Fig. Z-3
egg
. HPLC chromatograms yolk lecithin. A: Soybean. B:
of soybean
Egg yolk.
and

15
c
20
3421
oo
D
co 1oo min
-ie.Lit--{:,-.ueo zoo ioo.,
I: Molecular species composed of highly unsaturated fatty acids such as (20:5)(20:5), (20:5)(22:6) and (22:6)(22:6).
!II: Molecular species composed of generally found fatty acids such as 16:O or 18:1 with combinations of 20:5 or 22:6, that is,, (16:O)(20:5), (16:O)(22:6), (18:1)(20:5) and (18:1)(22:6).
Il & TV: Others.
Fig. r-4. HPLC chromatograms ofC: Captured in summer.
chum D:
salmon muscle lecithin.Captured in fall.

16
1
roeacontn
oeoeaminGvaeoearnin
Fig. :-5.
and HPLC ehrornatogramsearp rnuscle lecithinE: Big•-eyed tuna.
of
.
F:
big-eyed tuna
Alaska pollack
, Alaska pollack
. G: Carp.
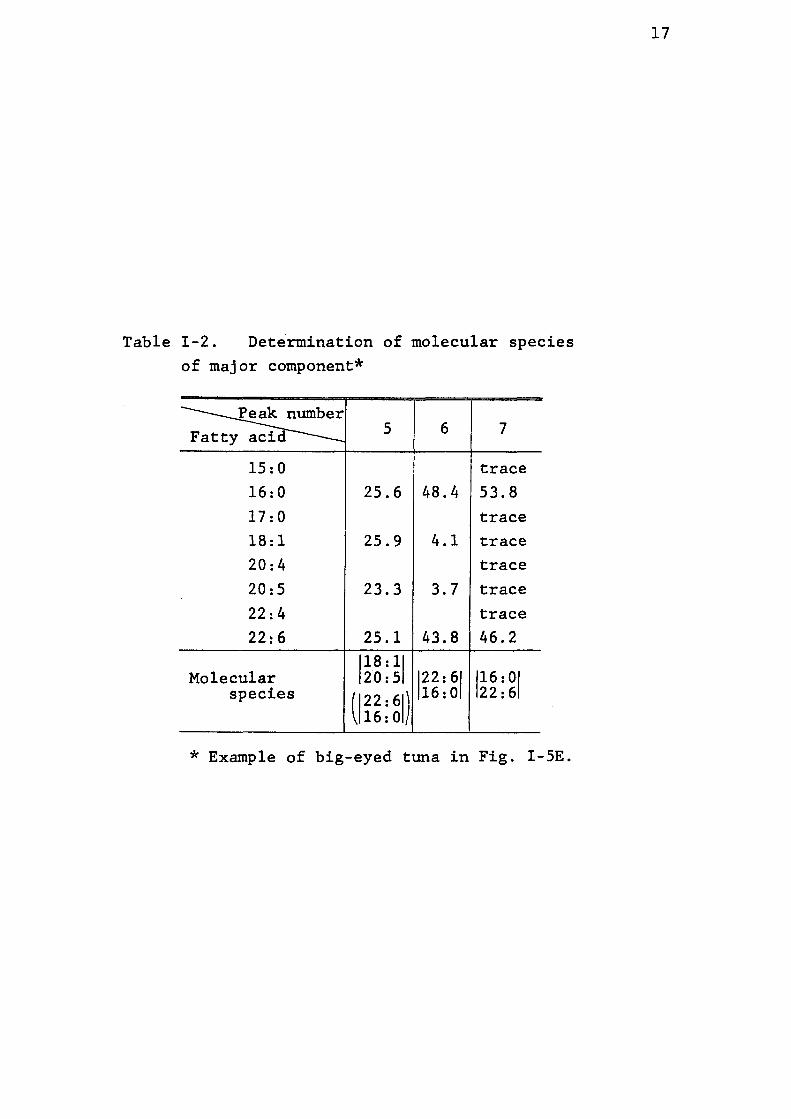
Tab1e Z-2of
. Determinationmajor eomponent*
of molecular .speczes
PeaknumberFattyacid 5 6 7
15:O trace16:O 25.6 48.4 53.817:O trace18,1 25.9 4.1 trace20:4 trace20:5 23.3 3.7 trace22:4 trace22:6 25.1 43.8 46.2
18:1Molecular 20:5 22:6 16:O
species 22:6 l6:O 22:616:O
* Example of big-eyed tuna in Fig. Z-5E.
17

18
diglyceride acetate as shown in chromatograms C and D. For
the diglyceride acetate analysis, this isocratic condition
was used throughout the experiment.
Figure r-2 shows the Ag+-TLC chromatograms of the
collected frsctions on HPLC. rt is numbered in sequence of
elutio'n. This is an example of diglyceride scetate from
soybean lecithin. As seen in this chromstogram, this type of
column packing i.e. the reversed phase column elutes the
polyunsaturated types first followed by tri, di, mono and
finally saturated types. This is the basic characteristics of
this type of column.
Figures I-3•v5 show chromatograms of diglyceride acetates.
derived from several kinds of lecithin sources on HPLC.
Chromatography was regularly completed in about two hours.
The diglyceride composStion of each predominant peak
collected was easily determined by fatty acid analysis, as
shown in Table r-2. This table shows the results on big-eyed
tuna lecithin as an example. Peak nurnber 7 in Fig. I-5E is
obviously sscribed to the diglyceride acetate composed of
16:O and 22:6. It is considered that 22:6 is bound in
position 2 of the molecule since this peak is the most
predominant, and it is said that highly unsaturated fatty
acids such as 20:5 or 22:6 are usually dominantly bound in 1 ,32'u36)position 2. In addition, after pancreatic lipase
hydrolysis, only a trace amount of 22:6 was detected in the
free fatty acid fraction ( this fraction represents the fatty
acid in pesition 1 ), although more than 70% of the lipid
was hydrolized ( determined by a densitometric method ). Peak
number 6 has the same combination as that in peak number 7,

Tab
leZ
-3.
Det
erm
inat
ion
of1e
cith
inm
o1ec
u1ar
spec
ies
of m
inor
com
pone
nt*
eakn
umbe
rF
atty
acid
12
34'
s6
l4:O
21.3
30.6
34.6
446
16:1
53.0
47.7
28.3
19.0
19.6
.9Z
20:5
22:6
47.0
52.3
50.4
36.2 .2
IS.6
30.2
37
.8.3
.9
Car
bonn
umbe
rtik
*'
.
3442
.663
.332
.2IO
836 38
95,<
90.0
10.0
.4S
.7'
31.0
41.7
26.1
89..2
Car
bonn
umbe
r*V
c34
20:5
14:O
l42.
,14
:O20
:563
.3l8
i.g32
.,l1
4:O
20:5P
O.8
36i2
i.{lg
s.<
16:•
190.
020:
S16
:120
:557
.416
:120
:S5'
.722
:641
.714
:llg
•l289
.2
3822
:616
:131
.0lg
i.g26
.i
in r
elat
ive
* E
xam
ple
of
7o -chu
m s
alrn
Qn
(Fal
l)>
'clc
Tot
alac
ylca
rbon
num
ber
H o

20
whereas (18:1)(20:5) is considered as contaminants of peak
number 5. Nevertheless in this case, 22:6 is considered to be
bound in position 1 in the molecule. Peak number 5 has an 'almost even amount of fatty acids of 16:O, 18:1, 20:5 and
22:6. Among these fatty acids, 16:O as well as 22:6 are
regarded as contantnants from peak number 6, considerin' g that
peak number 6 is larger than peak number 5. It iss concluded
that peak number 5 is the combSnation of 18:1 and 20:5.
Molecular species from other biological sources were alsQ
determined in the same manner. The small peaks which have
critical pairs were first subjected to Ag'-TLC and separated
according to their degree of unsaturation. In most of the
small peaks in the first half of the HPLC chromatograms of
fish lecithin,' only one band appeared on Ag+-TLC plate. The
complex combinations of molecular species were identified in
the fol!owing manner. An example of determination of
molecular species in the small peaks with critical pairs 'appeared in the first half of the HPLC chromatogram of chum
salmon ( captured in fall ) is shown in Table I-3 ( also see
Fig. r-4D ). Small peak number 1 is obviously a combination
of 20:5 and 16:1. Small peak nurnber 2 is also a combination
of 20:5 and 16:1 with 10Z unidentified contaminants. The
differences in retention time on HPLC between these two peaks
is attributed to the differences in binding position of the
fatty acid. :t is considered that small peak number 1 has
20:S in position 1, whereas srnall peak number 2 has it in
position 2 in the molecule, since molecular species which
have a highly unsaturated fatty acid in position 2 are likely 'to elute later than the one which has the same fatty acid in

21
position 1. Small peak number 3 is a combination of 20:5 in
position 1 and 14:O in position 2, and also 16:1 in position
1 and 20:S in position 2 since this peak is composed of two
combinations of total acyl carbon numbers of 34 and 36,
respectively. However, the latter molecular species, i.e.
(16:1)(20:5), are considered to be contaminents from the
previous peak. From the fatty acid composition and total acyl
carbon number, three molecular species are presented in
small peak number 4, i.e. combination of 14:O in position 1
and 20:5 in position 2 for 63,3Z; combination of 16:1 in
position 1 and 20:5 in position 2 for 5.7Z; and combination
of 22:6 in position 1 and 16:1 in position 2 for 31.0%. Among
these moleclar species, (16:1)(20:5) can be considered as
contaminant from the two previous peaks. rn small peak number
5, three molecular species, i,e. 14:O in position 1 and 20:S
in position 2; 22:6 in position 1 and 14:O in position 2;
and 16:1 in position 1 and 22:6 in position 2 is identified
in the same manner as that in small peak number 4. rn this
case, molecular species of (14:O)(20:5) is considered to be a
contaminant from the previous peak. rn the case of small
peak number 6, molecular species of 14:O in position 1 and
20:5 in position 2 are congtdered to be the contamtnants Erom
the previous peak. By analyzing the data in this way,
molecular species of all other small peaks were identified.
The relative retention times (RRTs) of all peaks were
determined by dividing the retention time of each peak by the
retention time of (16:O)(22:6). In the case of soybean
lecithin, (16:O)(18:2) was used as a reference peak and the
RRT were recalculated against (16:O)(22:6) by using the RRT

22
Table 1 d- 4..
and Relationmo1ecular
between .specles
relativeof soybean
.retentlon Zecithin
time on HPLC
PN "1S Rt RRIT *
26
28
tt
te
30
ll
tt
31
32
tt
tt
tt
tt
34
tt
18:218:318:218:218:118:316:O18:318:118:216:O18:218:O18:317:O18:218:118:120:118:216:O18:118:O18:216:O16:O18:O18 .: 1
18:220:O
27.6
37.6
39.2
42.0
Sl.4
5S.2
60.0
62.8
73.8
tt
79.6
tt
83.6
113.2
tt
70.4
95.8
99.9
107.1
131.0
140.7
152.9
160.1
188.1
et
202e9
tl
213.0
288.6
tt
Abbreviations: PN:Partition tion time.
* 1262106 is used
number. MS:MolecularRt:Retention time.
as the reference
.specles .
peak.
RRT:Relative 'reten-

Tab1e r-s.
and Relationmoleeular
betweenspeeies
relative retentionof egg yolk lecithin
time on HPLC
PN MS Rt RRT
28
lt
tt
26
28
It
tt
30
tt
tt
et
28
3i
et
tt
30
32
tt
tt
tt
34
16:118:218:218:214:O18.:2
16:O22:616:O18:318:120:416:O20:416:O22:416:118:118:118:216:O18:218:O22:615:O18:116:O17:117:O18:218:O20:418:118:l18:O22:416:Oi8:1:8:O18:218:O18:1
'
41:2
tt
tt
tt
47.0
te
50.4
54.4
55.6
tt
59.2
tt
72.4
tt
tt
tt
79.0
tt
83.6
tt
121.8
100;O
tl
tt
tt
114.1
et
122.2
132.0
:34.9
tt
143.7
tt
175'.7
tt
tt
te
191.7
tl
202.9
tt
295.1
Abbreviations: PN:Partition Rt:Retention
nurnb er ,
'tlrne.MS:Molecu!ar species, RRT:Re1ative retetition time
23

Tab
leI-
-6. R
elat
ion
betw
een
rela
tive
mol
ecul
ar s
peci
es o
f'fis
h m
uscl
ere
tent
ion
time
on 1
ecith
in
HP
LCan
dm
a1n
Chu
m s
alm
on (
Sum
mer
)C
hum
sal
mon
(F
al1)
Big
-eye
dtu
naA
1ask
apo
l1ac
kC
arp
MS
PN
/RR
TM
SP
NIR
RT
MS
PN
!RR
TM
SP
NIR
RT
MS
PN
1RR
T
20 20 20 22 22 22 14 22 16 20 18 22 22 16 16 22
:5 :5 :5 :6 :6 :6 :o :6 :o :5 :1 :6 :6 :o :o :6
20 37.
3
20 40
.7 2
0 4
4.2
24 69.
7
26
92.
2
26
92.
2
26
97.
1
26
1OO
.O
20-:
520
:5
20:5
22:6
22:6
22:6
18:-
120
;5
20:5
16:O
16:O
20:5
18:1
22:6
22:6
16:O
16:O
22:6
20 37.5
20 40
.4
20 44.
1
26 87.
0
26
89.
5
26
91.
9
26
91.
9
26
96.
7
26
1OO
.O
20:5
22:6
22:6
22:6
20;4
22:6
22 :'
5
20:5
22:5
22:6
18:1
22:6
16:O
20:5
22:6
16:O
16:O
22:6
16:O
22:5
'20
41.
2
20
44.
6
22
55.
2
22
55.
2
22
60.
5
26
93.
5
26
93.
5
26
96.
8
26
1OO
.O
28
134.
9
120:5
20:5
20:5
22:6
22:6
22:6
18:1
20:5
20:5
16:O
22:6
18:1
16:O
20:5
18:1
22:6
22:6
16:O
16:O
22:6
16:O
18:1
14:O
20:1
l l
20
37.
2
20
40.
4
20
44.
3
26
86.
7
26
89.
8
26
89.
8
26
92.
0
26
92.
0
26
97.
1
26
1OO
.O
32
216.
6 3
221
6.6
i l l20:5
22:6
22:6
22:6
16:1
2e:5
18:2
20:5
16:1
22:6
18:2
22:6
14:O
22:6
18:1
20:5
16:O
20:5
18:1
22:6
16:O
22:6
16:e
20:4
l
20
42.
5
20
46.
2
24
62.
5
24 62.
5
24
67.
7
24
67.
7
24
67.
7 2
6 8
8.3
26
93.
7 2
6 9
3.7
26
1OO
.O
28
124.
0
Abb
revi
atio
ns:
PN
: Par
titio
nnu
mbe
r. M
S:
Mo1
ecu1
arsp
eci e
s• R
RT
:R
elat
ive
rete
ntio
ntim
e.N )

25
Table !-7. Relation between relative .retentlon .tzrne on HPLCand molecular .specles of fish musc1e lecithin
Chum salmon (Summer)
Chum salmon (Fall)
Big-eyed tuna Alaska porlack Carp
MS PN/ RRT MS PN/RRT MS PN/RRT MS PN/RRT MS PNtRRT
120:41i22: 61
l22: 51
l20; Sl
I22: 51
t22: 61
ll6: lll20: Sl
llgi•g
l16: 11l22: 61
1?zlg
l53igl
117: ll
l22: 61
IS:l X
l5i,iX
l20; 51
118: 11
1:8: 11t20: 51
iigi•a
I22: 61l18: 11
116: olt22: Sl
I16: Ol
l20: 41
BII•X
l20: ll120: 51
120: li122:61
118: Oll20: Sl
l18: ltl16: 11
I18: Oll22: 61
114: Ol118:•II
1l2liil
T24: ll120: 51
22 50.6 22 50.6 22 52.8 24 60.8 24
64.8
24 65.8 24 67.425
77.82S82.326
82.32584.426
87.2.
2690.22690.22690.228
121.9
28126.627
126.6
28126.628
140.628
14e,6 30143.628
152.S
30IS2.S
30IS2.5
3226S.7
118: 3I122: 61
120: 41l22: 61
l22: 51120: 5t
120: 51l16: ll
I20: SIlt8': 21
lt6: 11l20: 51
I18: 21120: Sl
R21a
1t4:Ol120: Sl
l22: 61116: ll
116: IIl22: 6I
ll:X
ll:i•X
116: 11122: 51
ll5: OIi20: 51
117: II122: 61
120: 5Il18: ll
122: 5Ii16: Ol
'116: Oll22: 51
116: oll20: 41
120: 11l20: Sl
118: O[l20: 51
'118: ltl16: lt
114: Oll18: 11
1l2,L gl
22 48.7
2248.7
2248.7
2459.1
24 S9.!
2460.8
2460.8
2462.2
2464.2
2464.2
2467.1
2467.1
2469.5
2677.8
2577.8
2S77.8
2682.2
28116.6
28119S28
124.6
28124.6
28133.3
30137.2
30142.9
30l42.9
l;zlgl
118: 21t22: 61
Il:i•g
122:4Ilza: 61
116: II{20:4t
120: 41t22: 5E
i22: 61l17: ll
122: 51t22: 51
117: 21l20: 41
117; 21l•22: 51
llS;: !l
l22: 6i
IS;l-X
l20: Sllt8: ll
l18: 11t20: 5t
122: 61P8: ll
l?21a
li21•81
llllX
118: 11122: St
1581,st
l?Zl81
lizi•,g
Isgi•x
118: !1
t18: ll
llg]N
l16: Oli18: 11
24 65.0 24 66.9 24 71.1
24 71.1
26 7!.1
24 74.025
78.42478.42S78.42S78.52S82.7es84.72684.72688.226
91.32691.3
28116.7
27116.7
28116.7
28124.6
28130,O
28143.2
28148,1
32189.6
32206.1
3221S.5
116: IIt20: 51
l5gi.;
lsgl g
lt6: llt22: 61
lsi.a
llSl X
lizi•a
ll8i•X
Isgl g
120: 11l20: Sl
Bgi•g
1:g,`g
118: 11l16: ll
l18: 11t18: 2t
ilgl9I
llgi• 91
Il6,i•X
llg:rX
llg•iu
li2i• 61
IS81?l
li 8,i 91
24 61.0 24 61.0 24 M.2 24 6S.9 24 6S.9 24 69.9 28 115.7
28llS.7
28120.3
28125.0
28137.S
28137.S
30137.S
30137.S
30150.0
30'ISO.O
30ISO.O
28 150.0
32207.4
32207,4
34301.9
34301.9
118: 31
122: 61
I20: 41
t20: Sl
lsla
120:4I.I22: 61
l16: ll
t22: 51
118: 21
l22: 51
l1S: Oi
t22: 61
ISi7i•gl
116: ll
t20:41
118: 21
120:41
II8: ll
t22: Si
ugioa
l18: ll
t20: 41
Issi. g
ISi'i•X
l20: ll
l22: 61
118: ll
l16: ll
118: lll18: 21
IIglX
llgl?l
lsig
Isgi• x
118: 11
t18: ll
Il6: Ol
l18: ll
22 5e.7 22 52.3
n 54.5
n 56.4 26 79.4 26 79.4 2S 79;4 2S 79.4, 26 82.7 26 82.7 28111.7
28111.7
2811S.8
28119.3
30133.8
28133.8
30138.4
30138.4
30148L4
30148.4
28148.4
30179.4
3219S.3
32210.1
Abbreviations:PN: Partition number. MS: Molecular .specles. RRT: Relative .retentlon .tlme.

26
data in egg yolk
is summerized in
lecithin. The RRT of each
Tables I-4-7.
molecular species

27
Section 3. Discussion
We have piotted the RRT of each molecular species
semilogarithmically against the partition number (PN) defined
as PN=CN-2.DB where CN is the total acyl carbon number and
DB is the total double bonds since PN is proportional to the 37)logarithm of RRT. A general expression for this can be
written as:
PN ee log(RRT) (1) After plotting the RRT of each molecular species
semUogarithmically, a similar correlation was obtained, that
i8: ' PNee log(RRT)+AQ (2) ,(2) is similar to (1), and if we formulate (2) into an
eguation: • PNm P•log(RRT)+dQ (3)where P becomes the slope of the oblique line, and zfQ becomes
the intersept on the ordinate. This equation (3) suggests
that PN is not only a function of RRT alone, but also a
function including dQ.
Back to the definition of the PN, that is, PN=CN-2.DB,
the left member in (3) can be changed as: ' CN-2.DBur P•ldg(RRT)+aQ (4)So, RRT can be expressed as follows:
' CN--2 •DB-dQ P RRTa 10 (5)
If we put aQ as Q,+oC, equation (5) may be written as:'
S!twa!IE;S9,L992DB(Q+q) RRT= 10 P (Q, is a minimum of "Q) (6)

28
where P and Q are invariables and OC is a variable range of Q,.
By letting CN and DB be invariables, RRT becomes a function
of OC which is:
RRT= .{(C() (7) Back to equation (4), by putting dQ as Qi+CX, the
following equation can be obtained: ' CN-2•DB" P.log(RRT)+Q,+ex (4') rf we let DB be invariable and rearrange the expression
for CN, (4') will become:
CNn P'log(RRT)+ct +Qa (Q2m Q,+2•DB) (8)
On the other hand, if we let CN be invariable and 'rearrange the expression for DB, (4') will become: DB= -- -ll-log(RRT)-S+Q, (Q, =--iltr(Q, -CN)) (9)
' ' These two functions, i.e. (8) and (9) have a deviation
which are O( for the former and -- O(/2 for the latter. Alfa is
considered to be a factor that has a small but significant
effect on RRT, and it may be due to the positional isomers
such as between 1 and 2 positions in the molecule, or by the
large differences in number of double bonds between the two
acyl group in the molecule. This leads us to the model of a
matrix since it is convenient to distinguish the positionaZ
isomers or the bias in the number of double bonds between the
two acyl groups in the molecule. So in order to simplify the
equation, we can induce the following equations from (8) and
(9) respectively under the conditions of:
cN,.x d, (c2, di and d2 are invariables) c2 d2
Cl Y DB'= (ct, c2 and d2 are invariables) c2 d2

29
CB'= P,•log(RRT)+q, (8') DB': P,•log(RRT)+q, (9')by analyzing the RRT data of each molecular species.
After plotting the RRT of each mo;ecular species from
the source examtned against the total acyl carbon number or
the number of total double bonds of each molecular species, 'the RRT plots of molecular spectes Zatd almost on a straight
line by giving a variable integer x for the carbon number and
a variable integer y for the number of double bonds of each
acyl group in the molecular species, when we express the
molecular species in matrix relation. The oblique line is
almost parallel to each other as shown in Fig I-6. By
applying these correlations between the RRT and the
correspo,nding molecular species under the condition of matrix
for the determination of molecular species, it is suggested
that an unidentified molecular species can be predicted from
RRT on HPLC even if it has the most complicated composition
of molecular species such as fish muscle lecithin.
Another method for HPLC analysis of phospholipid 19) . To ourmolecular species was published by Petton et al
surprise, the sequence of each molecular species in elution
on HPLC, when the RRTs are plotted against the total acyl
carbon number from our biological material, sre the same as 'common molecular spectes of rat liver which was analyzed by 19)Patton et al. despite the fact that the analytical
conditions are significantly different. This suggests that, 'although there are differences in retention time or in RRT
among the different conditions on HPLC, the sequence in

30
e.E
"8
----
sN
y•.re.-
cr-.
mo5ooaoo
3oo
2oo
100
70
50Lo30
20
10
5oo4' oo300
200
100
70
504o30
20
il,g 81 l,: gL 21,g 9
7I,6 21, sl,! 21, gl,C
i4I,: }L isl,: kl, i61,6
1812: :1
ll
g
2
,: 6L
L pt,:
I, i71,6
31,g :L 41
gL nl,x, i
gL
2
iE IL sl,g gl, 61,g IL
L i21,: 21, i31,6 }L
1
34
57
10 11 1312 14 15
16
17
IS
10
30 32
31
Tok
iglii
36 38 40 acyl carbon number,
xl lii gl, roIi: xL 2ili8 g
2415g gl, asli2 xl, 26E: I
rellg gl, sollg I
725so
28 2
42
l, 221I; XL
L 2711: Il,
L 3iE2 Xll
23 20 1924
21 22
44
231i: gL
2sll2 'oL
l2 gl
1 2 3 4 5 Number 678ot totat9 10double
11 12 13 14 15 16 17bonds
Fig . :-6. Relation between relative retention time total acyl carbon number and relation between retention tirne and total double bonds on HPLC
andrelativeof lecithin .

31
elution of each molecular species might
leads us to a conclusion that in HPLC, 'elution might be controlled by a fixed
matrix relation. By accepting this idea
matrix model to triglycerides. Details 'the next chapter.
be unchangeable. This
the sequence in
correlation, that is
, we can expand this
will be discussed in

32
CHAPTER II
A NOVEL APPROACH FOR [I'HE IDENTIFICAT!ON OF TR!GLYCERIDE
MOLECULAR SPECZES ON REVERSED•--PHASE HIGH
PERFOMANCE LIQUrD CHROMATOGRAPHY
Zn ehapter :, two rules in the elution of diglyceride
acetate derived from lecithin on HPLC were diseovered, that
CN= P,•log(RRT)+Q, CN= ll, gl (1)
DB- P,•log(RRT)+Q, DB= g; Xa (2)
where P is the slope and Q is the intercept on the ordinate
of the semilogarithmic plots of the RRTs of molecular species
against CN or DB. c and d are acyl carbon number and number
of double bonds in each acyl group, respectively. x and y are
variables of acyl earbon number and number of double bonds,
respectively.
The structure of diglyceride acetate is:
Acylt
Acy12 ( Acyl : esterified fatty acid ) (3)
CO.CH3
And the structure of triglyceride is:
Acyli
Acy13
The difference between (3) and (4) is at position 3 in the
molecule. But CO.CH3 in (3) can also be considered as the
shortest form of acyl group.

33
So: Acyl, Acyli Acy12 !!l) Acy12 ( where 9 means "include" )
Acy13 CO.CH3 'therefore, (1) and (2) can be rewritten as:
c N = pt •i o g (' R R T ) + Q, c N = ll.i? ddo ll ( i ) '
DB= p2'iog(RRT)+Qa DB"lii ili21 (2)'
sÅ}nce (2, O) in position 3 exhibits the acyl (acetyl) group
which has two carbons and no double bond. So we can conclude
I\:.E,:l.i:g.(ik,:ie,::mg.ei:,:l..:hg,g ix;.,erlei:iiiifog,l.
By adapting the general expressions to triglyceride, the
following equations can finally be obtained.
cN. p,•log(RRT)+Q, cN=lll; dgil (5)
D B n p, .i o g ( R R T ) + Qz D B al ii Ydd 32 ( 6 )
rn this chapter, the theory that has proved
mathematically, is verified by the actual experiment.

34
Section 1. Experimental
Preparation of Triglyceride
Linseed oil and olive oil were purchased from Wako Pure
Chemical rndustries, Ltd., Osaka. Rapeseed oil was obtained
from a commercial source. Cacao butter was supplied by
Yunokawa Seiyaku Co. Ltd., Hakodate, Hokkaido, Japan.
"Ogonori" ( Gracilaria Msuz.!!s;g.s3a ) was collected at the shore
of Taisei-ch6, Hokkaido, Japan. Total lipid was extracted
from "Ogonori" using chloroform/methanol ( 1:2, v/v ) with
the use of an ultra•-turrax for comminution.
Triglycerides from these oils were purified by a
preparative TLC using n-hexaneldiethyl ether ( 4:1, vlv ) as 'the developing solvent.
HPLC Fractionation of the Moleclar S ecies of
:TkELg.ILI id
The purified trigiycerides were filtered through a O.4S>,"
type FP-45 Fluoropore filter ( Sumitomo Electric rndustry,
Ltdi., Osaka ) and subjected to HPLC. Separation of
triglycerides by HPLC has been achieved on LiChrosorb RP-18
( Merck, West Germany ) twin 8x250 mm columns. These columns
were connected in series. The instruments used consisted of a
Hitachi 638-50 Liquid Chromatograph ( Hitachi Ltd., Tokyo )
equipped with a Shodex SE-11 RI detector ( Showa Denko Ltd.,
Tokyo ). The eluting solvent used was acetonelacetonitrile
( 3:1, vlv ). Triglycerides were dissolved in chloroform at
52ug125>pLl and applied to the column under room temperature (20-•
220C). The flow rate was 1.5 ml!min.

35
ldentification of Molecular Species of Each Peak
on HPLC.
Peaks on HPLC chromatograms were numbered in
elution. The fatty acid composition and the total
carbon number of each collected predominant peak
by GLC as previously shown in chapter I.
sequence of
acyl
was analyzed

36
Section 2. Results
Figure !I-1 shows chromatograms of triglycerides on
HPLC. The aeyl combination of each predominant peak collected
was determined by fatty acid analysis and total acyl carbon
number anaylsis as shown in Table II-1. This table shows the
results on linseed oil in' Fig. I!-1 as an example. Peak 'number 1 in Fig. !r-1 is triglyceride composed of 18:3 alone, 'i.e., (18:3,18:3,18:3) because over 98Z of fatty acid of
this fraction is 18:3, in addition, the total acyl carbon
number of this peak is mostly S4. Peak number 2 is considered
to be the combination of one mol of 18:2 and two mols of
18:3, thst is, (18:2,18:3,18:3). This is supported by the
data of total acyl carbon number of this fraction. Peak
number 3 is mainly (18:3,18:2,18:2) for the same reasons in 'peak number 2. Peak number 4 is (18:1,18:3,18:3) with 4NIO%
contaminants because 9.7Z of 18:2 is detected as overlaps
from the previous peak. Peak number 5 has at least two
contaminants, i.e. 18:1 and 18:2. This peak is concluded to
be (16:O,18:3,18:3) from the data of total acyl carbon
number. All other peaks were indentified in the same manner.
The relative retention times (RRTs) of all peaks were
determined by dividing the retention time of each peak by
that of triolein. When the amount of triolein was very small
and or the peak overlapped considerably, purified triolein
was added to the sample as an internal standard. Predominant
or reliable peaks were selected (Table rl-2) to plot the RRT
of individual triglycerides on a semilogarithmic graph paper.
Results are shown in Fig. II-2A. The RRT were also

1 ro
2
4
5
LIN
SE
ED
TG
1 ( v-co
1i
i
N iX
V N
JN,,
so
RA
PfS
fEO
TG
co tc
o 1?
O
to
OLI
VE
TG
co
iib'ri
n
60
rooo
co10
0 m
in
colo
o rin
ro
ro ro
co to
"O
GnN
oRl.
rg
40 6
0 tiO
co co
ea -
co
1oo
nin
cAcA
o su
rrE
n T
6
1co
tro
140
PA
UI T
6
rOO
1ro
1
too
min
IGO
min
Fig
.zr
-1.
HP
LCch
rom
atog
ram
s of
trig
lyce
rides
from
natu
ral
sour
ces.
lt]

Tab
le;Z
-l.D
eter
min
atio
nof
trig
lyce
ride
mol
ecul
arsp
ecie
s*
Pea
k nu
mbe
r
12
34
5
F
atty
aci
d
16
,O
18
,1
18
,2
18
,3
Car
boti
nunb
er**
52
54
Mol
ecul
ar s
peci
es
98.0
<
98.4
***
Eii.
:ill33
.466
.6
98.3
***
liiii3
I
63.2
36.8
96.6
***
l18:3
18,2
18,2
28.9
9.7
61.4
96.8
***
IZ•ii
lls29
3 1
65 98 16 18 18
` . . . . : : :
6 7 1 5 o<**
de
gl
in
rel
ativ
e *
Exa
rnpl
e of
***
Per
cent
age
' z linse
ed o
il.by
wei
ght,
** T
otal
acyl
carb
onnu
mbe
r.
w oo

Tab
1err
-2. R
elat
ions
hip
mol
ecul
ar s
peci
es o
fbe
twee
n re
latiV
e re
tent
ion
trig
lyce
ride
from
nat
ural
time
and
sour
ees
Rap
esee
d oi
lLi
nsee
d oi
lC
acao
but
ter
Psl
m o
ilO
gono
riO
live
oil
RR
TM
olec
ular
spe
cics
RR
TM
olcc
ulas
spe
cfes
RR
TM
olec
ular
spe
cies
RR
TM
olec
ular
spec
ies
RR
TM
olec
ular
spec
ics
RR
TM
olec
ular
spe
cies
28.6
35.9
375
45.0
".8
S8.
461
.076
.385
.510
0.0
112.
412
2.4
128.
314
3.9
160.
016
2.8
(18:
3> X
2(1
8:2)
(18:
2)
Å~
2(
18:3
)<
18:3
) Å
~ 2
(18:
1)(1
8:2)
X 3
(18:
1) (
18:2
) (1
8:3)
(18:
2) Å
~ 2
(18:
1>(1
8:1)
Å~
2(1
8:3)
<18
:1)
Å~
2<
18:2
>(1
6:O
) (1
8:1)
<18
:2)
(18:
1>Å
~3
(18:
1) X
2(1
6:O
)(1
8:1)
(18
:2>
(22
:1>
(18:
1) Å
~ 2
(20:
1)(1
8:1)
Å~
2(1
8:O
)(1
8: 1
> Å
~ 2
( 22
:1)
(
isom
er)
22.5
28.6
35.5
36.S
40.1
".4
46.5
SI.O
58.4
61.0
76.6
92.6
1oo.
O
(18:
3)X
3(1
8:3>
X 2
(18:
2)(1
8:2)
X 2
<18
:3)
<18
;3)
X 2
( 18
;1)
(18:
3) X
2(1
6;O
)(1
8:2>
X3
(18:
1)
(18:
2)
(18:
3>(1
6:O
> (
18:2
) (1
8;3>
(18:
2)
X 2
< 1
8: 1
)(1
8:1)
Å~
2(1
8:3>
(16;
O)
(18:
1) (
18:3
)(1
6:O
) (1
8:O
) (1
8:3)
<18
:1)X
3
91.2
11Z
S13
6.2
143-
146.
8IM
.823
8.S
(16:
O)X
2(18
:2)
62.3
"6:O
)Å~
2(18
:1)
74.7
(18:
1>X
2"8:
O)
83.6
(18:
O)Å
~2(
18:2
) 92
.1<
16:e
) (1
8:O
) {1
8: 1
) 12
8.6
(18:
O)
Å~
2(1
8:1)
(18:
O)
(18:
1) (
20:O
)
(18;
2)
X 2
"6:O
>(1
8: 1
} X
2(
18: 2
)(1
6:O
) (1
8:1)
(18
:2)
(16:
O)
X 2
(18f
2)(1
6:e>
X 3
27.8
32.8
37.0
43.8
47.8
(20:
4> Å
~ 3
(20:
4>X
2<
20:3
)(2
0:4)
X 2
(14:
O)
(20:
4) Å
~ 2
(18:
1)(2
0:4)
X 2
(16:
O)
12S
.414
4.8
(16:
O)
Å~
2(1
8:1)
{18:
1> X
2(1
8: O
)
RR
T :
rela
tive
rete
nt{o
n tim
e w
hert
<18
:1)
Å~
3 is
usc
d as
the
refe
renc
e pe
ak.
w e

A s e to -8 io v e .E N c .9 3
00E e
2oo
2 g •.-.
1oo
-rt, di r
o
so
co
3b
ro
104o
o
mo
mo
1oo
ro 50 40 so ro
Ab. c.
. e
.
.
4e50
52
54 5
6T
otal
acy
l car
bon
num
ber
58oo
A e ra v ut o 2 v e E •.- - c .9 E e i s
oo" m
oo .)
150
ts i 1oo
ec sc
4
1 foo so 40 30 20 10
B
i
a. g• ta-
a.
b. 'e d.
t t . .
Fig
.
. :
.
.. rf
lt g.
' j.k
rn' t
'
t'
36 3
8 40
42
44 4
6 48
'Tot
al a
cyl c
arbo
nso
52
54nu
mbe
r
4co
soo
mo
30
O
1234
5678
9 lo
11
t2 1
3 10
Num
ber
ot to
tal c
loub
ie b
onds
lsl
lsl x
e 2e
rls
e ls
l:s
s, b
• :s
s .•
c•
le l•
d•
;e i•
e•
;o, t
• t•
;g 2
• a.
ll,2
,g
i•i+
I• h
• l•!
i• t•
lil•
j• iii
i• k•
lii•
i• iii
,g•
t•lli
ll,
IS 2
, n. 1
6 O
.Ie
y ls
r
( b
X.::
g l.,
a,r.
e.g2
5.`a
z}le
;.:f a
eyi
and
y c
an ta
ke 1
, 2, 3
, 4, 5
II-2
. Rel
atio
n be
twee
n re
lativ
e r
elat
ive
rete
ntio
n tim
e an
d to
tal
stu
dy. B
: Dat
a of
E.G
. Per
kins
et a
l. 4
60•v
463
(198
2). C
: Dat
a of
C. M
errit
t
. .
100
ro
so
40
x so
-rd M
20
o 9 v 10
Åë E •.
- - c o '.= 3
00E g
roo
a. b. c.
e. f' 9.
i i
O
1234
5.6
78
N
utnb
er o
f tot
al d
oubi
e bo
nds
l,
6. i
: ogl
, c•li
: oil.
d. l
t: i ,
e. i
:t
,: w
w h
. iil;
, t.li
`:;.
s.lli
carb
on n
umbe
r an
d nu
tmbe
r of
exa
mpl
e, x
can
take
16,
18,
20,
•
.•...
etc
.)re
tent
ion
time
and
tota
ldo
uble
ben
ds o
n H
PLC
of
in J
. Am
. Oil
Che
m.
et a
l. in
J. A
m. O
il
g '" i1oo
cr- .-
ro
so
co
so
ro
o
to
;,
g
.
' a.
I2 o
i
xO
d
oubl
e 2
2 ••
•••
acyl
Soc
., 58
48 . .
so
Tot
al 5
2 Y
56
acyt
car
bon
num
ber
d.
e.
f' 9.
ss
o l•
1 2
3N
umbe
r of
b•lig
,il•
carb
on n
umbe
rtr
igly
cerid
es. A
,
867
'"872
ch
em. S
oc•,
E:tL
,
4S67
89 r
oto
tat d
oubt
e bo
nds
c•li:
,il d
•ll'ij
' e•ll
:'ll t
•ll:s
;,
1
6 O
s•
16
Q
18
y a
nd r
elat
ion
betw
een
: Pla
nt s
ourc
es in
this
(19
81)
and
Lipi
ds, 1
7,42
2'v4
32 (
1982
). '
t
b o

41
calculated from the chromatograms in the reports of Perkinset ali.i'38)( see Table xl-3 in the next section ) and those
39) ., and plotted on a semilogarithmic graphof Merritt et al
paper as shown in Fig. !I-2B and Fig. rl-2C, respectively. As
it is clear from these figures, the sequence in elution
might be controlled by a fixed correlation, that is, a matrix
relation, though the analytical eonditions are different
among the three figures in Fig. :I-2. !f we express these by
ernpirical equations, the two equations described previously
( equations (5) and (6) in section 1 ) can be obtained.
rn Fig. II-2, it is observed that even triglycerides
from plant sources show complicated sets of oblique lines.
This is due to the extreme increase in probability in
combination of fatty acids. For example, if we have four
kinds of fatty aeids, there is a probability that diglycerideor lecithin might have a maximum of 42u16 kinds of acyl
combinations. But in csse of triglycerÅ}des, this willdrastically increase up to 43a64 kinds of acyl combinations.
More specifically, in case of fish lipid, for instance if we
have'ten kinds of fatty acids, there is a probability that 2diglyceride or lecithin might have a maximum of 10 =100 kinds
of acyl combinations, while in case of triglyceride, ' 310 =1000 combinations might be possible. The author has tried
to analyze the molecular species of triglycerides from fish
muscle. But the theoritical plate of the HPLC column is still
not enough to separate the very complicated combination of
molecular species of triglyceride from marine sources.
Recently, column packing with 3-)-Ltm particles has been 40)developed by Dong et al. for triglyceride analysis from

42
vegitable sources.
packing is shorter
it is expected to
Though the life of this type of column
than the coventional 5-7tLm particle type,
give a high resolusion chromatograms.

43
Section 3. Discussion
11,38) The chromatograms of Per'kins et al . were introduced
in this study in order to calculate the RRT of each peak on
HPLC since it is bssed on 28 kinds of known triglyceride
standards purchased from Nu-Chek--Prep (Elysisn, MN) and
Supelco (Supelco, Bellefonte, PA). RRT of each peak on 11,38) s chromatograms 'were calculated by dividingPerkins et al.'
the retention time of each peak by that of trio!ein. And
multiple regression was performed against RRT using Personal
computer Model PC-8001 (NEC, Tokyo) to link the two concepts,
that is, ECN or PN and the new matrix model. The commonlyused computer program for the multiple regression4i)was
written in N-BASIC available for most of the NEC personal
computers.
Theoritical Relations between the ECN or PN and the
New Matrix Model
We will express the molecular species of triglyceride ina matrix form as it is written previousiy such aslii gti.
a so called functional group X ( in this case --CH2- ) isWhenadded to Cc'
2 dd' 2,then Cc2i Si win becomelg:X gll. The theory
of Martin42g3.gg:' C3 d3 le3 d31 Ali{Z.F:!}T =-fL{;l.IiEeLT +-4f{ltili2!- (1)
ln(ctqBA)=Afl.$LT ' (2)
(7(L: Chemical potential, R: Gas constant, T: Absolute
temperature, B: Substance which contains group X in addition
to substance A, (X: Partition coefficient ) :.ig,l andBas i'iX g,l in If we substitute A as

44
equations (1) and
obtained:
' a (g;+x R•T
c( ln (X
On the other
chromatography
Vr za (XVs
( Vr: Total
liquid
So, vr 8; Cl c,+X Vr g;
From equations
v. g}'x g
v. g•l g
The right member
corresponds to
c,+X ct ga
c( cl ct C3 '
By substituting
hand
was
adjusted
stationary
(5)
retention
ln (RRT)
1og(RRT)
(2), the following equations can be
' g,g =ALI,(illiiLgiL,gl.zts,.,
ww,,+x gs.g lgi g;tl R•T
, the general rule for the liquid
:
retention volume, Vs: Volume of
phase, at: Partition coeffi.cient )
gjl- cxi k g;1•v,
gi ==at g+x gi•v.
and (6),
".-.sut.:+Xg,
i o( g21 gi
in equation (7) is a partition ratio
value, namely:
g: --RRT gi
equation (8) into (4),
-as!g R•T ti vKZx 2.303 R•T
(3)
(4)
the
(s)
(6)
('7)
which
(8)

45
' •'• log(RRT) oc d2L(x (9)rf equation (9) is held, the following correlation should
tt
E.
o " log(RRT)= k•,Ot'ztZx (10) d7tZx
And if we let the x-axis be the carbon number:
E %
HO log(RRT)= P,C+ qt (11) Carbon number
where P becomes the slope and q becomes the intercept on the
ordinate. This equation (11) is exactly a modified form of
the emperical equations:
c N - p, •i o g ( R R T ) + Q, c N = li; ddd ,Ll
DB= p,aog(RRT)+Qt , lcC3' li, DBm c2 d21
namely, the new concept of the chromatographic rule
discovered in this study.
So far, the physicochemical background of this new
concept has been demonstrated by intfoducing the theory ofMartin4.2)
In the same way, for all of the functional groups added
to the triglyceride gC 3> gd l, equation (11) should hold,
namely:

46
log(RRT)= Pi .Ci +q, (12) log(RRT)=P2 .C2 +q, (13) l o g ( R R T ) -- P3 .C, + q, ( 1 4 )
log(RRT) :P,'•D, +q, (15) ' (16) 1og(RRT)=P"'D2 +qs
log(RRT)=P3'•Ds +q, (17)Careful considerations should be done here.
r. :f we take notice of one hydrocarbon chain of the
triglyceride molecule, -CH2- snd -CH=CH- can be
considered as physicochemical functionai groups. And
adding to those, the differences in arrangement of these
units might affect the total chemieal potential of the
triglyceride molecule and this should also be considered
(We will call this as se factor).
II. From the view point of stereo specific structure,
unless three carbon chains are the same, we should
consider about the degree in bias betvieen the
positional isomers.
rlr. Specific fatty acids such as iso, trans or hydroxy fatty
acids might also affect the total chemical potential of
the triglyceride molecule. 'So, strictly speaking, we can conclude that the chemical
potential of the triglyceride molecule is the resultant of
all physicochemical functional groups in the molecule. If we
do not consider about the affection of ZIr since these fatty
acids seldom appear, the chemical potential (-LC) oftrigiyceride lg'2 ddil can be written as fonows:
/t,c = gt{Cl(l( c9 3,ld, ,,st,),}(c, ,d2,slsa),f(c3,ds ,Ste)} (18)
where sc is an se factor,/Lt is the chemical potential given by

47
the hydrocarbon chain. And g is the function of chemical
potential given by the differences in positional isomers.
Finally, we have reached to the function (18) that sums up
the chemical potential of the triglyceride molecule, and this
(18) is at the same time, an equation that controls the
sequence in elution on HPLC. This will be discussed in
chapter V again.
We will derive ECN (or PN) from function (18). When we
neglect the fsctor numbered lr, and suppose there is no iso
or trans or hydroxy fatty acids, we can rewrite equation (18)
as: ' .,cc s {( c, ,d, ,st,)+ l( c, ,d, ,sc.)+ f( c3 ,d3 ,se,) (19)
Adding to it, if we neglect the st faetor, equation (19) will
become: .L,C.=f(ci ,di )+f(c, ,d. )+f( c3 ,d3 )
= f( cl +c, +c3 , d, +d. +d3 )
=f(CN,DB) (20)This equation (20) exaetly corresponds to the equation of ECN
(or PN). Another way of demonstrating the theoritical
relation between the new concept and ECN (or PN) is as
follows. If we do not consider about the SZ factor and also
the iso, trans and hydroxy fatty acids, we can add both
members from equation (12) to (17), namely:
6.Iog(RRT)=p, .C, +P,.C, +P,.C, +P",D, +Pt'.Dz +P3'.D3 +q, +q, •+q, +q, +qs +q`
(21)
And if we put Pnnl16 Pn, P'n=116 P'n,Zq/6mQ, the following
equation gan be obtained:
log(RRT)=Pi.Ct +P2.C2 +P3.Ci +Pi '.D, +P,'.D. +P,'.D3 +Q (22)
This equation (22) can be considered as the first order

48
Table rZ-3• Relative retention time calculatedchromatograms of E.G. Perkins et al. in J.Soc., 2t, 867•v872 (1981) and on Lipids, U
from the Am. Oil, 460•y463
HPLCChem. (1982)
Molecular species RRT- LaLaLatrt-13:O LL Le MMM LLL LeL L'L P
LOOtrt-15:O
PLO PPL PLP LPP ooo
21,9 33,g 31L;,3
L12e1
44,8 58e7 63e3 76,7 81,8 83,7 89', 5
90,7 94,2100,O
Molecular species RRT-
MOPSOLSPLpooSOMPOPPPPsooSSLsopsoospoSPPsos
101,104,i08e113,117,120e132,144,145,152,155,162,179,208e
1
1
7
1
3
1
9
2
o
7
3
38
1
Abbrev La :
M:"RRT :
e
Lauryl, L : Linoleyl,Myristyl. O : Oleyl. P Relattve retehtton time the reference peak,
Le : Ltnolenyl,: Palmityl,
when OOO is used as

Tqb1e. ;r-4. Multip1e regression analysis of the data in Tab1e TZd-3
DRTE 74/m.::t."1,.n.TIr•IE e?,;p-ltl:s.t:,Per"ki'il=-. T.13'. bFITfrl Pt:1 :J. I T r Ctt•lnL e-• -d i r(i
:S:S blULT1F,LE F.1Et3•ElE:;ti;ION
INPUT PfiR.Hr•IETEP.t'.'No. OF .SRrdlF•LENO. OF VAR.ltkELERRN( e')l$T[)" 1)
INPUT PRTH SnMPLE 1 2 3 4 5 6 7 e 9 le 11 12 13 14 15 16 17 t8 19 2e 2t 22 23 24 25 26 27 29•
RVER.AGESTD.PEV
CORP.ELHTION
x( lr, XL: .-) ,X< :i) ;C 4) t)t tt " At. Ul Y,C E) Y
X< 1)s2.ees13.gee1:-.cJeet2.eeelg.see1e.eeell .egelg• .eeg1s.ese16.eeg16.eee1s,ege1e.eee1e.eea.N.eee1 :B . eI3e
1•y.eee '16.erJsip..see1"o.n.FJe1 s. e m. e
v•.gseie.socJ1 e. e e. n.
1 ,e•. fi.t Et fJ
1 li? . klse
1 ?• . EIEt Et
1 9• . Et pO t)
ISS,. r• 14
1. ::- C-:7
PIHTEI Y•: :v.: (. 1 :, 1 . r)t•trJ
Ei. 7:- El crJ, 7• IL"
Lb . :-, Y, tl
El. :Y t:L
p1 . t1 2y6
P1. tt; :; "
: :.B: lt:,
n.
nr•IRL,t':AJrS :t:t
X,( 2) i2.er"N 1:..E'see 1 ?. s a. e
i4,L-Jee1e.ege1e.eee1s.eselg• .ese1s.eee1e.eee16.eee
.1s.ege16.eLle13.eDe1e.ese1e.gge16.ev"Js1 ?. E, e e
1?•.Etn.g
1e.eee16.gei)16.see1e.gge1?••.rJrJe
1g.sEtro1E.ek-letfiiF)t-J'n.
I Et . Et lY LI
1ff.f-aJ:--
1 . it". ff f:r
:PT:t: le- ).
Ei . 7` 3g
1.gp-le vo , ;::' t r:•1
e.e$e. il•1. fE• :- t:;
l'il . I:-t :., :.:
Et.fiEt7
X< 3) 12.see1•3.gee1R..eEte14.ese1g.gse1s.eerJ1 6. e Ll e
1e.eeels.ege.1e.eee1B. eg,j16.esele.eDelg• .see1 6. e a e.
13.eselg• .m. eg
1e.ees14.eee16.ses1 6. M. e N
1s.see1e.ewm.1s.eEte13. r..l tN rp
1 t:a . el•1 ttl
1 lt: . EIL•le
1 •e-• . eeg
IE.64r.u 1 . 7• 1 ,3
7x:< 3• rJ Ei. 7• 1" M. . T• 1L',
1 . Ei t:•IC.t
'[" • eil ri
l:•l. :q F.",:t
g. t'• 9. I]
Et . 4t-:,E
PCn E: rJ EI 1 M-BRS-.':C 3:* By
>l< 4) e.eee e.see-2.eee
e,eeptJ . 2.eee 2. n. ee
2.eee 2.DSP3e.eeee.eeBe.eeee.gee2.ege
1.eeee.eeoe,esee.eeee.eeee.eege,eeee.eeee. ofiJee. gores.seroe. gs f:g. et:•]e
s. cJ e e
e. tttee
FJ.4fi4PJ.tn:.:t
k•;(l 4) t3 . .'.k-, ?,4
cr.1 . 3•:'FJV
L•t. :,,4tl
1 . ,:,t L-l if
E"n47'6 l:,t.::t3."t-•
-e.':-gg.
F',( 5) e.eee e.ees 2.eee s.serJ 2.eee 1.SFJe 2.ege 2. eege.eeg2.seee.egs2.eeee.eeg
1.eee 1.eee 1.eeae.eee1.eeg1 , e'ee
i.ecJse.seet.seee. eee1.see1.eeee.eeee.gget.tttFJe
e, :: aJ 1
e. 7Et e•
Y, L: S) e. . :.• .39
E . ff :- ,L
rJ . ?•E::t
{].47• S..
1.eec;n e.z'gcrJ-- ttt.11Y•
MAKrJTO
X( 6) e.ees p.1.eee s..eee e.eee 2.gee 2.ege s.ess 1.eee s.ege 1.eee
2. e rJ e
'e.esgg.eee
1. eEl p)
e.eee2.eee
'2.eee1.sese.eese.eeee.eest.erJro2. eeee.eEte1.eeEt1.Bgeg.EIFJa.e.f.lb-Jpcr
e. r• eeEt . 9• gl
X•'< 6) e.426 V).Lre""e fi.1. lt-, -. rj
p). 3 2 7
3.2rJS 1.ees"Et,1::.'.'l
EGI
Y•1.o•4.e2s 1VJ2.992 ts.a.se2 162.399165.e9S176..e321 e• s. 1 g e
1gB.446191.2•411y•2.2,e.•e
19S.14719-5.725197.37e199,964zes.43g2e1.7S92eA..5S6:.s.s..Qe.g
2e6.e932 CJ 7. 9 1 7
212,314215.S5S2s6.ege218.345219.e78.22e.992Z2S.438:..?1.7g5
i 9 5. 1. 8 7
23.S25
sf, e.s.gg e.se7 bl 4Fv6 -e.?9.9- -e.119 -e.1?•3 1. en- e
tsm=:st:setemm :=====n :v=t ==u== R==wttatu=m=sc==s :====== a=== == ===nnm=m--==ma=mxvnnptun:=u#ttutt
SRNPLE No. :SHptPLE No. :SRt,IPLE No. :SRMPLE Ne. :SHMPLE. Ne. :SHblPLE No. ;SHt•IPLE No. :SRNPLE No. :SRMPLE Ne. :SRt•IPLE No. :SRMPLE Ne. ;SRr,IPLE Ne. :SHNPLE Ne. :$Rr,IPLE htc,. :SHr•IPLE No. :SHPIPLE Ne. :SRblPLE No. :$HblPLE Ne. :SRptPLE Ne. :SHt•IPLE Ne. ;$Rr,IPLE Ne. :SHblPLE Ne. :SRr•IPLE No. :SHNPLE Mo. :SHrfiPLE No. :$HptPLE Ne. :SRMPLE No. :SHblFLE Ne. :
TRBLE eF THE
U$E VRR No. 1USE VHR Ne. 2U6E VRR No. 3USE VRR No. 4usE vnR Ne. sU$E.VAR No. 6•
REGRES$:ON EXPRE$S:ONy n. s.s73sl * x< 1• 5.9ele9 * X< 2 7.ee699 *. X( .? -11.e?•26e * XC 4 -13.4e241 * K( $ -•15.4e73B X: X< 6 -e5.7744g
Y8 Y' FOR ERCH SUB.TEÅëT t- 1
2 3 4 5 6 7 ?, yle11121 :3
1415IE17ig•12-.•
-E,VJ
2.13•Pz'
ee:.4:xS:FS:7•
Z'e.,
-t-
YYYYYvY'c'
YYY-)J
st--
'•r
'T'
YYvtr
e)i
Yte)
'v'
4t)
Y'v
'v'
:
;
:
:
;
:
:
:
;
:
:
CiF
)
)
)
>
)
)
134. M. 2S2SIS2.9924g153.5ei75162. :-•Pe.g41 6ut-. g.gges1 76. 9• •31 9• .'t"-
1Se.1e7911e8.4tis.rj•s1 9 1. L) 4 e S 9•
1 Y, LT . ::L)• 7• 93
1 ", E, . 1471 t:.
1S5.?;.5461 97. :s, t:--, .". S2
1 Y. S. 96 :.- ."-. 7•
2ee. 4[;,: Al"s
2vS1. 7• eS T• 42F.-.t:s.5Ett3.Ry7t
2LDE,.Ltl-,:":.7:- es. e•g2s:•:2.,rA7•.f-1F:•:.`1
21 :- . :.• 14a$
:.15.e5ra2.21s. ef 't"• ,ee,
:1e. ;tv14572,1Y'.e7•7t;.5:'2 e. -g a. Ei r.g
2' :.S. 4 S• :t ;:i4
i, it 1 . 7S,:J4tt
N"RF: I Rt•IC E
v' ;Y, :Y' :Y, :Y' :41)- :
Y' :Y" :stPl :
Y' :'Jl.`J :
Y' :4t"1 :
Y' :tr' :'T'' :•li)" :-v-" :
Y' :'1') :st"" :
Y' :•-tJJ :-tpt :-)") :sl") :tti-J :
tlJl :
136.ee.9531$4,4S1531sg.6e.; 4e1G1 . 52rr,"71
a66.g1S7717Y.41.9181g2.$17crJ4l e l. 4 :. 4 1 5
1:,1.45554t93.341S21S3.1:?67't'1 yr 4. s :a 4 y• 1
1Y7• . :?• 2., Et 17
:- e6 . 4 f:i •:- 1 t:.
1 9' 7. 1 E:949G•'tS:-,,Ee•4::t?•
2tEit4. :2S4ffet) rJ i-: . :- `i :ts::
2Et5. 4;•' 1 1 tt•
:-rJ?,.:<t7:t2y:.• Ei 49 . Yl [:t 7S4
Z1g,ef-176:. 1 h'.'• . eE: i:.7V
:.1:-.4:"•51S:.ls.ey" r•E:. 1 g• . E• :-is:e•
:. 3••' 1 . g::.s:g7
:.' :J. :e . 4YT '- 13
ERROREP,ReP.ERRORERRORERReREP.ReRERROREE•ROR.ERROREERORER.ReNERRCtREFIRt:1R
EREtCtREFIRaREREIOR.ERFIEIFIERP.rJRE FI R, l;I F:
ERF:Cer<EK:Rt)EERFteR.EF:FlCsFl
EF:E:OREFIRCIREFIF:rJR
ERP,OREEEIs:tR,
:
:•
:
:
-1.9S927,.- 1,4S913 2.e9236 e.57323-- e.91B72-2.5S721-2.7e963 7.e2144-e.21466-1 . ?•e:.•sg•
2.e1g3s e.7gess-e.45e64-6.4951S •3.24:-51-fi d 97 5,64
-• e. 6y aa. 3-1.E34-.-•6 :.4Z.1:-7-e.42e49• ?.17672•- 2.2?.414 e. S l l Ln 7
•- 1,14e57 e. g B "Js y
i.e•eeeE 4.3529• ?-1.713E9
Ht•IHLY$' I 3' ---------d--------"----------hri------------------"--------p--------p"-----------------P-- Åë.'OURC:E a.S [i,.F. N.$. F--RHTIe -----.---...dP-----.--..-.--.-.-----.-.--.--.------..d--"-.-.---.--.-..--------------.-----""-.-- REGRE:i'P.IrJtU:i44C..t;•:::v:1:-il E• 2yff,74.4:?g•42 2:;.:?•.:?•gcl:?•]3 RE5'IOLIHL ICel.:.',"..ig:t2•v:g :Mt ?•.E,::st:•t::s':-- Tl:ITHL 1$lt::-'S.1iE•EtE:1 :)7• ----------hpt--------------------\---p------------------------------h--"-------"-v----------blULTIPLE Ci)RRELfiTION C:OEFFICIENT tri.9:a,41g••COEFFIC:ENT OF- DETEFIr,IINRTICtN e.Yty•:!•4e
)o

50
combination of C,, C2, C3, Dt, D2, D3 against log(RRT). The author
have performed the multiple regression analysis by using thechromatograms of perkins et aii.i'38) The RRT caicuiated from
the chromatograms exhibited by perkins et ali.i'38)are shown
in Table r!-3. And the results calculated by the multiple
regression analysis are shown in Table II-4. This multiple
regression analysis program is the commonly used software
from "Personal Computer Program Library Vol. 3" published byKogakutosho, Ltd., Tokyo.41) ":NPUT DATA" in Table !!-4 are
the data of RRT ( written as column Y ), and acyl carbon
number in, position l ( written as X(1) ), position 2
( written as X(2) ), position 3 ( written as X(3) )e and also
number of double bonds in position 1 ( written as X(4) ),
position 2 ( written as X(S) ),'position 3 ( written as
X(6) ) from Table II-3. "REGRESSION EXPRESSrON" corresponds
to equation (22) and the coefficients of each term are
determined. "Y & Y" is the actual RRT and the predicted RRT
by multiple regression analysis, respectively. In this case,'p6sitionai isomers sueh aslii66 8 and l6s 02 can be
1182 160distinguished ( see sample PPL and PLP in Table rr•-3 ). But
if the positional isomers eannot be distinguished, each
coefficient i.e. Cn and Dn will become equivalent. So if we
rewrite Pn as P and P'n as P', the following equation can be
derived from equation (22):
iog(RRT)= P(Ci+C2+C3)+ P'(D,+D2+D3)+Q
=P(CN)+P'(DB) +q (23)This equation (23) is actually the same with the definition
of ECN (or PN) since P'IP corresponds to the coefficient -2
in ECN (or PN).
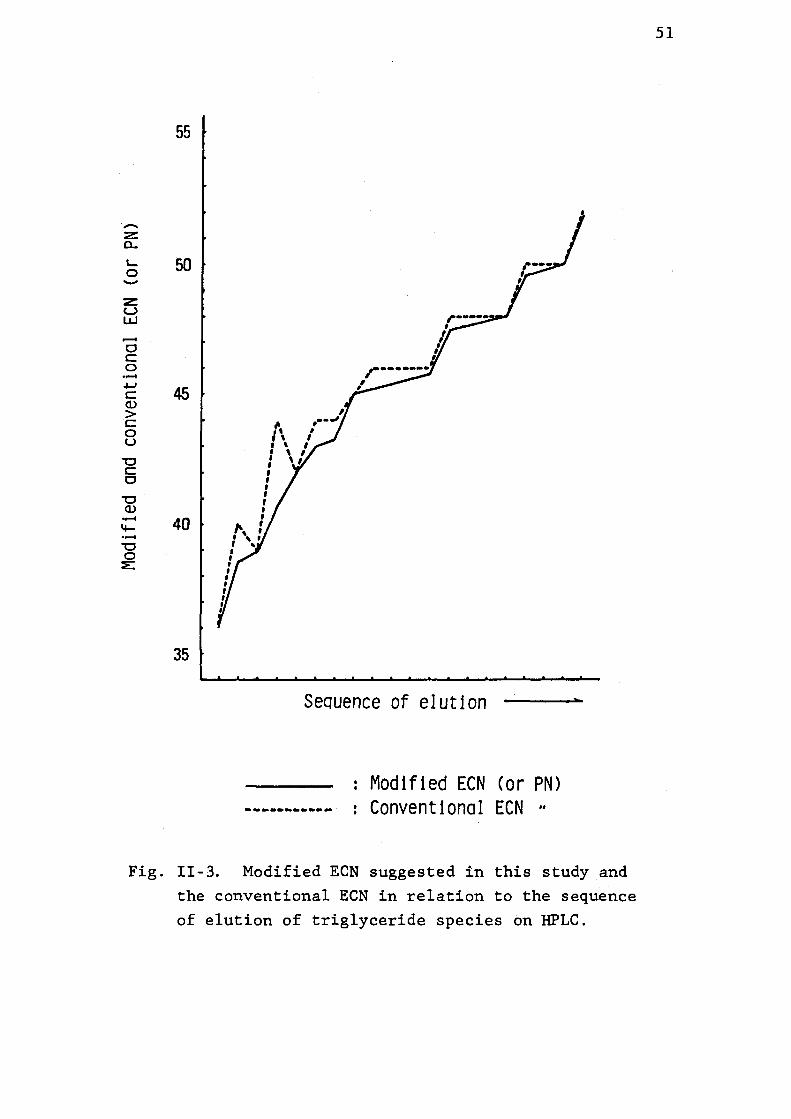
•AZaLovZvw-vco-eh-t
"=Åë>coUvcovo.e--
-.v-.-
vo=
55
50
as
40
35
t"x :t '
:ee
i
r•, i tSs
:e
:e
ie
e-"t te t
e'
t
ee!eeeee-e
tee-ee ' ttt
at
-ebett
Fig.
Sequence of elution '
- :Modtfied ECN (or PN) ----------- : Conventional ECN "
rZ-3. Modified ECN suggested in this study andthe conventional ECN in relation to the sequenceof elution of triglyceride species on HPLC.
51

Finally, we have induced the cpnclusion of ECN '(or 'from Martin's theory.
Back to the results in Table TI-4 "REGRESS:ON
EXPRESSION" was 5.57391 for Ci, 5.90109 for C2, 7.00699
C3, -11.63260 for Dt, -13.40241 for D2 and •-15.40738 for
Accordingly, if we do not consider about the positional
isomers, from equation (23): - 11.63260+13.40241+15.40738 L P'IP
This
(or PN)
5.57391+5.9 109+7.00699 ratio i.e. --2.2 is near but not
definition ratio which is -2.
Limitation of the ECN (or PN) Concept
By changing the equation from (22) to
limitation in positional isomers will be released
exampie,lii g32i and i32t gdil cannot be distinguished
equation (23). And what is more important,
cannot be distinguished also after changin
(23). Adding to this, the ECN definition ratio
integral number which is -2. This implies
molecular species exist that have the same
regression coefficient on equation (23) which
least it is possible to distinguish the following
has the same ECN (=38):
llii (A) es ogt (B) '
Namely, by using coefficient -2.2, ECN' of (A) becomes
60-2.2xll=35.8 and ECN' of (B) becomes S8-2.2xlO=36.0.
author have performed a sequence simulation on HPLC of
!I-3 by using equation (23). Results are shown in Fig.
As it is clear from this Fig. II-3, all the molecular
52
PN)
for
D3 .
-2.1882 . -2.2
equal to the ECN
(23), the
. For
ing•i g,i and 2.l g2]l
g the equation
was an tthat a lot of
ECN. rf we use the
is •-2.2, at
case that
The
Table
II-3.
'specles

53
in Table Ir•-3 become irreversible ( shown as a solid line ).
Zn conclusion, we might say the coefficient of phe ECN
should•not be an integral number, and this coefficient.is
affected by the analytical conditions employed. This was alsosupported by the latest work done by Toya et ale3)
The matrix model might be the invariant rules that
controls the sequence in elution of molecular species on
HPLC.

54
CHAPTER•Ilr
LECrTHIN MOLECULAR SPEC:ES rDENTIFICATION PROGRAM
FOR THE PERSONAL COMPUTER
' So far, the matrix model, namely, the formulae that 'control the sequence in elution of individual molecular
spesies on HPLC have described.
The next step of this study was the efficient progress
in the rnolecular species indentification on HPLC
chromatograms by utilizing these formulae. A personal
computer was introducted for this purpose. NEC personal
computer Model PC-8001 ( NEC Ltd. Tokyo ) was used.
Section 1. Lecithin Molecular Species rdentification
Program Version I.
' At first, the slopes of the formulae ( formulae (8') and
(9') in chapter r ) were set by analyzing the data of
lecithin molecular species on HPLC that had been accumulated.
And the intercepts of the same formulae were all determined
by the regression analysis. The identification program was
designed by using these slopes and intercepts. Though this
identification program was a concrete form of the
chromatographic rules presented in chapter r ( equations (8')
and (9') ), there were some identification errors. Zt was
observed that in some cases, specifically in the case of
tetraene group, there were seme deviations as shown in Fig.
rrl-1 resulting in the errors for the molecular species
identification. The main reasons were considered to be the

55
following two:
1. When the peaks overlap, it is hard to determine the
RRTs of positional isomers.
2. Both "r3 and ur6 type fatty acids exist in tetraene groups
that make the large deviation of RRT.
So, it can be concluded that the thorough development of
instruments i.e. the column, the pump etc. of HPLC are
required in order to clearify the RRT differences in
positional isomers as well as the differences in ur isomers,
and to complete the molecular species indentification program
that exactly reflexes the equations ( (8') and (9') ).

56
Section 2. Lecithin Molecuiar Species Identification
Program Version rr.
Though it was found to be hard to design a computer 'program that strictly follows the chromatographic rules
presented in this study due to the inadequate imformation of
RRT between the isomers or the inadequate reproducÅ}bility of
RRT on the present HPLC, a more practical identification 'program based on the collation with the deposit data were
designed. !t runs as follows as designated in Seheme III-1:
At first, the fatty acid composition data of the
colleeted peak on HPLC was entered ( shown as B in Scheme
:Z:-1 ) aÅíter initialization ( shown as A ). Then the
identification subroutine starts running according to the
priority order of identification that goes as follows:
1. Search the same molecular species in the data file and
when there is, then print out the RRT of it that meets
the condition of ct which restricts the range of RRT that
has entered from the keybord manually ( shown as C-1 and
D, E ). Thi•s is called "PREDZCTED BY S. T. D. RRT" in
Program III-1.
2. rf not in the case of 1, search the molecular speeies that belongs tolg2 dd2il( or fi' gS ) group, and then
generate a regression line as shown in Fig. Trr-2.
After that, print out the RRT of it that meets the
condition of C( ( shown as C-2 and D, E ). This is called
"Liner prediction routine" as well as "RREDICTED BY
3-VAR. LrNER METHOD" in Program IT!-1.
3. If not the cases eÅí 1 and 2, search the molecular

57
GENERALFLOW SUBROUTINE
Initi'alization of variables. A"
Searchspec1es
the in
the GLe fatty
samethe
molecularda'ta fi1e.
Enter
C-•1 .), Ve
results ofacid.
" x' >tc
B
"
Prediction of RRT. (Subroutine) c
1
Searchspec1esto
a
xC2
the molecular that belongsd,
d2
group, and regresslon
or :' gij
then generate 1ine.
Enterct manually. D
J
Print outRRTcondition
thatmeetsofa.
the E
1
To continue ornot. F
C-2•Sk
1
J ve*
Generate aand search
paral1elogramthe vertex.
C-3)vle.
1 't's'*
Searchspeclesdefined asintroducethe
the molecular that can be
d,
d2
theregresslon
, Thenslope of 1ine.
C •- 4ÅÄvc
1",'e
Impossible. C-5
Scheme
>'e Searched. ele*
Zrr-1. Flow chart ofidentification prograrn
Not
the for
searched.
Ieeithin moleeular species the personal computer.

t PRINT "IF YOU WANT TO ONLY PREDICT ONE M.S. RRT THEN ELASE , OF L!NE 75":DELETSe"1`):3!iiptP p.,.G,. RRT, ..pREDIos. pRos, .RIAIvt l.A.sT vERS,lo.N. ,(.EVERY WAY.)
6e WIDTH8ig•,25:CbNSOLE,.,O,,.1-:COLDR7,e,'1,:,P.RrNT 1 HRst'i2) :LOC'ATE"'1eile :PR:tNrr ,"MLECULER SPECIES OF DI--GLYCERI•DE DETERMINATION."ELPER".:LOCATE le,12:PRINT "PROGRAMEDBY M.E. 19B3.10.18.":LINE(16,G6)-•(13e,S.4),PSET,B7e LOCATE 15,18:PRINT "INITIAL:ZE PHASE": ' GOSUB 7pme72 PRINT CHR$(12)75 'INPUT CI,nl,C2,D2:GOSUB leee:PR:NT PR,ME$(M):GOTO 7K.Se FOR Inl TO 1e :FC(I)=e:FD(1)=e:FPU)ne:FOR J=1 TO le:MM(:,J)=e:ML(:,J)=e:NEXT J:NEXT ::PR:NT CHR$(12)9e PRINT ::NPUT "SAMPLE NAME IS ";SN$:INPUT "HPLC PEAK NO. IS "INS:PR:NT ::NPUT":NCLUDrNG F.A. NO.";Nlee PRINT :FOR 1=1 TO N11e PRrNT "F.A. NO.";I:rNPVT"CARBON NO:";FC(:):INPUT"DOUBLE BOND NO: "IFD(:):PR:NT :NEXT rsPR:NT CHRS"2)12e PR:NT "SAMPLE NAME : ";SN$:PRINT :PRINT :PR:NT "HPLq PEAK NO. :";NS:PR:NT ":PR PEAK':PR:NT "CALCVLAT!NG NO. ";S:S=S+1:PRINT :PRINT ":NCLVD:NG F.A. OF THrS:NT13e FOR I=1 TO N:PRINT "F.A. NO. "lr;:PR:NT " "sFC(1);":";FD(I);" ":NEXT 1:PRrNT :PR:NT "OK":PRINT14e rNPUT "REAL RRT OF THIS PEAK"IRT:PR:NT :PR:NT "NOW CALCULATING PHASE"tPRINr15e FOR 11=1 TO N:FOR JI=1 TO 11:Ct.FC(:1):C2mFC(Jl):DlxFD("}:D2=FD(Jl):GOSUB 1eee:MM(:1,Jl)=PR:ML(r1,Jl)gM:NEXT JItNEXT I116e BEEP:PRINT "CALCULATION ENDED":PRINT17e :NPUT "ENTER MAX. OF ALPHAn;KsPR:NT18e FOR r=1 TO N:FOR Jmt TO I:IF ABS(tvlM<1,J)•-RT)<K THEN PRItNrr nlesFC(";N:";FD(1
jl,l,;;" : PRII IT, , ,;." : ; FC` "' ; " : " ; "D` "' ; "AE.; ili,, ., e, ;,R,R;t:,!1,:, tl;,i:S; J, l,;A,,t7LPHA:"'" s,vM< i , J> -RT :P
19e NEXT J:NEXT 12ee AN•S--"yes":!NPUT "ANY MORE PREDICT:ON ";AN$t:F AN$m"yes" THEN 17e21e AN$="yes"::NPUT "ANY MORE CALCULATION ";AN$::F ANS:"yes" THEN 8egee 6oTo seleOe '-------------------•-- PR Calculation --------------'-'---'--"-----d-"1e1e K=e:K1=e:K2=e:PR=e:M=1lelS :F DI>D2 THEN C=Cl:D=Dl:Cl=C2:Dl=D2:C2urC:D2=Dle20 rF (Dl=D2 AND CI>C2)THEN C=Cl:D=Dl:Cl=C2:Dl=D2:C2:C:D2=Dle3e FOR 1=1 TO SN:IF DI=SDS:,2)AND D2=SD(:,4) THEN K"tK+1:SS(K)"::NEXT : ELSE NExT rle7e FOR :=tl TO K:IF CI=SD(SS(:},1) AND C2mSD(SS(:),3) THEN PRisSD(SS(r),5):Mm2:GOTO 12ee' ELSE NEXT 1leBe FOR :=1 TO Ks:F CIsSD(SSU),1) THEN KImKl+t:Sl(Ki)"SS(I)1eB5 rF C2=SD(SS(1),3) THEN K2=K2+1sS2(K2)=SS(I)le9e NEXT :illei :F KI>---2 OR K2>=2 THEN 60SUB 40ee:GOTO 12eei13e :F FO(n1,[t2,1)nt THEN T1=LOG(SD(FO(D1,n2,4),5))X43.429:T2m(C1d-SD(FO(D1,D2,4),1))XFO(n1,[I2,2):T3=(C2-Sn(FO(O1,P2,4),3))XFO(D1,D2,3):FRpt1eA((T1+T2+T3)11eO):M=5:GOTO 12ee1145 IF K<>e THEN PR--1eA((A1X(C1+C2)+QQ(nl,D2))/1ee):M=3:GOTO 12ee115e M=1:PR---e12ee RETURN4eee '--b------------------------ Liner prediction routine -----'-"--`----"---"---4ees sx=e:sy=e:xx=e:yy=e:xy=e:M=44elO :F KI>---2 THEN FOR 1=1 TO KI :X=SD(Sl(I),1)+SD(SltI),3):Y=LOG(SD(Sl(:),5))X43.43:SX=SX+X:SY=SY+Y:XX=XX+XXX:YY=YY+YXY:XY=XY+XXY:NEXT•I:KS=XX-SXXSX/Kl:LS=XY-SXXSYIKI :MS=YY-SYXSY/Kl :A4=LS/KS :B4=SY/Kl-•A4XSX/Kl :R4taLS/SQR (LSXMS)4e15 SX:e:SY=e:XX=e:YY=e:XY=e:Pl=(Cl+C2)XA4+B4:Pl=leA(Pl/lee)4e2e IF K2>=2 THEN FOR I=1 TO K2 :X=SD(S2(1),l)+SD(S2(I),3):Y=LOG(SD(S2(:),5))X43.43:SX=SX+X:SY=SY+Y:XX=XX+XXX:YY=YY+YXY:XY=XY+XXY:NEXT I:KS=XX-SXXSX/K2:LSsXY•-•SXXSY/K2 :MSmYY-SYXSY/K2 :A 5i=LSIKS:B5 :SYIK2-A5XSX/K2:R .rc. =LS/SQR (LSXMS)4e25 P2=(C1+C2)XA.sc+B5:P2=1eA(P211eO)4e30 IF KI>K2 THEN PR=Pl ELSE :F KI<K2 THEN PR=tP2499e RETURN7eee '--------------------------- PR Calculation rnitialize ----•-----•-•--•-b---"-'"---7ee5 SN=69:K=e:K1=e:k2=e:PR=e:T=24:A1=7.665e9:PR=e'7ele DIM SP(SN,E),SS(IE),FO(6,6,4),DS(T,2),Q3(T),QQ(7,7),FCCIO),FD(le),FP(le),MM(le,le),ML(le,le)7e20 FOR 1=1 TO SN:FOR J=1 TO 5:READ SD(r,J):NEXTJ:NEXT 17e3e FOR 1=1 TO T:FOR•J=1 TO 2:READ nS(:,J):NEXT J:READ Q3(I):QQ(DS(I,1),DS(I,2))=Q3(1):NEXT I7e4e FOR :=1 TO 5:READ ME$(1):NEXT I7e5e FOR I=1 TO 5:READ DO,DT:FO(DO,nT,1)=1:FOR zz=2 TO 4:READ FO(DO,DT,II):NEXTII:NEXT r7e6e FOR I=1 TO 2:FOR J=1 TO 2:READ PS(:,J):NEXT J:NEXT r9e4e RETURNleeee '------ DATA SET OF STO. D.G. RRT ( MEAN OF DATA ) FROM D.G. BOOK ----leele DATA 16,e,16,e,2131ee2e DATA 14,e,18,1,141.B,18,e,1e,1,295.2,16,e,18,1,2e8.7B6,1S,e,1B!1!175.7,16,e,17,1,175.7,16,e,16,1,148.45,14,e,2e,1,212,16,O,2e' ,1,3el.91ee3e DATA 14,e,18,2,1ee,16,e,16,2,111.7,16,e,1B,2,145.7,17,e,18,2,167.9,1B,e,18,2,2e2.9,2e,e,1B,2,2B8.6iee4e DATA 16,1,1B,1,138.26,18,1,1B,1,1•91.1751ee5e DATA 16-,1,18,2,1Oe,1S,1,18,2,135.45s2.e.,1',18.,2,18S.11ee6e DATA 16,O,1,B,3,Ue..6,1B,e,18,3'1,i52,.91 ee 7' e nATA 16 ,e ,2e ,.e , 122 . e57 ,.1 6 ,e ,22', ,4 , 1321. 9: i ;' 8t. e ,2e ;4 , 1'" ". 55 "8 ,0 , 22 ,4 ,1 91 .7
1au•DATA 18,1,IB,3,99.9 '1ee9e DATA 18,2,1S,2,97.9letee DATA 14,e,2e,5,63.85,15,e,2e,5,77.B,16,e,20,S.,91.S667,14,e,22,5,82.3,16,e,22,5,122.28e,1B,e,2e,5,137.1331e11e DATA 16,1,2e,4,76.9,18,1,2e,4,114.951012e DATA IB,2,IB,3,7e.41e13e DATA 14,e,22,6,68.9143,15,e,22,6,e2.8333,16,e,22,6,98.77,17,e,22,6,121.65,1e,e,22,6,147.6Slel4e DATA 16,1,2e,5,6e.B4,1B,1,2e,5,e6.e125,1S,1,22,:,114.2,2e,1,2e,5,125.4,24,1,2e,5,265.7,16,1,22,5,7B.61e1sc •DATA 17,2,2e,4,78.4,1e,2,2e,4,82.7ieS6e nATA 16,1,22,6,65.95,17,1,22,6,ae.12,1B,1,22,6,91.S25,2e,1,22,6,137.31O170 DATA 18,2,2e,E,6e.85,17,2,22,Je,7B.5,18,2,22,S,79.4jle18e DATA 18,2,22,6,66.B3331e19e DATA 2e,4,2e,5,52.3,2e,4,22,5,741e2ee [IATA 1S,3,22,6,49.71e21e nATA 2e,5,20,5,37.33,2e,S,22,5,51.5,,22,5,22,E,,78.41e22e DATA 2e,4,22,6,52.725,22,4,22,6,71.11e23e DATA 2e,5,22,6,41.e4,22,5,22,6,5S.76671e24e OAtA 22,6,22,6,44.6Ble5ee t•---------------•-------•- Q3 DATA •--------------------•-------------•-------••-•-----------1e51e DATA e,e,-1i.369,e,1,-2B.418,e,2,-45.81e,1,1,--47.7e9,1,2,-63.869,e,3,-56.93,e,4,-72.2S,E,e,5,-7B.3e3,1,4s-eE.423,2,3,-91.215,,e,6,-91.93Bi,1,5,-97.eB45,2,4,-99.553,1,6,--11e.e12,2,5,--t13.45f,,2,6,-124.747,4,5,--l34.785,3,6,-136.999,5,5,-i49.3481e52e DATA 4,6,•-151.SS2,5,,6,-t6e.477,6,6,-172.366,1,3,-76.e1S49,2,2,-77.8345le60e '------•----•------•--- METHODS ------•----•-------------•-------------------le61e DATA "IMPOSSIBLE TO PREDICT.","PREDICTED HY S.T.D. RRT","PREDICTED BY (Dl,D2) METHOD.","PREMICTED BY 3-VAR. LINER METHOD.","NETWORK' PREDICTION"le7ee '---•---•-•-------------•-- NETWORK [tATA ---•------------•-----------------------1e71e DATA e,2,7.623S..5,5.77e32,12,e,4,B.1379e,1.84811,23,e,5,8.24843,5.51i94,29,1 ,5 ,.8 .e1 82i ,5.E61 67 ,43 ,2 ,5 ,8 .ee)eee , 5e .778ee ,5Ble72e '------•--•------------•---•- NAME OF VARIABLWE ------•-•-•-----------------•--------le73e DATA "Cl","Ol","C2","D2"lesee sTople9ee END
Program Ul--1. Lecithin molecular species identification program for the personal computer, written in N-BASIC. uoo

59
RRT
1620
e:o:4
1820
1622
:o:4ee:o:4
18:O22 :4
e
RRT,
36 38 40 Total acyl carbon numberFig. III-1. Deviations in tetraene and saturate cornbination group.
-ee---d--:,
::::::t
32 34 36 38 co Total acyl carbon numberFig. IIT-2. RRT prediction by the regression line.
RRT
-..-... -eeeee-e--dP-d.-e.pde.---eee -de" d- " -"-" -"-" --e-- ted-
d-"-.-e
:--tet-eel--
-e--d
----
. 18 :4 t--t .x- 20:4-e 22:4 - - -- -- --
18 :O
16 :O
'''ee'
te-
Fig.
32
III-3.
34 sa Total acyl
RRT prediction
38carbon
by the
4C)number
vertex
42
of a parallelogram.

60
RRT
150
1OO
50
A
eResult of the program
identi fi ca tion
Actual RRT
Seqyence of elution
RRT
15
1oo
50
ECN
so
25
20----.7
' -----------v tsts
/
B
Reversed point ,, i /' --s -le---ee- th t t -vt tt ' e---e-----" t-
el
te
tlt--lt
tt
.'
t
Actual RRT.ECN
t
-----e-- .-e
Sequence of elution
Fig . IIr-4. Results (RRT predietion) of the lecithin molecular species identification program in relation to the sequence of elution on HPLC.Sample is of sardine muscle.

61
species that can be defined as dd2i and then search the
molecular species that can generate a parallelogram
(network) as shown in Fig. II:-3, and print out the RRT
of the vertex molecular species on the parallelogram
that meets the condition of O( ( shown as C-3 and D, E ).
This is called "NETWORK PREDZCTrON" in Program rl!-1.
4. If not the cases of 1, 2 and 3, search the molecular species that can be defined as g; as it has been done
in 3. Then, introduce the slope and the intercept (shown
as Q3 in Program rll•-1) of the generalized regression
line and print out the RRT that meets the condition of ar
( shown as C-4, D, E ). ThÅ}s is calied "PREDrCTED BY
(Dl, D2) METHOD" in Program rZr-1.
5. Impossible ( shown as C-5 ).
Finally, it goes back to the main routine that continues
or ends up the identification prograrn. The whole view of the
program is shQwn in Program rll-1. The results obtained by
this program were compared with the results obtained from the
actual analysis of sardine muscle done by enormous labor.
Fig. !II-4A illustrates the good agreement between the actual
analytical results shown by solid line and the
identification via personal computer shown by dots. And for
the comparsion, ECN (or PN) is also shown ( shown by the
broken line in Fig. UI-4B ). None of the reversed point in
RRT was observed in this example by the presented
identification program making good contrast with those of ECN
(or PN).
Although, in some cases, there might be some rare
missidentification, this personal computer program is sure to

62
be
are
of great help in
generally found.
predicting the molecular .specles ,that

63
CHAPTER IV
MOLECULAR SPECIES OF FrSH MUSCLE LECITHIN
' ' So far, the formulae that control the sequence of
elution of lipid molecular species on HPLC have been
demonstrated. It has been proven that the matrix model
presented is invariant. And this matrix model forms the bases
of molecular species identification of muscle lecithin from
fish sources that will be discussed in this chapter.
The characteristics of each fish from the view point
molecular species of muscle lecithin is discussed with some
supplemental analysis such as principal component analysis.
Section l. Experimentsl
Total lipids were obtained from the fish muscle
tabulated in Table IV-1 according to the method of Bligh &
Dyer. Neutral lipid composition and phospholipid composition 44•t47)were measured by the Iatroscan-Chromarod Method. The
developing solvent used were n-hexane/diethyl ether/formic
acid ( 85:IS:O.5, vlv ) for the former and chloroform/
methanol/ammonia/water ( 70:30:2:3, vlv ) for the latter.
Phospholipid content was determined by multiplyÅ}ng 25 to the
phosphorus content of the lipid which had been determined by
Fiske-Sabbarow method. Preparation of pure lecithin,
hydrolysis of lecithin into diglyceride, and derivation to
diglyceride acetate from diglyceride were done in the same
manner as shown in chapter I. HPLC fractionation and
identification of molecular species of each peak on HPLC were

Tab1e :V-1. Fish examined
Sampl es Mean body len9thLocality of
'
andcatch
weight..
Date of catch.
Sardinesisa9!S!J.ngREdiosmelanosticta
20.0cm,Kamiiso
17.1cm,Kamiiso
80g, Hokkaido.
43g ', Hokkaido. '
July
oct. ,
1982
1983
Mackerelscomber japonicus
•41.8cm, 647gKam"so, HokkaSdo
32.2cm, 409g 'Todohokke, Hokkaido
July
oct.
1982
1983
A
' Big-eyedParathunnus
tuna, Frozenobeu.s
11O.Ocm, 20kgfrom the market
1,OO.Ocm, 24kgrndian sea
.
.
BrownLimanda
solelf!Lgrryg.!.nggerria
23.7cm,Kikonai
21.2cm,Kamiiso
169g, Hokkaido
207g, Hokkaldo
oct
May
. 1982
1983
SandLlnanda
flounderPY!lgStA.!2EE:!!!Atsa
18.3cm,Karn"so
18.6cm,Abuta,
65g, Hokkaido
139gHokkaido
Dec
May
. 1982
1983
B
Rockbebastes
M•fishstEn!.sgglichl 1i
19.6cm, 187gToi, Hokkaido
27.0cm, 471g'Kamiiso, Hokkaido
oct.
July
T982
1983
' Alaska pollackth9treE!A.ragachalcogranvna
44.0cm,Uchiura
41.7g,Shikabe
61Og bay, Hokkaido
509g ••, Hokkaido
Dec
Jan
.
.
1981
1984
• Churn salmon,thcorhyncus keta
Churn salmon, rh ncus keta
Ma1e
Fema1e
65.0cm, 3500g Akkeshi, Hokkaido 42.7cm, 1367g45e59'•-49029tN, 167007'•-175930'E
4s4.6s'
g8,C.M.4'g.i ig9t3Ng, 'i67oo7,-i7s63o'E
June
Aug.
tl
1980
1983
c
Blue sharkPrionace.gLreaysguca
114.5cm, 8.5kq38e30'-39030'N, 155000tE June 1982
Mackerel sharkLamna cornubica
88.5cm, 1O.2kg41O30'-•43OOO'N, 175e30'E
July 1982D
CarpC rinus .car lo
23.0cm,from the
175gmarket •
Sep. 1980
Rainbow trout.Esi1!!!!gmogAt.tn!!ng!l.!irdnen irideus
33.8cm,Nanae,
38.0cm,Nanae,
455gHokkaido
780gHokkaido
Sep.
May
1982
1983
E
A:
D:
Migratory fishCarti 1 ag'i nous
.
fish.
B: Bottorn fish
E: Fresh .c:water fish.
Hard to classify.
64

also done
available
verify the
in the same manner
in identifying the
results.
though a
molecular
new matrix
species in
model
order
65
is,
to

66
Results and Discussion
Section 2. Characteristics of Muscle Lecithin of Fish
The yield of total lipid and the percentage of each
lipid class against total lipid are shown in Table rV-2 and
Table IV-3. Fatty acid composition of diglyceride acetates
which represent the fatty acid composition of lecithin are
shown in Table :V-4 and Table rV-5. Samples shown in these
tables were subjected to the lecithin molecular species
analysis.
HPLC chromatograms of each fish are shown in Figs. IV-IN '6 and the detected molecular species of lecithin in sequence
of elution on HPLC with the percentage data and those of
mg/100 g muscle are shown in Figs. rV-'7tv32.
As illustrated in Fig. ZV-1, the HPLC ehromatogram of
diglyceride acetate of fish muscle lecithin can be devided
into four molecular species groups, that is, :: molecular
species composed of highly unsaturated fatty acids such as
20:5 or 22:6, for instance (20:5)(20:5), (20:5)(22:6) and
(22:6)(22:6), III: molecular species composed of generally
found fatty acids such as 16:O or 18:1 with combinations of
20:5 or 22:6, that is (20:5)(18:1), (18:1)(20:5),
(22:6)(18:1), (18:1)(22:6), (20:5)(16:O), (16:O)(20:5),
(22:6)(16:O) and (16:O)(22:6), and II and rV: others. As it
is evident from the chromatograms ( see Figs. IV-1,v6 ),
groups I and III accounts for at lesst 60% of the molecular
species examined'. Specifically, as shown in Fig. IV-1 and
Fig. rV-7, groups I and XZI of the sardine white muscle

Tab
leIV
-2•
Lipi
d co
mpo
sitio
n of
fish
mus
cle
in 1
980•
-198
2
exam
ined
,ca
ptur
ed
-Li
pid
Non
-pho
spho
lipid
**P
hosp
holip
id**
Sam
ple
Yie
ld*
TG
FF
AS
TN
Pot
hers
PC
PS
+P
EP
L.ot
.hei
'`s
Sar
dine
(D"v
l)26
.892
.5O
.4O
.41.
73
.7l.8
trac
e
Sar
dine
(WM
)4.
383
.1O
.51.
82.
08
.62.
6O
.2
Mac
kere
l(DM
)5.
872
.5•
O.9
O-.
3O
.34
.68.
52.
6.
Mac
kere
l(WM
)O
.932
.02.
72.
51.
233
.29.
45.
6
Big
-eye
dtun
aO
.713
.4O
.21.
7tr
ace
59.4
9.0
O.5
Bro
wns
ole
1.7
62.2
5.4
2.3
O.7
16.o
3.1
3.4
San
dflo
unde
r1.
364
.1O
.92.
04.
218
.8Ll
O.6
Roc
kfis
h1.
458
.82.
5O
.5O
.318
.53.
85.
0
Ala
skap
olla
ck1.
042
.711
.445
.6tr
ace
81.2
trac
e1.
7
Blu
esha
rkO
.61.
1O
.26.
01.
356
.520
.16.
2
Mac
kere
lsha
rk2.
048
.92.
21.
91.
523
.18.
513
.9
Car
p1.
655
.5tr
ace
6.7
trac
e29
.112
.42.
7
Rai
nbow
trou
t3.
372
.71.
1O
.5O
.111
.75.
0O
.4
See
the
*g/1
00g
abbr
evia
tions
in th
e op
enin
g.
mus
ele.
**g
/100
g to
tal l
ipid
.a N

Tab
leIV
-3. L
ipid
in 1
983-
-198
4
com
posi
tion
of fi
sh m
uscl
eex
amin
ed,
capt
ured
Lipi
d•N
on-p
hosp
holip
id**
Pho
spho
1ipi
d**
Sam
ple
Yie
1drk
TG
FF
AS
Tm
eoth
ei's
PC
PS
+P
EP
Lot
hers
Sar
dine
(DM
)3.
353
.81.
92.
11.
211
.227
.72.
1
Sar
dine
(WM
)'O
.829
.2O
.34.
86.
312
.144
.35.
0
Mac
kere
l(DM
)20
.090
.9O
.2O
.41.
32
.44.
5O
.3
Mac
kere
l(WM
)8.
592
.0tr
ace
O.6
O.9
4.6
O.6
1.3
Big
-eye
dtun
aO
.56.
43.
813
.42.
811
.757
.84.
1
Bro
wns
ole
O.9
20.0
trac
e6.
02.
117
.554
.0O
.4
San
dflo
unde
r1.
762
.92.
53.
03.
47
.9i8
.61.
7
Roc
kfis
h1.
679
.etr
ace
1.0
O.2
3.5
13.4
2.9
Ala
skap
olla
ckO
.73.
63.
09.
82.
626
.747
.07.
3
Rai
nbow
trou
t2.
569
.81.
01.
1O
.28
.917
.61.
4
For
chu
m s
alm
on, s
ee T
able
IV-9
.S
ee th
e ab
brev
iatio
ns in
the
open
ing•
*g/1
00g
mus
cle.
rkr
kg/1
00g
tota
l lip
id.
a oo

Tab
le !V
-4.
fr
om
F
atty
leci
thin
acid
of
com
posi
tion
fish
mus
cle,
of d
igly
cerid
e ac
etat
eca
ptur
ed in
198
0-19
82de
rived
Sam
ple
Sar
dlne
Mac
kere
tB
tg.e
yed
Bro
vnS
and
Roc
kA
lask
aB
lueM
aske
ret
Car
pR
atnb
ov
Fat
tyac
id-o
u
Wou
wu
tuna
sote
tlo
unde
rfts
hpo
ttark
sal-o
nsh
ark-
shar
k•tr
out
12:O
o.0
7
14:O
:.09
1.48
o.ge
t.39
O.7
22.
00:.5
4l.1
12.
693.
271.
041.
301.
11o
.97
15:O
O.3
7O
.26
O.2
8O
.63
O.6
Se.
goO
.34
O.3
tO
.69
o.1
7
l6:e
IB.4
232
.35
3e.s
22-
.42
25.6
022
.70
29.1
426
.50
41.S
835
.19
22.8
234.
Se
32.2
829
.70
t6:1
O.7
4l.7
e2.
t3e.
75a.
48l.9
51.
S3
6.5t
O.5
7O
.45
5.40
3.60
2.59
3.3
0
17:O
O.8
2e.
52O
.56
O.5
21.
46t.2
21.
09t.3
3O
.37
l.e4
O.4
5tra
ceo
.3S
17:t
e.48
O.5
0O
.45
O.7
9Ll
lO
.90
O.9
1e.
49O
.43t
race
o.3
2
18:O
5.99
Lll
e.go
4.29
O.9
2l.9
3t.4
1t.6
3O
.82
O.7
88.
932.
803.
ee3
.46
18::
IS.6
96.
SO
4.22
I2.e
97.
24:O
.24
8.27
16.4
9t2
.32
6.26
le.0
4lt.3
e'16
.7t
29.7
5
18:2
1.e9
1.S
4O
.45
t.34
O.5
6O
.2t
O.6
6O
.46
O.3
3e.
77e.
6o9.
068
.6e
:9;l
19:
2 2
0:O
'
20:
l
20:
2
20:
3
20:
4
2e:
5
22:
1
22:
2
22:
3
22:
4
22;
5
22:
6 2
4:2
24:
3
24:
6
VnN
'nov
n
e.4S
1.93
3.5
0
1e.4
7
1.3
7
3.3
9
31.5
7
e 1
.63
e.2t
.44
e.34
1.26
O.9
4
o 2 ;3
o o
1 30
.30
.7: ,
I.96
.9e
le.6
4
.62
.45
.76
.42
O.3
7
O.4
2
1.1
1
34.9
e
O.3
2
tA5
3.37
ll.08
l.l4
2.1
6
35.7
0
O.3
3
1.3t
t.2si
*O
.97
**
5.27
7.4
3 6
4.58
3t.6
d 27
5.7
S
O.4
4
45.5
6
O.2
4
O.6
6
e.3s
o4.
51 2
ZO
.69
15
O.3
0
O.2
:
97 59 .89
.73
.77
O.2
1
O.2
9
O.5
6**
1.6S
**
3.54
O.S
8t3
.S3
16.7
9
e.8
3
1.3
4
24.2
1
O.3
5
O.5
6
O.7
t
e.35
:.Isk
*
t.45
1.07
3.6
0S
.79
tO.9
2
e.
13
l.7
0
O.5
5 O
.89
6.01
19.9
3 39
.62
24.5
6 O.2
4
trac
e
trac
e
2.o
e
trac
e
4.8
a
tt.30
trac
e
trac
e
trac
e
2.5
e
24.9
0
l.16
O.8
2
3.e5
.6.3
9
1.1
7
20.6
7
t.u
*rk
O.I8
t 1 1 a 1 o o o o o t4 o o
3t 13 32 a6 79 te 05 07 31 S3
69 56 06
* F
eedi
ng o
tgra
tions
Ma1
e.
**E
tber
20:
O o
r'20
:1
DM
: Dar
k nu
scle
. VM
: Vht
tenu
sc1e
.
a v

Tab
1eZ
V-5
from
. Fat
ty a
cid
leci
thin
of
com
posi
tion
fish
mus
cle,
of d
igly
cerid
e ac
etat
eca
ptur
ed in
198
3•v1
984
deriv
ed
+T
.-.-
--.-
--.-
-tt+
--ttT
Ht-
"tt
--=
----
--.-
.nt-
--+
-HP
-+rk
..-H
-'---
----
v--+
.--
-.-+
---.
-.--
-+--
tN--
t-.
-T-
---e
n-
Snm
pte
Sar
cli
neM
acke
rel
Big
-eye
dB
row
nS
and
Roc
kA
l,i.fi
kaR
nit}
bow
Frlt
t,Y;J
Åëi
cll)M
WM
1)M
l,IM
tvlla
sole
floun
der
fish
pol.1
ack
t,rot
tt
14:O
I.08
;.20
".92
O.8
3o
.75
2,77
'1.7
7
t.0
32.
t3t
.27
l5:O
e.41
O.4
3O
..33
O,3
1o
.4g
I.07
o.sr
,o
.32
O.3
4o
.22
lc,:a
24.0
!3G
.38
2t.1
528
.17
33,2
{34
,"3l
.22
33,4
129
.al
36.7
3
16:1
1.43
t.25.
1.42
1,34
t.o
o7.
552.
393
.76
1.96
3.o
:
17:O
O.5
1U
.50
O.7
8O
.43
1.7
51.
781.
llo
.74
O.4
6o
.23
l7:1
O.4
1O
.33
o.rJ
7O
.69
o.8
4O
.84
O.9
1o
.64
O.3
6o
,t5
t8:O
O.8
8O
.71
5.44
3.05
2.2
S2.
381.
701
.99
O.7
4l
.81
18;1
5.02
2.I1
;5.9
3tO
.24
23.0
21l
.31
1O.7
7IB
.93
I3.3
4;2
.8;
l8:2
O.4
9O
.60
l.89
O.9
9o
.67
O.4
6O
.70
1.4
0l.2
35
.97
19:to
rl8:4
O.:7
O.5
1O
.47
o.3
1O
.33
o.3
7O
.45
e.6
3
19:2
O.1
7o.
'roO
.28
G.2
3O
.49
Q.2
5
20:O
O.il
O.3
31.
30O
.23
o.1
21.
051.
86o
.34
20:l
O.1
2O
.72
o.9
8O
,07
2.24
o.7
53.
02o
.15
20:2
.o.
tlO
.t4o
.33
O.0
8O
.06
o.2
1O
.l4o
.30
20:3
2.99
O.1
24.
26O
.13
o.t3
4.64
O.I7
o.1
8o.
oc,
2.9
9
20:4
O.;5
2.35
3.74
5.f)
6O
.19
4.70
3.8
72.
21o
.29
20:5
18.8
5l4
.20
l6.4
116
.78
3.7
418
,53
25.1
210
.02
24.4
65
.90
22:l
O.1
1O
.27
22:3
O..2
1O
.10
o.2r
Jo
.28
1.32
O.7
0o
.19
O.2
4o
.22
'
22:4
O.9
1O
.71
O.8
0O
.70
2.5
1O
.35
O.4
1o
.47
O.1
1o
.2r)
22:5
1.08
O.9
82.
461.
85o
.43
3.71
2.62
1.I8
O.5
6l
.04
22:6
36.e
637
.24
24.6
829
.11
21.0
67.
l39.
8920
.26
l8.6
825
.35
othe
rs4.
98O
.23
O.2
0O
.08
o.0
6O
.28
O.2
to
.05
O.O
lo
.09
DM
:D
ark
mus
cle.
wM
: wht
tem
e.ss
c1e.
N o

ro to
SA
RD
Ime
ec a
.(D
ark
mvs
cle)
to sm
e1m
e rc
a.
{"ht
te m
uscl
e)
se n
vn
toee
min
I 1 2
II I
IIIV
roto
4,3
56 S
AR
DIN
E e
c b.
(Dar
k nv
scle
)
coco
sm
oiN
E n
c b.
{Nht
te "
uj$c
te)
1co
min
roto
eeoo
1co
min
r:
Irr:
I!&IV
:
Gro
ups
Gro
ups
3:(2
0:
Oth
ers
com
pose
d of
com
pose
d of
5)(1
6:O
), 4
:
. Fig
. rV
-1.
high
ly u
nsat
urat
ed fa
tty a
cids
,
high
ly u
nsat
urat
ed fa
tty a
cids
(1'6
:O)(
20:5
), 5
:(22
:6)(
16:O
) an
d
H]?
LC c
hrom
atog
ram
sa:
Cap
ture
d 'in
198
2.
that
is, 1
:(20
:5)(
22:6
),
and
gene
rally
foun
d fa
tty
6:(
16:O
)(22
:6).
of s
ardi
ne m
uscl
e b
: Cap
ture
d in
leci
thin
.19
83.
2:(2
2
acid
s
: '
6)(2
2
that
:6)
is
. '
N p

20
20
ro
I II
III
12
3di
IV
tlAC
KE
meL
PC
a..
CD
ark
mus
cle)
60 m
in
mex
xeeL
ec
a.{w
htte
nvs
cle)
ro 20
to Lo
uekR
ÅíL
nc
b.
(Dar
k m
uscl
e)
seco
ncxx
neL
?c b
.
{Mttt
e m
uscl
e}
1co
rin
co
4o
so1o
o m
in
60 m
in
Fig
.IV
-2.
HP
LC c
hrom
atog
ram
s of
a: C
aptu
red
in 1
982.
Num
bers
as
in F
ig. Z
V-1
b .
mac
kere
l mus
cle
leci
thin
.: C
aptu
red
in 1
983.
h..J

.....
ro ro
to
Fig
.
to
BR
ouN
soE
pc
a•
se60
min
SA
ND
mom
oER
PC
a.
eo80
mS
n
TV
"3. H
PLC
chr
omat
ogra
ms
mus
ele
leci
thin
.
a: C
aptu
red
in 1
9.82
.
Nun
bers
as
in F
ig. I
V-1
.
III
III
1
IV
2 20to
4 6
se
BR
owN
soE
pc
b.
co1o
o m
in
ro
4o
of b
row
n so
le a
nd
b: C
aptu
red
in
SA
ND
FLo
vND
ER
ec
b.
60
san
d
1983
.
co 1
oo m
in
f1ou
nder
su w

Fig
.
pa mu ro
'-.-.
)L
"
BT
G-E
YE
D T
UN
A P
C a
.
eoto
sta
o
Aus
xx r
oLta
cx n
c a.
se
CA
RP
rc
to m
in
I II I
IIr-
-kN
- t-
T-,
'1
2 20 ro 20
co
40
-..:N
5
co
IV
LO
se
6 .s...
..
60
BIG
-EyE
D T
urm
ec
b.
eo1o
o
Aus
ua r
ouzc
K e
c b.
S20
ILO
tn;n
seco
Ioo
MIN
BO
U T
RO
UT
ec
;ro
1co
n'n
6060
co m
in
1oo
;ro
ntn
IV-
4.
mus
c1e
Car
p is
Num
bersH
PLC
chr
omat
ogra
ms
of b
ig-e
yed
tuna
, ala
ska
polla
ckle
cith
in. a
: Cap
ture
d in
198
1. b
: Cap
ture
d in
the
sam
ple
of 1
980
and
rain
bow
trou
t is
the
sam
ple
as
in F
ig. I
V-1
.
,car
p an
d19
84.
of 1
983.
rain
bow
trou
t
N )

ro ro ro
co
RO
CK
FIS
H P
C a
.
so
BLu
e S
HA
RK
PC
co1o
o m
in
se
RA
INB
OW
TR
Our
PC
a.
co
min
Fig
.
40so
loo
inin
I II
III
12 ro
IV
4 3 to
ZV
-5. H
l?LC
chr
omat
ogra
ms
ofm
acke
rel s
hark
and
rai
nbow
trou
t
a: C
aptu
red
in 1
982.
b:
Blu
e sh
ark
and
mac
kere
l sha
rkN
umbe
rs a
s in
Fig
. IV
-1.
roto
6
mex
Fis
H e
c b.
coco
hAC
xxR
EL
SH
AR
K P
C
ooco
RA
meo
w T
Roo
r pc
b.
1co
min
1oo
min
ro L
O 6
0ro
ck fi
sh, b
lue
shar
k,
mus
cle
leci
thin
. 1
983.
are
the
sam
ples
of 1
982.
co1o
o m
in
v u

76
I II IH IV
--r-pt'-s 6
1
2
20 to
5
4CHUM SALMON PC, MALE
(Feedtng m1gratlon)
60 co 1oo min
CHtnVl SAUVtON 'PC, FEMALE
(Feed!ng mtgrat!on)
20 40 60 80 1oo min
Fig '• ZV-6• HPLC chrornatograms of ' Both are the samples of 1983. Numbers as in Fig. :V-•1.
chum salmonmuse1e leeithin

Fig.
77
%!pc
(20:5)
(20:5)
(22:6)
(22:5)
(20:4)
(20:3)
(22:4)
(16:1)
(22:6)
(16:1)
(i4:O)
(i8:1)
(20:5)
(16:O)
(22:6)
(16:O)
(16:O)
(20:4)
(16:O)
(18:O)
(18:1)
(16:O)
(20:5)
(22:6)
(22:6)
(22:6)
(22:6)
(22:6)
(22:6)
(20:5)
(16:1)
(22:6)
(22:
(22:
(16:
(20:
(16
6)
6)
o)
5)
:o)
(22:
(22:
(16
6)
5)
:o)
(20:
(22:
(16
4)
6)
:o)
(18: 1)
10 20 30
As•rii Lsi,as,:::J.•.,usn:•,,'•",,•l,T,.•u.,•is:T•:.7.,•l,s•[tT;,!lnn.r•,s]ast•ES•Sl•'•,v",:•, tt,v-p.r-t•
,i ,.N'",,'",S,',,,,,,,,,",isS.,,',,S,,,S,sS,S,,,,,,S.S,",,,S,S,',",,,S,S,
i.LL.LLL
tt- -- t-Ltlt
-t-'tt-t-tt-T--t
,1-
Julyi982•:-"k:]Oct,1983lthliH-t s'idL-ii-d-
t1tli
tx,,e,S-l'-t
=----,s',,' si s',,' s'tt',,-
me -Ll=]-Li
.T,;"rr,"T;-V:":,,,,,i:T,-;TT,Trr,,:"t:,,-C':,-,,,-tieUXi,,,t1U'",,ust-4-,'",l,'','V' -----.v,,,,s,,,x,s,t,,,,,,,,,,,,,,,M,,.,,,NT,IY,,,":,":'S":,,s,,,s:e;,X,",,.wwL-
"`tr---t matU-l2Ltmmt':t-lt-mst,--i"--lx"--u--"Je--i-t-tl,1----"-t-t"U-ll.IH:L
,,,-il"1.1--lte--T----
lti
IV- 7.
lecithMolecular
.In ., zn
.speclesrelative Z.
composition of sardine dark muscle

Fig.
78
%/pc
(20 :.
(20:
(22:
(22:
(20:
(20:
(22
(16
5)(20:
5)(22:
5)
6)
6)(22:6)
5)(22:6)
4)(22:6)
3)(22:6)
:4)(22:6)
:1)(20:5)
(22:
(16:
(14
6)(16:1)
1)(22:6)
:O)(22:6)
(22:6)(18:1)
'(18:1)(22:6)
(16:
(22:
(16:
(22
(16
(16
O)(20:5)
6)(16:O)
O)(22:6)
,: 5) (16:O)
:O)(22:5)
:O)(20:4)
(1 8: O)(22:6)
10 20-' r----'v--
,•,,.;;rs,",iK,,ps,.,ilx,i"lysN,,"s,,,-1-t------ltlttl--1--U""-i---A--.
,,s:X•SCn,•,,u,tl,wwM,t,cu,t",,,,, S-n.se-- ,s',,NNN',,,s,sL .tt -s,-,-s
,
,st
July1982
.-,
f;mst,v,;s-:;r,"t,clL.=l,L'th:,.SJ Oct,1983
-tt,
',,=,,,,".;,,tt,,,;T,VX,,,llXlli
N-pt---- th------tpm :="•u•"•.ys,'tSlf-----r- .
'•'y•th•'•'"':•"•1'llvF:tN'•S'il'I•tll.;iTT't'iY.'I'••'sT'TuY'`ts,l'lili]tt:,illSt•nyN•pm
--t"- nt --e,•
•,NE,ll••t"•..,"""',••,,'•'•,,:.l,Si••li•l!lil,s,",wst,,•dt',C;i;,,,,,•",il•i$ll,XS`iit•,,•,Ft;il,n,iX,IEIi•,t,i,s'•"',•s,-,i.•,•.ww••"s•••'tr,E,s,:t,•, TV-t.H.---tei-t
-"-
30 40-' V-----.-rt.w
---: :----:-=
IV-8. Moiecular speeies 'Zecithin, in relative Z.
--compos1tzon of sardine white muscle

79
(20:5)(20:5)
(20:5)(22:6)
(22:6)(22:6)
(20:5)(22:5)
(22:5)(22:6)
(20:3)(22:6)
(22:4)(22:6)
(16:1)(20:5)
(22 :6) (16 :•1)
'(16:1)(22:6)d4,o) (22,6)
(16:1)(20:4)
(20:5)(18:l)(18:1)(20:5)
(22:6)(i8:1)(18:1)(22:6)
(16:O)(20:5)(22:6)(16:O)
(16:O)(22:6)
(18:1)(20:4)
(22:5)(16:O)
(16:O)(22:5)
(16:O)(20:4)
(l7:1)(22:6)
(20:5)(18:O)
(18:O)(20:5)
(22:6)(18:O)
(18:O)(22:6)
(18:O) (20 ': 4)
(18:1)(16:O)
(16:O)(18:1)
%/pc
10 20
----
'
----i -- -
.-- --- -4 -- -- i- -i-- -- -- -- --+----itt--
ss',',44-
,,t,'-.L.,,".,s',.'s,S,.,',S,',
d-- t, --
'
---. ----- -- ---
x.:,
',sv
,s.
'---
--- c= July 1982jtl"dc/a't-Ul':i'llt tSl' X"- oct, 1983
.-s---
sSN'. -i
. ,,.,..s
's -i--i SN
. ,, ,,..S.N,..S
,., NSVtVsS''s'"N.NSS
,I-t-
---i -t -t-i- -it
---t-- --J ----- q- -Slt--
.,s,i-- -s-,-.-i-t---1-1
tv --
-t-t--'u3.
, .. ,. ,s.'..•
.vs' -Si,.,,.,.,,.
sx---
.
',s--
---d"-- ---s--t-----1----4t-
, .NV. .,
's"k --- -d -- --
t--i-t- -d.
-----
-L----L-t4tt--.---idny---i----d-----
-i-/i
,--
SlkS--1
,
?,q--
Fig. rV-9• Molecular specieslecithin, in relative Z.
composition of mackerel dark muscle

F .:g•
7o/PC
10 20 30
(20:5)
(20:5)
(22:6)
(20:5)
(22:5)
(20:3)
(22:4)
(16:1)
(22:6)
(16:1)
(14:O)
(16:1)
(20:5)
(18:1)
(22:6)
(18:1)
(16:O)
(22:6)
(16:O)
(20:4)
(22:5)
(16:O)
(16:O)
(20:5)
(18:O)
(22:6)
(18:O)
(18:O)
(18:1)
(16:O)
(20:5)
(22:6)
(22:6)
(22:6)
(22:6)
(22:6)
(22:6)
(20:5)
(16:1)
(22:6)
(22:6)
(20:4)
(18:1)
(20:5)
(18:l)
(22:6)
(20:5)
(16:O)
(22:6)
(18:1)
(i6:O)
(22:5)
(20:4)
(18:O)
(20:5)
(18:O)
(22:6)
(20:4)
(16:O)
(18:l)
,
'"1',S,,':Vt:
., ,, ,NS ,, .-, ,'s S
---
iS--
N''
,
L
+
+-
-- a July'i-S-' S',,S,-i,S:.,
l--tSll-oct,
19821983
s
- -.s
v
, N
-i - 1
N s, ,s 's ' '
x ..' - '. .- ', ,,'. ,,', ,,, . ., s -- -
'• st
,- kls ,,
--it l--- 1- ti
.,
.
s s,
". uS v:,,
,
.
,i-
ZV-1O.
lecithMo1ecu1ar
""ln, zn
.speclesrelative Z.
composition of mackerel white
80
musc1e

Fig.
--- r'e:• 1]•,y
10
%/pc
-"- rH---------T20 30
81
'(20:5)(22
' (22:6)(22
(20:4)(22
(22:4)(22
(16:1)(22
(15:O)(18
(17:O)(22
(18:i)(22
(16:O)(20
(22:6)(16
(16:O)(22
(16:O)(22
(16:O)(22
(18:O)(22
(18:O)(20 ' (18:l)(18
(i8:i)(16
(16:O)(18 ' (16:O)(16
' Unknown
(16:O)(l8
IV-11.
Iecithin,
:
:
:
:
:
:
:
:
:
:
Le
,
'
'
,
'
'
'
,
,
,
,
,
',
1
,
t
e
6)
6)
6)
6)
6)
1)
6)
6)
5)
o)
6)
5)
4)
6)
4)
1)
o)
1)
o)
o)
-- ---:-==
r-'-.-"---'"-F-r----ny--`"
rmt---".-1-t-ll-et-t
=]'s"
------H.
t- -lt -
-1-1S,
-lttll
,,"II
ke
]
-----
, 'rr',rms,,,,, e-== :]
-tv,
i-t -t --si t-t
:==]
I]FL•:tll-l,1,i///Ii•l,iN
xtw-
Ana1yzedAnalyzed
'K' S, 'nX's',,KS,
in
ini9811983
- pt•" •,k:`;x• [:• •,,':ss'swwrw, ,, I,]sl asss!sisE,xsr"'cs;,'zv,x, ",:El,scr,s"cg","TT•,f• 'r:, ., ,,s. •,,•,,•, , ,•, , •,, , •. =,. ,•, S,.' l,,k,s'xx::,"'
' -,t .,N i, ,`,X ,'
-• T-r'
- - 1 --
t--
ts"'et-
- --
-"- x
••• •s,••1!y
NT"
I;1
iwwt U I't S:tL:S, 's S t
b
-' i-r't-r-tr'vrt'rr'',,', ,' ,,' s',,' t's',' ",Vs',,'!'ny,',,K't,'
,IEI]
l
•A
"-j-
Molecular speeies in relative Z.
•x••':,:SllX•Åí;.s•z•"••:rff
'+ rt-- tt
L:
. --compos1t1onof big--eyed tuna musc1e

82
(20
(20
(22
(20
(20
(16
(16
(14
(22
(14
(15
(20
(18
(22
(16
(22
(i6
(22
(16
(16
(18
(16
(18
(16
:5)(20:5)
:5)(22:6)
:6)(22:6)
:4)(22:5)
:5)(22:5)
:1)(20:5)
:1)(22:6)
:O)(20:5)
:6)(14:O)
:O)(22:6)
:O)(20:5)
:5)(i8:1)
:1) (20:5)•
:6)(18:1)
:O)(20:5)
:6)(i6:O)
:O)(22:6)
:5)(16:O)
:O)(22:5)
:O) (20:4)
:O)(20:5)
:O)(16:1)
:O)(20:4)
:O)(18:1)
10
y,/pc
20 30-- )
,s,tt
s
'tl
-es-1t-
's's ,tt
's' [.:rj oct, 1982e-Sbf-l-t
reti"F'.'•i"sl:'Elll] May 1983
-t-,
,
,x, -- Si,S,
----- t- t,NEY-"
--,N'4-s''-! ,' ,sss,s•s ts,,s •s,s s'',,,s,,,,,,,,
s ,1 ts-tl
-1- t--te ,,,t,s,s,,s,kk,,,TS"S,,"J -l-l
t-tst
'sS' s""", -- tlS-e-.tlttS-ltSttSi-
-S-"nt ,e--s.,',,',-s,',,S,"t,sS,
"2,•,XM
'LF,l'tz:, ,,
Fig. IV-12• Molecular specieslecithin, in relative Z.
cornposition of brown sole rnusc1e

10
%/pc
20 30 40
83
(20
(20 'tt
tt(20tt
(22
(20
(16
(16
(14
(20
(18
(20
'(16
' 'tt
(22
(16
(16
(16
(18
(18
:5)(20
:5)(22
ttt ':5)(22 ' ':5)(22
tt ' ':3)(22 '
:1)(20
:1)(22
:O)(20
:5)(18 '
:1)(20 ':5)(16
'
:O)(20 ' ':6)(16
:O)(22
:O)(22
:O)(2Q
:O)(20
:O)(22
:5)
:6)
:5)
:6)
:6)
:5)
:6)
:5)
:i' )
:5)
:o)
:5)
:o)
:6)
:5)
:4)
:5)
:6)
--,:te--tstt'1
:-e--t,:s:S:tt,-lde
-" -"n-"'pm-pm
-,,s.:
i-e
-t-
",
tl-
-:s--s-
,"'s
:'v's,N.Y N,X,: S, , s's
antl /di- -i----t-ll,tSi,1S',N'i
Dec tMay
19821983
it- - X-S S-
t- -1 e-- ee.-um-- s t v i--e t t - t - t t vts ,-b -l -et --t -S-tt- -- tlti -t -X i- t --- N' ',, -tl - -- -e- t- tb- e-1 -- Xt nt t N-
nti4' t:'t,e',:tl"XS"St
'N,t S:-,,'e,:ts"
F"t"'•'ti•'k:'s's:'•:s:
tt:---st
;'i
Fig. rv-13.
IeeithinMolecular species, in relative Z.
composition of sand flounder muscZe

84
%/pc
(20:
(20
5)(20
:5)
(22:
(22:
(16:
(16:
(18:
(18
(16
(22
(16
(16
6)
5)
:5)
(22:
(22:
(22:
1)(20
1)(22
1)(20
:1)
:o)
6)
6)
6)
:5)
:6)
:5)
(22:
(20:
:6)(16
:O)(22
:o)
(16:
(18:
(16
o)
6)
5)
:o)
:6)
(22:
(20:
O)(20
:1)
(i6:
,(16:
(18
o)
5)
4)
:5)
(18:
(i6:
O)(18
:1)(16
(i6: O)(18
,,
1)
1)
2)
:o)
:1)
10
"--.
'
-rrrrn"Txusx'mult--t------tt--t--t-tit t- te-e--
v..
pt"t'-e-tt---nyt-t-t's""'S"i'
S",","'t,"t' SS,' S'ts',"s','-."--S"'t
Ss.--
-r.-tt'-se,e-i
S-1tStlt-l--
[:i:Il':-]
FkS,•'"I,3si;•s.sd:•••slt.]
,s,sN',,"iEi's-'-lt-
,1,,K[N;:l--1-- -. t-s--et
st-s--t--,--t--tts,stt,-,1-es,,,e-,-is-es-S'eS
"'s:N'ny,:'"'s,"s",",N',"'s,s,sssl,,NsL
ww-rrr'r',",,S.NS,,S,i",,,.,,1SsL,SS,'sS,,",N'sS'"sNSNS'"
,s,:,,:s,',:N".
,, ,, ,s,'.,s,'sNF.,s,'.,
,,s,-Lt
,' ,s,tl-
;AZI:]'tdtlt--tt-t
-t-te-l--
---- -]'•,'!••S
rrrm"rrrr'T'Tn-rrl:LSM:LX,un
-----t--
'st-,-t,'-"s',t',,'t-sS,i,X,-s'i,Kk:S,'xt,,'s',',,-,"s'-L
P-r-rww
L"
oct , 1982July
,
,,
--
1983
' ss
,, S,", V,: ,,SNS' 's 't NS
20 1
Fig. ZV-14. Molecular .specles composition of rock fish musclelecithin, .mre1 .atlve Z.

85
%IPC
(20:5)(20
(20:5)(22
(22:6)(22
'(20:5)(22tt
(16:1)(20
(16:1)(22 t. '(14:O)(20
(14:O)(22
(20:5)(18
(18:1)(20
(22:6)(18
(18:1)(22
(20:5)(16
(16:O)(20
(22:6)(16
(16:O)(22
(20:1)(20
(16:O)(22
(16:O)(20
(16:O)(18
10 20 30
:5)
:6)
:6)
:5)
:5)
:6)
:5)
:6)
:1)
:5)
:1)
:6)
:o)
:5)
:o)
:6)
:5)
:5)
:4)
:1)
--s- e-"-
,'•,, s, tF• S`• •,-•F, • •, '•"'• ••
,I N Se, ei, St s .-S
,'v
,N, S, ,t,, S, ' s'
,V,,V,N
x''
"N '
z", ", N,,S,,
b -t" ' s -t i Nt--i --- ' -i -
tl- 'TS-1'-t---t-i'L:tt:t
Dec-:, Jan
,
t•
19811984
--
-s- '-,
-l e S t tt- - -- ell- -t lt-
et-t-et t t
,, ,S, ,,-,, ,,,,,,,, ,,,, ,,, ,,S, ,N,X,,,,, ,S,SN, S,,,,,,, ',,IL ', t,, S, k, ,,S ,,,,,', ,,, ,S, , ,, , s s,N
,:- 1
t-tl-
pm- =]
,n, •, , ks•',E]
l- -t --
m,,,, t,, s, 1, ',
,, ,",,X:'s
Fig. rv-ls.
IecithinMolecular' species, in relative Z.
composition of Alaska pollack musc1e

Fig.
86
10 20
%/pc
30 40 50
(20:5)(20:5)
(20:5)(22:6)
(22:6) (22 :6)
(20:4)(22:5)
(20:5)(22:5)
(22:5)(22:6)
(16:i)(22:6)
(14:O)(20:5)
(22:6)(14:O)
(14:O)(22:6)
(17:O)(22:6)
(18:1)(20:5)
(22:6)(18:1)
(18:1)(22:6)
(16:O)(20:5)
(22:6)(16:O)
(16:O)(22:6)
(16:O)(22:5)
Unknown
(18:1)(16:O)
(16:1)(18:1)
di ' si--t-Tlild sdS-tdi-it-t-li-i
J- Lt t- - l ,f i- -i +- 1- -e -t -t-
+-llt-lt tlt
1, s
t-lt N' k-"1,-S-
==]----t--
JuneAug,
i- tLS-
VS"iV
-tl -- -t- -et-t- lt- tt -l- t-t-te et
e--z-- -/ti - t t-e -- lt -- it - - SI -t lt :- -- e--- l- -- -t -i -t --
i9801983
t -,l ',, ll, E- ',l t,, -., 'II S, -ll 1- tt -t, S- tll 'tt S, 'ti }, t-,'-l- S, i-- N, -s S, S- Ut S, lit Sl S, -., Sl '-, --l
'
:t--i1----1tl-li-tdt
,' i,' "tS,
rV-16. Molecular speciesleeithin at the stage of
composition of rnalefeeding migration, in
churn salmon
relative Z.mUsc1e

87
%/pc
(20
10 20 30 40
:5)(20:5)
(20:5)(22:
(22:6)(22:
(20
6)
6)
:4)(22:5)
(20:
(16:
(14
(14
(17
(18
(22
(18
(i6
(22
(16
(16
5)(22:5)
1)(22:6)
:O)(20:5)
:O)(22:6)
:O)(22:6)
:1)(20:5)
;6)(18:1)
:1)(22:6)
:O)(20:5)
:6)(16:O)
:O)(22:6)
:O)(22:5)
Unknown
(16: O) (18:1)
Aug, 1983
ny-.-..-----.r
Fig. ZV-17. Molecular speciesleeithin at the stage of
composition of femalefeeding migration, in
chum salmonrelative Z.
muscle

Fig•
%/pc
10
(20 :.
' (20:.
'(22: (16:
(16:
(i4: (i8: (15:
(17:
(16:
(20:
(16: ' (22: (16:
(16:
(16: (1 8:
(16:
(20:
(16:
(16:
(l8:
(18:
(22:
(16: (20:
(18:
(20:
(i8:
(18:
(20:
5) (20 :.
5).(22: '5)(22:.
1)(20:1)(22:O)(20:2)(20:O)(20: ' '1)(22i1)(20:5)(16: ttO)(20:6)(16: 'O)(22:O)(18:
O)(20:1)(22:O)(20:1)(20:O)(22:
O)(20:o)(2e,
1)(i6:6)(18:O)(i6:l)(22:O)(20:O)(22:1)(18:
O)(22:O)(18:
5)
6)' '
6)
5)
6)
5)5)
5)
6)
4)
o)
5)
o)
6)
3)
4)
5)
4)
5)
5)
5)
5)
1)
o)
1)
5)
4)
5)
1)
5)
3)
June 1982
TV-18. Molecularin relative Z.
.specles --compos1t1en of blue shark muscle
88
20
lecithin,

%/pc
10 20 30
(20:
(20
5)
i5)
(22:
(i6
(16
(l4
5)
:1)
:1)
:o)
(14:
(20:
(17:
(i6
o)
4)
1)
:1)
(18:
(16
(22
(16
(16
1)
:o)
:6)
:o)
:o)
(18:
(16
(16
(18
(i8
1)
:o)
:o)
:o)
:1)
(•2O
(22
:,5)
:6)
(22:
(20
(22
6)
:5)
:6)
(20:
(22
5)
:6)
(22:
(22
(20
(20(20
(16
(22
(20
(22(20
(22
(20
(18
Unknown(18:
(16o)
:o)
(20:
(20:
(18:
(i8
-(16
1)
o)
1)
:o)
:o)
(18: o)
(22(16
5)
:6)
:4)
:5)
:5)
:o)
:6)
:4)
:5)
:4)
:5)
:5)
:2)
:6)
:l)
(22:
(22
(18
(22
(18
5)
:5)
:1)
:5)
:1)
(20: 4),
July 1982
Fig. rv-19.
musc1e.
Molecularlecith 'ln
.specles ., ' zn
compositionrelative Z.
of mackerel
89
40
shark

90
%IPC
10 20 30
(20:
(22
5)
:6)
(18:
(20
(22
'(20
(16
(16
(18
(14
(16
(i8
(15
(18
(16
(16
3)
:4)
:5)
:4)
:1)
:i)
:2)
:o)
:1)
:2)
:o)
:1)
:o)
:o)
(18:
(18
(i6
(16
1)
:1)
:o)
:o)
(20:
(18:
1)
1)
(22:
(22
6)
:6)
(22:
(20
(22
(22
(20
(22
(22
(22
(22
(22
(22
(20
6)
:5)
:6)
:6)
:5)
:6)
:6)
:6)
:5)
:5)
:6)
:5).
(20:
(22
(22
(20
(22
(20
(22
(18
5)
:6)
:5)
:4)
:5)
:4)
:6)
:2)
Sep, 1980
(18:
(18
(18
(18
1)
:2)
:o)
:1)
(16: o)
(16
(16
(20
(18
:1)
:o)
:4)
:1)
(18: 1)
ii
Fig. IV-20, Molecular .specles composition of carp musc1e lecithin,
.zn relative 7e•
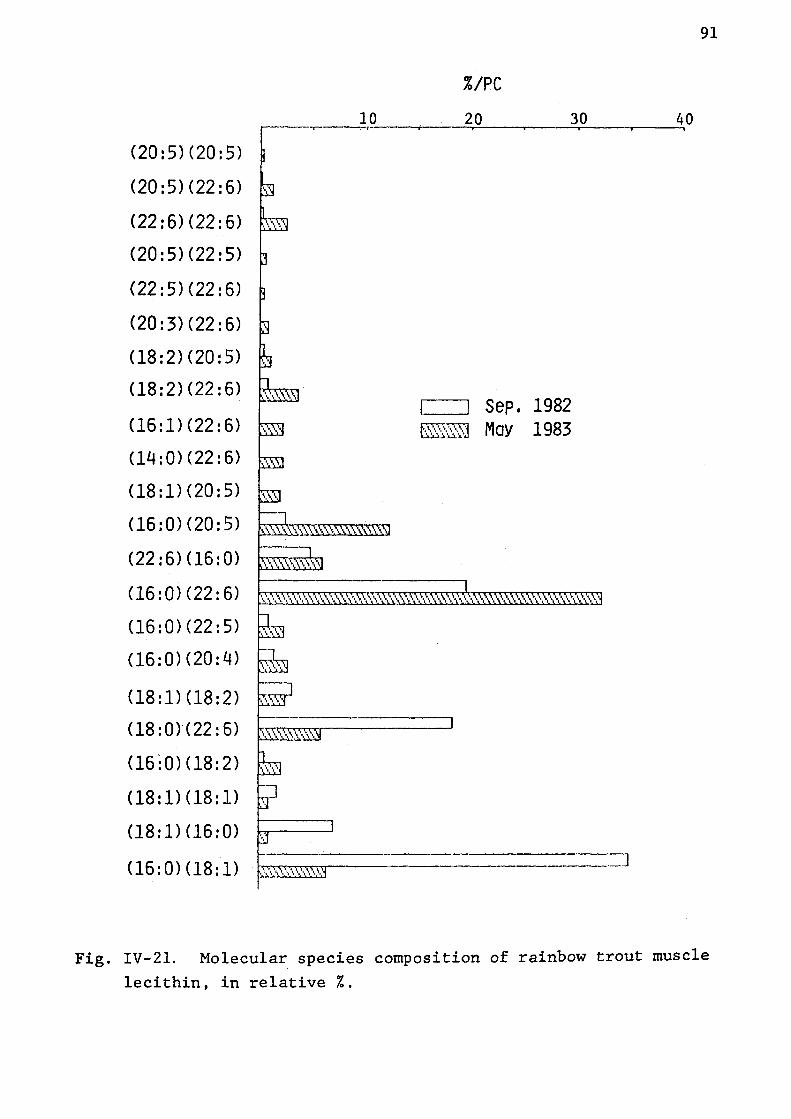
Fig.
(20:5)(20:5)
(20:5)(22:6)
(22:6)(22:6)
(20:5)(22:5)
(22:5)(22:6)
(20:3)(22:6)
(18:2)(20:5)
(18:2)(22:6) ' ' '(16:1)(22:6)
(14:O)(22:6) '(18:1)(20:5) '(16:O)(20:5)
(22:6)(16:O)
(16:O)(22:6)
(16:O)(22:5)
(16:O)(20:4)
(18:1)(18:2)
(i8:O)•(22:6)
(16 ;. O)(18:2)
(18:1)(18:1)
(18:1)(16:O)
(16:O)(18:i)
10
%/pc
20,r
et-
ttt,-t----tt
-1,s,,,,,s SePei9Mayi9,,,,,,,,, ""::,stul"rve
--t
SS1,:-
s,ZVk,,'k,,1,,,t,,'kNk,N
'e'r'T.'1"S",'",SS,' SS
pm,"""".,,,r,",,,,,,--It1---t--1l--StSt--St--I-ltte-tit--e--et-tt-i-tt--.-L
-- ------t -St- SSt--il1--
.kel'-tl-
,- s,1i---ie-
rl-' ,s'-'
-"---------"rrt'trmu,",,,,,
ew,,",",,,,
itle----"
,,
,' :-t edt4t1
1- l-t-,-eeltSltlSt -
30
il tl -- -t- -1 - k -t- - S - Sl -t
------ -]
40
91
IV-21. Molecular speeieslecithin, in relative Z.
--compos1tzon of rainbow trout musc1e

Fig.
92
100
mg/100g muscle
, 200 300 400
(20:5)(20:5)
' ' '(20:5)(22:6)
(22:6)(22:6)
(22:5)(22:6)
(20:4)(22:6)
(20:3)(22:6)
(22:4)(22:6)
(i6:1)(20:5) ' '(22:6)(16:1) '(16:1)(22:6)
(14:O)(22:6)
(18:l)(22:6)
(20:5)(16:O)
(16:O)(20:5)
(22:6)(16:O)
(16:O)(22:6)
(16:O)(22:5)
(20:4)(16:O) '(16:O)(20:4)
(18:O)(22:6)
(18:i)(16:O)
(16:O)(18:1)
---.---r-'-.--pt--
'1 -tt -- '--S k- N- S'--
,,", ,,,,sN'
--
,
,
sv
tI Ll:]ras,••:x=•i,i••:r,[•]
Julyoct,
19821983
t t- e -ts --t-
t e-tte
tl "- -- --te-t -- -
,,
'
rV-22, Arnount of each molecularleeithin, in mg/IOOg muscle.
.specles of sa.rdine dark musc1e

Fig.
mg/100g muscle
100
93
200
(20:5)(20:5)
(20:5)(22:6)
(22:6)(22:6)
(22:5)(22:6)
(20:4)(22:6)
(20:3)(22:6)
(22:4)(22:6)
(16:1)(20:5)
(22:6)(16:1)
(16:1)(22:6)
(14:O)(22:6)
(22:6)(18' :1)
(18:1)(22:6)
(16:O)(20:5)
(22:6)(16:O)
(16:O)(22:6)
(22:5)(16:O)
(16:O)(22:5)
(16:O)(20:4)
(18:O)(22:6)
,
==],.NS,'s '
,'N ,.S,
,,,"' u
Julyoct,
19821983
,
,n,S,
k' s, , N,!,,
:]
IV-23. •Amount of each molecularlecithin, in mg/100g muscle.
species of sardine white musc1e

Fig.
mg/100g muscle
(2O •: 5)
(20:5)
(22:6)
(20:5) '(22:5)
(20:3)
(22:4)(16:1)
(22:6)
(16:1)
(14:O)
(16:1)
(20:5)
(18:1)
(22:6)
(18:1)
(16:O)
(22:6)
(i6:O)
(18:1)(22:5)
(16:O)
(16:O)
(17:1)
(20:5)
(18:O)
(22:6)
(18;O)
(18:O)
(18:l)
(16:O)
(20
(22
(22
:5)
:6)
:6)
(22:
(22
(22
(22
(20
(16
5)
:6)
:6)
:6)
:5)
:1)
(22:
(22:
(20
6)
6)
:4)
(18:
(20
(18
(22
(20
(16
(22
(20
(16
(22
(20
(22
(18
(20
(18
(22
(20
(16
(18
1)
:5)
:1)
:6)'
:5)
:o)
:6)
:4)
:o)
:5)
:4)
:6)
:o)
:5)
:o)
:6)
:4)
:o)
:1)
20 40 60
•,,l---
's;,-'..''.ss,,
-ttsk,-,t-t-SS-n- ,1.', stn,ss
,s,.' sN,N' sS..,Ni'
ls,",
--- .
July1982'
Oct,1983s
's
-- x
,
,+-
x-sN'
-i-s-
'-s' s".
,S1SS,S'.,'
t----i----d-------t'
'.,,',.',',ss`
.i,.,,1'+,,L.,,k,' 1'..,v-
-d-- -- -- -q --1
',,",'".N"n'"','-
+.b--h.Ai' L.i-
ss,',
-tt-1----t
S1l.kS.,,-----------
ZV-24. Arnount
lecithin, .mof each
mg11OOgmolecular
muscle.
species of rnackerel dark
94
muscle

Fig.
(20:
(20:
(22:
(20:
(22:
(20:
(22:
(16:
(22:
(16:
(14:
(16:
(20:
(18:
(22:
(18:
(16:
(22:
(i6:
(20:
(22:
(16:
5)
5)
6)
5)
5)
3)
4)
1)
6)
1)
o)
1)
5)
1)
6)
1)
o)
6)
o)
4)
5)
o)
(16:O)
(20:5)
(18:O)
(22:6)
(18:O)
(18:O)
(18:1)
(16:O)
(20:
(22:
(22:
(22:
(22:
(22:
(22:
(20:
(16:
(22:
(22:
(20:
(18:
(20:
(18:
(22:
5)
6)
6)
6)
6)
6)
6)
5)
i)
6)
6)
4)
1)
5)•
1)
6)
(20:5)(16:O)
(22:6)
(18:i>
(16:O)(22:5)
(20:4)
(18:O)
(20:5)
(18:O)
(22:6)
(20:4)
(16:O)
(18:1)
20
mg/100g 40
musc1e
60 80 100
-- --------qq-,s,
--J"
.
.S.L.N'..S.S,'s ,- s,,' s..' s,,-q{--
s'
, .'
. July 1982-.
--lt-d1:-N-iii---s-ei-N-ti oct, 1983
-
., -
' '' kS, ,
'-i- --
.
i---tt,,
,' s.s.x". -s-
s
LS'
, -----J ,
'
1.' SV'til-- -,i- +--1
v
'
-
,-f--,
ZV-25.
IecithinArnount of eaeh molecular, in mgllOOg rnuscle.
.specles of rnackerel white
95
musc1e

Fig.
96
mg/100g musc1e
(20
(22
(20
50 100
:5)(22:6)
:6)(22:6)
:4)(22:6)
(22:
(16
(15
(17
(18
4)(22:6)
:1)(22:6)
:O)(18:1)
:O)(22:6)
:' 1)(22:6)
(16:
(22
(16
(16
O)(20:5)
:6)(16:O)
:O)(22:6)
:O)(22:5)
(16:
(18:
(18:
(18:
(18
(i6
(16
O)(22:4)
O)(22:6)
O)(20:4)
1)(18:i)
:1)(16:O)
:O)(18:1)
:O)(16:O)
Unknown
(16 :O)(18:O)
--
'
=]
s,
,s,
[ =]-t-vrr"-T'rr,,,s',v,,,s'l-lti-tt-lllttlt
is-e-
AnalyzedAna!yzed
in.In
19811983
-- tt', s s,si,,
--tt lt
-tt-
1-v
,
V,,N,
t l-
--
rv-26. 'lecithin
Amount of each molecular, in mg/100g muscle.
.specles of big-eyed tuna musc1e

(20
(20
(22
(20
(20
(16
(16
(14
(22
(14
(15
(20
(18
(22
(16
(22
(16
(22
(16
(16
(18
(16
(18
(16
:
:
:
:
:
:
:
:
:
:
:
:
:
:
:
:
-t
,
te
'
,
,,
1
'
,
l
.e
e
'
mg/100g muscle
50
5)(20
5)(22
6)(22
4)(22
5)(22
1)(20
i)(22
O)(20
6>(14
O)(22
O)(20
5)(18
i)(20
6)(18
O)(20
6)(16
O)(22
5)(16
O)(22
O)(20
O)(20
O) (16
O)(20
O)(18
,
'
'
'
,
,
I
,
,
'
,
,
'
,
,
t
,
'
.'
,
,
t
.
,
,
,,
t
,
,
,
,
,
'
.
'
,
,
'
,
,
'
,
,
,
,t
5)
6)
6)
5)
5)
5)
6)
5)
o)
6)
5)
1)
5)
1)
5)
o)
6)
o)
5)
4)
5)
1)
4)
1)
:-==- )-
,
,
- ---L--]
1
-
i-
,
-t
,
,
,
[= ]-i- Li-t'-----i1VS 'i '" ', V,
octMay
,s,
t-e- -
,19821983
,s ,s v', s', s'Ns sE, ,, s
s,
••M,s ,,,,,,,,,
--
"Sl ' S S, ', •,, S ',,
='
S, ,S, S, ,, ",
ti- tt
-"e
i•l•l•53
Fig. TV-27.
Iecitihi Amount of each molecularn, in mgllOOg musele.
.specles of brown
97
100
sole musc1e

98
(20:5)(20:5)
(20:5)(22:6)
(20:5)(22:5)
(22:5)(22:6)
' (20:3)(22:6) ' ' (16:1) (20 :5)' ' '
(16:1)(22:6)
(14:O)(20:5)
(20:5)(18:1)
(18:1)(20:5)
(20:5)(16:O)
(16:O)(20:5)
'(22:6)(16:O)
' '''
(16:O)(22:6)
(16:O)(22:5)
(16:O)(20:4)
'(18:O)(20:5)
'(i8:O)(22:6)
mg/100g
50
musc1e
Ss' s
-Ktt,-tt,
,,
t
[]d-
ti-t slt--l- s--tl--ttt-1-
Dec,May
19821983
:s,N'is,,s,Xs
-s,l,,=]
-et l---l-ttr"v't',,S',,',',,S'V'X,,,'S,tW''NSSblS'',i'kS,
-s:---t:
:]
,
,s,s•rm,,s,v,asIV•:T,ilKs,sK,,,U'XLL'Li''llU"'M3'
-'s'
s
,' s,S s'i,,ks'
La"L
100
Fig• rv-2s.
IecithinArnount of each molecular, in mg!100g muscle.
species of s and f1ounder muscle

mg/100g musc1e
10 20 30
(20:
(20
5)(20:
:5)(22:
(22:
(22
(16
(16
(l8
6)(22:
:5)(22:
:1)(20:
:•1) (22
5)
6)
6)
6)
5)
:6)
:• 1) (20 :
(i8:
(16:
(22
1)(22:
O)(20:
:6)(16:
(16:
(16
O)(22
:O)(22
(16:
(18:
(16:
(16
O) (20
O) (20
5)
6)
5)
o) •
:6)
:5)
:4)
:5)
1)(18:
:O)(16:
(16:
(18
(16
O)(18:
:1)(16
1)
z)
2)
:o)
:O)(18: 1)
', ,, L'
,
-et-v, '",x
,
,
-t 1
[=]tS ISi-ttStl- -- -- 11 -t t- -t l.
i---
oct,July
1982l983
e st tt--}i sx,
s
,ny 1 , -,tKskt s
== =,s, s,, ,, sSn s ', N
1
,
s,-t
•)
,
,
,
v
'L'i,' ".lst .LLS
Fig. rv-2g.
IecithinAmount of each moleeular, in mg/100g rrruscle.
.speeles of
40
ro/ek
99
so
fish musc1e

100
(20:5)(20:5)
(20:5>(22:6)
(22:6)(22:6)
(20:5)(22:5)
(16:1)(20:5)
(16:1)(22:6)
(14:O)(20:5)
(14:O)(22:6)
(20:5)(18:1)
(18:1)(20:5)
(22:6)(18:1)
(18:1) (22:6)
(20:5)(16:O)
(16:O)(20:5)
(22:6)(16:O)
(16:O)(22:6)
(20:1)(20:5)
(16:O)(22:5)
(16:O)(20:4)
(16:O)(18:1)
50
mg/100g muscle
100 150 200
--
''
,s
L=] Dec, 1981ge/li['s""1:,x'1tw Jan, 1984
,
s
=:=]-e
,
'v
l'
v,ttS,N,,,.N. ,,s
-
"nv(F35-N[S,i, -%-si-
:s,
]
Fig. TV-30•
lecithinAmount of eaeh moleeular, in mg!100g muscle.
.specles of Alaska pollack muscle

Fig.
50
mg/100g musc1e
100 150
101
(20:5)(20
(20:5)(22
(22:6)(22
(20:4)(22
(20:5)(22
(22:5)(22
(16:1)(22
(14:O)(20
(22:6)(14
(14:O)(22
(17:O)(22
(18:1)(20
(22:6)(18
(18:1)(22
(16:O)(20
(22:6)(16
(16:O)(22
(16:O)(22
Unknown
(18:1)(16
(16:O)(18
:
:
:
:
:
:
:
:
:
:
:
:
:
:
:
:
:
:
:
:
5)
6)
6)
5)
5)
6)
6)
5)
o)
6)
6)
5)
1)
6)
5)
o)
6)
5)
o)
1)
-tli
's' sS,V,,'s's'r,'
it- ee te- -l--et -t- --lt- le -
,
--
---s
kt i s -t Ss e
t-t
t- s-
1-- k! s,
-e- S- t-- -- '-1 tt ti l n '
==],,NS,X,'v,NV--- -llt
,, S, ',- S, 'i, t, ',, -",, , 't ', , ', ,
JuneAug,
19801983
.' k'i,'i,'t,'i-{,,5-' nX't,';,S,'kN,',--s,S"tt-1:sv,s,',ts-)t-s,s,r
,
-tt t-- -- -t -ls
rv-31.
Iecithin
Arnount of each molecular, in mg/100g muscle, at
. speclesthe stage
of of
male feed
chum salmon muscle
-- .Ing mlgratlon.

102
mg/100g musc1e
50 100
(20
(20
(22
:5)(20:5)
:5)(22:6)
:6)(22:6)
(20:
(22
5)(22:5)
:5)(22:6)
(20:
(18:
<18:
(16:
(14:
(18:
(l6
3)(22:6)
2)(20:5)
2)(22:6)
1)(22:6)
O)(22:6)
1)(20:5)
:O)(20:5)
(22:
(16:
(16:
(16:
(18:
(18
(16
6)(16:O)
O)(22:6)
O)(22:5)
O)(20:4)
1)(18:2)
:O)(22:6)
:O)(18:2)
(18:
(18:
(16
1)(18:1)
1)(16:O)
:O)(18:1)
----
,s, sS'
N
v ,"
s, s,
mu
t x,-
,,smu,,,, SSSSSSSSSJ
[=]Eilli'•.',:'i";..•vu,!•s'g
Sep,
May19821983
,rg,s:-["
-- "X" NS s,, ,N
v,, ,,s:!-rC,':'='"st,', t,,,,',ss ,,,s', ','s '' ,NS'. tt - s S-
"'iLS-sc
-•]i '• 'X
---• ====-:-=
,uat•,,,
i,r,rs"s,"i,,i,,
v•M
:::]
,
----.-t.-L----pu---" L ]Ie-]---"i-.,inl..-
-eww---,•,
::,,K,'t;,'iwr,,rv,,S:di, -----w-tnvpt-----------ww-'-i-'-N---t----" := :=I]
Fig. ZV-32,
lecithinArnount of each molecular, in mgllOOg muscle:
.specles of rainbow trout musc1e

103
accounts for about 87•v88%. These two groups might control or
represents the characteristics' of lecithin of fish muscle.
The left side chromatograms in Fig. IV-1 are the
sardines captured in summer ( July, 1982 ) and the right side
chromatograms are of those captured in fall ( Oct. 1983 ).
Though a supplementary experiment should be done to give a
conclusion, sardines captured in summer might have the
tendency to lose the molecular species which combines the
highly unsaturated fatty acid in position 1 such as
(22:6)(16:O) and (20:5)(16:O) compared with those captured in
fall.
Figure IV"2 shows the chromatograms of mackerels
captured in the same day with sardine. The characteristics of
this fish is the very complicated eomposition in group IV
especially in dark muscle. Molecular species of (16:O)(22:5),
(16:O)(20:4), (17:1)(22:6), (20:5)(18:O), (18:O)(20:5), '(22:6)(18:O) and (18:O)(22:6) can be named in this group '( see also Fig. IV-9 ). ' Figure :V-3 shows the chromatograms of bottom fish
eaptured in October, December and May. These fish are
extremely outstanding since the most predominant component of
these fish is (16:O)(20:5) instead of (16:O)(22:6) unlike
other fish examined ( see also Fig. IV--12 and Fig. rV-13).
The chromatograms of big--eyed tuna, Alaska pollack,
carp, rainbow trout are shown in Fig. :V-4, and the
chromatograms of rock fish, blue shark, mackerel shark,
rainbow trout are shown in Fig. rV-5. Throughout the
chromatograms in Fig. IV--4 and Fig. IV-5, (16:O)(22:6) is the
most predominant peak though in case of Alaska pollack, it

104
contains (16:O)(22:6) and (16:O)(20:5) almost equally ( shown
by arrows in Fig. ZV--4, see also Fig. IV-15 and Fig.
IV--30.). The similarity among fresh water fish and
cartilaginous fish is the very few content of group ! i.e. 'the molecular species composed of highly unsaturated fatty
acids such as (20:5)(20:5), (20:5)(22:6) and (22:6)(22:6)
( see also Figs. ZV-18'"21 ), although the former contains
less amount of molecular species that contains 20:5. The
content of group I differs significantly in the case of
big•-eyed tuna. This is seemed to be the result of differences
in days of frozen storage since other freshly prepared
migratory fish examined contains group : abundantly.
Figure TV-6 shows the chromatogrsms of chum salmon. As
it is evident from this Fig. rV-6, chum salmons under feeding
migration are extremely rich in (16:O)(22:6) ( see also Fig. ':V-•16 and Fig. IV-17 ).
Observations throughout Figs. :V-7.v32 give information
that the molecular species with the eombinations of saturated
fatty acids such as (16:O)(16:O) and (16:O)(18:O) are found
only in big•-eyed tuna. The reason why those are not found in
other fish is considered that the melting point of
(16:O)(16:O) or (16:O)(18:O) is higher than other molecular
species observed so that the liquid crystal conformation of
cell membrane composed of these saturated molecular species
might be convenient for the warm environment and inconvenient 'for the cold environment.
' Zt has been wide!y accepted that the amount of
phosphol'ipid of muscle is almost constant. But the
expressions by mgllOOg muscle of eaeh lecithin molecular

105
t SARDINE(Dark muscle)
SSs
SNs
sv
' SARDINE •(White muscle) ' ' .
Nt Nl Nl sl
; MACKEREL(Dark rnuscle)
ss' ,J..
t • MACKEREL(White muscle)
N" N v
lBrG-EYED TUNA i
".•;)- ----b- be
ALASKA
-p--dd-d- dpSNtst st s v
f'POLLACK
s
BROWN
t-l vttt
-t
fSOLE
.t
I CHUM SALMON, MALE (Feeding migration)
.k'-. -.- - .. --..-
fSAND FLOUNDER
:
tCHUM SALMON, FEMALE(Feeding migration)
ROCK
--tSs t st
fFISH
I BLUE SHARK
re'e.eest s"t
20:S 20:5 IY[ACKERE}L SHARK cAlitp ".RAINBollr TRouT lgl'? 2202ig
IN 1 Ns t ss ' -pt 16:O 22:6 'te".e'.-.'; C<.. "-"- 22:6 22:6 S8i•g ,,,, {gi,il
22:6One scale corresponds to 10Zllecithin.Fig. IV-33. Radar charts of the main molecular species of fish muscle
lecithins, in relative Z. . ' Solid lines are the ones captured in 1983'v1984, and the broken lines are the ones captured in 1980"1982.

106
species ( Figs. IV-22-32 ) shows that even the amount of
lecithin changes in a eonsiderable degree. ' As it is observed throughout the figures, predominant
molecular species are usually composed of 16:O, 18:1, 20:5
and 22:6 such as (20:5)(20:5), (20:5)(22:6), (22:6)(22:6),
(18:1)(20:5), (18:1)(22:6), (16:O)(20:5), (16:O)(22:6) and
(16:O)(18:i). Figure ZV-33 illustrates the amount of
(20:5)(20:5), (20:5)(22:6), (22:6)(22:6),
(20:S)(18:1)+(18:1)(20:5), (22:6)(18:1)+(18:1)(22:6),
(20:5)(16:O)+(16:O)(20:5),(22:6)(16:O)+(16:O)(22:6) and
(18:1)(16:O)+(16:O)(18:1) by radar charts. These charts are
shown in sequence of elution (clockwise) and the Loriginal
data have been employed from Figs. IV-7'-21. As it is evident
from this Figi IV-33, the predominant peaks composed of 16:O,
18:1, 20:5 and 22:6 well characterize the characteristics of
each fish. Bottom fish such as brown sole and sand flounder
is of outstanding owing to the ratio of (16:O)(20:5) and
(16;O)(22:6). All other fish except Alaska pollack contains '(16:O)(22:6) as the most predominant component while Alaska
pollack contains both cornponent almost equally. From the view
point of seasonal variation, rainbow trout shows an
extraordinary change. It is considered that the closed
environment of this fish forced the changes of lecithin for
the adsptation. Fatty fish such as sardine and mackerel also
show considerable changes compared with other marine fish
examined.

107
Section 3. Characterization of Each Fish
by Principal Component Analysis
Principal component analysis (PCA) is well known as the
tnost representative way of multivariate analysis., PCA gives
i•nformations on allover relative relations of multivariate
data of mulitiple samples at the same time.
Fig. IV-34 illustrates the dispersion of data on the
second dimensional plane (Xi ,X2 co-ordinate) as an example of
explanation of PCA. If we consider new axes on the same
plane such as Zi and Z2, the projection of each data (shown
by arrow) on Zi.axis well represents the characteristics of
this set of data. Namely, we can decrease the dimension from
second (plane) to first (line) with the smallest information
loss. In this example, variates are only two. But if we
expand this concept on multiple variate (multiple 'dimensions), and then if we decrease the dimension with the
smallest information loss, such as, up to third or second
dimension, this will become a so called PCA. In this study,
the multiple dimension is decreased to second demension for
the ease of comprehension of the whole view of data. Fig.
:V•-35 shows how to interpret the print out from the computer ' 'on PCA analysis. The axis named as large number 1 is the
first principal component and the axis named as large number
2 is the second principal component. First principal
component has the mesning of 'tthe axis' that represents the
data most,tt and second principal component has the meaning of
"the axis that represents the data next to the first
principal component". Vectors shown as broken lines stand for

108
Å~2
Z2 Zi
eeeee e
e e
e e e xeN e
e ee
e .t
1
Fig. rV-34• Simplest form of PCA asThe arrow shows the projectionon the axis of first principal
an example.of each datacomponent.

109
2"
a tt
A"*'""'"'T
'
,
ele
e
,t e2ct b'
•-••-N,.
X'x.xl•-sb;B
cw".""
ttc
1""
Component A
Component B
Component C
: Number 1
: Number 1
: Number 1
> Number 2
= Number 2
< Number 2
abcc
tt
'
'
tt
:
:
:
:
,
ScalarScalarScalarScalar
ofofofof
thethethethe
* Second principal component.** First principal component.
eigenvector of component A on secondeigenvector of component B on firsteigenvector of component C on firsteigenvector of component C on second
principalprincipalprincipal principal
eomponent.eomponent.component. component.
Fig. ZV-35. rnterpretation of the results of PCA as an exarnple

110
Table IV--6. Print out of the mean and the standard deviation of the amount of all fish muscle lecithin examined, and print outs of correlation matrix arnong the main molecular species, eigenvalues as well as contributions and finally component loadings ' XXXXX PK!NC;F•AL CSi Fbel ET,N;T ANALYS:C.. KXk'Y. X NumDer or' Variables 9
Numbar' c- Samol? :S
s.[,. VAR:P9L• :- ,M,Sa,N : 3.t;3g f,.sgs• ' :• lg.?69 3 S .4 S L) 3- 2• 2.:• r-i: 39 .: 63 4 • 2•2.;:•: :7.776 $ 8.vWS7 :E.364 6 3Q. .97a a6 .67e 7 9:-.2•37 76.:S,9 S 11.161 :2- .f,91 =====.=s=-"==. ====. -u=s====t====n====npts===xn======ts====#=-==="m====s=n=
*
**
< Ccrrr?: at :' on Matrix >
t 1.q) g)e 2- O.4 EEt 1.th. et:, 3 O.279 (P.96t;, t.tb(btb 4 tb .434 ti, .98ct) ti) .93 f, 1.0ee s (p .;7tb -- q) .t:.,s, :• -- iil .op lg -op .o31 i .oee 6 ib .t; cb3 {:) .t:o :• e} -tt) .1 39 -(b .op11 -(b .e 5, :• 1.e k')e 7 ::,).:•61 u) .Be.b: O.7S4 op .75•5 -O .tpSe tb .3(b7 1.Cn ib fb 8 -ti) .:97 -fb .1 1: -tZ) .:06 -cb .Co75, -(l, .l q)1 -(P .:Sl -op .tb34 1.,v:) t.) (:,)
T!fiAC:- = 8
=.==•--==.--=-.=st--===-=#=-==.==#==-#====---===-=-.-=#======--====.=-=-.==.=-==-.
*EI3•-ENVALU,E Z Ae:- .z .COMF•8NENT 4S.:52 3.Sb(b 4S.252 1 -: 1.S,3:• 19.15,inr, 67.4u)7 3 1.eeS 13.6v)2 Sl.tbi:n9 4 tr) .674 le .? 2•9 9i .93S :-i :lf,g: {:ztas g;ie-g? '7 f:4.ee36 C).446 99.947 s e.tbo4 op.te.f•3 lee.opee **.SCCMFeN:-NT LeA:t;NS >•
:; iri F• ; iV' :- it T
1 2= 3 4 S 6 7 S 1 q)..e.av'J tb.6L•? e:,.t:,,39 e.2•31 tb.464 e.12•8 k).opE,e e.,E.,t:}5 2 ti.,.7e3 -cl,.::•6 t:,).t:,}2•S -e.op2•:• op.tb59 -e.v.)87 O.,t134 -(:,).tb.er.:" 3 O.935 -ti,,2•9.9 t:t,.:i4 --,b.g174 -Co.e)41 -tb.e14 op.12•6 u).op32" 4 g:,.95S -e.:7:• cb.c:,,.=.rL:- e.E,{b9 cir.op9S -tb.i.=',9 --(1).12-3 O.eb2•1 S - ti . Li) :• 4 t,) . 2• 4 3 t,) .S t;•4 • pt .4 tl, 7 - v: .2• 1 2 - e .kl :• 8 -- e .n e). 2 - (P .u:,tb:- 6 k) .161:,) tb ,S:•S -c?. ,41 :- g) ." tb -e.:• 48 •- (b .:65 e) .tcI Z•9 O. t":,ti) t;, 7 te ,S73 tb .t:,) :• tb -t:, .2• t,t t:,, e.tbS:• -- {b .367 op .2. 33 -tt).th. a7 -• lt).{bEI3 S -t,b.IE•:t -gb.46i -op.26tz) q}.79-F tb.tb42• -t).::,:6, a).Ct):4 O,etbl
'Eigenvalues were calculated by the Jacobi method, and the iterationwas 60 on this PCA.Component loading corresponds te the scalar of the eigenvector on PCAThe row and the column are variable numbers same with those in thenext figure (Fig. ZV-36).

111
component loadings. For example, suppose vector A stands for ' 'water content, B for protein content and C for lipid
content, water content is almost negatively cerreZative and
st the same tirne' , no correlation with protein content. Zf we
have deta number 1 and number 2, we can get the following
informations:
Water content : nurnber 1 > number 2
Lipid content : number 1< number 2
Protein content : number 1 = number 2
By introducing this PCA, the whole view of all fish
examined can be summerized in one or two plsnes with the
minimum loss of inforrnation.
•The computer program used for PCA was the modifiedprogram of "personal computer Library, vol. 3".48)The original
program was written for NEC PC-8001 personal computer. But
it was modified for NEC PC-8801 mkll personal computer, for
instance, the arrangement of the program was changed into
N-88 BASrC, and the character mode was changed into graphic
raode .
Table !V-6 shows the print out from the computer. !n
this Table, "Number of Variables 8" are the main molecular
species which have been discussed in the radar chart on Fig.
rV-33, namely, those corresponds to the footnote in Table
:V--7 shown as "Row". "Number of Sample 26" are the fish
examined and those are also shown in the footnote of Table
:V-7. "MEAN" is the average amount of each molecular species
mg/100g muscle. "S.D." is standard deviation. "Correlation
Matrix" shows the correlation of each variable (molecular
species). "EIGE•NVALUE" is ealculated by the Jacobi method

112
2
6'tl`t'j..1lt'l..-}f'
st/.,./// '
l.i5 Ix.•tl)-t s/l ltt.i'`, t"It"t
sl ta. -KL-w--e..-.-'N--t---------N'--'za------::r-T.'--
F'--":r-=-L::Ls4-i---------N--
--' 7
8
1, .(20:5)(20:5) 2,3, (22:6)(22:6)'4, (20:5)(18:1)+(18:5, (22:6)(18:1)+(18:6, (20:5)(16:O)+(16:7, (22:6)(16:O)+(16:8, (18:1)(16:O)+(16:
(20:5)(22:6)
1)(20:5)1)(22:6)O)(20:5)O)(22:6)O)(18:l)
Fig. TV-36.first
Eigenvectors of major molecular species onand second principal component plane on PCA.
the

113
35';:`}iis`
ev--.:g=,---=J- --pt-b.----
3E------42
"t
}t
ll,
!
----- -s.1-NxN-.-x-sN.xs ---- s. N..---- 7
xtx,1
6
1
1, (20:5)(20:5) 2,3, (22:6)(22:6)L4, (20:5)(18:1)+(18:5e (22:6)(18:1)'(18:6, (20:5)(16:O)+(16:7, (22:6)(16:O)+(16:8, (18:1)(16:O)+(16:
(20:5)(22:6)
1)(20:5)1)(22:6)O)(20:5)O)(22:6)O)(18:1)
Fig. IVL- 37.
ffrst
Eigenvectors of major molecular gpecies onand third principal component plane on PCA.
•the

114
Tab1e ZV-7. Print out of the principal loading (component score) on PCAe'
<PR :• NC:,:•AL
PR• 1 1 :-
3 4 f'
6 7 B ?
1 [;.}
1112"
13141:-•
:617::-
19.
:' c,}
2•12.e.•
2•3
:4:'S.i
.-.,. 6
LeA":NG)••
:NCr AL:6.92:
:• .2• :• S
r.467•- 1 ..rr• :• 6
-1.4e9 cb .151-ij) . 31 tZ)
(b.198-1 . :• 4ti)
-:• .616 1 .6(i)-7
.-r• ra "i--4--• b.773-1.7S7-1 . .e-, ..i c:.:
-:, .a:-,4
f, .:F7.-1 .1 rt) tb
ci) . :.S:-
-t:,) . 6tl•IS
-1 . 2• 6;r,,
-i . E: ;-, (b
-ti:1 ,S67':' .t!,:"L,:.
-- :• .S -i 3
-:,6lt-
F• 2•- 2• ..e, :• a
-1.39: "3 .9=:•6
-tb .714-(b . :- 46
(b . f•36-ote . 2. ag
O.215-C,} .65•5
-(b .746 3.:-7tr'"- tb .1 t:1 :-',
1.471 E).Eii1-cb . :•• 15
-{l) . .L.3..h
4.346 cli . "' .E.3
-O . i, .e. cb
-til . 193-{:) . .=.; 13
op .: S2• t:1 . 2. (IIa
-{b .663-2.996-(!) . -'6 1
3 op ,1 s ,x.
ql . ttl73
-• {b . SEop
tb .47e-e:, . 363
3.374-{b .373
t.S`97 C).71.e-, c:4 .2• 41
1.3:•:--(b .034-t) .74:-(;.1 .3:• 6
k'i .: 4a (b .12•-3
-T 7La. -- -" {II .: E:= (b . tt): 2"
Cn.46:• q, .417-(l .4S7-1 .1:•9-tb.s,a,t-,
-- 1.92...•
.el . f, ts
4-e . :gt,:)
-de . !,9:•
-t;.! .n6a-tb . 7op 5,
.{:,) . ff, op3
1 . .'.• 15
tP . 2• 6-'
e.49(b-tb .31 t{)
-ti., .E;69
:.2•2•6-tb . aE):=
.- cl) . -' cb c.:)
-- t:,, . 62- 4
-ih •'•',S' , --- i-v-cb . 64c:,i
O.i•1:-(:) . 2(i)t:n
-- (:n . 371
-c;.) . tb f, .--,
-fP .4c;} 1
-(p' .646 {b.:•:4-tir . til f,2
3.31u:i-tl) .1S5
s v).2•7e e.:•69-{tb . 499
e . 14(t) q'i . tb53
--i.:l .949
-tt) .347- {b .B .-) 6
-- cb.:73 O.:•76 1.5,45, O . {b E 2••
ql.:36 (;.) . 2-•97
(:,, . :• 37
(t) .:.: co
-- •/Z, . 6e• qh
fb.129-(b . tt3:•
vP . (b96 tb . u:,82"
-(b.11S-tb . E,thtl)
tb . tb61
qb.:•S6•- (b . di46
6-cb.aot;6- op , e .e., ib
th. .u)74 u:) , tcb a) 3
-{:n . 1 t:) Cn
.ti) -eo . ti":. I-(lp . t:i 1 3
l!I . :l) 1 til
cb . (bf:',
' ."e-(t) . vp-" ti) . : f,6
•- (b.16g-O .14t8-(,) . 1 33
-ti).c!)1:
-O . t:,I6t;,
-cb . cllE6
-[b . 1a4 O.46.e, cfb .: (b •f,
cb . [f17tli
Q'i ,tf) E, tb
th .177-tb . ul ,e.,7
-eJ . tb1•6
O . trb E,9
7.- cb . f' f) : '="
cb . u:it:):•
tip ,113 a, . tb43 tb . 'y.h 2. f:')
-t:,I . tb 1 :"
q) . r.} 5• E)
-- tb . t!J 1 rd
e . {:)as,-t:n . t't) 1 '9
sb.tbtb'7-- til . ttl 1 q.
-cb . 'vl 1 I',
-Ei.op1.e.,
ti: . c:)tb f,
-c:) . (b u:)9
-(ll . ci}tb5
-{ll . t:,) :• 4
-tb . tb:• :•
c,.e17 tb.qt19-tt) . ::,b:9
-!) . [i)73
-{i} . tD :. 6
e.t;.)17-tij .{b:•3
s t.h . Cb CJ 2•
"c4 ,e:i)e.c{ .tl)({16
C4 . :b t,:)2
e) . t:,)tl)L
-,b , et:.) :.
tb . (il(i) 5.
-tt) . 'v:) ci) ttl
(b . :i) 1 :•
-ct) {;)thr}- - t- i- c;p . (b (i} :=
(il . ::l c:,) :.
-(tl . Eitlic!;
tb . cb t;.) :
-tZ, . f)<•;E,
-Ei) . tlltb2
tc1 . cb t;.) t;.}
(b . :i)tb cb
e . c,] (b 1
-tr .cblul t:.j . tb tj) :.
-i:.) . t:,)E) 1
op . t:,rtZi c!}
e . Ll t:,, 2"
-({) . tb(l) 1
(;p . ti;tO Cil
Row li 3. 5. 7. 9. 11. 13. 15. 17. 19. 21. 23. 2S.Co1umn 1. 4. 6. 8.
SARDINE PC (Dark muscle), July 1982SARDINE PC (White muscle), July 1982)CACKEREL PC (Dark muscle), July 1982MACKEREL PC (White muscle), July 1982B!G-EYED TUNA PC, Frozen 1981BROWN SOLE PC, Oct. 1982SAND FLOUNDER PC, Dec. 1982ROCK FrSH PC, Oct. 1982ALASKA POLLACK PC, Dec. 1981CHUM SALMON PC, MALE, June 1980CHUIyl SALMON PC, FEMALE, Aug. 1983MACKEREL SHARK PC, July 1982RArNBOW TROUT PC, Sep. 1982
(20:5)(20:5) 2. (20:5)(22:6)(20:5)(18:1)+(18:1)(20:5)(20:5)(16:O)+(16:O)(20:5)(18:1)(16:O)+(16:O)(18:1)
3.5.7.
2. 4. 6. 8.10.12.14.16.18.20.22.24.26.
SARDrNE PC (Dark muscle), Oct.SARDINE PC (White muscle), Oct.MACKEREL PC (Dark muscle), Oet.MACKEREL PC (White muscle), OctB!G-EYED TUNA PC, Frozen 1983BRowN SOLE PC, May 1983SAND FLOUNDER PC, May 1983ROCK FISH PC, July 1983ALASKA POLLACK PC, Jan. 1984CHUM SALMON PC, MALE, Aug. 1983BLUE SHARK PC, June 1982cARP PC, Sep. 1980RA!NBOW TROUT PC, May 1983
(22:6)(22:6)(22:6)(18:1)+(18:1)(22:6)(22:6)(16:O)+(16:O)(22:6)
1983 1983 1983. 1983

115
2
ol1 o1713'14o
18o3
. o2o25 ol
1
1. 3. s. 7. 9.11.13.15.17.19.21.23.25.
SARDrNE PC (Dark muscle), July 1982SARDZNE PC (White muscle), July 1982MACKEREL PC (Dark muscle), July 1982MACKEREL PC (White muscle), July 1982B!G-•EYED TUNA PC, Frozen 1981BROWN SOLE PC, Oct. 1982SAND FLOUNDER PC, Dec. 1982ROCK FISH PC, Oct. 1982ALASKA POLLACK PC, Dec. 1981CHVM SALMON PC, MALE, June 1980CHUM SALMON PC, FEMALE, Aug. 1983MACKEREL SHARK PC, July 1982RAXNBOVI TROUT PC, Sep. 1982
2
468
101214161820222426
. SARDrNE PC (Dark muscle), Oct.
. SARDrNE PC (White muscle), Oct.
. MACKEREL PC (Dark muscle), Oct.
. MACKEREL PC ,(White muscle), Oct
. BIG-EYED TUNA PC, Frozen 1983
. BROWN SOLE PC, May 1983
. SAND FLOUNDER PC, May 1983
. ROCK FISH PC, July 1983
. ALASKA POLLACK PC, Jan. 1984
. CHUM SALMON PC, MALE, Aug. 1983
. BLUE SHARK PC, June 1982
. CARP PC, Sep. 1980
. RAINBOW TReUT PC, May 1983
1983 1983 t983. 1983
Fig. IV-38. Plo,ts of principalprincipal component planeRefer to the eigenvectorsp1ane.
loadingon PCA.in Fig.
on the first and secend
ZV-36 as background of this

116
from correlation matrix. t'%t' shows the contribution for the
information of the whole data of each principal component and
"ACC.%" is the accumulative value of these "%". "< COMPONENT
LOADrNG >" is the scalar of the eigenvector ( see Fig.
rv-3s ).
:n Fig. IV-36, eigenvectors of major molecular species
are shown as small numbers on the first and second principal
component plane. These are drawn up from the print out of
"< COMPONENT LOADZNG >" on columns 1 and 2 in Table :V-6. And
in Fig. IV-37 eigenvector of the same molecular species are
generated on the first and third'principal component plane.
And these are drawn up from the print out of "< COMPONENT
LOADING >" in columns 1 and 3 in Table IV-6.
"< PRrNCIPAL LOADZNG >" in Table rV-7 is the print out
of principal ioading of each fish which shows the position on
the PCA plane. For example, the cell in the 1-th row, the
1-th column shows the distance on the first principal
component, and the cell in the 1-th row, the 2--th column
shows the distance on the second principal component. These
principal ioadings were plotted on the first and second
principal component plane as shown in Figs. IV--38•-40 and on
the first and third principal eomponent plane as shown in
Figs. rV-44'v46 in different scales. Eigenvector of Fig. IV-36
is for Fig. IV-38 and' that of Fig. !V-37 is for Fig. IV•-44.
As shown in Fig. ZV-38, sardine dark muscle has a drastic
seasonal change ( points number 1 and number 2 ). And among
the white fiesh fish, Alaska pollack has a large seasonal
change ( points number 17•and number 18 ). The movement of
point number 1 to point number 2 is the direction of

117
2
olle17
o1314oo lged3 o3
oi8&W,zi o19
o2
o25
1
1357
911
1315171921232S
.
.
.
.
.
.
.
.
.
.
.
.
.
SARDINE PC (Dark muscle), July 1982SARDINE PC (Vlhite muscle), July 1982MACKEREL PC (Dark muscle), July 1982MACKEREL PC (White muscle), July 1982BIG-EYED TUNA PC, Frozen 1981BROWN SOLE PC, Oct. 1982SAND FLOUNDER PC, Dec. 1982ROCK FISH PC, Oct. 1982ALASKA POLLACK PC, Dec. 1981CHUM SALMON PC, MALE, June 1980CHUM SALMON PC, FEMALE, Aug. 1983MACKEREL SHARK PC, July 1982RAZNBOW TROuT PC, Sep. 1982
2. 4. 6. 8.10•12.14.16.18.20.22.24.26.
SARDrNE PC (Dark muscle), Oct.SARDINE PC (White musele), Oct.MACKEREL PC (Dark muscle), Oct.MACKEREL PC (White rnuscle), OetBIG-EYED TUNA PC, Frozen 1983BROWN SOLE PC, May 1983SAND FLOUNDER PC, May 1983ROCK FISH PC, July 1983ALASKA POLLACK PC, Jan. 1984CHUM SALMON PC, MALE, Aug. 1983BLUE SHARK PC, June 1982cARP pC, Sep. 1980RAINBOW TROUT PC, May 1983
1983 1983 1983. 1983
Fig. IV-39. Plots of principalsecond principal componentRefer to the eigenvectorsp1ane.
loading on the plane on PCA.in Fig. ZV-36 as
magnified first
background of
and
this

118
2
oll
o13
o3o14o22o18
o23
o6o8
o10
o12
a16o24-
oo207 o19
1
. o2
o25
L 3. 5. 7. 9.11.13.15.17.19.21.23.25.
SARDrNE PC (Dark muscle), July 1982 SARD!NE PC (White muscle), July ,1982MACKEREL PC (Dark muscle), July 1982
MACKEREL PC (VJhite muscle), July 1982 BIGeEYED TUNA PC, Frozen 1981,BROWN SOLE PC, Oct. 1982 SAND FLOUNDER PC, Dec. 1982 ROCK FISH PC, Oet. 1982ALASKA POLLACK PC, Dec. 1981
CHVM SALMON PC, MALE, June 1980CHUM SALMON PC, FEMALE, Aug. 1983MACKEREL SHARK PC, July 1982
RA;NBOW TROUT PC, Sep. 1982
2. 4. 6. 8.10.12.14.16e18.20.22.24.26.
SARDINE PC (Dark muscle), Oct.SARDINE PC (White musele), Oct.MACKEREL PC (Dark muscle), Oct.MACKEREL PC (White muscle), OctBIG-EYED TUNA PC, Frozen 1983BROwN SOLE PC, May 1983SAND FLOUNDER PC, May 1983ROCK FrSH PC, July 1983ALASKA POLLACK PC, Jan. 1984CHUM SALMON PC, 1
119
2
1
LineLtneLine
A:
B:
c:
SARDZNE PC (Dark muscle)CHUM SALMON PC, MALERArNBOW TROVT PC
Fig. rv-41.
on theMovement
same planeof in
the plots between the two different seasons Fig. rV-38.

120
2
B
c A!s-
1
LineLineLine
A:
B:
c:
SARD:ISE PC (Dark muscle)CHUM SALMON PC, MALERAZNBOW TROUT PC
Fig. ZV-42.on the
Movementsame plane
of in
the plots between the two different seasons Fig. rv-39.

121
2
6
-`: B
cA
K
1
LineLineLine
A:
B:
c:
SARDZNE PC (Dark muscle)CHUM SALMON PC, MALERAINBOW TROU'Ir PC
Fig. :V-43.
on theMovement
sarne planeof
inthe plots between the two different seasons Fig. zv-40.

122
3'
6.
1 oll
o25 o17
1
1 3 5 7
911
13151719212325
'
.
.
.
.
'
.
.
.
.
•
.
.
SARDINE PC (Dark muscle), July 1982SARDrNE PC (Vlhite muscle), July 1982MACKEREL PC (Dark muscle), July 1982MACKEREL PC (White muscle), July 1982BIG-EYED TUNA PC, Frozen•1981BROWN SOLE PC, Oct. 1982SAND FLOUNDER PC, Dec. 1982ROCK FISH PC, Oct. 1982ALASKA POLLACK PC, Dec. 1981CHUM SALMON PC, MALE, June 1980CHUM SALMON PC, FEMALE, Aug. 1983MACKEREL SHARK PC, July 1982RAINBOw TROUT PC, Sep. 1982
2. 4. 6. 8.10.12.14.16.18.20.22.24.26.
SARDZNE PC (Dark rnuscle), Oct.SARDrNE PC (White muscle), Oct.MACKEREL PC (Dark musele), Oct.MACKEREL PC (White muscle), OctBIG-EYED TUNA PC, Frozen 1983BROwN SOLE PC, May 1983SAND FLOUNDER PC, May 1983ROCK FTSH PC, July 1983ALASKA POLLACK PC, Jan. 1984CHUM SALMON PC, MALE, Aug. 1983BLUE SHARK PC, June t982cARP pC, sep. Ig80RAZNBOW TROUT PC, May 1983
1983 1983 1983. 1983
Fig. ZV-44. Plots of principalprincipal component planeRefer to the eigenvectorsp1ane.
loadingon PCA.in Fig.
on the first and third
rV-37 as background of this

123
3
------gkgg o 24
o25
. edi3
ma
6
o8 ol1
M-------1o3
o17
'1
3s7
911
13151719212325
.
.
.
.
.
.
.
.
.
.
.
.
.
SARDZNE PC (Dark muscle), July 1982SARDINE PC (White muscle), July 1982MACKEREL PC (Dark muscle), July 1982MACKEREL PC (White muscle), July 1982BrG-EYED TUNA PC, Frozen 1981BROWN SOLE PC, Oct. 1982SAND FLOUNDER PC, Dec. 1982ROCK FISH PC, Oct. 1982ALASKA POLLACK PC, Dec. 1981CHUM SALMON PC, MALE, June 1980CHUM SALMON PC, FEMALE, Aug. 1983MACKEREL SHARK PC, July 1982RAINBOW TROUT PC, Sep. 1982
2468
101214161820222426
. SARDrNE PC (Dark muscle), Oct.
. SARDZNE PC (White muscle), Oct.
. MACKEREL PC (Dark rnusele), Oct.
. MACKEREL PC (White muscle), Oct
. BrG-EYED TUNA PC, Frozen 1983
. BRowN SOLE PC, May 1983
. SAND FLOUNDER PC, May 1983
. ROCK FrSH PC, July 1983
. ALASKA POLLACK PC, Jan. 1984
. CHUM SALMON PC, MALE, Aug. 1983
. BLUE SHARK PC, June 1982
. CARP PC, Sep. 1980
. RATNBOW TROUT PC, May 1983
1983 1983 1983. 1983
Fig. ZV-45. Plots of principal loading on the rnagnified firstand third principal component plane on PCA.Refer to the eigenvectors in Fig. ZV-37 as background ofplane.
this

124
3
o6
osoll
9o
10Ool oodi5%18 mo
dq4
o7o13
a3oas
o25
1
1
357
911
1315171921232S
.
.
.
.
.
.
.
.
.
.
.
.
--
SARD!NE PC (Dark rnuscle), July 1982SARDrNE PC (White muscle), July 1982MACKEREL PC (Dark muscle), July 1982MACKEREL PC (White rnuscle), July 1982BrG-EYED TUNA PC, Frozen 1981BROWN SOLE PC, Oct. 1982SAND FLOUNDER PC, Dec. 1982ROCK FrSH PC, Oct. 1982ALASKA POLLACK PC, Dec. 1981CHUM SALMON PC, MALE, June 1980CHUM SALMON PC, FEImu.E, Aug. 1983MACKEREL SHARK PC, July 1982RArNBOW TROUT PC., Sep. 1982
2. 4. 6. 8.10.12.14.16.18.20.22.24.26.
SARDrNE PC (Dark muscle), Oct.SARDINE PC (White muscle), Oct.MACKEREL PC (Dark rnuscle), Oct.MAeKEREL PC (White rnuscle), OctBrG-EYED TUNA PC, Frozen 1983BROVIN SOLE PC, May 1983SAND FLOUNDER PC, May 1983ROCK FrSH PC, July 1983ALASKA POLLACK PC, Jan. 1984CHUM SALMON PC, MALE, Aug. 1983BLUE SHARK PC, June 1982CARP PC, Sep. 1980RAINBOW TROUT PC, May 1983
1983 1983 1983. 1983
Fig. TV-46. Plots of principal first and third principal Refer to the eigenvectors p1ane.
loading on the component planein Fig. IV-37 as
highly magnified on PCA. baekground of this

125
eigenvector number 4 that shews the direction of
(20:S)(18:1)+(18:1)(20:5) cornbinations. So we might say that
sardine dark muscle has a large seasonal variation in the
molecular species composed of 20:5 and 18:1. ' Fig. IV-39 is the magnified figure of Fig. IV--38. And LFig. IV--40 is the further magnified figure of Fig. IV-39.
Frorn these two Figures i.e. Fig. IV-39 and Fig. IV-40,
generally speaking, there seems to be a direction on the axis
of oval shape shown in the movement between the same fish
except in the cases of sardine dark muscle, chum salmon and
rainbow trout. This direction coincide with eigenvector of
(20:5)(20:5). Though, further supplementary studies should be
done to get a conclusion, it is assumed that (20:5)(20:5) is
the most reflectable molecular species against seasonal
variations among the majority of fish. This is more evidently
shown in Figs. IV-41N43 in three different scales, and only
sardine dark muscle ( shown as A ), chum salmon ( shown as
B ) and rainbow trout ( shown as C ) have different
directions. As it is well known, the general characteristics
of these three fish are as follows:
Sardine dark muscle : Drastic change
in lipid content.
Chum salmon : Migration from sea to river. Rainbow trout : Fresh water fish.So, these characteristics might affect the molecular species
4of muscle lecithin.
Through Fig. IV-44 to Fig. rV-h46 show the distribution
of each fish on the first and third principal component
plane. The outstanding deviated points are those of sardine

126
3
1
Fig. ZV-47.
on theMovement
same planeof in
the plots between the two Fig. rv•-44.
different seasons

127
3
1
Fig. ZV-48.
on theMovement
same planeof
inthe plots between the two Fig. IV-45.
different seasons

128
3
1
Fig. rv t- 4g.
on theMovement
same planeof
inthe plots between the two . Fig. IV-46.
different seasons

129
dark muscle ( point number 1 ) and Alaska pollack ( point
number 17 ) as it is seen in the first and second principal
component plane. Those'of rainbow trout and mackerel dark
muscle also have a deviation in this plane, but not so large
as it is in the csse of sardine dark muscle and Alaska
pollack. Figure rV-47 through Fig. ZV-49 show the seasonal
variations by lines on the first and third principal
component plane, rt is hard to find a general movement of
molecular species in this plane according to the seasonai
variation unlike it is observed in the first and second
principal component plane.

130
Section 4. Changes in Fish Muscle Leci'thin of
Chum Salmon during Migration
Total lipids were obtained in the same way as described
in seetion 1 from the fish rnuscle of chum salmon tabulated in
Table IV-8. Lipid composition analysis as well as molecular
species analysis were also done in the same manner as
described in section 1. PCA analysis was done in the same way 'as described in section l. - ' Table rV-9 shows the yield of total lipid and the
percentage of each lipid class against total lipid. And on
the right end of this table, the lecithin amounts!100g muscle
are shown. Though there is a drastic drop in the amount of
total lipid and triglycerides between the stage of feeding
migration and spawning migration, the amount of lecithin
ranges between 161.-230mg/100g muscle.
In Tablg IV-10, changes in fatty acid composition of
diglyceride acetates ( this represents the fatty acid
composition of lecithin ) during migration are shown. At the
level of this analysis, not any significant differences are
observed amoung the four stages.
HPLC chromatograms of each stage of migration are shown
in Fig. IV--50 and the detected molecular species of lecithin
in sequence of,elution on HPLC with the percentage data are
shown in Figs. :V-51NS4. As it is obviously seen in these
figures chum salmon at the stage of feeding migration has
(16:O)(22:6) as the most outstandingly predominant peak
( shown by arrows in Fig. IV-50 ) compared with other three
stages. At the stage of spawning migratien, this peak i.e.

Tab
le IV
-8. C
hum
salm
on (
Onc
orh
ncus
keta
)ex
amin
ed
Sta
geof
mig
ratio
nan
d se
xM
ean
body
leng
th L
ocal
ity o
fan
d m
eigh
t c
atch
Dat
eof
cat
ch
Fee
ding
Fee
ding
mig
ratio
n, m
ale
mig
ratio
n, fe
mal
e
42.7
cm45
e 59
'
46.8
cm45
e59'
, 136
7g,
-49e
29'N
:46e
5923
g9rk
' `
1670
07
1670
07
, ,
-• 1
750
30
-175
030
, ,
E E
' '
Aug
Aug
. .
1983
1983
Spa
wni
ng
Spa
wni
ng
mig
ratio
n,m
a1e
Sea
run
mig
ratio
n,fe
ma1
eS
ea r
un
63.0
cm, 3
267
Yak
umo-
cho,
64.3
cm, 3
573
Yak
u rn
o- c
ho ,
ft6kk
a i d
o
ff6kk
a i d
o
' '
Japa
n
Japa
n
oct
oct
. .
1983
1983
Spa
wni
ng
Spa
wni
ng
mig
ratio
n,m
a1e
Riv
erm
igra
tion,
fem
a1e
Riv
er
73.e
cm, s
ooo
Yak
umo-
cho,
70.0
cm, 4
740
Yak
umo-
cho,
ft6kk
aido
g6kk
aido
' '
Japa
n
Japa
n
Nov
Nov
. .
1983
l983
Spe
nt
Spe
nt
' '
ma1
e
fem
ale
74.2
cm, 5
140
Yak
umo-
cho,
72.7
cm, 4
273
Yak
umo-
cho,
ft6kk
a i d
o
R6k
kaid
o' '
Japa
n
Japa
n
NQ
v
Nov
. .
1983
1983
N o H

Tab
le IV
-9.
Lipi
dco
mpo
sitio
n of
Chu
m S
alm
onex
amin
ed
.
Lipi
dS
ainp
1eY
ield
*T
G
Non
-pho
spho
lipid
**F
FA
ST
NP
PC
PS
+P
F-,
Pho
spho
lipid
ftrk
PL
,PC
mg/
100g
mus
cle
othe
rjcot
hers
Fee
ding
mig
ratio
n,10
.492
.1.
O.4
O;7
O.2
2.33
.6O
.723
0Ii,
•1al
e
Fee
di'n
cJm
igra
tion,
12.4
94.1
trac
eO
.7O
.71.
32.9
O.3
161
Fem
a1e
Spa
wni
ngm
igra
tionJ
Ll40
.7O
.84.
71.
1i9
.329
.83.
621
2
Mal
e(S
ea)
Spa
wni
ngm
igra
tion)
1.4
49.9
trac
e2.
6O
.317
.326
.73.
224
2
Fer
nale
(Sea
)
Spa
wni
ngm
igra
tion,
1.3
40.7
5.7
6.2
trac
e12
.732
.91.
816
5
P•.
/laIe
(Riv
ei'n
y)
Spa
wni
ngm
igra
t.ion
s1.
641
.52.
615
.5O
.19.
228
.13.
014
7
Ftt•
iinal
e(R
iver
)
spet
)ts
1.1
32•.
'Z2•
2••.
54.
I35.
2"12
•.2l
l.2
-ti.
913
2
Mal
e
Spe
ntv
O.9
11.6
19.9
'7.
85.
519
.115
.920
.217
2
Fen
nale
See
the
*g/1
OO
gab
brev
iatio
ns in
the
open
ing.
mus
ele.
**g
/100
g to
tal l
ipid
.- o N

133
Tab1e TV-1O.
derivedFattyfrom
acid compositionlecithin of chum
of diglyceridesalmon muscle
aeetate
--ij------Ft .---"-.. -"-.+.-.--+- -fpt . + "- -zae-
Satnple FeeclSng mtgration SPaWtltt19 mlgratlon'
Spent
Fattyact(l Ma1e F'ema1e Female* 'Me1e** Ma1e Fema1e
•12:O O.09 O.03 trace o .06
14:O 4,58 3.10 1.98 2.78 3,34 3.74 3.49 3. 53
15:O O.82 O.68 O.37 O.42 O.42 O.44 O.37 o .32
16:O 29.02 432.26 30.02 26.84 23.95 28.61 29.51 26, 15
16:1 :.79 1.38 1.66 2.19 2.60 2.56 2.41 L 83
17:O 1.t4 O.92 O.43 O.38 O.61 O•SLO O.35 o. 4B
17:1 O.44 O.,37 O.25 O.16 O,36 O.25 O.42' o, 27
18:O 1.03 1.lt O.72 O,59 1,23 O.52 1,45 o. 83
t6:1 8,43 8.27 6.40 4,68 5.04 7.25 9,65 6, 64
18:2 O.51 O.52 O,37 O.51 O,94 O.64 o.fio o. 46
t9:tor18:4 O.46 e.63 O.97 O,97 O.34 o. 39
19:2 O,69 O.56 1.36 1.19 O.33 o. 49
20:O 1.0t O.77 O.67 o.7.q 3.27 trace trace o. 79
2o:r O.10 O.10 O.39 O.29 2.29 O.52 Lll o. 05
2{-):2 o,;t O.09 O.06 O.04 O.33 o. l4
20:3 o.6r) O.58 O.1:'l O,13 O.06 O.93 o. 88
20:4 O.79 O.67 l.54 1.83 3.00 1,80 O,41 o. 51
20:5 !1,49 10,18 15,OO t6,22 19,OO 23,66 S5,87 16. 96
22:3 O.07
22:4 O.42 O.34 O.18 O.19 o, 12
22:5 1.05 O.98 1.16 1.87 2.48 1,93 1,75 2, 37
22:6 3r,.oo 36.40 38.20 39.30 28.77 25.43 30.67 36. 70
others O.77 O.73 O,Ol O.13 O.31 e,ol o, 03
Z itl
* Sea
muscte
vuu.
lectthin.
rk* River.

134
/r
CHVMSAUVION,MALE CHVMSALMON,FEMALE(Feedtng mlgrotlon) (Feedtng mtgratton)
eo 1oo'20 co oo mln 2 40 60 ,60 100min
CHcuSAUVION,MALE• CHmuSAthON, FEMALE{Spowning mlgratton) (Spowntng mtg'ratton)
Seo Sea
o Lo 60 eO1oomin 20 40 oo co1oomin
CHVMSAUVION,MAE CHUMSAMON,FEMAE(Spowntng mlgrotton) (Spowntng migratSon)
Rtver Rtver
20 AO 60 801oom;n20 co se 80:oom;n
11
CHUM SAthON. MALE (Spent}
CHUM SALMON,
CSpent)FEMALE
20 40 60 co 1oo min
20 40 oo co 1oo min
Fig. rv-so.on each
HPLC
stage
chromatograms of migration.
of chum salmon musc1e• lecithin

(20:5)(20
(20:5)(22
(22:6)(22
(20:4)(22
(20:5)(22
(22:5)(22
(16:1)(22
(14:O)(20
(14:O)(22
(17:O)(22
(18:1)(20
(22:6)(18
(18:1)(22
(Z6:O)(20
(22:6)(16
(i6:O)(22
(16:O)(22
Unknown
(18:1)(i6
(16:O)(18
:
:
:
:
:
:
:
:
:
:
:
:
:
:
:
:
:
:
:
10
ZIPC
•20 30
5)
6)
6)
5)
5)
6)
6)
5)
6)
6)
5)
1)
6)
5)
o)
6)
5)
o)
1)
=]E65ssi
Ma1eFema1e
Fig. IV -51.
at the
Molecular species of chumstage of feeding migration.
salmon muscle
135
op
lecithin

136
10
ZIPC
20 30 40
(i6:2)(20
(20:5)(20
(20:5)(22
(22:6)(22
(20:4)(22
(20:3)(22
(20:4)(22
(22:5)(22
(16:1)(20
(16:i)(22
(iA :.O) (22
(18:1)(20
(20:5)(16
(16:O)(20
(22:6)(16
(16:O)(22
(16:O)(22
(16:O)(20
Unknown
(18:O)(16
(16:O)(18
:
:
:
:
:
:
:
:
:
:
:
:
:
:
:
:
:
:
:
:
5)
5)
6)
6)
5)
6)
6)
6)
5)
6)
6)
5)
o)
5)
o)
6)
5)
4)
o)
1)
[1=]Malefi"gN"SSFema1e
(l4Fig.
:O)(20, IV-52.at the
S), (17:O)(22:6) and (22:6)(18:1) are trace Molecular species of ehurn salmon muscle stage of spawning migration (sea).
amoutit .
Iecithin

137
Z/pc
10 20 30
(16:2)(20:5)
(20:5)(20:5)
(20:5)(22:6)
(22:6)(22:6)
(20:4)(22:5)
(22:5)(22:6)
(20:3)(22:6)
(22:4)(22:6)
(16:1)(20:5)
(22:6)(16:1)
(16:1)(22:6)
(14:O)(22:6)
(20:5)(18:1)
(18:1)(20:5)
(18:1)(22:6)
(20:5)(16:O)
(16:O)(20:5)
(22:6)(16:O)
(16:e)(22:6)
(22:5)(16:O)
(16:O)(22:5)
(16:O)(20:4)
Unknown
(14:O)(20:5)Fig. ZV-53. at the
c=EXNXN
Ma1eFema1e
s
, (17:O)(22:6) and (22:6)(18:1) are trace amount. Molecular species of chum salmon muscle lecithinstage of spawning migration (river).

138
(20:5)(20:5)
(20:5)(22:6)
(22:6)(22:6)
(20:4)(22:5)
(22:5)(22:6)
(16:1)(20:5)
(16:1)(22:6)
(14:O)(22:6)
(18:1)(20:5)
(20:5)(16:O)
(16:O)(20:5)
(22:6)(16:O)
(16:O)(22:6)
(16:O)(22:5)
(16:O)(20:4)
Unknown
(16:O)(18:i)
(14:
Fig.
O)(20:5) ZV-54. at the
10
Z/pc
20 30
C=]MaleNXXesssFema1e
, (17:O)(22:6) and (22:6)(18:1) are trace arnount.Molecular speciesof chum salmon muscle leeithin.
stage of spent.

Soo
wnt
ng
S
ea
llgl?
l
lg•1
.gl 4
o ...
2
--s
mtg
rotS
on
run
li8
1gl
4
0
20
ll,6i
•2i
li2ig
l
20
Fee
dtng
mtg
ratto
n
lig
l;l
l16:
Oi8
:i
l40
ligig
l
20
40.2
0LO
---
20
i16:
O20
:5l
40llg
l,il
il8[•
el
Lo
--s
llgl.g
l
20
LO
llgi.}
l
Bgi
.Il
llS.ig
l
li;i.g
l
Spa
"nin
g m
lgra
tion
Rtv
er
li8
175,
I
I>g;
o,i
l16:
O18
:1
i40
I20:
522•
61
20
4e20
'N.
LO.s
s.
s.
s
20
l16:
O20
:Ss
40
l18:
120:
5I
Sga
les
ere
tn X
.
- M
ale,
---
- F
enal
e,
TV
-55.
Rad
ar c
hart
s of
rrra
scle
leci
thin
on
each
llgig
l
Ii2,i.
gi
Spe
nt
li81r
5sl
Fig
. . m
aln
stag
e
Ilg•l?
I40
i20:
S22
•6l
20
op2e
ttK
.20
to.s
s..
s
--t
N. ..
20
ll8i•g
l
40B
gi,}
I
IBI6
,l
llgi.t
l
mol
ecul
ar s
peci
es o
f o
f mig
ratio
n.ch
um
ISI,6
1
salm
on- w o

140
Tab1e rV-ll. Print outthe amount of chummigration stages
of the mean and salmon muscle
the standard deviation oflecithin throughout all
t,J S,)l tX• •X X X X
Nu rt) t.) Rrt
r-•F'ltIN[ XFtC,L COl,VIltONENTcrf Variain 1 es * 31
ANALYSTS XXXXX
Numin en o.f Sample* 9
iVItK• : Lr ,-th] st- EI
1 -.n,:
3 4• f-F",
6 7 s 9 i (:')
11 ILt j' :i
1 `1•
itLti,
16 1. -;,•
:8 1 Ci?
:.1[',?)
2•?2 :••, :•i
L: l3
:"fii
tt,•cr-,
:• 6.,
:-7 ;:'"i
:: cs
LT3{tL•}
zJ,1
MEAN tZ} . ZI•74
4.1631 e, . (!) ff, G)
:t:3.S49 i.5i63 tz; . 64(r,)
c:4. .E-t31
(Z) . E-:.t 1 ;-,
c:} . eS :•II• 8
1 . .cr-t49
(I} . .ny,• 2•• 7
3 e t:)'76 tZ) . "'78El;
4 . 5, 48 {!) . 63 .=-:,
:Lt e14S c2) . 633
t:) .331
3.67S 1 n :I,ll• "79
: . S (:) E,
-1 . :-,871 C2 . d) :.•.•i7
16 n 17C:}4rtt . t:)3:•!'
iZ} .i1 'i
r,.c,).cr-,i
1 e38'7 s . :r,s :'l7
(l') e 1 `{;•'-"-.;
r..36c?
S.[l . t:) .-681
1.861 6.c:)ff,8'
1{:4 . 1. 2••6
1.148 1.186 (;) . 83 1
1 .t:} l•ll• c:)
1.1S:" 1.S,68 (i) . 4"7 ff,
4 . `[l- :--'t3
1 .:-r•• J. C7
:" n'=-"' (S •t
1 e :" t:)1
E•l .6C79 1 . l•l!- 7(Lt)
(Z) .936 tZ) .9E} "7
2• .385 2• . -7 CI?3
5, . F,67
7 . 9E;S 7 . 61.:3 {:,)
1 CI7 . "7B(Zl
(Z) e 2" 2' 3
(:} .g79 1 . C,)3rf
3 . CIi, E• I• Ei
(r,) .36e
2• .691
* Variable numbersand sarnples are
are shown inshown in the
the footnote offootnote of Table
Fig. ZV-56 IV-15.

141
(16:O)(22:6) becomes relatively smaller. Up to these two
stages, the chromatographic patterns are analogous between
male and female. When the fish starts ascending the river,
drastic decrease in the asmount of group Ir! ( see the
footnote of Fig. IV-1 in section 2 ) especially the molecular
species of (16:O)(22:6) and (16:O)(20:5) are observed.
Unlike the chromatographic patterns at the stage of sea,
outstanding differences are observed between the male and
female. The coqtent of (22:6)(22:6) is extremely high
followed by (20:5)(22:6) in male. Finally at the stage of
spent salmon, (16:O)(22:6) as well as (16:O)(20:5) relatively
increase compared with the former stage in the river. These
are more concretely seen in radar charts of the main
molecular spe'eies as illustrated in Fig. rV-55. The axes of
these charts are the same with Fig. !V-33 in section 2. These
charts are arranged in sequence of mtgration movement
(anticlockwise). It is clearly seen from this figure that at
the stage of sea run, slight differences in patterns of radar
charts can be observed between the male and female while
that of river, outstanding differenees are observed
especially at the spawning stage. rt is obvÅ}ously seen from
this Fig. :V•-55 that the amount of (16:O)(20:S) is relatively
very small in feeding migration stase compared with those of
other three stages. The amount of (20:S)(22:6) and
(22:6)(22:6) is surprisingly high at the river spawning
stage.
The author has employed PCA again as discussed in the
previous section. As it is shown in Table IV-11, number of
variables which correspond to the number of molecular species

142
Tab1e IV-12,
.speeles
Print out of the correlation matrix atnongdetected.*
all molecular
=St=tSSst==t=S-S==tksnn-ta#=utnsx=St=MIIs=sansan#-ttnabnt==slt#=sk#stel=Sbe=sttt=t
'< -eareela'-ion Ma`.nu; > '
::3aS6 .7 9 1 t . :). ::, t- : e.e:e 1.•bt:,}tp 3 "J .77: ,- .l c-a : ."vae a op.ees. th.ss-t e.Ge3 ,:.•h. tpe S th.16: -•;.) P. 77 th.t03 e,3t-9 ' !Ree 6 e.sL3 A. i-=ls e..6:s e.3s6 .-e.:e3 1.etbo 7 e, .:t:,3 e.47g e.:• f,s e.:• ee -e .7e3 e.ae6 1.opoe S -tfl.k-: ;b.S.7e -!P.a19 -,e.:3e -e""99 -t-. .31t -e.369 :.tee.(b 9 op,tb76 -b.tJnlS e.•2,96 e.ae6 e.2•ee9 -e.32B e.:66 .e.3e7
ti:4 -Lh .::: -tP .2: :- -e .tlt e.eet e.f• 33 -tb .6e9 .e .t79 -e .399tl e.6S7 tt,.6ft',9 e.33S e.op:5, -e.466 e.9e: e.472 .e.2•76:: .`).ii.htld -:,.:-13 -e.:eb -e.349 e.t63 -e.e7t .-e.:e:, .e.39eIa e.76t" kl.?:: e.471 Åë.:69 -e.39B Åë.g67 ".4S$ .e.:98:a e.:ga e.t"3 e.i:e e.:tJg e.642 .e.1:t -e.:le -e.6:7:: -e.a2: -tb.4:•a .-e..191 .e.:63 -e.eop9 -e.3:6 .be.3e7 e.SA.e,l6 -e,4tt, -`b.aSa -e.t68 .*.:$e e.46S .".SS3 -".6"9 va.4elt7 -e.297 -t).349 .-,.E,94 .tb.:SS e.e:S -".3e7 -e.3e4 e.7:•4le tb.417 e.3gi e.kS37 -e.:S9 .Åë.S:e e.683 e.4S6 .e.:e4t9 • -e.:2T, e.i,S7 e.1:7 .Åë.vae9 e,39e .".441 -e.1:3 .9.4e6:te -e),4:•7 -e..r.=s -te.331 -te.:ss -•".e6:• .-e.33t .e.3e2 e.?7e:: -•?.•":7 e.ttl:: tb.t:3 -op.19e -e.iel e.tS3 -9.124 e.:•a92: O.:eS e.3e•S e.ii9 e.e37 -e,27: e.39: ".573 .0.7e6:•3 -e.3:6 -tb.::-7 -tb.::4 -e.:15 e.ISe -e.3•32 e.:6: -tb.SSt .2a c".t)67 e.e7c e.:se -e.13t e,e6? e.te6 -g.es: .e.e732: -,-.S;6 -tb.723 -e.:*3 -e.lr•e e.t32 -e.97e -e.:3: e.3ta:•6 e.7!• e.7k',6 e.4:t9 e.:56 -e.4eS e.962 e.4Se .e.:•962•7 -th.690 -`t).93a --").733 -gl.S3e e.213 -e.732 -e.6a4 e.736:•S op.*"E k).;14 e.e6ip e.::e e.36: -e.:17 e.W4 -e.77e:•9 --tb.2fe -"b.437 -`-.tlS op.2:8 e.::t -e.b?: -e.e62 e.:•9t3e -(e.e:t. •-tp.tdt7a e.:•:7 -e.nj7.t -tte.2•.e,e -e.3.7.-6 e.:A4 e.ve3: -t-.6a6 -fb.t4a -e.:•93 -t).a:3 -tb.t:+4 -e..t,43 -tb.::5, e.663 ' 9 trb. :: :: :3 ta 1: 16e s.tptittblf) t).7.S7 :.tbtbe:1 -,).:?tb -e.S39 t.etb".:".. -:b.:ea e.,':,!") -to.ey.s 1.eee:3 -b.314 -tP.!e3 ,O.9e2 -e.Q6: t.(b,be:a e.seg e.7o6 ee.2:4 e.:•J-7 .e.1:e. }.eee blr --.:•:: -tp.:sn .-).:sg .e.41B "e.3t:- .e.63e 1.eee16 -e.,ez: e.:• g7 ." .agt -,b .: t.? -a. .ev :•7 .-,e .e4s Åë.7?6 s.eee;r• .:o,3it',2• -x".::m. -,th.:72 -e.3g3 -e.2g4 `-e..e,s3 e.get e.e:•ale -e.::e. -`P.399 e.?31 -".•e39 e.e47 -e.e91 -e.2S4 -e.3:,3:? e.a .$ op .e:: -fe .37s -e.1:•a. ."."3 e..ssg .".e2g e.se42ti} -e.3:6 -e.363 .tb.:?3 .e.4:3 -Q.3t7 -e.6t-4 e.9Se e.63S:•: -`b.a:•6 -op.499 {-.:38 -e.4:3 e.:•:e -e.637 e.S27 e,.t•erp:: e) .:69 e.le9 `b .ael e.!S{b e.e:4 tb .39 th .sb .e24 -" .714:•3 tb.7:9 t".i3? -e.:•e7 e.3.:b -e.46e op.614 .`b.433 e.e:t:a -ti).:•f•1 --.I47 k).:::- e."41 e.;:2 .`.h.;99 e.3:2 e.36S,:f, ,e .Si6 e.S: :- -,b .74: •-t .th:- -J .e .et6 e.::e e.3ip9 op .4e• 2-2S --,b.3:: -•b.f•et;) {b,;es .-tb,tl6S. 1.op,be .-t-.::eaj .-tb.31t •fb.f•:a:7 -,t:t .::a {i, .,P7Åí -,.A .bi,3 O.:3r) .e .6'7a .tl, .: 23 e,664 tb .6a6:e J.,.53C, tb.Ttbl -:}.:1: e.a6a -e.:•66 op.776 -h..9e7 •t:.,.3bg2T" tb .S:3 op .:96 -i) ,SS3 .;b.: 7S .tZ .6?: k) .t,1 7e e.3a6 e.4373ep op.::: e.•be.:, -,b,:s? -e,.:-f•e -fb.31:• -re.a26 e.s,7e e.:ee31 -fi,.•)97 -,b .1:a -op .a6; -e.177 .th. ,e• :• ," -e .6:1 e.eVe e.6S:
:7 16 i9 :e 2: :: :3 24t7 t.GJaJro:S .,- ,2• U)t :.t"tb t.-:? .:.h.::t- -,-.:63 1,v)tbe:• U) tP .9.7t -oj .::7 `-t) ,:.t" S.". `lkb:i g',.:-66 th.:aS -tl.•b:.9 ").699 t.etb,-:•: -e,77: e.4ea -,tb.t.h64 .i-.$3S, .e.S3:• i.e`bfb23 -Åë.3E.e .e.:ts,e t",537 -ib.R,2,b -tP.f,66 ".49e 1.et)e2i g';.;.tr.s. s.::)•-:, :•:,.::2 ,".!t-e e..e.ag e.tt4 e.ess :.e*e:•e e.:S3 -,",!:t tb.324 e,3:4 .-e.::9 -e.:•e5 e.6ee pt.*2226 -`ip.:•9:• tuS:i -tb.41e .*.alS e.22-2 e.aS7 -th..4e,3 op.i:2:7 e.ee7 -e.4e.: -e.e74 o.733 e.nc6 -e.e6op e.ee7 e.lt:•:e -tb.76:b -•h.3tl e.a19 -op.9:e -e.S94 e.e.5,S th. .747 -e.:• f•S:q ei3akli -- i"".f,e8 e.:• 9S 9, .3 .".9 -e .e14 •- tb .2• L3 th .462 e.l f•63tb op .669 -u) .:• :a e.4Ee e.365 e.545 -e .3th.6 -.17S Åë.4e43: E,,.=64 -t:n.:•S.•6 op.'e'6B C..779 op.61: -e).5i3 -op,op44 e.4:9
:•S :•6 27 :•e :•9 3e 31:S 1.tbt:,,O:6 -E, .61t:o :.e p) ,b27 o.s=7 -*.66e 1.eee:•S e.139 .e.:67 -e.33e 1,etbtP29 i).9t):, -e.69E- op..S6e, e.Qt77 :.eee:•op op.413 -t-.3:ti, ,i,.:2•9 -.3e:• e.5e5 t.eee3t op.E,93 •-e.517 op.676 -e).S4e e.S96 e.776 1.tbeLa
TRA::- = 31
* Variable numbers are the same with those in Table ZV-11.

Tab
leZ
V-1
3.P
rint
out o
f the
eige
nval
ue a
ndco
ntrib
utio
nson
PC
A.
,::t,j
iY,r
.•fL
':N,E
-:'N
-r
1•
2"
3 4 5-,
6 7 s 9 1 [r
)
11
1:•
:
13
14
1 ff
,
16
17
*
:- X
GE
' NfV
ALU
L-
11
.534
S
.2•
19
3 .
E,B
9
2•
.BE
ii
2•
.189
1
.41E
)
1 .
2••
tZ}9
tb
. tb
q)
(z)
V
H)
" t{
}{{S
ft)
tp
. t{
} g.
} t{
)
t{
} . t
{} tt
) u)
t'
) t')
t'}t')
-
t-.-
(
,) .
{:)
(b (
,:)
. t
t) .
(t)
tt) t.
s)
c
:) .
cZ)E
)(i)
tJ
} t7
)t7)
t,)
-I-
.-
t,! (
A C
,) C
,)
---
--
**
nl-
37 .
2••
t:,)6
2•6.
.C-,
13
11.E
,77
9.1
96 7
. t:,
)61
4 e
'rr-
.'47
3 .
9tZ
) Lt
")
(!;
. c:,)
t:)
f:,)
ti)
[,)c,
)f,)
"s-
-- t,
) ;t)
ct)c
,) -
e.--
(t)
tt}
{t)
tt)
.-.-
- (
7-)
. Ci){
Z}{
Z)
cn
tt)u}
;,) -
I-.-
t/)
{/)
tt) tt
) -
t' -
- tt
) . c
p c.
,) tt
)
t!I .
{!}
tb tb
c{)
. t,.
) ct
) tt)
***
Aec
.'z 3
7 . :
• t:,
) eS
63.
719
75
.:• 9
6 8
4 .4
91•
91
.lf, l
f,3
96
. 1 C
,)(o
1 tZ
} f!)
. (:
)f)(
b
1 q-
} t!)
. {b
E)
cZ)
1 ct
)t:)
. q)
tz)t
;.)
1 ti;
C}
. tb
t:,)
t7.)
i tix
zl .e
t:x:)
1 (Z
l (Z
l . (
Z}
(ZlO
1 cb
t:t)
. {t
") c
i} cb
1 C
,) t:
) .E
)O(b
1()e
l . q
) c,
) (z
)
1 q)
c)
. (z)
cz)
o
1 ql
(b .
cbcz
}(:s
* **
***
Eig
enva
lues
wer
e ca
lcul
ated
by
the
Jaco
biZ
is th
e co
ntrib
utio
n.A
CC
.Z s
tand
s fo
r ac
cum
ulat
ed c
ontr
ibut
ion.
met
hod.
' ) w

144
Tab1e ZV-14.
to thePrint
scalar•::CXF•CNENT
outof
ofthe
LOADING >
the .elg
componentenvector on
loading rkPCA.
which corresponds
: 2 3 4 s 6 7 B gy le :1. t:'
:3 t4 sr•
:6 t7 le S9
:•e
21::
•:3:4:f:b:7,:•e
:•9
3e31
1 : :.
4e67e9
lelit::3ta:f'
;6!7:5:92e:'t
:•2:•:.
:a:f:s:7:s2q:. ti.)
-v:
COM i op . 779 tb.7e7 th . f,: :
e.36"•b i!, . :• 1 :
e.ea: A. .S•t7-t b.s3e-tfl . tb: 7
-e .: 23 e.774 ti .IXt e.e :• 3 e.:•75-e.779-t-.795-, " .7fe
tb .S99-e.:•31-tb .763-e.333
e.7 :• 3-e.eg:-e.13:-e.7.s1
te .st?.ttb .sgl
t" ."c09-e.6::-k" .:J.,S
-op .e44
9-e , to tb lt) ,
tb.';ntbt:-
e . ti,t) th
e , :st' tht-
.e , ,l)i{')tc1
-its , ,.-t:,)e
op . /t:)v:ip)
-e . lt:ici)e
a •;-lhth -ti-- e . :.:,tl,e
-e . ,bl't lb
-lt) ")'-'-
--le - /lll.t-;.)
--1 ::lt;pc;) te.---lh Jltht;1 -- --t- t-.:b-1-!h :"ath ---+--v). .'i Gi (-
• -tb . tht-e
- ve . lt.s v.le
-W.tptopki e , :btlpttl
ttl.t:"(-l)
-* . ::.t.:•t!b
- ..:t . :A:. th O
.t) . •h. e-:)
.tb,Cdtbtb
cb.."kbt).-tl) - v:)lt'itl
th si(:1th ------tb . :t 4El{b
:N :- :• ip.lf,1 e).t57 e.t:s--te.:f4
-• b.4f3 e.:e3 tb . tb f• e
e.563-,-.7::•-tb,se6 e.r,i:-op.34S e ,s:ib.Te.g:pe e.:;f:- e.,L)ga e.tf•6 e.4ae.e e,e.1 --k'-- e.fge e.8:7O.375-e.es6 te.:47-e.47te e.s:to e.est-- .9:7-e.37e e.se: e.3:7 :e-e . eth. op
e . etb(.n
.op . eklt:,
e . !btbk',
-e . th. ee
.".,-v)e e.t"opop e.•i ee.i- .et;"t.I
.e . et:d th.
.tZ- . C-9tb
e.t-et:o"tt) - L:)t)l:l
tl.tblb: tp . ;hetb
.e . ee,cn
-,b.:btbeb
-(h ththe ------ op . fhee
e.e,-e e.!-the-e .th. **
-a ththe .---. El.tbti)th
-e.tbtiitb.!h. .e. ti,cb
-e.e*").op.tbeli-.tb.,.:ltbte
e.tpoptb e.t;.lt-,"
N T 3 e.4lt- e.:44 *.793 e.691 e.3t: e.t4s e.egg -e.141 e.:ee e.236 .ti .tb46 .te . ,t.ng
op.e36 e.133 -).t9: op.34: e .3e :• -e.:•el e.494 e.ee7 e.339 -e.2:3 e.Qe: e .3e :, e.elg e .e :• e
.e.3te -op .0f,2 e.367 e,:is e.131 11 -e.oee .ib . ::ng`}lt1
.- .fbee . Tb . eltl ib
-e .etbQ "'0"a. th . •" ": e
-tb .eee •-,b .eee e.eee e.*tpe -se . t:-tbe
i- . tc'Hb`b
'b ")`)ti) -e . te t- el
e . eeth. -t) . eee q.eee' *.e"-e -e.eee -e.eee •-e.*ee e.?ee -e.eee .fb . ,;-elt-
e . the. e
-e.eee e.tbe{b e.eet .tb .l E,pt.
-(b .eee
4 e.3ope op .e: :-
e.t37 O.276 O.7S5 e.e7e-e .7t•9 e.i76•• e.:','3-e ,e :• 2•
..,- . 1bt)
e.e::•-".e6" e .:• 92 e.oj:g e.:65-e.e4e-• ib.331.e.:49 e.llt-a. .Ie3-e.4:7-e.444-e.2e:-e.3ts-e.e?3 e.t39 e.e3s.e =• 49-e.6"7-e.34s t:.e.klee-te.,etbe-e.+btbe * . :eti,t-
-e.lee.op . :-*e
".eee e.eee e.Qthe-e . .e v:pe
e thtath ------,i ththt;l - - - . - (- . :bt{ttl)
-,- . ,",;.!e
e . th. ,p e.
-e.cbee-e.t ee e.-ee-e.eee e.eee e . thee-e.etbe-e,eebe•- e.eee e.etbe e , ek'Ie
e.eee e.-bg)e e.:;,ope.t:i :;lthe -t--i-e . te' t-e
5 e . ope)tl)
-t).th16
emls.9.44f e.3e4 e.e4e-e.371-e. .3 2• 6
-e.283 e .: 2• :
e,t r• :-
e .3 :- 9
e.te7 e.2ee e.th. r•2
e.3ss e.tef, e.::s e.36e-e.166 e.2• s4 e.le7 e.sg7 en:t-e.t7e e."2 e.og:• e.e3:-e.249 Åë,M97 e.e49 t3-tb.pme e.oee e.eee e.oee e.eee-e . eept.
-".ecbe' e.eope-"."ee-e.eeeie . eeop-e.eetp.," . -:}*Et
-i ) . tc)e{tl
e.t"ecp ,e .eete op .eee-e,eeop e,eeo ".eeo e , tbec4
e.eope-eJ.eee-e.eee-e . tA. ope
-t e . optbt-
-e.eee-e.eee-e.eee-e . kb e',e
e.ÅëE,"
6-e . •h. a4
-tl.ees"tb.:43-op.:6a-,b .044-t.i ."a9
-e.e:1 e.e47 e.:a7 e.3e6 e.2:e.- !) . S• : 8
e.tln e.:s:• e.e4e kl.:•:4 e.e:u L-.a:9 e.362 e.e46 e.iee-e.t:4 e.of,4.e.422-e.ee: e .t -. s
"e.elg-e.1:•s-e.tss-e."o3-e.2:7 I4 e.eee ".ec-e e.i)etb. e.ope e.eopÅë-t e-pt"e.".tee o.oeÅë-th . thee
-e.eee-e .et)e-,) . t)eop
.i).*,be rb . gltt)t-
e.opee-e . ept)e
-r4 fht)e ------[-.•"e. op
.,h :hthtn •- -.-+ tb .eo,b e . t.h t:mp
-tb thtbe ----- e.eee-e . ee t.n
-,:e .epa.
-e.,)e. e-e. .e<4Q.tb . :bee
.(b .""ee"".•h. ee-,e.eeth
7 e.33t-e.:g3-e . e`,86
e.t39 e,t2-9 e .ee f•-e . cpt6B
e.194 e.4e6 e.to27 e.:g: e . t;n6e
a.:r, t., e.:•lf• e.di4e e.e37-e.elg e.:f.A-op .31 2•
e.131 e.e"g e.:la e.e63 e.: :• f•
e.2?4 e .1 : t• e ,: e f,
.e,s:7 e.373.e ,:e,.6
e.o:a ts e.eee e,etbe-e.i-e,e.e.e*e op .eetp.
e.opemp-e.eee-e.eee e,tee e.eee e.et)e.ih :nythth -t--- " . 'O v:t f-.
m a,h(b ------e.eeop e.eee-tb . eeti."
e.eee-,e.ee*-- e.etbe-e .eÅë' e
-tb.eee e.eee-e.e"e.e.thee e.eee-e.eee e.eee-e.ÅëÅëe-e.elecb e.thtbe
e kl.-gleO e.eee. e . ,et.bdi
e . .h ,- (e
-tt) . eedi
.!b . t?"be
e.thee-e.eech.e.eee e,eee.{b . etfie.
-tb , e)tptb
.e pl-1th -1-.] e.eeee-e.tbee-, b .eope-tb .eee o).oee e.eee-e . thk)e
-e .I ee e,eee e.eee- e .e t- e
.{b.et-Åë
.o)...)the
*.t-el g.-e"e-tb .e-b-p
e.eeo e.eoe t6 e.eee e.eee e , th. ee
pb . etb op
e.ei"e.t- . ee,-.e . •e eo d,"
e.eee-e . th op, e
-e.eee-e.eÅëe o . :bet"
.di . e*e";) "vhi.) i - - - .-e . -i tbop
.a. .{"e("-op . ectbte
-e . th. et"
.tn . t-tbe
-e . *E;e-e .elt',e
-e.eee-o.eee e.ee,e.- e . •"th. e
-e.ecne-th .et:.,e
e.eee-e .et) ut.
.th. . etbe
e . tptblip
1
234
f'
67e9
1t",
"12•
:3:4:5t6t7:8192•e
21:•:
:•3
:a:f'
:e272•S
:9:, p:)
3t
17 o . ,J efpt
• GJ.•t"ea.
•- e . k)ee
--,-.eope"- "tlopop
-t;J .oc-e th . ,J:I e) e.
{- . •,bei.lv
.t-,tbtPop
-A zae,Ih '-)--t'-e.etbe-op . •hee
-e,teee--).eee-e . ." ". op
-e , ,e e. `-
e . f"• fb to
.e.titee tb . te' etb
-e . t;Jtbe
-e.noe op,;ilE)tO
-te .t:4ope
t.h . ,-emp
.e . tbetp-,b . tn: ee
-op . it)ipe
th •n' th M ----- th :h p) th ----i a /:)th(" - - - - - th •:}(hdi .I---
rk The row andnurnbers
the
as same
columnwith
arethose
variable.In Tab1e ZV-11.

145
2
21'
',atlxt{151Z70I,.8..,,.ZX,
11,26--
ts.;2.x,s.ts "..".itXs,t3i•--.........-2)J,,-"'--b--cr,-,-Ni'kk>,,
.l;--f?..'
r't"2'
.."
.Z,.tl-.e."/x-'
.JldvrSieF-
"-t 5ee--
"/--
.
..lae'X------t-
ri-t-.."
--'-1,2
27JS:-:---"ny-ut:EL--;......"-"---s•--- .-
"3.-ny-------7
N't)'N"N..s's-.'-t-
Nix"":-7::.:::4---t"Ns...S'-.'1XNs12
ls--N
"' "22'
x,
"l
I
•14}
-t
:10as ,s
28
1
1. (16:2)(20:5) 5. (20:4)(22:5) 9. (20:4)(22:6)13, (22:6)(16:1)17. (17:O)(22:6)21. (18:1)(22:6)25. (16:O)(22:6)29. Unknown
2.6.
10.14.18.22.26.30.
(20:S)(20:5)(22:5)(22:6)(22 :5) (22 •: 6)
(16:1)(22:6)(20 :5) (18: D(20:5)(16:O)(22:5)(16:O)(18:1) (16:O)
3. (20 7. (2011. (2215. (1419. (1823.27.
(16(16
31. (16
:S) (22:6):3) (22 :6):4) (22:6):O) (20 :5):1)(20:5):O)(20:5):O)(22:5):O)(18:1)
4, (22 8. (2012. (1616. (1420. (2224. (2228. (16
:6)(22::5)(22::1)(20::O) (22::6) (18::6) (16::O) (20:
6)5)5)6)1)
o)4)
Fig. IV-56. Eigenvectors of al1 detected mo1ecu1ar .specles on thefirst and secend principal component plane on PCA.

146
3
30x19Lst29i6..I!.-...l)tsY2xpt.sX>249
,,1-5.:-:-,,;.:..-:':.=--'{-//t`;-:.,tL,.!OgS..k,,,,--k----;;.-
31-t1ttt4.,f])i"1,,1ti,/1.-•2!l••//.r;1.1i,{li""!r.t]-'"'!ri,/x'.Ct..tst"fiii..:......-..-.,,..7-•-----O-136
'x-- ---- -I-
""---t.i-"--..
8----'--- .-"---'-'-
-' `",,'"----".' ;-;2Elpt.-:--11'
}'-e.---------S/,,,-""")""-8""---22
xIIs,x,12
•1
1. (16: 5. (20: 9. (20:13. (22:17. (17:21. (18:25. (16:29.
2) (20 :5)
4)(22:5)4)(22:6)6) (16 :1)
O)(22:6)1)(22:6)O) (22:6)
Unknown
2. (20: 6. (22:10. (22:14. (16:18. (20:22. (20:26. (22:30. (18:
5)(20:5)5)(22:6)5)(22:6)1)(22:6)5)(18:1)S)(16:O)5)(16:O)1)(16:O)
3. (20 7. (2011. (2215. (1419. (1823. (1627, (1631. (16
:5) (22:6):3)(22:6):4) (22 :6):O) (20:5):1)(20:S):O) (20 :5)
:O)(22:5):O)(18:1)
4. (22: 8. (20:12. (16:16. (14:20. (22:24. (22:28. (16:
6)(225)(221) (20O)(226) (186) (16O) (20
:6):5):5):6):1):o):4)
Fig. ZV-57. Eigenvectors of all the detected molecular .speczes onthe first and third principa! component plane on PCA.

Tab
1e:V
-15-
.P
rint
out
of th
e•pr
inci
pal
load
ing
(com
pone
ntsc
ore)
on •
PC
A
<P
RrN
CIP
ALL
OA
D:N
G>
1 2 3 4 .Je 6 7 8
PR
:
l-1
6.35
,2--
12.7
37 L
n . c
:)44
-• r
) .9
2• 7
14.3
1517
. 1
th. e
tb.3
68-1
.812
N C
IP
2 8
.e27
8.e
,1E
, -
-6.2
45-1
2.11
6 4
.3e7
e.9
46 -
5 .5
2•
6 -
5t .
4th8
AL
3 4e4
58-3
.S,6
4 1
.'e7
7
3.1
77 3
.65B
-1.7
S4
-1.9
12--
S .
1 1
a.J
4 -1.IB
q) 1
.9M
. 2
--5
. 3th
6
t.65
4 3
.165
-2•
.333
2.3
37-E
, .23
9
e,
2 .5
e3-3
.121
-2•
.76e
o O
.24B
-1.th
11 1
.217
v).
221
:.7C
i2•
6 e.e
E,3
e.1
48-c
n.f,4
•e
e.9
91-1
.82•
5
;.49
3 t
.7 "
s S
.
-2.E
,2.E
t
7 -e.4
49 e
.837
-e.6
e6 1
.841
-e.4
66 e
.76G
)-2
.172
e.2
EE
,
8 -C)
. Q)L
)O-e
) . c
4 ti)
ro
e.e
ee e
. t!}
v'4
tb
-Q)
. cb
G)
tb
-e .
e) c
ew e
. ql
u).
":J
e .
c) (
1) c
o
t 2 3 4 eJ 6 7 8
9 e.o
ee e
. co
tbth
.
cn.
.a)e
op
-o.e
ee-e
. ee
th.
-e.e
oe-c
t) .
u)w
o
o.c
)c4e
10
-e.e
ee-e
.eeo
e.e
ee-e
.eeo
e.e
eo e
.eee
e.u
)ee
e.e
ee
11
--e
.ooe
e.o
pee
-e .e
ope
e.c
oec)
-(b
.eet
h.
Q)
. ooe
-e .
op (
be
e.e
ele)
12
-e.e
eo e
.opo
pe-e
.eeo
o .o
opq)
-tb
.eee
e.e
ee e
. cJ
ec,)
-e.e
oe
13
E)
."pe
e-c
b . c
:4ee
o .
eop
a.1
-c,I
. cbe
tb
-q, .
ope
e
Q}
. eee
)
-(i .
eee
e.e
ee
14
-o.e
ec.
-e.e
ee o
.eee
e .e
eo e
.eee
-e.e
eo e
.eJe
e o
p . t
eetb
15
-eo
. a)
ti.)e
e.u
')oe
e.e
eo-o
.o":
e
e.o
poe
--o.
eoe
-e.e
,ee
-(b
. e. o
cn
16
-c )
. cn
t.t)
e
--e)
.tbop
e e
. g)
etb
-t)
. c)
t:)e
Q)
. c:,)
oqi
e .e
c;)e
-e .
v:}c
4e
QI.Q
)OE
)
t 2 3 4 5-, 6 7 s
17
op
. a.)
a)
th.
tt)
. EJ
clJ
th
-- E
:J .
c:}
e) e
t:•)
. tl)
t:,1
tiJ
-E, .
deo
e
o .
I:)oe
O .
oi:}
q')
-O .
Q)
iz1)
q)
Row
1:F
eedi
ng m
tgra
tton,
2:F
eedi
ng m
tgra
tton,
3:S
paw
ning
mtg
ratto
n, 4
:Spa
wni
ng m
igra
tion,
s:S
paw
ntng
mlg
ratlo
n. 6
:Spa
wni
ng m
igra
tion.
7:S
pent
, Mal
e, 8
:Spe
nt. F
efna
le,
Ma1
e.F
efna
1e,
Mal
e (S
eQ).
Fem
ale
(Sea
), M
ale
(Riv
er),
Fet
na!e
(R
tver
),
p ) N

148
2
IVIFoo
MAFMF
1
oM:oF:eM:eF:aM:mF:AM:AF:
Feedtng migration,Feed1ng migratlon,Spawning mtgratton,Spawnlng migration,Spawning migration,Spawning migration.Spent, Male,Spent, Female,
Ma1e,Fema1e, Male (Sea), Female (Sea), Male (River), Fema1e (River),
Fig. TV-58• Plots of principalprincipal component planeRefer to the eigenvectorsthis plane.
loading on the first and secondon PCA.in Fig. ZV-56 as background of

149
3
oF Me o
M
F M -oEo F
A
1
oM:oF:eM:eF:oM:oF:AM:AF:
Feeding migration,Feeding mtgration,Spawning mtgration.Spawning migration.Spawning migration.Spawning migration,Spent, Male,Spent, Female,
Ma1e,Fema1e, Male (Sea), Female (Sea), Male (River), Female (River),
Fig. :V-59 Plots of princÅ}palprincipal eomponent planeRefer to the eigenvectors
loading on the first and thirdon PCA.in Fig. IV-57 as background of this plane.

150
are 31 ( see the footnote of Fig. rV-56 ). And number of
samples correspond to the four different migratory stages of
two different sexes ( see the footnote of Table ZV-15). '"MEANt' is the average amount of each molecular species of the
four stages and "S.D." is standard deviation. Correlations
among all detected molecular species are shown in Table TV-12 'and eigenvalues calculated by the Jacobi method from Table
rV-12 are shown in Table rV•-13. Values of contributions are
also shown in this Table. Though variables were up to 31, the
accumulated contribution was 63.7Z when employed to the
second principal component.
rn Fig. IV-56, eigenvectors of all detected molecular
species are shown as small numbers on the first and second
principal component plane. These are drawn up from the print
out of component loading in columns 1 and 2 in Table :V-14.
And in Fig. !V-S7, eigenvectors of the same molecular species
are generated on the first and third principal component
plane. And these are drawn up from the print out of component
loading in columns 1 and 3 tn Table IV-14 as well.
Principal loading in Table rV-15 was plotted on the
first and second principal co' mponent plane as shown in Fig.
rV-58 and on the first and third principal component plane as
shown in Fig. IV-59. The mQvement according to the stage of
migrations are shown by arrows. Very interesting movements
are observed in this figure. By refering the eigenvectors in
Fig. rV--56 at the same time, it can be observed that the
movement direction from feeding migration stage to spawning
migration stage (sea) is nearly parallel to the eigenvectors
numbered 8, 15, 17, and 20 whiie it mtikes a right angle

151
against eigenvectors 25 and 29. This shows that although the
amounts of number 8 ( (2Q:5)(22:5) ), number 15 ( (14:O)
(20:5) ), number 17 ( (17:O)(22:6) ) and number 20
(.(22:6)(18:1) ) are small as have seen in Fig. !V-51 and
Fig. :V-52, drastic decrease of these molecular species
occurs between these two stages, making good contrasts to
number 25 ( (16:O)(22:6) ) and 29 (Unknown) which keep the
constant amount. On the other hand, when the migratory stage
proceeds to the spawning stage in the river, the movement of
the arrow in this figure becomes almost parallel to the ,
eigenvectors of number 25, 29 and also 6, 11, 13, 18 and 26.
Number 25 is (16:O)(22:6), and the rest 6, 11, 13, 18 and 26
are small peaks. So it might be possible to conclude that
(16:O)(22:6) is almost constant at the sea stage and becomes
changeable at the stage of river.
Spent salmon showed an analogous position with thst of
spawning migration stage in the sea in PCA planes as it is
shown. in Fig. IV--58 and Fig. IV-S9. And from these two
figures, it is clearly seen that the differences between male
and female are considerablely smail compared with the
differences among the migratory stages.

152
CHAPTER V
GENERAL SUMMARY AND CONCLUSIONS
Superiority of the reversed-phase type HPLC was
emphasized.
rn chapter I, it was suggested that dephosphorylation
followed by acetylation is effective in separating the
critical pairs of the lecithin molecular species on HPLC. The
positional isomers were also separated to some extent unlike
the triglycerides. And a new matrix model was proposed for
the prediction of molecular species of lecithin. The matrix
modei was as follows: 'x d, CN= Pi.log(RRT)+qi CN" c, d2 DB= Pz•log(RRT)+q, DB= cC,' 212
where ci, c2 and dt, d2 are acyl carbon number and the number
of double bonds in each acyl group line up in a similar way.
x and y are variables of acyl carbon nurnber and number 6f
double bonds, respectively. P, and P2 are the slopes and q, and
q, are the in'tercepts on the ordinate of the semilogarithmic
plots of the RRTs of molecular species against CN or DB. RRT
is the relative retention time ( in general, it should be
relative retention ).
Zn chapter I:, the matrix model proposed in chapter :
was developed into the rules for molecular species of
triglycerides. This idea was based on the expansion of matrix
of (2,2) ty.pe model for the lecithin molecular species to
the matrix of (3,2) type model for the triglyceride molecular
species. The matrix model for the triglyceride was as
fo;lows:

153
cN= pi•iog(RgT)+q, cN=lll; ddd';i
DB= Pa'log(RRT)+qi DB" ICC.'2, Ydd,2i
' 'where ci, c2s c3 and dh d2, d3 are acyl carbon number and the
nu•mber of double bonds in each acyl group linhe up in a
similar way. x and y are variables of acyl carbon number and
number of double bonds, respectively. Pi and Pi are the slops
and q, and q, are the intercepts on the ordinate of the
semilogarithmic plots of the RRTs of molecular species
against CN or DB. RRT is the relative retention time. This
matrix model was verified by the actual analysis of
triglycerides from natural sources and from thechromatographic results presented by other investigators!1,38,39)
The theoritical background of the proposed new model was 'considered by introducing the theory of Martin.42) He
formulated the equation:
'kiZ.F!}T='4`iS.iFAT +4fig.2S'T , in(ctqAB)=ALi(l.I&T
where A, B are members of a homologous series, differing bythe functional group X, ct is the partition coefficient and ";l!tZ
is the differences in chemical potential of the group X in
polar or non-polar phase of the chromatographic system. It
follows that each group in the solute molecule contributes
more or less independently to the differences in standard
free energy of the solute between the two different phases.
Thus, in general, there is a linear relationship between ln 6<
or log <)( and the number of functional groups in a homologous
series. By substituting A in Martin's theory42)as

154
c, d, c+i x dltriglyceride species c2 d2 and B as c2 d2, X will becomea functionai group. orC3wed3couid aisoCgubgeitute A as icC2i dd2'l
and B as Ccci 32 giltYl, then y win'aiso become a functionailC3 d3t
group. rn this case, X corresponds to -CH2- unit and Y
corresponds to -CH=CH- unit. The chemical potential of the 'triglyceride molecule is principally affected by these X or 'Y, since in accordance with the elongation of the hydrocarbon
chain or increase in the nurnber of double bonds in the acyl
group, the plots of RRT of each molecular species draw an
ascending or a descending straight line.
Thus the physicochemical background ef the matrix model
has been demonstrated from the theory of Martine2) A more
detailed considerations were also done in this chapter !r. ' 'Strictly speaking, in additton to the physicochemical
functional groups, that is, -CH2- and --CHsCH-, the
differences in arrsngement of these units might slightiy
affect the total chemical potential of the triglyceride
molecule ( it was called sc factor ). And from the view point
of stereospecific structure, we should consider about the
degree in bias between the positional isomers. So the author
has concluded that the chemical potential of the triglyceride
molecule is the resultant of all functional groups in them o l e c u l e . T h e c ? g md, u p p e d c h e m i c a l p o t e n ti a l ()/cC ) o f
triglyceride C2 d2 was written as follows: d3 C3 xtL=g[f(ci, di, 3tt ), l(c" d,, R. ), }(c3, dj, St3 )}
where St is an St factor, f is the chemical potential given
by the hydrocarbon chain, and g is the function of chemical
potential given by the differences in positional isomers. Zn
order te give shape to this function, it was concluded that a

155
more precised instruments ( column, pump and detector of the
HPLC ) that gives a perfect reproductive data is required.
Name2x,dÅíor ,example, if the differences of RRT between 2C i ddd31
and c, di can be measured perfectly, then the relation c3 d3between f(ci, di,.Sti) and f(c. d2, SUL) can be formularized by
analyzing the multiple data. The 3-7ttm type column packing is
'expected for this purpose.
The theoritical relationship between the presented
matrix model demonstrated in this study and the conventional
ECN theory was also discussed in chapter I:. Tt was proved
mathematically that ECN is the degradated form of the
presented matrix model.
In chapter Irl, the computer software for the
identification of lecithin molecular speci,es was designated.
The order of priority in the computer program for the
identification of'lecithin molecular species was as follows:
1. When there is a same molecular species in the data ' file, the RRT of this moiecular species is printed out.
2. When there are molecular species that belong to the E2 dd2t group ( or fii gij ), a regression iine is
generated and the RRT of the predicted molecular species
is printed out.
3. When there are two parallel line groups that slightly
differ in the slope due to the arrangement of -CH2- and
-CH=CH-- units in the molecule, parallelogram is
generated. And the RRT of the unknown vertex of this
parallelogram is printed out.
4. When there are molecular species that belong to the d, group ( when the combination of the acyl carben d2

156
' number is unknown ), the slope of the generalized
regression line is introduced. And the RRT of the
predicted species is printed out.
Though there is still a limitation for the perfect
identificstion of all the molecular specÅ}es contained in the
samples from natural sources due to the incomplete
reproducibility of.RRT, this computer software might be
convenient in predicting the generally found molecular
•specles.
rn chapter rV, from the view point of muscle lecithin 'molecular species, sardine, mackerel, big-eyed tuna, brown
sole, sand flounder, rock fish, Alaska pollack, chum salmon,
blue shark, mackerel shark, carp and rainbow trout were
examined on HPLC. Amoung the fish examined, flat fish such as
brown sole and sand fiounder were extremely characteristic
since these fish contained (16:O)(20:5) as the most prominent
species unlike the rest of the fish that had (16:O)(22:6) as
the most prominent species. Cartilaginous fish such as blue
shark and mackerel shark had a very few amount of molecular ' 'species that have the combination of highly unsaturated fatty
acids such as (20:S)(20:5), (20:5)(22:6) and (22:6)(22:6).
This was also observed in fish from fresh water such as csrp
and rainbow trout. The main differences between the
cartilaginous fish and the fresh water fish were in the
contents of molecular species composed of 20:5 represented by
(16:O)(20:5). These were rich in the cartilaginous fish.
Principal component analysis (PCA) was done in order to
characterize each fish in relation to all other fish
examined. Except sardine dark muscle, chum salmon ( feeding

157
migration ) and rainbow trout, a reflectsble movement in the
content of (20:5)(20:5) was observed in the majority kind of
fish examined.
Chum salmon of four different migratory stages were
analyzed in the sarne manner. By introducing PCA again for the
interpretation of muscle lecithin molecular species analysis
amoung the migratory stages, interesting movement were
observed on the first and second, as well as the first and
third principal component plane Sn accordance with the
advance in migration. The plots of male and female moved
aimost together on these plane. This ituplies that although
there are some differences between male and female especially
at the stage of spawning migration in the river, these
differences are not so large as the differences between the
migratory stages. Zt was clearly seen that at the stage of
spawning migration in the river, molecular species of
(16:O)(22:6) drastically decreased.
The study in molecular species of fish lipid is at the
dawn of a new age. Especially for the analysis of
triglyceride molecular species, an effective high performance
column that has a thorough theoritical plate to separate
individuai molecular species is principally required. And a
conbination with the flame ionization detector (FID) or with
the mass spectrometer is expected to back up a more precised
determination. Attempt on the analysis using (FID) on HPLC 49-S4)has done by Privett et al. And that on the analysisusing mass spectrometer combined with HPLC has done by Kuksiset al?5) Matsushita et a15.6) have used a mass spectrometer on
the fractions obtained by HPLC manually. There is also an
158
attempt done on a mass spectrometer without using HPLC forthe fractionatioi7'"63)or by high a field ?3c nuclear magnetic
resonance spectrum (NMR) alone64? But from the author's point
'of view, at least the HPLC fractionation might be inevitable
prior to the mass spectrometer or NMR analysis. And these
should be used only when it is necessary to analyze the
overlapped peak on HPLC since the analytical cost using the 'mass spectrometer or NMR might be wasteful.
In this study, principal consideration for the complex
lipid molecular species analysis was on lecithin. But the
author is quite sure that the matrix model presented fQr the
lecithin HPLC analysis well fits to the other complex lipidmolecular species analysis as wen. Nakagawa et a16.5'66)worked
'on the phosphatidylethanolamine molecular species of bovine ' 16) 13)brain and Un Hoi Do et al., as well as Smith et al. worked
on the ceramideS of bovine brain in addition to the studieson lecithin molecular species97) !n accordance with the data
accumulation in these field, the invariability of the matrix 'model for all kinds of lipid molecular species is sure to be
verified.

1.
2.
3
4
s
6
.
.
.
.
7.
8.
9e
159
REFERENCES
'K. Takahashi, K. Zama and T. Matsuoka: Molecular Species
of Fish Muscle Lipids. r. Molecular Species of
Triglyceride and Phosphatidylcholine of Sardine and
Rainbow Trout. Bull. Fac. Fish. Hokkaido Univ., 2:tL,
378'v385 (1978)•
A. H. El-Hamdy and E. G. Perkins: High Performanced
Reversed-Phase Chromatography of Natural Triglyceride
Mixtures. J. Am. Oil Chem. Soc., 2t, 49.-63 (1981).
H. Hatano: "Saishin no Ekitai Kuromatog'raf' i." J. Jap.
Chem., 3:5, 283•v292 (1981). (In Japanese).
R. E. Pauls: A Time Normalization Study of the
Separation of Olive Oil Triglycerides. J. Am. Oil Chem.
Soc., S.StL, 819.v822 (1983).
Waters Associates Inc. LC seminar, held in Sapporo,
Japan, in June 6th, 1980. 'S. Wada, C. Koizumi, and J. Nonaka: Analysis of
Triglycerides of Soybean Oil by High-Performance Liquid
Chromatography in Combination with Gas Liquid
Chromatography. Yukagaku, Z6, 95N99 (1977).
S. Wada, C. Koizumi, A. Takiguchi and J. Nonaka: A Study
on Triglyceride Composition of Lipid from Commercial
Beef by High-Performance Liquid Chromatography. ibid.,
kt, 579N584 (1978).
N. A. Porter, R. A. Wolf and J. R. Nixon: Separation and
Purification of Lecithins by High Pressure Liquid
Chromatography. Lipids, L4, 20•v24 (1979).
R. D. Plattner, G. F. Spencer and R. Kleiman:

10.
11.
12.
13e
14.
15.
16.
160
Triglyceride Separation by Reverse Phase High
Performance Liquid Chromatography. J. Am. Oil Chem. Soc.
,L4, 511N515 (1977).
R. D. Plattner: High Performance Liquid Chromatography
of Triglycerides: Controlling Selectivity with Reverse
Phase Columns. ibid., Lt, 638•v642 (1981).
A. H. El-Hamdy and E. G. Perkins: High Performance
Reversed Phase Chromatography of Natural Triglyceride
Mixtures: Critical Pair Separation. ibid., SLt, 867tv872
(1981).
B. J. Compton and W. C. Purdy: The High-Performance
Liquid Chromatography and Detection of Phospholipids and
TriglyceridesL Part 1. Nonpolar Stationary Phase
Chromatographic Behavior in Ultraviolet Transparent
Mobile Phases. Analytica Chim. Acta, 141, 405'v410
(1982).
M. Smith, P. Monchamp and F. B. Jungalwala: Separation
of Molecular Species of Sphingomyelin and Ceramide by
Argentation and Reversed-Phas6 HPLC. J. Lipid Res.,
Lt, 714'v719 (1981).
J. Y-K. Hsieh, D. K. Welch and J. G. Turcotte: High
Pre.ssure Liquid Chromatographic Separation of Molecular
Species of Phosphatidic Acid Dimethyl Esters Derived
from Phosphatidylcholine. Lipids, L6, 761•v763 (1981).
N. A. Porter, R. A. Wolf and H. Weenen: The Free Radical
Oxidation of Polyunsaturated Lecithins. ibid., L5,
163•-167 (198O).
C. G. Crawford, R. D. Plattner, D. J. Sessa and J. J.
Rackis: Separation of Oxidized and Unoxidized Molecular

17.
18.
19.
20.
21.
22.
23.
Species of Phosphatidylcholine by High Pressure Liquid
Chromatography. ibid., Lt, 91tv94 (1980).
Un Hoi Do and P. T. Pei: Separation of Molecular Species 'of Ceramides as Benzoyl and 7e-Nitrobenzoyl Derivatives
by High Performance Liquid Chromatography. ibid., !-Q,
855'-862 (1981).
J. Y-K. Hsieh, D. K. Welch and J. G. Turcotte: General
Method for the Analysis of Phosphatidylcholines by
High-Performance Liquid Chromatography.
J. Chromat., 208, 398'v403 (1981).
M. Smith and F. B. jungalwala: Reversed Phase High
Pe'rformance Liquid Chrornatography of Phosphatidylcholine
: A Simple Method for Determining Relative Hydrophobic
lnteraction of Various Molecular Species. J. ,Lipid Res.,
k2, 697N704 (1981).
G. M. Patton, J. M. Fasulo and S. J. Robins: Separation
of Phospholipids and :ndividual Molecular Species of
Phospholipids by High-Performance Liquid Chromatography.
ibid., Z.L3, 190•v196 (1982).
T. Ohshima, S. Wada and C. Koizumi: Estimation of
Possible Fatty Acid Combinations in Phosphatidylcholine
and Phosphatidyl'ethanolamine of Cod. Bull. Japan.iSoc.
Sci. Fish., A:tL, 123A-130 (1983).
T. Ohshirna and C. Koizumi: Accumulation of
Lysophosphatidylcholine and Lysophosphatidylethanolarnine
in Muscle of Fresh Skipjack. ibid., A:ti, 1205.v1212
(4983). (In Japanese).
T. Ohshima, S. Wada and C. Koizumi: Deterioration of
Phospholipids of Skipjack Muscle during Ice Storage:
161

24.
25.
26.
27.
28.
29.
30.
31.
32.
162
Mainly Concerning to.Enzymatic.Hydrolysis of
Phosphatidylcholine. ibid., A.Lt, 1213•v1219 (1983).
(In Japanese). 'T. Ohshima, S. Wada and C. Koizumi: Enzymatic
Hydrolysis of Phospholipids in Cod Flesh during Cold
Storage. ibid., 24 , 1397A.1404 (1983). (In Japanese).
T. Ohshima, S. Wada and C. Koizumi: Enzymatic
Hydrolysis of Phospholipid in Cod Fresh during Storage
in Ice. ibid., SLO, 107.-114 (1984). (In Japanese).
W. E. M. Lands and P. Hart: The Control of Fatty Acid
Composition in Glycerolipids. J. Am. Oil Chem. Soc., AtL,
290-295 (1966).
O. Renkonen: lndividual Molecular Species of Different
Phospholipid Classes. Part II. A Method of Analysis.
ibid., 42, 298•v304 (1965).
O. S. Privett and L. J. Nutter: Determination of the
Structure of Lecithins Via the Formation of Acetylated
1, 2-Diglyceride. Lipids, Z., 149.v154 (1966).
A.. F. Prevot and F. X. Mordret: "Utilisation des
Colonnes Capillaires de Verre pour 1'Analyse des Corps
Gras par Chromatographie en Phase Gazeuse." Rev. Fse
Corps Gras, Z;3L, 409•v423 (1976). (In•French).
S. Funahashi, I. Hara and T. Yamakawai in "Lipid 1.t'
Published by Ky6ritsu-Syuppan, Tokyo, 1970, 531 pp.(tn Japanese).
H. Kosugi and N. Ueda: "Hito Hishi no Bunseki•-tokuni
Toriguriserido no K6z6." Proc. J. C. B. L., Lt, 9"v12
(1976). (rn Japanese).
K. Zama, T. Maruyama and K. Takahashi: Lipids of the

33.
34.
35.
36.
37
38
.
.
39.
163
Crustacea. I. Lipids of the Muscle and the Egg of the
Prawn(YPgul!gJLgJ2-s.i.sandlo japonica).Bull.Fac.Fi.sh.Hokkaido
Univ., 2.7L, 181•v190 (1976). 'K.Takahashi, F. Cabling Jr and K. Zama: Molecular
Species of Fish Muscle Lecithin. II. Changes in
Triglyceride and Phosphatidylcholine Molecular Species
of Sardine after Frozen Storage. ibid., 2.Lt, 386."391
(1978).
A. Kuksis: in "Progress in the Che'mistry of Fats 'and'
Other Lipids" (ed. by R. T. Holman), Vol. 12, Pergamon
Press, Oxford, New York, Toronto, 1972, pp. 105-vlll.
R. Wood and F. Snyder: Tumor Lipids: Metabolic
Relationships Derived from Structural Analyses of Acyl, 'Alkyl, and Alk-1--enyl Moieties of Neutral Glycerides and
Phosphoglycerides. Arch. Biochem. Biophys., 131, 478,v494
(1969). 'D. B. Menzel and H. S. Olcott: Positional Distribution
of Fatty Acids in Fish and Other Animal Lecithins.
Biochim. Biophys. Acta, eL4, 133N139 (1964).
S. Wada: User's Communications. Jasco Report, Lt, 18•v20
(1983). (In Japanese).
E. G. Perkins, D. J. Hendren, N. Pelick and J. E. Bauer:
High Performance Reversed-Phase Chrorn' atography of the
Triglycerides from Human Plasma Lipoproteins. Lipids,
L7, 460•v463 (1982).
C. Merritt, M. Vajdi, S. G. Kayser, J. W. Halliday and
M. L. Bazinet: Validation of Computational Method for
Triglyceride Composition of Fats and Oils by Liquid
Chromatography and Mass Spectrometry. J. Am. Oil Chem.

40.
41.
42.
43.
44
45
.
.
46.
47.
48.
164
Soc., :Lt, 422"v432 (1982).
M. W. Dong and J. L. Dicesare: Improved Separation of
Naturai Oil Triglyceride by Liquid Chromatography Using
Columns Packed with 3-7-Lcm Particles. ibid., 6Lt, 788,v791
'(1983). ' 'M. Watari and M. Kishi: in "Personal Computer Library
Vol. 3." Published by K6gaku Tosho, Tokyo, 1982, pp. 4•-1-v '4-11 (In Japanese). 'A. J. P. Martin: Some Theoretical Aspects of Partition
Chromatography. Biochem. Soc. Symposia, (Cambridge,
England), .;i}., 4•-20 (1950).
Y. Toya, M. Umezawa, T. Takatori and S. Hara:
"Toriguriserido no HPLC Bunseki.t' Sammary book of the
22th anual meeting of Japan Oil Chem. Soc., Osaka, 1983,
144 pp. (In Japanese).
Z. Isihii: "!atorosukyan (Shinkurogurafu)." Med.
Technol., Q, 1196.v1202 (1980). (In Japanese).
R. T. Crane. S. C. Goheen, E. C. Larkin and G. A. Rao:
Complexities in Lipid Quantitation Using Thin Layer
Chromatography for Separation and Flame Zonization for
Detection. Lipids, Lt, 74At80 (1983).
J. K. Kaitaranta: TLC-F!D Assessment of Lipid Oxidation
As Applied to Fish Lipids Rich in Triglycerides. J. Am.
Oil Chem. Soc., 2t, 710'v713 (1981).
C. C. Parrish and R. G. Ackman: The Effect of Developing
Solvents on Lipid Class Quantification in Chromarod Thin
Layer Chromatography ! Flame ronization Detector. Lipids7
Lt, 563-565 (1983).
M. Watari and M. Kishi: in "Personal Computer Library

49.
so.
51.
52.
53.
54.
55.
165
Vol. 3." Published by K6gaku' Tosho, Tokyo, 1982, pp.
9-IAv9-12 (In Japanese). 'A. Stolyhwo and O. S. Prevett: Studies on the Analysis
of Lipid Class by Gradient Elution Adsorption
Chromatography. J. Chromatogr. Sci., Lt, 20,v25
(1973).
W. L. Erdahl, A. Stolyhwo and O. S. Privett: Analysis of
Soybean Lecithin by Thin Layer and Analytical Liquid
Chromatography. J. Am.' Oil Chem. Soc., ,5!OL, 513tv515
(1973).
O. S. Privett, K. A. Dougherty, W. L. Erdahl and A.
Stolyhwo: Studies on the Lipid Composition of Developing
Soybeans. ibid., 5Q, 516,v520 (1973).
F. C. Phillips, W. L. Erdahi and O. S. Privett:
Quantitative Analysis of Lipid Classes by Liquid
Chromatography Via Flame Ionization Detector. Lipids,
L7, 992'v997 (1982).
F. C. Phillips and O. S. Privett: Analysis of Lipid
Clas,ses and LipofuscÅ}n Sabstances by High Performance
Liquid Chromatography. J. Am. Oil Chem. Soc., L8,
59Otv594 (198!).
F. C. Phillips, W. L. Erdahl, J. D. Nadenicek, L. J.
Nutter, J. A. Schmit and O. S. Privett: Analysis of
Triglyceride Species by High-Performance Liquid
Chromatography Via Flame :onization Detector. Lipi'd$,
Lt, 142•-150 (1984).
A. Kuksis, L. Marai and J. J. Myher: Strategy of
Glycerolipid Separation and Quantitation by
Complementary Analytical Techniques. J. Chromat., 273,

S6.
57.
58.
59e
60e
61.
62.
166
43-•66 (1984).
S. Matsushita, Y. Tada, N. Kawamura, E. Ohnishi, Y.
Maeda and T. Ikushige: Rapid Analysis of Triglyceride of 'Oils and Fats by High Speed Liquid Chroma.tdgraphy. "T6y6
S6da Kenkyfi H6koku," 2L4, 29N33 (1980). (Zn Japanese).
M. Fukatsu, Z. Watanabe and T. Tamura: GC-MS Analysis of
Triglyceride I. Total Fatty Acid Composition.
Yukagaku, 2t, 215.v217 (1982). (Zn Japanese).
M. Fukatsu, K.Tanaka and T. Tamura: GC-MS Analysis of
Triglyceride !I. The rnfluence of Low Ionization Voltage
on Fragment ron rntensity. ibid., 3.Ll, 461'"463 (1982).
(In Japanese).
M. Fukatsu and T. Tam.ura: GC--MS Analysis of Triglyceride
III. Relqtionship Between the Fatty Acid Distribution
and rntensity Ratios of Specific Fragment Ions. ibid.,
3Lt, 92tv95 (1983). (In Japanese).
M. Fukatsu and T. Tamura: GC--MS Analysis of Triglyceride
IV. Correction of Fatty Acid Composition. ibid., ;L3,
144"v147 (1984). (In Japanese).
J. Ahlberg, T. Curstedt, K. Einarsson and J. Sjovall:
Molecular Species of Biliary Phosphatidylcholines in
Gallstone Patients: The Tnfluence of Treatment with
Cholic Acids and Chenodeoxycholic Acid. J. LÅ}pid Res.,
Lt, 404.v409 (1981).
M. Kino, T. }(atsumura, M. Gamo and K. Saito: Studies on
"lolecular Species of Choline and Ethanolamine
Glycerophospholipids Obtained from Rat Brain Myelin and
Synaptosomes by Gas-Liquid Chromatography Mass
Spectrometry. Biomed. Mass Spectrom., 9, 363N369

63 ..
64.
65.
66.
67.
167
(1982).
C. G. Crawford and R. D. Plattner: Ammonia Chemical
Ionization Mass Spectrometry of Intact Diacyl
Phosphatidylcholine. J. Lipid Res., ;L4, 456N460 (1983).
J. Y--K. Hsieh. D. K. Welch and J. G. Turcotte: General
Method for the Analysis of Phosphatidylcholines by
High-Performance Liquid Chromatography. J. Chromat.,
208, 398•v403 (1981).
Y. Nakagawa and L. A. Horrocks: K6soku Ekitai
Kuromatografi' ni yoru N6 Etanoruamin Bunshishu no
Bunseki oyobi Taisha e no Oyo-." Proc. J. C. B. L. 2.Lt,
356r-359 (1983). (In Japapese).
Y. Nakagawa and L. A. Horrocks: Separation of
Alkenylacyl, Alkylacyl, and Diacyl Analogues and Their
Molecular Species by High Performance Liquid
Chromatography. J. Lipid Res., g:4L, 1268•v1275 (1983).
M. Smith, P. Monchamp and F. B. Jungalwala: Separation
of Molecula•r Species of Sphingomyelin and Ceramide by
Argentation and Reversed;Phase HPLC. J. !aipid Res., Z.Lt,
714-719 (1981).