Behaviosites: A Novel Paradigm for Affecting Distributed Behavior

J. Appl. Res. Electr. Eng., Vol. 1, No. 1, pp. 79-85, June 2021 DOI: 10.22055/jaree.2021.33523.1009
Shahid Chamran
University of Ahvaz
Iranian Association of
Electrical and Electronics
Engineers
Journal of Applied Research in Electrical Engineering
E-ISSN: 2783-2864 P-ISSN: 2717-414X
Homepage: https://jaree.scu.ac.ir/
Research Article
79
A Novel Method of Modeling for Dynamic Behavior of Hydro-Electric Turbines
During Load Rejection
Saman Ghahghahzadeh 1,* , and Mohammad Reza Afsharnia 2
1 Department of Electrical Engineering, Masjed-Soleiman Branch, Islamic Azad University, Masjed-Soleiman, Iran
2 Sama Technical and Vocational Training College, Islamic Azad University, Masjed-Soleiman Branch, Masjed-Soleiman, Iran
* Corresponding Author: [email protected]
Abstract: This work proposes a new model for dynamic behavior of hydro-electric turbines on the basis of inlet
mechanical power with different loads together with reactions of wicket gates and governor during load rejection. Then,
practical experiments are investigated, and their results are compared with simulated results developed in SIMULINK.
The results show that proposed modeling satisfies practical behavior of real systems.
Keywords: Modeling, hydroelectric turbine, load rejection, regression.
Article history
Received 26 May 2020; Revised 23 May 2021; Accepted 02 June 2021; Published online 29 June 2021.
© 2021 Published by Shahid Chamran University of Ahvaz & Iranian Association of Electrical and Electronics Engineers (IAEEE) How to cite this article
Saman Ghahghahzadeh, and Mohammad Reza Afsharnia, "A novel method of modeling for dynamic behavior of
hydro-electric turbines during load rejection," J. Appl. Res. Electr. Eng., vol. 1, no. 1, pp. 79-85, June 2021.
DOI: 10.22055/jaree.2021.33523.1009
1. INTRODUCTION
Hydroelectric plants demonstrate particular behaviors
during power generation due to their physical construction.
Sudden changes in the load are an example of situations that
may influence plant parameters. Hence, the load rejection test
is prevalent to investigate the reaction of turbine-generator
combination reaction, which examines the robustness of plant
units. However, the results may differ based on the percent of
nominal power delivered by the hydroelectric unit before the
load rejection test. Turbine speed, wicket gate position,
pressure head in the spiral case, and so on are generally
investigated during the load rejection process. Regarding
these quantities, the governor design and parameters are to be
attended. In [1], the results of the simulation indicate that the
higher the power level, the greater the disturbance caused by
the load rejection. The nuclear power plant operating with full
load is necessary to be equipped with the protection system
for load rejection. In practice, load rejection may occur in
special cases, such as short circuits in network. In [2], an
experimental study has been conducted to estimate
synchronous generator parameters through a sudden short
circuit in the laboratory.
In [3], a complete analysis is investigated with a focus on
the electrical aspects of load rejection and the variations of
generator voltages and currents. Also, transient processes of
load rejection caused by different accident conditions and
elaborating the characteristics of different types of load
rejection are studied in [4] in which a numerical simulation
method of different types of load rejection is then established.
Amazing models for load rejection of thermal power
plants, which helped and guided us through this work, are
applied in [5]. Paper [6] presents a nonlinear mathematical
model of the Francis turbine in a hydropower plant evaluated
by full-scale field tests involving steady and transient
operations that use a conventional turbine model developed
by IEEE [7]. Besides several field tests have globally been
performed although most of them may not be released to the
public, such as [8] and [9].
Regarding these strong researches and other works such
as [10]-[14], our study numerically evaluates turbine
behavior in which mechanical aspects are considered with a
newly developed model processed in SIMULINK®.
Section 2 reviews the theory of modeling according to
[15], which is a famous reference. In Section 3, the
Check for
updates

S. Ghahghahzadeh et al. Journal of Applied Research in Electrical Engineering, Vol. 1, No. 1, pp. 79-85, June 2021
80
experimental results of mechanical parameters related to the
Masjed-Soleiman hydropower plant are presented. The new
model is developed and the results are presented in Section 4.
In Section 5, the results are applied to regression and
formulation. Finally, some conclusions are made in Section 6.
2. MODELING
When there is an unbalance between the torques acting
on a rotor, the net torque causing acceleration is
𝑇𝑎 = 𝑇𝑚 − 𝑇𝑒 (1)
in which 𝑇𝑒 , 𝑇𝑎 , and 𝑇𝑚 are the electromagnetic torque,
accelerating torque, and mechanical torque, respectively. In
(1), 𝑇𝑒 and 𝑇𝑚 are positive for a generator, and the prime
mover is accelerated by the unbalance in the applied torques.
Hence, the main equation of motion is
𝐽𝑑𝜔𝑚
𝑑𝑡= 𝑇𝑎 (2)
where 𝐽 is combined moment of inertia of generator and
turbine in kg.m2, 𝜔𝑚 is angular velocity of the rotor, in rad/s,
and t is time in sec.
Equation (2) can be normalized in terms of per unit
inertia constant H, defined as the kinetic energy in watt-
seconds at rated speed divided by the VA base. Using 𝜔0𝑚 to
denote the rated angular velocity in mechanical radians per
second, the inertia constant is
𝐻 =𝐽𝜔𝑚
2
2𝑉𝐴𝑏𝑎𝑠𝑒 (3)
Then, the moment of inertia 𝐽 will be as below:
𝐽 =2𝐻
𝜔0𝑚2 𝑉𝐴𝑏𝑎𝑠𝑒 (4)
Substituting the above relation in (2) gives
2𝐻
𝜔0𝑚2 𝑉𝐴𝑏𝑎𝑠𝑒
𝑑𝜔𝑚
𝑑𝑡= 𝑇𝑚 − 𝑇𝑒 (5)
Rearranging yields
2𝐻𝑑
𝑑𝑡[
𝜔𝑚
𝜔0𝑚] =
𝑇𝑚 − 𝑇𝑒
𝑉𝐴𝑏𝑎𝑠𝑒𝜔0𝑚
⁄ (6)
Regarding the relation 𝑇base =𝑉𝐴𝑏𝑎𝑠𝑒
𝜔0𝑚⁄ , the equation of
motion in form of per unit is
2𝐻𝑑𝜔𝑟
𝑑𝑡= ��𝑚 − ��𝑒 (7)
In (7), we have
𝜔𝑟 =𝜔𝑟
𝜔0 (8)
in which 𝜔0 is its rated value of rotor velocity and 𝜔r is the
angular velocity of the rotor in electrical rad/s.
On the other hand, supposing 𝛿 is the angular position of
the rotor in electrical radians with respect to a synchronously
rotating reference and 𝛿0 is its initial value,
𝛿 = 𝜔𝑟𝑡 − 𝜔𝑟𝑡 + 𝛿0 (9)
Taking the time derivative, we have
𝑑𝛿
𝑑𝑡= ∆𝜔𝑟 (10)
𝑑2𝛿
𝑑𝑡2= 𝜔0
𝑑(∆𝜔𝑟 )
𝑑𝑡 (11)
Substituting for 𝑑(∆𝜔𝑟 )
𝑑𝑡 given by the above equation in (7),
we get
2𝐻
𝜔0
𝑑2𝛿
𝑑𝑡2= 𝑇𝑚
− 𝑇𝑎 (12)
It is often desirable to include a component of damping
torque, not accounted for in the calculation of 𝑇𝑒, separately.
This is accomplished by adding a proportional to speed
deviation in the above equation as follows.
2𝐻
𝜔0
𝑑2𝛿
𝑑𝑡2= 𝑇𝑚
− 𝑇𝑎 − 𝐾𝐷∆𝜔𝑟 (13)
The swing equation, expressed as two first-order differential
equations, will become
𝑑∆𝜔𝑟
𝑑𝑡=
𝑇𝑚 − 𝑇𝑎
− 𝐾𝐷∆𝜔𝑟
2𝐻 (14)
𝑑𝛿
𝑑𝑡= 𝜔0∆𝜔𝑟 (15)
in which time is in seconds, δ is in electrical radians, and 𝜔0
is equal to 2𝜋f . The block diagram form of the above two
equations is shown in Fig. 1.
3. EXPERIMENTAL TESTS
In this work, we have examined several load rejection
tests individually and together on units 5 and 6 of the Masjed-
Soleiman hydroelectric plant. The tests were conducted at
different states when the units were generating 25%, 50%,
75%, and 100% of their rated power. Figs. 2 to 5 depict the
result curves of the above tests. The variations are in terms of
time.
Fig. 1: Block diagram of above equations.
Fig. 2: The results of load rejection on unit 5 of the Masjed-
Soleiman plant while delivering 25% of rated power.
S. Ghahghahzadeh et al. Journal of Applied Research in Electrical Engineering, Vol. 1, No. 1, pp. 79-85, June 2021
81
Fig. 3: The results of load rejection on unit 5 of the Masjed-
Soleiman plant while delivering 50% of rated power.
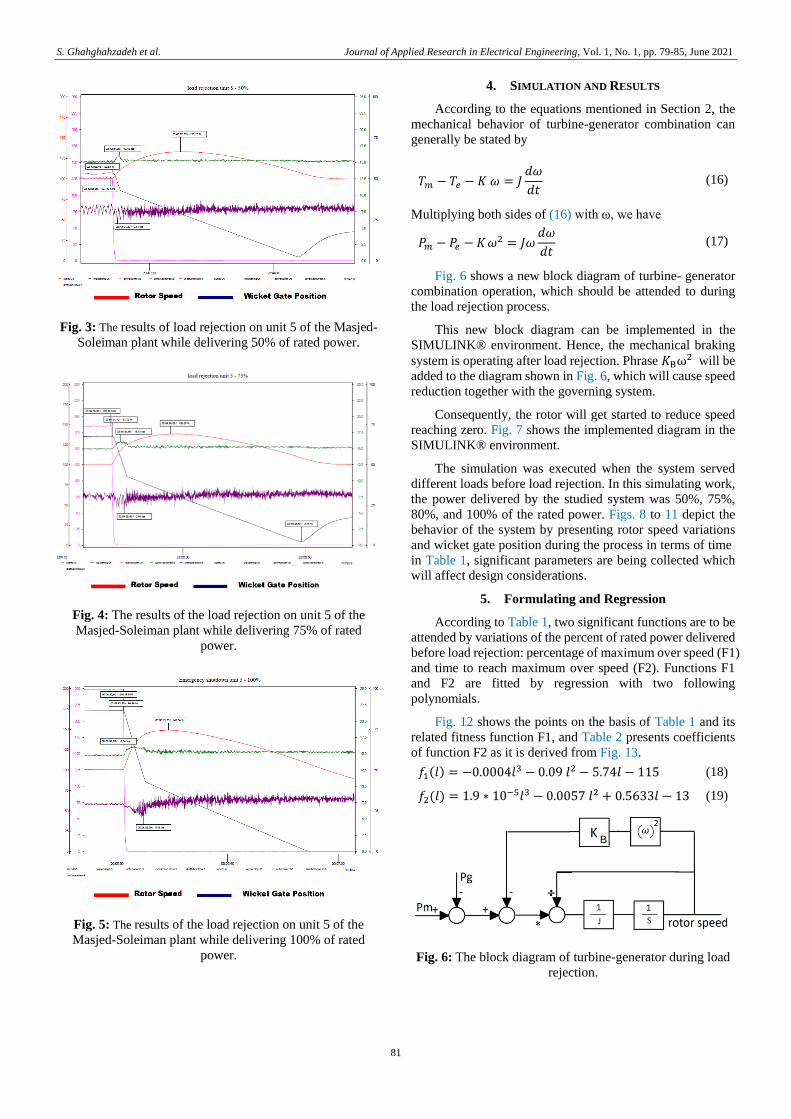
Fig. 4: The results of the load rejection on unit 5 of the
Masjed-Soleiman plant while delivering 75% of rated
power.
Fig. 5: The results of the load rejection on unit 5 of the
Masjed-Soleiman plant while delivering 100% of rated
power.
4. SIMULATION AND RESULTS
According to the equations mentioned in Section 2, the
mechanical behavior of turbine-generator combination can
generally be stated by
𝑇𝑚 − 𝑇𝑒 − 𝐾 𝜔 = 𝐽𝑑𝜔
𝑑𝑡 (16)
Multiplying both sides of (16) with ω, we have
𝑃𝑚 − 𝑃𝑒 − 𝐾 𝜔2 = 𝐽𝜔
𝑑𝜔
𝑑𝑡 (17)
Fig. 6 shows a new block diagram of turbine- generator
combination operation, which should be attended to during
the load rejection process.
This new block diagram can be implemented in the
SIMULINK® environment. Hence, the mechanical braking
system is operating after load rejection. Phrase 𝐾Bω2 will be
added to the diagram shown in Fig. 6, which will cause speed
reduction together with the governing system.
Consequently, the rotor will get started to reduce speed
reaching zero. Fig. 7 shows the implemented diagram in the
SIMULINK® environment.
The simulation was executed when the system served
different loads before load rejection. In this simulating work,
the power delivered by the studied system was 50%, 75%,
80%, and 100% of the rated power. Figs. 8 to 11 depict the
behavior of the system by presenting rotor speed variations
and wicket gate position during the process in terms of time
in Table 1, significant parameters are being collected which
will affect design considerations.
5. Formulating and Regression
According to Table 1, two significant functions are to be
attended by variations of the percent of rated power delivered
before load rejection: percentage of maximum over speed (F1)
and time to reach maximum over speed (F2). Functions F1
and F2 are fitted by regression with two following
polynomials.
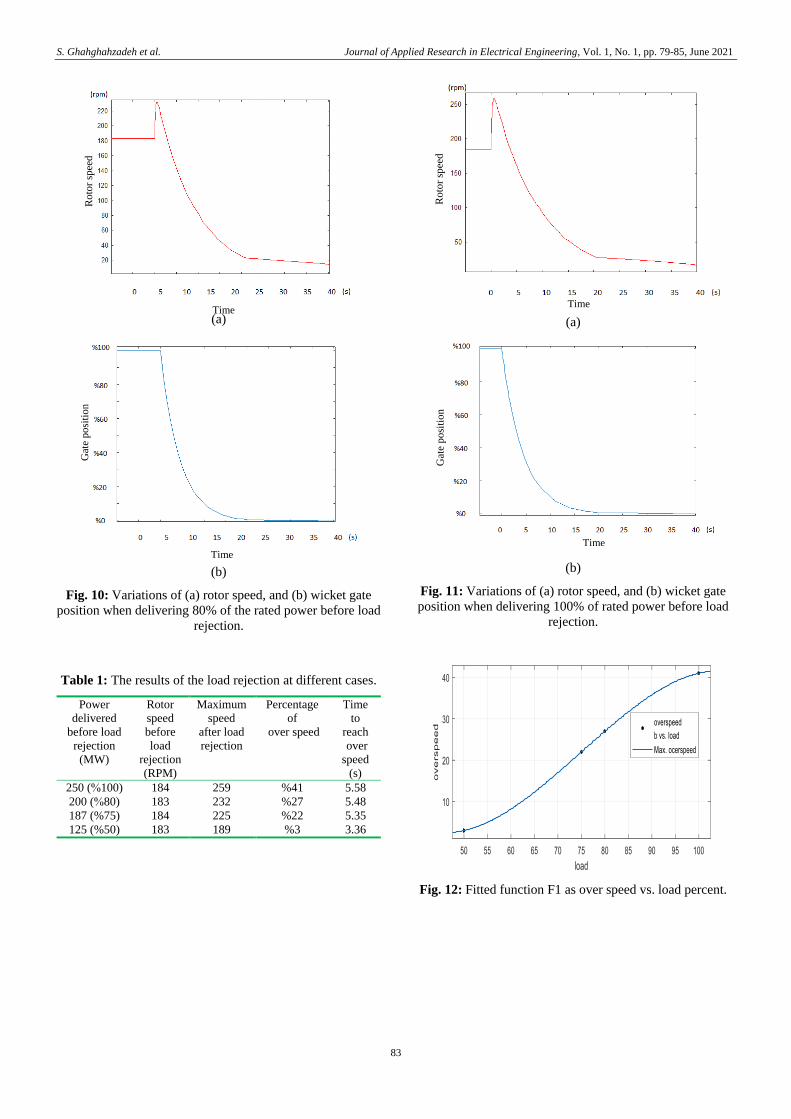
Fig. 12 shows the points on the basis of Table 1 and its
related fitness function F1, and Table 2 presents coefficients
of function F2 as it is derived from Fig. 13.
𝑓1(𝑙) = −0.0004𝑙3 − 0.09 𝑙2 − 5.74𝑙 − 115 (18)
𝑓2(𝑙) = 1.9 ∗ 10−5𝑙3 − 0.0057 𝑙2 + 0.5633𝑙 − 13 (19)
Fig. 6: The block diagram of turbine-generator during load
rejection.
B 𝜔

S. Ghahghahzadeh et al. Journal of Applied Research in Electrical Engineering, Vol. 1, No. 1, pp. 79-85, June 2021
82
Fig. 7: Implemented diagram in SIMULINK environment.
(a)
(b)
Fig. 8: Variations of (a) rotor speed, and (b) wicket gate
position when delivering 50% of the rated power before load
rejection.
(a)
(b)
Fig. 9: Variations of (a) rotor speed, and (b) wicket gate
position when delivering 75% of the rated power before load
rejection.
Ro
tor
spee
d
Time
Gat
e po
siti
on
Time
Ro
tor
spee
d
Time
Gat
e po
siti
on
Time
S. Ghahghahzadeh et al. Journal of Applied Research in Electrical Engineering, Vol. 1, No. 1, pp. 79-85, June 2021
83
(a)
(b)
Fig. 10: Variations of (a) rotor speed, and (b) wicket gate
position when delivering 80% of the rated power before load
rejection.
(a)
(b)
Fig. 11: Variations of (a) rotor speed, and (b) wicket gate
position when delivering 100% of rated power before load
rejection.
Table 1: The results of the load rejection at different cases.
Time
to
reach
over
speed
(s)
Percentage
of
over speed
Maximum
speed
after load
rejection
Rotor
speed
before
load
rejection
(RPM)
Power
delivered
before load
rejection
(MW)
5.58 %41 259 184 100)%250 (
5.48 %27 232 183 80)%200 (
5.35 %22 225 184 187 (%75)
3.36 %3 189 183 125 (%50)
Fig. 12: Fitted function F1 as over speed vs. load percent.
Roto
r sp
eed
Time
Gat
e po
siti
on
Time
Ro
tor
spee
d
Time
Gat
e po
siti
on
Time

S. Ghahghahzadeh et al. Journal of Applied Research in Electrical Engineering, Vol. 1, No. 1, pp. 79-85, June 2021
84
Fig. 13: Fitted function F2 as time to reach over speed vs.
load percent.
Table 2: Regression parameters of fitted function F1.
Linear model polynomial
f(x) = p1*x^2 + p2*x + p3
p1 = -0.0004
p2 = 0.09
p3 = -5.74
p4 = 115
Goodness of fit
SSE: 9.37e-26
6. CONCLUSION
After executing the above works and attaining the related
results, the following conclusions can be made:
1- Experimental results show that modeling is qualified
and can be trusted.
2- Maximum over speed will be increased if the power
delivered before load rejection increases.
3- If the power delivered increases, the time of reaching
maximum over speed after load rejection will decrease.
ACKNOWLEDGEMENT
The first writer would like to thank Sama Technical and
Vocational Training College at Islamic Azad University,
Masjed-Soleiman branch for their financial support through
the contract of "Modeling of Dynamic Behavior of Hydro-
Electric Turbines During Load Rejection", contract of 96-25-
6196. Also, the writers appreciate Khouzestan Water and
Power Authority (KWPA), especially Mr. Pishva, Mr. Jelodar,
and Mr. Gholipour for their cooperation in this project.
CREDIT AUTHORSHIP CONTRIBUTION STATEMENT
Saman Ghahghahzadeh: Conceptualization, Formal
analysis, Funding acquisition, Investigation, Methodology,
Resources, Software, Roles/Writing - original draft, Writing
- review & editing. Mohammad Reza Afsharnia: Data
curation, Project administration, supervision.
DECLARATION OF COMPETING INTEREST
The authors declare that they have no known competing
financial interests or personal relationships that could have
appeared to influence the work reported in this paper. The
ethical issues; including plagiarism, informed consent,
misconduct, data fabrication and/or falsification, double
publication and/or submission, redundancy has been
completely observed by the authors.
REFERENCES
[1] D. Tiomo, E. Y. Kenfack, and R. Wamkeue, “Dynamic
study and analysis of synchronous generator under
sudden short circuit and load rejection tests”, 2019
IEEE/IAS 55th Industrial and Commercial Power
Systems Technical Conference (I&CPS), pp. 1-5, 2019.
[2] W. Sheng, and Z. Xu, “Research on load rejection
protection of PWR power plants at different power
levels”, in 2019 IEEE Innovative Smart Grid
Technologies - Asia (ISGT Asia), pp. 525-530, 2019.
[3] R. Wamkeue, I. Kamwa, F. Baetscher, and J. El Hayek,
“A new and efficient approach for analysis of a saturated
synchronous generator under the load rejection
test”, Electric Power Components and Systems, vol. 34,
no. 5, pp. 539-563, 2006.
[4] T. B. Ng, G. J. Walker, and J. E. Sargison, “Modeling of
transient behavior in a francis turbine power plant “, in
15th Australasian Fluid Mechanics Conference, Sydney,
Australia, 2004.
[5] T. Kol sek, J. Duhovnik, and A. Bergant, “Simulation of
unsteady flow and runner rotation during shut-down of
an axial water turbine”, Journal of Hydraulic Research,
vol. 44, no. 1, pp. 129–137, 2006.
[6] M. H. Afshar, M. Rohani, and R. Taheri, “Simulation of
transient flow in pipeline systems due to load rejection
and load acceptance by hydroelectric power plants”,
International Journal of Mechanical Sciences, vol. 52,
no. 1, pp. 103-115, 2010.
[7] W. C. Guo, J. D. Yang, J. P. Chen, Z. Y. Peng, Y.Zhang,
C. C. Chen, “Simulation of the transient processes of
load rejection under different accident conditions in a
hydroelectric generating Set”, 28th IAHR symposium on
Hydraulic Machinery and Systems, vol. 49, no. 5, 2016.
[8] Working Group on Prime Mover and Energy Supply
Models for System Dynamic Performance Studies,
Hydraulic Turbine and Turbine Control Models for
System Dynamic Performance Studies, IEEE
Transactions on Power Systems, vol. 7, no. 1, pp. 167-
179, 1992.
[9] K. Zeng, J. Wen, L. Ma, S. Cheng, E. Lu, N. Wang, “Fast
cut back thermal power plant load rejection and black
start field test analysis”, Energies, vol. 7, no. 5, pp. 2740-
2760, 2014.
[10] Riasi, A. Nourbakhsh, and M. Raisee, “Numerical
modeling for hydraulic resonance in hydropower
systems using impulse response” , Journal of Hydraulic
Engineering, vol. 136, no. 11, pp. 929–934, 2010.
[11] P. Rayner, and S. Ho, “Devil's gate power station–
dynamic modeling and tasmanian electricity code
compliance assessment”, Hydro Electric Corp.,
Tasmania, Australia, Tech. Rep. GEN-112475-Report-1,
2003.

S. Ghahghahzadeh et al. Journal of Applied Research in Electrical Engineering, Vol. 1, No. 1, pp. 79-85, June 2021
85
[12] P. Rayner, and P. Rai. "Machine test guidelines (Rev.
2)," hydro electric corp., Tasmania, Australia. Tech. Rep.
GEN-0201-TR-0002. 1999.
[13] G. J. Walker et al., “Turbine and waterway modeling:
investigation and development of improved models stage
II report”, School of Engineering, University of
Tasmania, Tech. Rep. 2003.
[14] G. J. Walker et al., “Turbine and waterway modeling:
investigation and development of improved models stage
I report”, School of Engineering, University of
Tasmania, Tech. Rep. 2002.
[15] P. Kundur, Power System Stability and Control.
McGraw-Hill, 1994.
BIOGRAPHY
Saman Ghahghahzadeh has been with
Islamic Azad University as academic
staff since 2010. For more than 24 years,
he has worked in different sections of
power industry as researcher, technical
advisor, and project manager. He has
executed more than 20 research projects
for several clients where he is also
distinguished as a senior technical trainer. His main research
interests are high-voltage engineering and tests, power
transformers, generators, insulation, and power system
components. Over the past years, Dr. Ghahghahzadeh has
authored and coauthored more than 15 conference and journal
scientific papers.
Mohammad Reza Afsharnia received his
M.Sc. in electrical engineering from
Islamic Azad University, Zanjan Branch
of Sciences and Research. He has worked
in a Masjed-Soleiman hydropower plant
as an electrical engineer since 2010
besides his several experiences in
technical design and advisory to the
power industry.
Copyrights © 2021 Licensee Shahid Chamran University of Ahvaz, Ahvaz, Iran. This article is an open-access article distributed under
the terms and conditions of the Creative Commons Attribution –NonCommercial 4.0 International (CC BY-NC 4.0) License
(http://creativecommons.org/licenses/by-nc/4.0/).