A novel method for analyzing grain facility heat treatment data Hulya AKDOGAN Mark CASADA Alan DOWDY...
19
A novel method for analyzing grain facility heat treatment data Hulya AKDOGAN Mark CASADA Alan DOWDY Bh. SUBRAMANYAM
-
Upload
osborn-ferguson -
Category
Documents
-
view
220 -
download
1
Transcript of A novel method for analyzing grain facility heat treatment data Hulya AKDOGAN Mark CASADA Alan DOWDY...
A novel method for analyzing grain facility heat treatment data
Hulya AKDOGAN
Mark CASADA
Alan DOWDY
Bh. SUBRAMANYAM
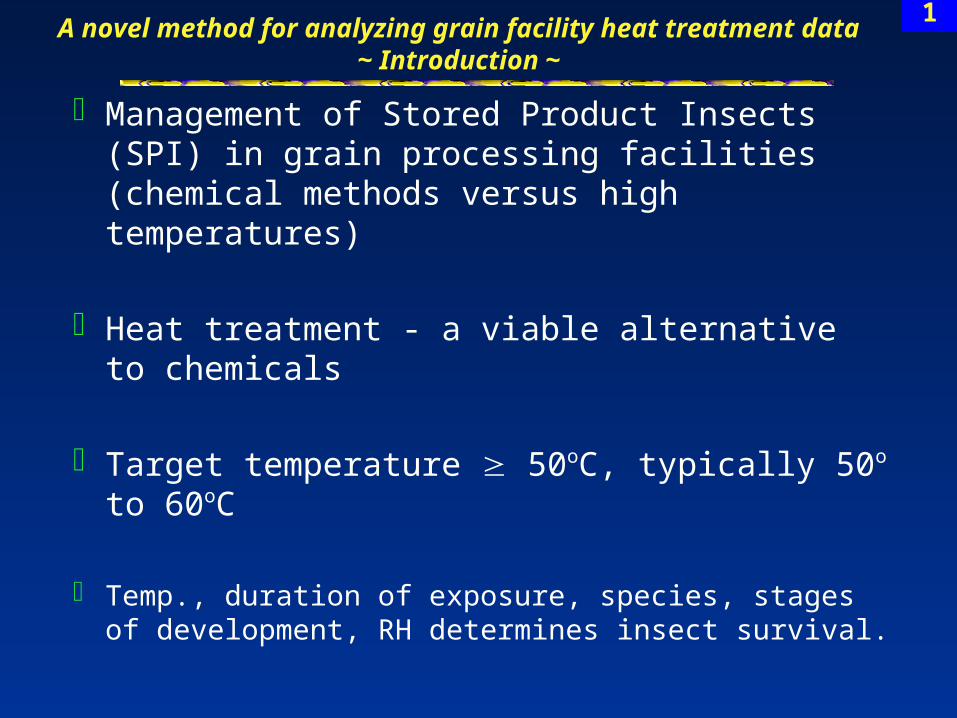
A novel method for analyzing grain facility heat treatment data~ Introduction ~
Management of Stored Product Insects (SPI) in grain processing facilities (chemical methods versus high temperatures)
Heat treatment - a viable alternative to chemicals
Target temperature 50oC, typically 50o to 60oC
Temp., duration of exposure, species, stages of development, RH determines insect survival.
1
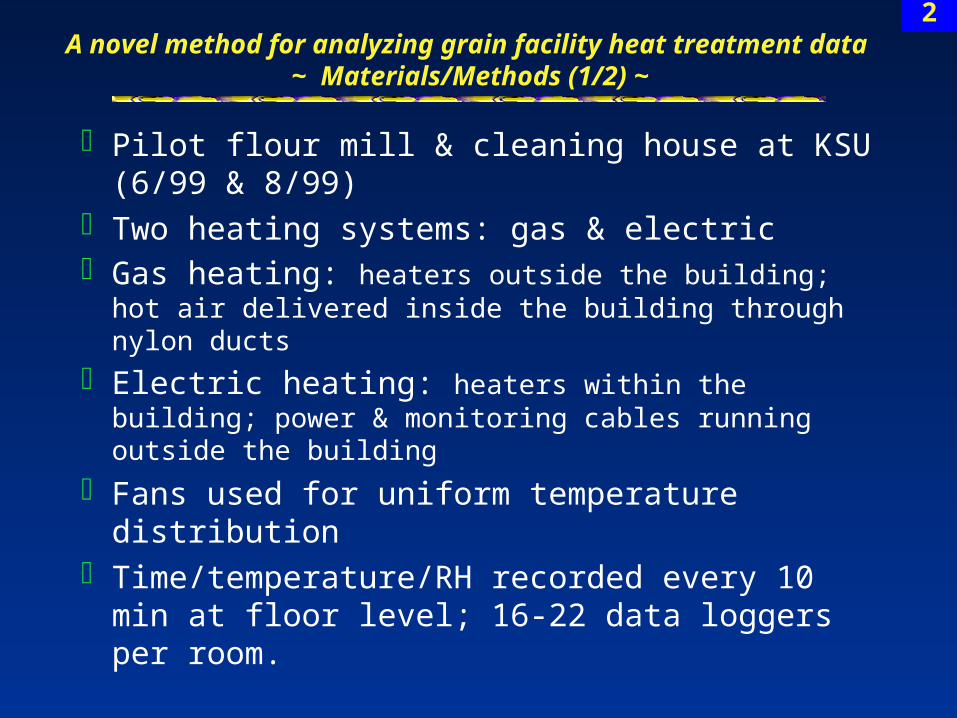
A novel method for analyzing grain facility heat treatment data ~ Materials/Methods (1/2) ~
Pilot flour mill & cleaning house at KSU (6/99 & 8/99)
Two heating systems: gas & electricGas heating: heaters outside the building; hot air
delivered inside the building through nylon ducts
Electric heating: heaters within the building; power & monitoring cables running outside the building
Fans used for uniform temperature distribution
Time/temperature/RH recorded every 10 min at floor level; 16-22 data loggers per room.
2

Effectiveness of heat treatments compared by surface area method
Surfer software used to calculate the surface areas
% floor surface area < 50oC as a function of time (duration of the heat treatment) and % floor surface area maximum floor temperature
Contour maps of maximum floor temperature
A novel method for analyzing grain facility heat treatment data ~ Materials/Methods (2/2) ~
3

A novel method for analyzing grain facility heat treatment data ~ Results ~
Different heating patterns
4
Location
Mill 2 Mill 3 Mill 4 CH 1 CH 2 CH 3 CH 4 Entire facilty
Lag
tim
e (h
)
0
5
10
15
20
25
Gas heatingElectric heating
Lag times (time delays)

Red- electric heatingBlack- gas heating
Duration of treatment (h)
Flo
or
surf
ace
area
< 5
0C
(%
)
Mill 3
0 10 20 30 40 50
0
20
40
60
80
100
Flour Mill 3
5

A novel method for analyzing grain facility heat treatment data ~ Results ~
The surface area approachSurface areas calculated from Surfer outputsNormalized % surface area values for easy
comparison
iA
fA
iAtA
normA
)(
Anorm is the nondimensional area under 50C A(t) is the percent area < 50C at time t Ai is the % area < 50C at the beginning of heat treatment
Af is the % area < 50C at the end of heat treatment.
Nonlinear regression - PROC NLIN procedure (SAS)
6

A novel method for analyzing grain facility heat treatment data ~ Results ~
The surface area approach (ctd.)
A log-logistic equation used:
cetemperaturbeAreaSurfacePercent
10log11
Pseudo-R2 calculated. Ranged from 0.90-0.99.
SSTSSR
RPseudo 12
SSR= Residuals Sum of Squares
SST=Total Sum of Squares
7

Duration of treatment vs. % floor surface area < 50C
Cleaning house 1
0 10 20 30 40 500
20
40
60
80
100
Cleaning house 2
0 10 20 30 40 500
20
40
60
80
100
Cleaning house 4
Treatment time (h)
0 10 20 30 40 500
20
40
60
80
100
Mill 2
0 10 20 30 40 500
20
40
60
80
100
Mill 3
0 10 20 30 40 500
20
40
60
80
100Cleaning house 3
0 10 20 30 40 500
20
40
60
80
100
Mill 4
0 10 20 30 40 50
Sur
face
are
a un
der
50o C
(%
)
0
20
40
60
80
100
8
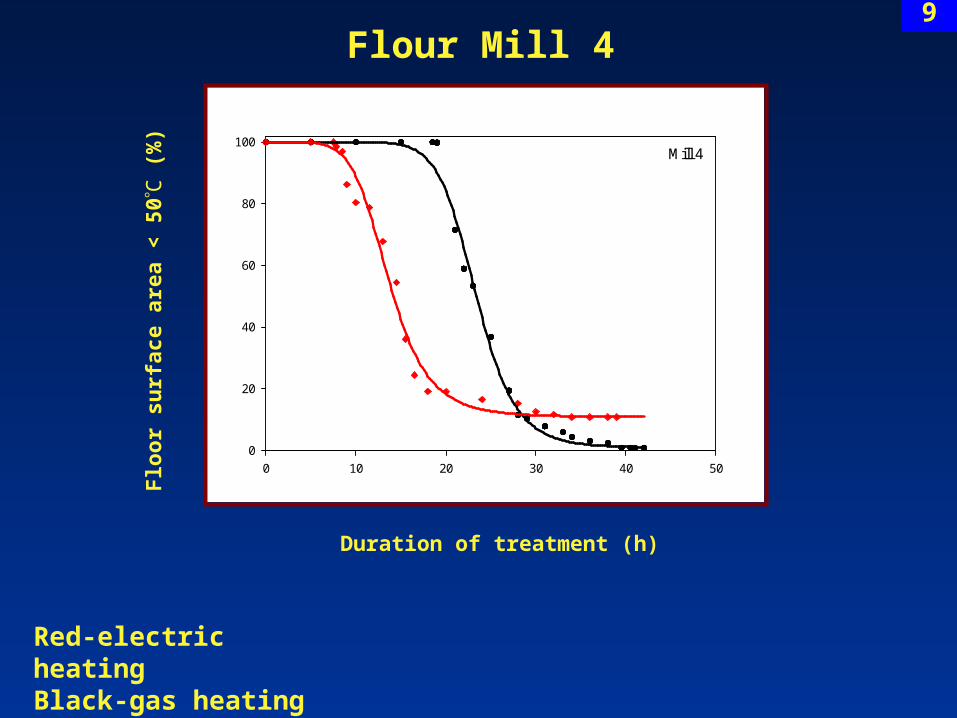
Flour Mill 4
Mill 4
0 10 20 30 40 50
0
20
40
60
80
100
Red-electric heatingBlack-gas heating
Duration of treatment (h)
Flo
or
surf
ace
area
< 5
0C
(%
)
9

Cleaning house 1
Cleaning house 1
0 10 20 30 40 50
0
20
40
60
80
100
Red-electric heatingBlack-gas heating
Duration of treatment (h)
Flo
or
surf
ace
area
< 5
0C
(%
)
10
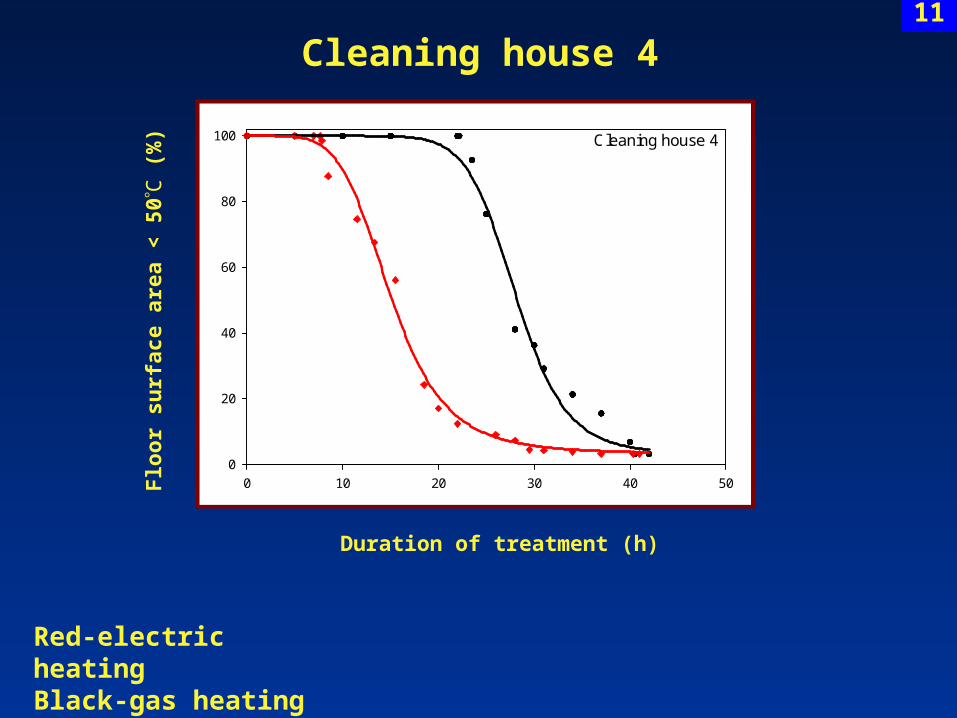
Cleaning house 4
Cleaning house 4
0 10 20 30 40 50
0
20
40
60
80
100
Red-electric heatingBlack-gas heating
Duration of treatment (h)
Flo
or
surf
ace
area
< 5
0C
(%
)
11

Mill 2
Temperature (oC)
40 45 50 55 60 65 70 75 80 85
Sur
face
are
a (%
)
0
20
40
60
80
100
Max. floor temp. vs. % floor surface area
red-electric heatingblack-gas heating
Mill 2
12
A novel method for analyzing grain facility heat treatment data ~ Results ~
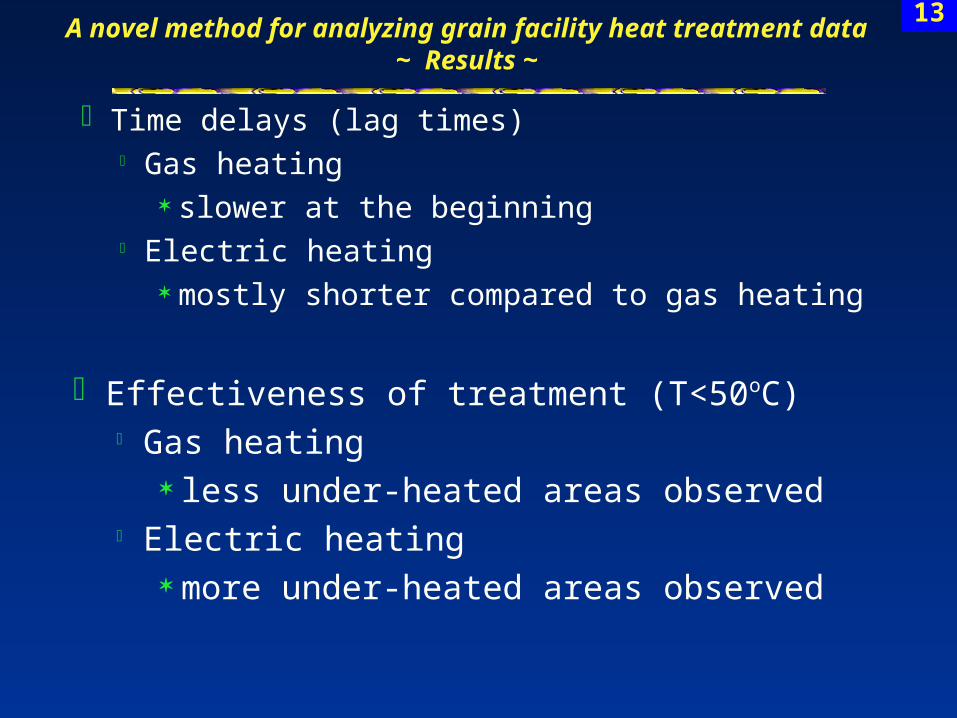
Time delays (lag times) Gas heating
slower at the beginning Electric heating
mostly shorter compared to gas heating
Effectiveness of treatment (T<50oC) Gas heating
less under-heated areas observed Electric heating
more under-heated areas observed
13
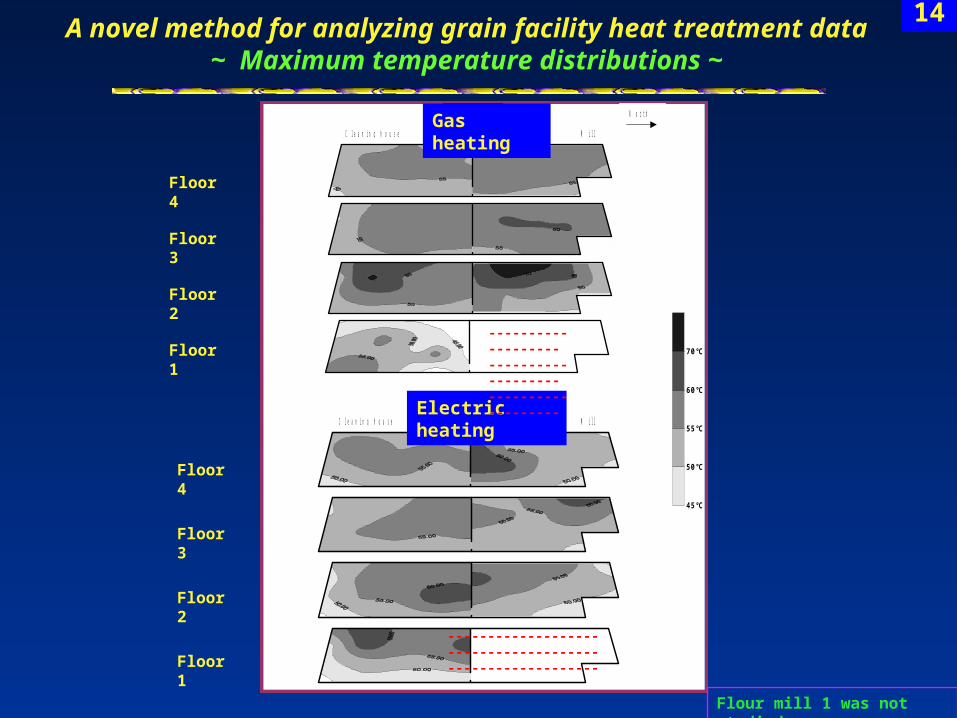
A novel method for analyzing grain facility heat treatment data ~ Maximum temperature distributions ~
45°C
50°C
55°C
60°C
70°C
T e c H e a t
T e m p A i r
C l e a n i n g h o u s e M i l l
C l e a n i n g h o u s e M i l l
N o r t hGas heating
Electric heating
Floor 1
Floor 1
Floor 2
Floor 2
Floor 4
Floor 3
Floor 3
Floor 4
Flour mill 1 was not studied.
---------------------------------------------------------
---------------------------------------------------------
14
40°C
45°C
50°C
55°C
60°C
65°C
70°C
75°C
80°C
85°C
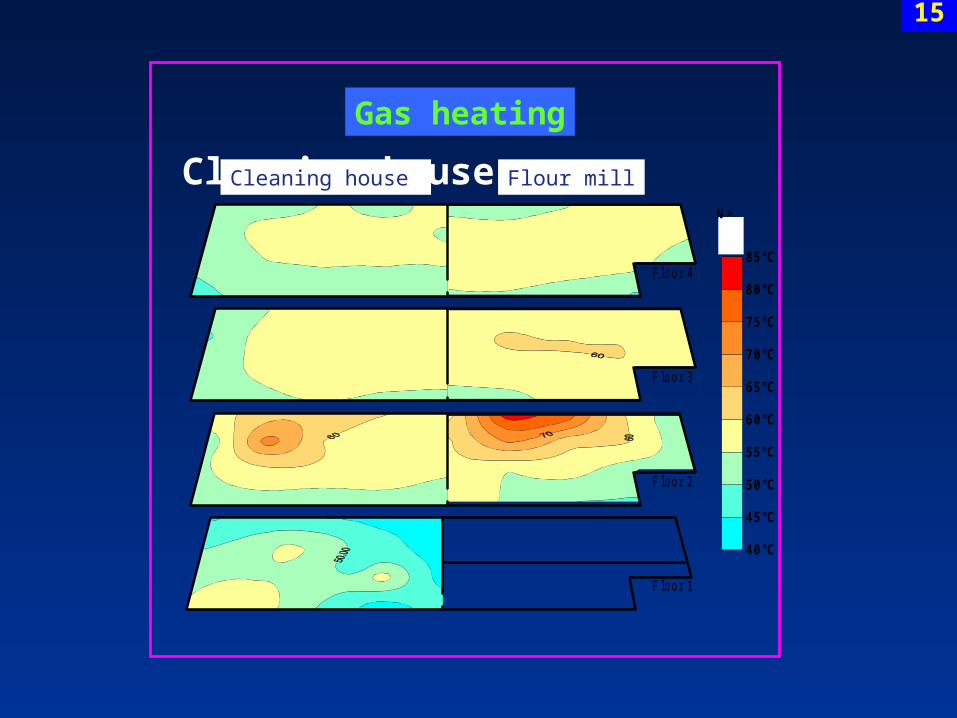
F lo o r 1
F lo o r 2
F lo o r 3
F lo o r 4
N >
Gas heating
Cleaning house Flour millCleaning house
15
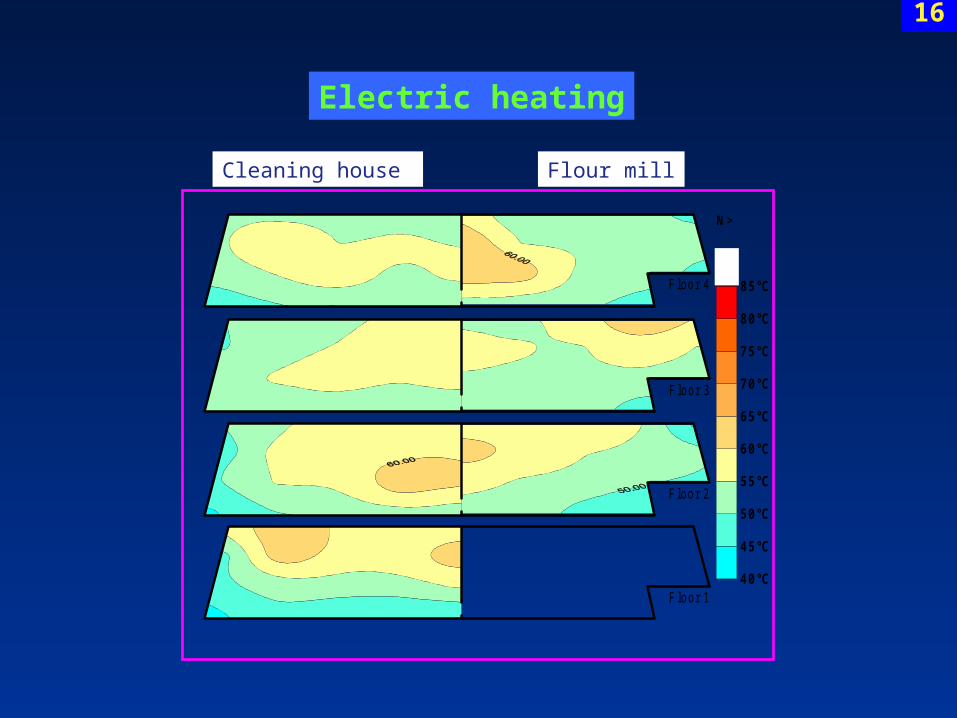
40°C
45°C
50°C
55°C
60°C
65°C
70°C
75°C
80°C
85°C
F lo o r 1
F lo o r 4
F lo o r 3
F lo o r 2
N >
Electric heating
Flour millCleaning house
16

A novel method for analyzing grain facility heat treatment data ~ Main points ~
Heat treatment as an alternative to chemical treatments
Different heating patterns of gas and electric heating-Time delays; % A under/over-heated
Sufficient heat treatment & uniform heat distribution
Quantification & identification of over-heated & under-heated areas
Characterizing the heating pattern of each method via modeling (log-logistic eqn.)
17

Thank you
The End


![[Hulya Canbakal] Society and Politics in an Ottoma(BookZZ.org)](https://static.fdocuments.in/doc/165x107/55cf9315550346f57b9b8945/hulya-canbakal-society-and-politics-in-an-ottomabookzzorg.jpg)