A novel approach to investigating indoor/outdoor pollution ... · A novel approach to investigating...
23
A novel approach to investigating indoor/outdoor pollution links: combined magnetic and PAH measurements
Transcript of A novel approach to investigating indoor/outdoor pollution ... · A novel approach to investigating...
A novel approach to investigatingindoor/outdoor pollution links:
combined magnetic and PAH measurements

C. J. Halsall; B. A. Maher; V. V. Karloukovski; P. Shah; S. J. Watkins.Lancaster Environment Centre, Lancaster University, Lancaster LA1 4YQ, UK
1
A novel approach to investigating indoor/outdoor pollution links: combined magnetic
and PAH measurements
C. J. Halsall*; B. A. Maher; V. V. Karloukovski; P. Shah; S. J. Watkins.
Lancaster Environment Centre, Lancaster University, Lancaster LA1 4YQ, UK
*author for correspondance
Tel : (0)1524 594330
Fax : (0)1524 593985
Abstract
In a preliminary study, paired indoor and outdoor air sampling was conducted at three
locations around the city of Lancaster, UK to examine the influence of combustion sources
on air quality by measuring particulate concentrations, particulate magnetic properties and
polyaromatic hydrocarbons (PAHs). With one exception (an indoor suburban air sample),
outdoor air samples had higher total suspended particulates (TSP), particle-bound PAH
concentrations and magnetic remanence (IRM) values. IRM values were highest for the
week-day, outdoor city centre samples and then declined in the sequence: Sunday, city centre
> suburban/residential > Lancaster University campus. These data indicate traffic as the
major particle-bound PAH, particulates and magnetic source, particularly as sampling was
conducted during July in the absence of any space heating. The indoor air samples revealed a
wide variation in pollutant concentrations, characterised by higher vapour levels of 2-3 ring
PAHs, variable TSP concentrations and variable but generally low IRMs. The differences in
PAH concentrations, TSP and IRMs between outdoor and indoor environments indicate
limited ingress of outdoor air pollutants to the indoor environment in this study. Our
combined PAH and magnetic data identify specific and distinctive indoor pollution signals
for each of our sampled sites, reflecting distinct sources. One site, the suburban house, has
anomalously high IRM, TSP and particle-bound PAHs. A possible source for these is a cast
iron, wood-burning stove (even though not lit). The city centre indoor site is characterised by
high TSP and very low IRMs but high values of the magnetic ratio of anhysteretic
remanence:saturation remanence, indicative of ultrafine (submicrometre) magnetic grain
sizes. The source for this city centre indoor signature is unidentified but may reflect the
occupant smoking and/or lighting candles. The indoor campus sample was affected by loss-
2
on-ignition procedures carried out in a teaching laboratory. The combined PAH and magnetic
analyses thus provide a sensitive and discriminatory means of identifying outdoor, traffic-
derived pollution, and of discriminating between different types of indoor pollution.
Key words: pollution, particulate, PAHs, magnetic discrimination.
1. Introduction
Increasing attention has been focused recently on health effects of exposure to air pollution,
especially regarding increased risk of morbidity and mortality from cardio-vascular disease,
cancer, degenerative brain disease, and respiratory illness (e.g. Knutsen et al., 2004; Pope et
al., 2002; Schwartz et al., 1996; Schwarze et al., 2006; Calderón-Garcidueñas et al., 2004).
For many pollutants, air quality standards refer to levels measured in ambient outdoor air.
The sources of fine, combustion-derived pollutants are less well understood for the indoor
environment, prompting studies of relationships between outdoor sources and indoor air
quality (e.g. Fischer et al., 2000; Kingham et al., 2000; Naumova et al., 2002). Urban sources
of particles and organic pollutants (volatile and semi-volatile) vary, but principally arise from
fuel combustion by vehicles, and for space heating and waste incineration. Within the U.K.,
health-based air quality standards exist for several key air pollutants, including PM10
(particles with diameter <10 µm) and benzo[a]pyrene (B[a]P), a high molecular weight
(MW) PAH, formed during combustion. Both PM10 (plus finer modes) and PAHs are
frequently measured in pollution studies (e.g. Fischer et al., 2000; Kingham et al., 2000; Kaur
et al., 2005). Recently, aerosol magnetic measurements have been used successfully to assess
urban, traffic-related pollution, both in conjunction with conventional fixed monitoring
station air sampling (Sagnotti et al., 2006; Muxworthy et al., 2002) and using roadside tree
leaves as natural biomonitoring surfaces (e.g. Matzka & Maher, 1999; Maher et al., 2008;
Gautam et al., 2005). Magnetic particles are invariably present amongst atmospheric aerosol,
from release of iron-containing impurities in fossil fuels and/or through metal wear
(abrasion/corrosion). These iron-rich emission particles are magnetic, the most common
phases being magnetite (Fe3O4) and haematite (αFe2O3), with magnetisations easily
measurable using a cryogenic magnetometer (e.g. Flanders, 1994). In urban dusts, strong
correlation has been observed between magnetic susceptibility and/or magnetic remanence
values and PM10 dust-mass (e.g. Sagnotti et al., 2006), sample mutagenicity (Morris et al.,
1995) and lead and iron concentrations (Gautam et al., 2005; Maher et al., 2008). In areas

3
dominated by vehicle pollution, rather than industrial point sources (Hanesch et al., 2003),
magnetic measurements appear to provide a robust, rapid and cheap proxy for vehicle-
derived particulate pollution (Matzka and Maher, 1999), enabling high-resolution spatial and
temporal sampling.
Here, we present a pilot study to examine the links between outdoor and indoor air
pollution, innovatively combining magnetic and PAH measurements at different locations in
Lancaster, England. By simultaneously measuring indoor and outdoor concentrations of TSP,
magnetic properties and PAHs, assessment can be made of their sources and whether
incursions of outdoor, traffic-derived pollution influence the indoor environment at these
sites.
2. Methods
2.1 Air sampling
Air samples were collected (summer 2003) using high volume (Hi-Vol) air samplers at three
separate sites, comprising: Lancaster University campus (LUC); a detached suburban house
SUB); and a city centre location (CC) Two Graseby-Anderson PS-1 Hi-Vol air samplers
were co-deployed at each site, to sample both indoor and outdoor air. As far as possible, the
samplers were sited away from vents, obstructions or local point sources (e.g. cooker,
fireplace). The indoor locations comprised a teaching laboratory (LUC), a domestic kitchen
(SUB) and an upstairs, two-storey apartment (CC). At the outdoor locations, a Hi-Vol was
located in a grassed courtyard (LUC), a residential garden (SUB) and close (~ 2 m) to a major
road (CC). The outdoor samplers were placed ~ 10m away from any building/obstruction,
with the sample head at ~1.5 m above ground level. Air samples were taken during June -
July 2003, a warm, continuously dry interval, without indoor space heating. At each site, 2-3
samples of outdoor and indoor air were collected, with air sample volumes ranging between
63.5 - 350 m3, over a 6 to 24 hour period (Table 1). For the magnetic measurements, one Hi-
Vol sampler was fitted with a magnetically-clean Millipore FluoroporeTM membrane (PTFE)
filter (1µm pore-size) for particle collection; the other with a Whatman glass-fibre filter
(GFF) and two polyurethane foam (PUF) plugs, for sampling particle-bound and vapour
PAHs, respectively.

4
2.2 Analysis of TSP, PAHs and magnetic properties.
Following sampling, each Hi-Vol sample head (sealed in zip-lock plastic bags) was returned
to the laboratory where the GFF/PUFs were stored in a freezer (-20 oC) prior to analysis. TSP
values were determined gravimetrically using the PTFE filters (pre-weighed), placed in a
modified vacuum desiccator maintained at nominal but constant humidity.
For PAH analysis, both GFFs and PUF plugs underwent separate soxhlet extraction in
dichloromethane (DCM) for 16 h. Extracts were then concentrated on a Buchi-rotary
evaporator (~1 mL) and subjected to column chromatography to remove co-extractants. Each
sample was eluted through alumina(1g)/silica(1g) with 25 mL of 1:1 DCM/n-hexane. The
eluant was gently reduced in volume under a stream of pure N2 allowing solvent exchange to
acetonitrile (CH3CN), with a final sample volume of 500 µL. Analysis was performed on a
Perkin-Elmer HPLC, with an auto-sampler (20 µL injection volume) and an LS-40
Fluorescence Detector. PAHs were separated on a ChromSep C18 reverse-phase column using
a mobile phase comprising CH3CN/H2O. The detector was programmed with
excitation/emission wavelengths ranging between 200-420 nm. Qualification of 15 separate
PAHs (Table 1) was based on comparative retention times with a PAH standard (containing
all the PAHs), and quantification achieved using six calibration standards ranging from 10 –
400 ng/mL, run at the start and end of each sample batch. Four samples (2 GFF and 2 PUF –
LUC, SUB) were also analysed by GC-MS (HP5890 Series-II GC and HP5972 MSD), with
sample extracts taken up in n-hexane (500 µL) rather than CH3CN, followed by the addition
of three deuterated-PAH internal standards (fluorene-δ10, pyrene-δ10 and B[a]P-δ10). The
GC-MS protocol for PAH analysis (Smith, 2000) involved a cool (60 oC) on-column injection
(1 µL) with subsequent PAH separation on a 30m HP5MS column (with a 2 m deactivated
retention gap) connected to the MSD (EI source (70 eV) operating in SIM). Quantification
was based on two sets of calibration standards to cover the linear ranges of 1 – 100 ng/mL
and 100-2500 ng/mL.
For magnetic analysis, each PTFE filter was subjected to acquisition of anhysteretic
remanence (ARM), imparted using a Molspin AF demagnetiser with a peak A.F. of 85
milliTesla (mT) and D.C. field of 0.08 mT, measured using a cryogenic magnetometer (CCL
Ltd., with a noise level of 10-10 Amperes(A)m2). ARM is expressed here as a susceptibility of
ARM (χARM), normalised by the D.C. field. After A.F. demagnetisation of the ARM, each
sample was magnetised (at room temperature) using incremental, pulsed D.C. fields of 100
and 300 mT, using a Molspin Pulse Magnetiser, and then 1 Tesla (T), using a Newport
5
electromagnet. The magnetic remanence (IRM) was measured immediately after each
magnetising step. IRM values were normalised for air sample volume (Am2/m3 – thus Am-1)
and particulate mass/m3 of sampled air (Am-1g-1).
2.3. Quality controls
GFFs were baked overnight at 450 oC prior to use and PUF plugs were pre-cleaned via
soxhlet extraction in DCM for 24 h. A set of GFF & PUF field blanks was generated for each
location with contamination found to be low. GC-MS analysis of blanks and samples
revealed the presence of several methylated naphthalenes and phenathrenes, but these are not
reported here due to their erratic occurrence in the blank PUFs, and subsequent high method
detection limits. Comparison between the LC and GC results was good, individual PAH
concentrations varying by ±15 %. Precision and accuracy of the HPLC and GC-MS methods
have been detailed in Halsall et al. (1994) and Smith (2000) and Herbert et al. (2004),
respectively. Dibenz[a,h]anthracene was used as a recovery standard, spiked onto both the
GFF and PUFs prior to soxhlet extraction; recoveries always exceeded 80 %, samples were
not recovery corrected.
Sample magnetic values were corrected for the (very low) blank PTFE filter values
(ARM < 1x10⁻¹⁰ Am2; SIRM < 20x10-10 Am2). GFFs were unsuitable for magnetic analyses,
due to high blank magnetic remanences. All magnetic measurements were carried out without
knowledge of sample site or date.
2.4 Statistical analysis.
A multivariate statistical method, non-linear mapping (NLM, using the programme of Vriend
et al., 1988), was applied to the combined magnetic and PAH datasets. NLM scales and
calculates the distance between datapoints in multidimensional space, then translates this into
two dimensions (Vriend et al., 1988). Three diagnostic magnetic parameters were included:
SIRM (mass-normalised), χARM/SIRM, and the percentages of high-field IRM (HIRM, i.e. the
remanence acquired between 300 and 1000 mT). The SIRM reflects the concentration of
magnetic minerals, the χARM/SIRM ratio the contribution of ultrafine magnetite grains (~ 20-
30 nm), and HIRM the presence of haematite (if the HIRM resists subsequent
demagnetisation). Data for two PAHs were also included: total phenanthrene (3 ring PAH)
and B[a]P (5 ring PAH). Before analysis, the parameters were tested for autocorrelation using
the non-parametric Spearman test.

6
3. Results.
3.1 PAHs, suspended particulate concentrations.
Table 1 summarises the PAH concentrations observed at the three sites. For the outdoor air,
highest PAH concentrations were observed at the city centre, with values within the ranges
measured in other, UK urban environments. For example, from the UK’s Toxic Organic
Micropollutants Survey, ΣPAH concentrations ranged from ~20-150 ng/m3 in London and
Manchester, respectively (Coleman et al., 1997). Similarly, roadside measurements in
Birmingham revealed ΣPAH concentrations between 28.5-54.8 ng/m3 (Dimashki et al.,
2001). However, here the ΣPAH concentrations (Table 1) are dominated by the lower MW,
2-3 ring compounds of acenaphthene, fluorene and phenanthrene, with the highest
concentrations of these predominantly vapour phase compounds observed in indoor air,
particularly at the campus and suburban sites. Average individual PAH concentrations for
both indoor and outdoor air (Figure 1) illustrate the dominance of the lower MW compounds
in indoor air and the higher MW PAHs in outdoor air. The high PAH concentrations in
indoor air at the campus and suburban sites will be discussed later, but the campus was the
only indoor site where concentrations of the higher MW, particle-bound PAHs were
comparable with the city centre outdoor air. TSP concentrations (Figure 2) ranged from 20-
125 µg/m3, the highest concentration observed in one indoor sample from the suburban
house. High levels of TSP (60-95 µg/m3) were also observed in the indoor air of the city
centre apartment. For the outdoor air samples, highest TSP concentrations were measured at
the city centre (mean 40 µg/m3).
3.2 Magnetic properties
Figure 3 shows the SIRMs for each indoor and outdoor site, normalised with air volume (a)
and particulate mass (b), respectively. On an air-volume basis, sites with notably high SIRM
values are the suburban indoor and two of the city centre outdoor samples. When normalised
for particulate mass, the two city centre outdoor samples (sampled on week days), and the
suburban indoor samples display enhanced SIRMs, compared with very low values for the
other indoor samples. The remaining outdoor city centre sample (sampled on a Sunday) has
an SIRM comparable with the outdoor suburban and campus samples. The percentage of
IRM acquired below 100 mT varies from 62 – 76 %; all the outdoor samples (mean 72 %)
show higher values than indoors (mean 67 %). After application of a 300 mT field, the
samples had acquired 94 – 98 % of their SIRM. The suburban indoor samples are notable

7
(figure 4); they display greatest high-field acquisition (i.e. ~ 5 – 6 % IRM gain between 300
mT and 1 T) but most of this high-field remanence is unstable and lost upon A.F.
demagnetisation at 100 mT, behaviour characteristic of maghemite, the oxidised counterpart
of magnetite (Liu et al., 2002; Maher et al., 2004). All the other samples retain varying
proportions of their HIRM, indicating the presence of ‘hard’ haematite-like phases. Highest
χARM/SIRM ratios (figure 4), reflecting the presence of submicrometre (~ 20-30 nm)
ferrimagnets (Maher, 1988; Özdemir & Banerjee, 1982), characterise the city centre indoor
samples; all the outdoor samples display moderate values, indicative of ferrimagnets of ~ 1
µm (Ozdemir & Banerjee, 1982; Maher, 1988).
Figure 5a and b summarise the relationships between the SIRM values (mass-
normalised) and phenanthrene and B[a]P concentrations (where detectable). The two week-
day city centre outdoor samples display high SIRM and B[a]P values (figure 5a), in contrast
with the Sunday sample, with relatively low SIRMs and moderate B[a]P values, similar to the
two suburban outdoor samples. The campus outdoor samples display moderate SIRM and
low B[a]P. Sample clustering is also evident in figure 5b. The two week-day city centre
outdoor samples, and one suburban indoor sample, show high SIRM and very low
phenanthrene values. The Sunday city centre outdoor sample groups with the other outdoor
samples, with low/moderate SIRMs and very low phenanthrene values. The city centre
indoor samples are distinctive, with minimal SIRM and maximal phenanthrene values.
With the caveat of the small sample size, the magnetic property and PAH data can be
combined, to optimise sample characterisation and differentiation, by applying non-linear
mapping. Not only is separation of outdoor from the indoor samples evident (figure 6); the
indoor samples also show distinct and separate groupings. The city centre outdoor samples
cluster, with high SIRM and high B[a]P values, as do the suburban and campus outdoor
samples, these characterised by low phenanthrene and moderate SIRM values. The suburban
indoor samples and one of the campus indoor samples (coinciding with laboratory loss-on-
ignition experiments) approach the outdoor sample grouping. The city centre indoor samples
form a separate, clustered group.
4. Discussion.
The relatively high concentrations of 2-3 ring PAHs in the indoor environments sampled here
mirror results from an extensive U.S. survey, part of the Relationship of Indoor, Outdoor and
Personal Air (RIOPA) study (e.g. Naumova et al, 2002). In RIOPA, ΣPAH concentrations in
8
indoor air exhibited a wide range in concentrations (~16-350 ng/m3) with the upper range
exceeding that found in the corresponding outdoor atmospheres. High levels of 3-4 ring
PAHs in indoor air accounted for these high concentrations while conversely, the heavier 5-7
ring PAHs were found to have higher concentrations in the outdoor air. The results from our
study are in broad agreement, but distinctive indoor combustion sources may have produced
PAH anomalies at our campus and suburban indoor sites. The notably high indoor PAH
concentrations at the campus (both vapour- and particle-bound PAH), associated with low
TSP and IRMs, were probably due to soil combustion in a laboratory furnace (a procedure
carried out at the time of sampling). At the suburban site, indoor air concentrations of the
lighter PAHs were high, and associated with high TSP concentrations and SIRMs. We
suggest this distinctive signature reflects the presence of a cast-iron, solid-fuel stove in the
room adjacent to the air sampler. While this stove was not in use during sampling, the
presence of wood ash in an open iron grate may account for both the high particulate loading
and magnetisations (i.e. large numbers of Fe-containing and ferrimagnetic particles),
accompanied by high particle-bound concentrations of 2-3 ring PAHs. Similarly, the indoor
air at the city centre apartment also contained elevated 2-3 ring PAH concentrations relative
to the outdoor air samples. Whilst its TSP concentrations were similar to the outdoor air, it
displays much lower SIRM values (both volume- and mass-normalised), and high χARM/SIRM
ratios (figure 4), indicating the presence of sub-micrometre magnetic grains, again suggesting
a specific and distinctive indoor source. (Sub-micrometre magnetic particles often occur as
interacting agglomerates, and hence are effectively sampled even on the 1µm pore-size filter
used).
In summary, the indoor air samples show wide variation over the three study sites, with
PAHs, magnetic properties and TSP concentrations reflecting distinctive indoor sources.
While the small number of samples precludes statistical comparison between outdoor and
indoor concentrations of particles, PAHs and magnetic particles, there is little evidence of
ingress of outdoor air as a source of these pollutants. Particulate PAH concentrations and
SIRM both differ markedly between indoor and outdoor environments. Hence, several of the
indoor air samples appear as outliers (e.g. LUC- I1, 2 and CC-I1, 3 in Figure 4), grouped
separately from the outdoor samples. For the outdoor samples, while their range of
χARM/SIRM values is quite narrow (~10-15 x10-5A/m), statistically significant correlations are
observed between χARM/SIRM ratios and particulate-concentrations of phenathrene and B[a]P
(r2 = 0.55, n=7, p<0.05 and r2 = 0.68, n=7, p<0.05, respectively), with χARM/SIRM ratios

9
declining in the order city centre>suburban>campus. This trend indicates finer magnetic
particle sizes at the city centre and a significant link between ultrafine magnetic particles and
PAHs. This link is likely to be controlled by traffic emissions, given that outdoor samples
from the city centre had the highest particulate PAH concentrations and high SIRM (>425
x10-4 Am-1g-1). Association of PAHs with finer particle fractions (e.g. <1 µm diameter) has
been demonstrated in the urban environment and in vehicle emissions (e.g. Allen et al 1996;
Zielinska et al., 2004). Notably, the outdoor city centre sample collected on a Sunday (CC-
O1), when traffic was reduced, had lower PAH concentrations and SIRM values than the
week-day samples (CC-O2 and 3); the Sunday city centre values are similar to the week-day
suburban outdoor samples.
As shown by NLM, the combined magnetic and PAH analyses enable discrimination not only
between outdoor and indoor pollution signals but also between different types of indoor
source.
5. Conclusions
• This pilot study reveals notable differences between the pollution characteristics –
particles, PAHs and magnetic properties - of indoor air from three different sampling
sites. It suggests that indoor pollution sources vary significantly and there is little
evidence of the incursion of outdoor air, even in a city centre environment.
• The combined particle-bound PAH and magnetic data provide a powerful tool to
classify samples according to likely sources and may provide a valuable diagnostic
tool to discriminate between indoor and outdoor combustion sources. Magnetic
measurements may provide a sufficiently specific marker for traffic-derived pollution
for use in studies of health effects of vehicle pollution exposure.
• Given increasing evidence for damage to human health attributable to exposure to
traffic-derived pollution, especially for children, more detailed investigation and
implementation of these methods seems warranted and timely, preferably using
passive collectors co-deployed in a variety of indoor environments (different rooms)
and outdoor locations (especially with regard to traffic proximity).
Acknowledgements.
10
The support of the Royal Society through a Royal Society-Wolfson Research Award to BAM
and a Lancaster University research award are both gratefully acknowledged. CJH would like
to thank Vicky Burnett for help with the PAH analysis.
References
Allen, J. O.; Dookerna, N. M.; Smith, K A.; Sarofilm, A. F.; Taghizadeh, K.; Lafleur, A. L.,
1996. Measurement of polycyclic aromatic hydrocarbons associated with size-
segregated atmospheric aerosols in Massachusetts. Environmental Science &
Technology 30, 1023-1031.
Calderón-Garcidueñas, L., Reed, W., Maronpot R.R., Henríquez-Roldán C., Delgado-Chavez
R., Calderón-Garcidueñas A., Dragustinovis, I., Franco-Lira, M., Aragón-Flores, M.,
Solt, A.C., Altenburg, M., Torres-Jardón, R., Swenberg, J.A., 2004. Brain inflammation
and Alzheimer's-like pathology in individuals exposed to severe air pollution.
Toxicology Pathology 32(6), 650-8.
Coleman P. J., Lee, R. G. M., Alcock, R. E., Jones, K. C. 1997. Observations on PAH, PCB,
and PCDD/F trends in UK urban air 1991-1995. Environmental Science & Technology
31, 2120-2124.
Dimashki, M.; Lim, L. H.; Harrison, R. M.; Harrad, S., 2001. Temporal trends, temperature
dependence and relative reactivity of atmospheric polycyclic aromatic hydrocarbons.
Environmental Science & Technology, 35, 2264-2267.
Fischer, P.H., Hoek, G., van Reeuwijk, H., Briggs, D.J., Lebret, E., van Wijnen, J.H.,
Kingham, S., Elliott, P.E., 2000. Traffic-related differences in outdoor and indoor
concentrations of particles and volatile organic compounds in Amsterdam.
Atmospheric Environment 34, 3713-3722.
Flanders, P.J., 1994. Collection, measurement, and analysis of airborne magnetic particulates
from pollution in the environment, Journal Applied Physics 75, 5931-5936.
Gautam, P., Blaha, U. Appel, E., 2005. Magnetic susceptibility of dust-loaded leaves as a
proxy for traffic-related heavy metal pollution in Kathmandu city, Nepal. Atmospheric
Environment 39, 2201-2211.
Halsall, C. J.; Coleman, P. J.; Davis, B. J.; Burnett, V.; K. S. Waterhouse, Harding-Jones, P.;
Jones, K. C. 1994. Polycyclic aromatic hydrocarbons in UK urban air. Environmental
Science & Technology 28, 2380-2386.
11
Hanesch M, Scholger R, Rey D., 2003. Mapping dust distribution around an industrial site by
measuring magnetic parameters of tree leaves. Atmospheric Environment 37, 5125–
5133.
Herbert, B. M. J., Halsall, C. J.,Fitzpatrick, L., Villa, S., Jones, K. C., Thomas, G. O., 2004.
Use and validation of novel snow samplers for hydrophobic, semi-volatile organic
compounds (SVOCs). Chemosphere 56, 227-235.
Kaur, S., Nieuwenhuijsen, M, Colvile, R., 2005. Personal exposure of street canyon
intersection users to PM2.5, ultrafine particle counts and carbon monoxide in central
London, UK. Atmospheric Environment 39, 3629-3641.
Kingham, S., Briggs, D., Elliott, P., Fischer, P., Lebret, E., 2000. Spatial variations in the
concentrations of traffic-related pollutants in indoor and outdoor air in Huddersfield,
England. Atmospheric Environment 34, 905-916.
Knutsen, S., Shavlik, D., Chen, L.H., Beeson, W.L., Ghamsary, M., Petersen, F., 2004. The
association between ambient particulate air pollution levels and risk of cardiopulmonary
and all-cause mortality during 22 years follow-up of a non-smoking cohort. Results
from the AHSMOG study. Epidemiology, 15 S45-S45.
Liu, Q., Banerjee, S.K., Jackson, M.J., Zhu, R., Pan, Y., 2002. A new method in mineral
magnetism for the separation of weak antiferromagnetic signal from a strong
ferrimagnetic background, Geophysical Research Letters, 29 6-1-4.
Maher, B.A., 1988. Magnetic properties of some synthetic sub-micron magnetites. Geophysical
Journal Royal Astronomical Society, 94, 83-96.
Maher, B.A., Moore, C. & Matzka, J. (2008) Spatial variation in vehicle-derived metal
pollution identified by magnetic and elemental analysis of roadside tree leaves.
Atmospheric Environment, 42, 364-373 (doi.org/10.1016/j.atmosenv.2007.09.013).
Maher, B.A., Karloukovski, V.V. & Mutch, T.J., 2004. High-field remanence properties of
synthetic and natural submicrometre haematites and goethites: significance for
environmental contexts. Earth and Planetary Science Letters, 226, 491-505.
Matzka, J., Maher, B. A. 1999. Magnetic biomonitoring of roadside tree leaves: identification
of spatial and temporal variations in vehicle-derived particulates. Atmospheric
Environment 33, 4565-4569.
Morris, W. A., Versteeg, J. K., Bryant, D. W., Legzdins, A. E., McCarry, B. E., Marvin, C.
H., 1995. Preliminary comparison between mutagenicity and magnetic susceptibility of
respirable airborne particulates. Atmospheric Environment 29, 3441-3450.
12
Muxworthy, A.R., Schmidbauer, E. & Petersen, N., 2002. Magnetic properties and
Mossbauer spectra of urban atmospheric particulate matter: a case study from Munich,
Germany. Geophysical Journal International 150, 558-570.
Naumova, Y. Y., Eisenreich, S. J., Turpin, B. J., Weisel, C. P., Morandi, M. T., Colome, S.
D., Totten, L. A., Stock, T. H., Winer, A. M., Alimokhtari, S., Kwon, J., Shendell, D.,
Jones, J., Maberti, S., Wall, S. J. 2002. Polycyclic aromatic hydrocarbons in the indoor
and outdoor air of three cities in the US. Environmental Science & Technology, 36,
2552-2559.
Özdemir, Ö.; Banerjee, S. K., 1982. A preliminary magnetic study of soil samples from
West-Central Minnesota. Earth & Planetary Science Letters 59, 393-403.
Pope, C.A. III, Burnett, R.T.; Thun, M.J., Calle, E.E., Krewski, D., Kazuhiko I., Thurston,
G.D., 2002. Lung Cancer, Cardiopulmonary Mortality, and Long-term Exposure to Fine
Particulate Air Pollution. Journal of the American Medical Association 287, 1132-1141.
Sagnotti, L., Macrì, P., Egli, R., Mondino, M, 2006. Magnetic properties of atmospheric
particulate matter from automatic air sampler stations in Latium (Italy): Toward a
definition of magnetic fingerprints for natural and anthropogenic PM sources. Journal
of Geophysical Research 111:b12, B12S22.
Schwartz, J., 1996. Air pollution and hospital admissions for respiratory disease.
Epidemiology 7, 20-28.
Schwarze, P.E.; Øvrevik, J.; Låg, M.; Refsnes, M.; Nafstad, P.; Hetland, R.B.; Dybing, E.,
2006. Particulate matter properties and health effects: consistency of epidemiological
and toxicological studies. Human &Experimental Toxicology, 25, 559-579.
Smith, K. E. C., 2000. Chapter II. Development and validation of a method for the trace
analysis of polycyclic aromatic hydrocarbons in vegetation. In: The transfer of semi-
volatile organic chemicals to grassland. PhD thesis. Lancaster University, Lancaster.
Vriend, S. P., Van Gaans, P. F. M., Middleburg, J., De Nijs, A., 1988. The application of
fuzzy c-means cluster analysis and non-linear mapping to geochemical datasets:
examples from Portugal. Applied Geochemistry 3, 2-3-224.
Watkins S. J., Maher, B. A., 2003. Magnetic characterisation of present-day deep-sea
sediments and sources in the North Atlantic. Earth & Planetary Science Letters 214,
379-394.
Zielinska, B., Sagebiel, J., Arnott, W. P., Rogers, C. F., Kelly, K. E., Wagner, D. A., Lighty,
J. S., Sarofim, A. F., Palmer, G., 2004. Phase and size distribution of polycyclic
13
aromatic hydrocarbons in diesel and gasoline vehicle emissions. Environmental Science
& Technology 38, 2557-2567.
Figure headings
Figure 1. Arithmetic mean air concentrations for PAHs measured at the three sites (black
bars represent indoor samples and grey bars outdoors). Note the change in scale of the y-axes
in the right hand plots.
Figure 2. Total suspended particle (TSP) concentrations for the indoor (I) and outdoor (O)
samples.
Figure 3. Saturated isothermal remanence (SIRM) of particles collected on magnetically-
clean PTFE filters, normalised to the air volume (a) and particle mass (b).
Figure 4. Plot of HIRM vs. χARM /SIRM for the different samples. Increasing values of
χARM/SIRM indicate smaller magnetic grain size and increasing HIRM (where subsequently
stable to af demagnetisation) indicates the presence of haematite. The highest HIRM values
were observed for the suburban indoor air samples; possibly influenced by a cast-iron stove.
Figure 5. Relationship between SIRM and particle-bound (a) B[a]P and (b) phenanthrene
Figure 6. Non-linear map (a 2-D projection of the multidimensional magnetic and PAH
data) showing the grouping of indoor and outdoor air samples, based on B[a]P, phenanthrene
and SIRM (mass-normalised), χARM/SIRM, and the percentages of high-field IRM (HIRM,
i.e. the remanence acquired between 300 and 1000 mT). The axes are unitless, representing
statistical distance rather than any physical parameter.
Table 1. Summary of air samples and sites. NB Sampled air volumes in the indoor
environments were always considerably less (<30 %) than the internal volume of the property
(e.g., the internal volume of the CC apartment ~ 500 m3, the largest sampled air volume 141
m3).
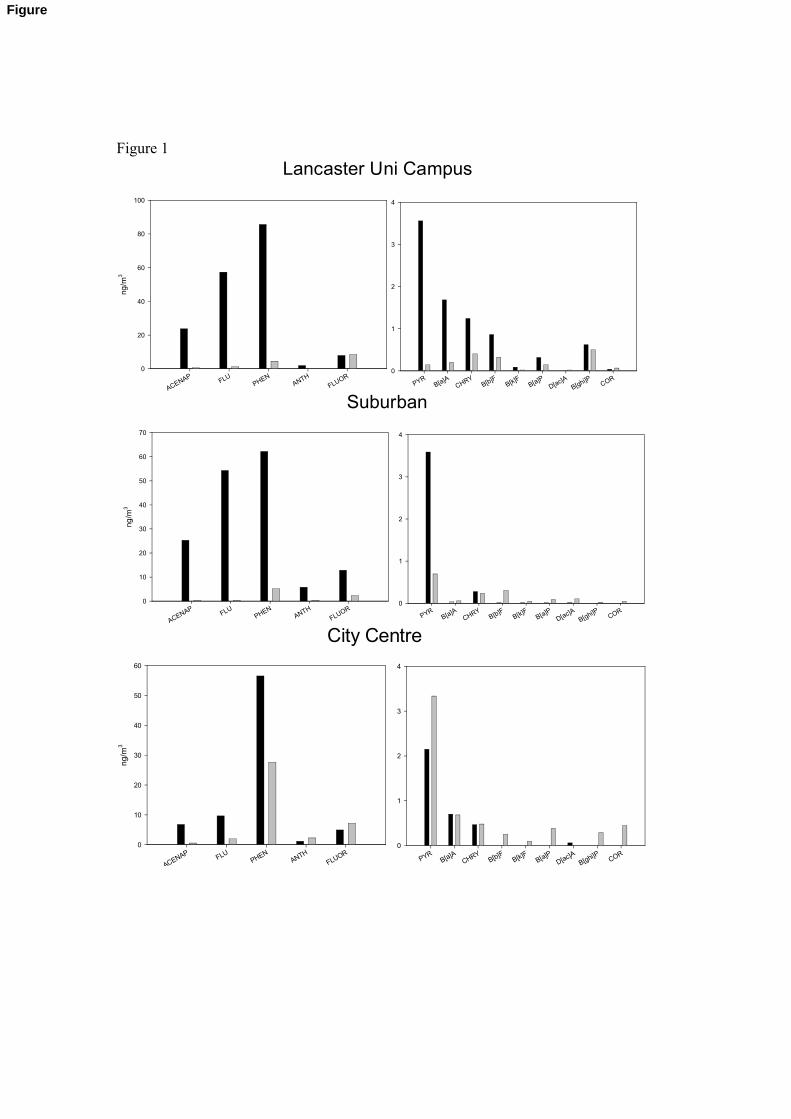
Figure 1
ACENAPFLU
PHENANTH
FLUOR
ng/m
3
0
20
40
60
80
100
Lancaster Uni Campus
PYRB[a]A
CHRYB[b]F
B[k]FB[a]P
D[ac]AB[ghi]P COR
0
1
2
3
4
Suburban
ACENAPFLU
PHENANTH
FLUOR
ng/m
3
0
10
20
30
40
50
60
70
PYRB[a]A
CHRYB[b]F
B[k]FB[a]P
D[ac]AB[ghi]P COR
0
1
2
3
4
City Centre
ACENAPFLU
PHENANTH
FLUOR
ng/m
3
0
10
20
30
40
50
60
PYRB[a]A
CHRYB[b]F
B[k]FB[a]P
D[ac]AB[ghi]P COR
0
1
2
3
4
Figure

Figure 2.
LUC I1LUCI2
LUCO1LUCO2
SUBI1SUBI2
SUBO1
SUBO2
SUBO3CCI1
CCI2CCI3
CCO1CCO2
CCO3
TS
P/
g m
-3
0
20
40
60
80
100
120
140

Figure 3.
LUC I1LUCI2
LUCO1
LUCO2SUBI1
SUBI2
SUBO1
SUBO2
SUBO3CCI1
CCI2CCI3
CCO1CCO2
CCO3
SIR
M/ A
m-1
(x1
0-9
)
0
2
4
6
8
1025
LUC I1LUCI2
LUCO1LUCO2
SUBI1SUBI2
SUBO1
SUBO2
SUBO3CCI1
CCI2CCI3
CCO1CCO2
CCO3
SIR
M/ A
m-1
g-1 (
x10
-4)
0
100
200
300
400
500

Figure 4
5 10 15 20 25 30 35
1
2
3
4
5
6
7
SUB-I2
SUB-I1
LUC-O1
CC-O1
SUB-O1 SUB-O3
CC-O3CC-O2
SUB-O2
LUC-I1
LUC-I2
LUC-02
CC-I1CC-I2
CC-I3
xARM/SIRM /(Am-1)-1 (x10-5)
HIR
M /%

Figure5
B[a]P/ng g-1
0.000 0.002 0.004 0.006 0.008 0.010 0.012
SIR
M /
Am
-1g
-1 (x
10-4
)
0
100
200
300
400
500
CC-O2
CC-O3
CC-O1
SUB-O2
SUB-O1
LUC-I1
LUC-O1
LUC-O2
0.00 0.02 0.04 0.06 0.08 0.10 0.12
0
100
200
300
400
500
SUB-I2CC-O2
phenanthrene/ ng g-1
SIR
M /A
m-1
g-1 (
x10-4
)
CC-O3
SUB-I1LUC-O2LUC-O1
CC-O1SUB-O1&O2
LUC-I1 CC-I3 CC-I2 CC-I1
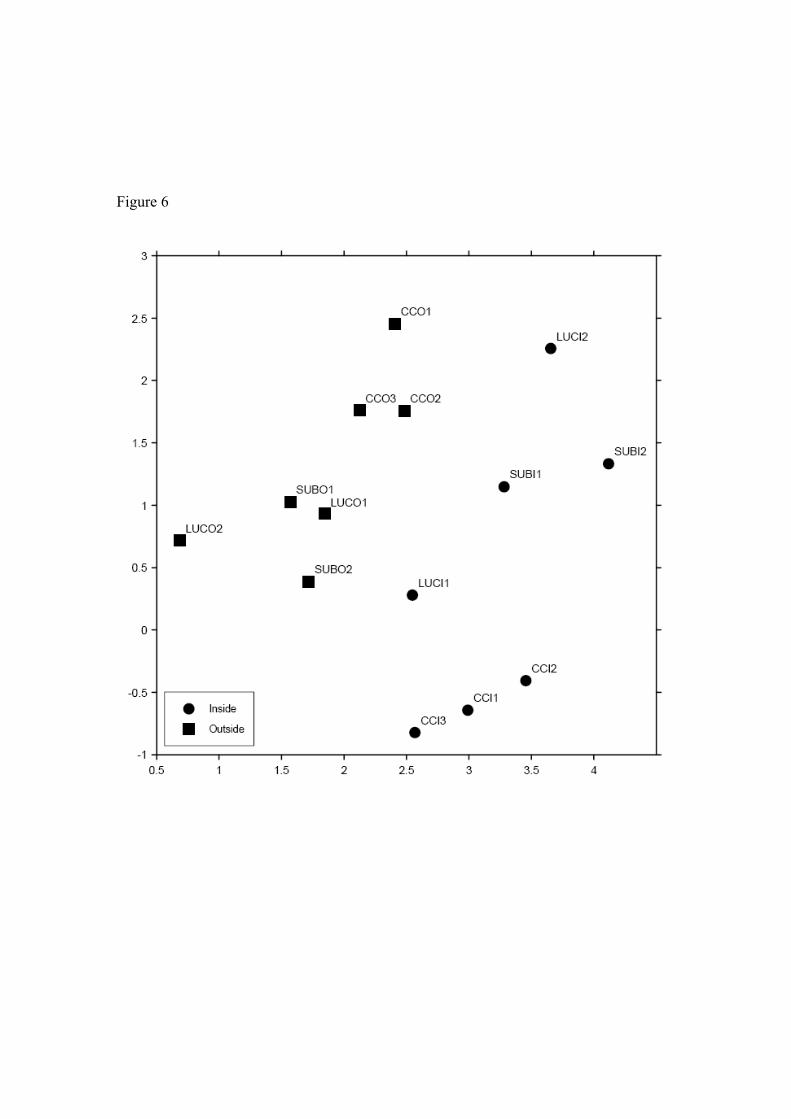
Figure 6
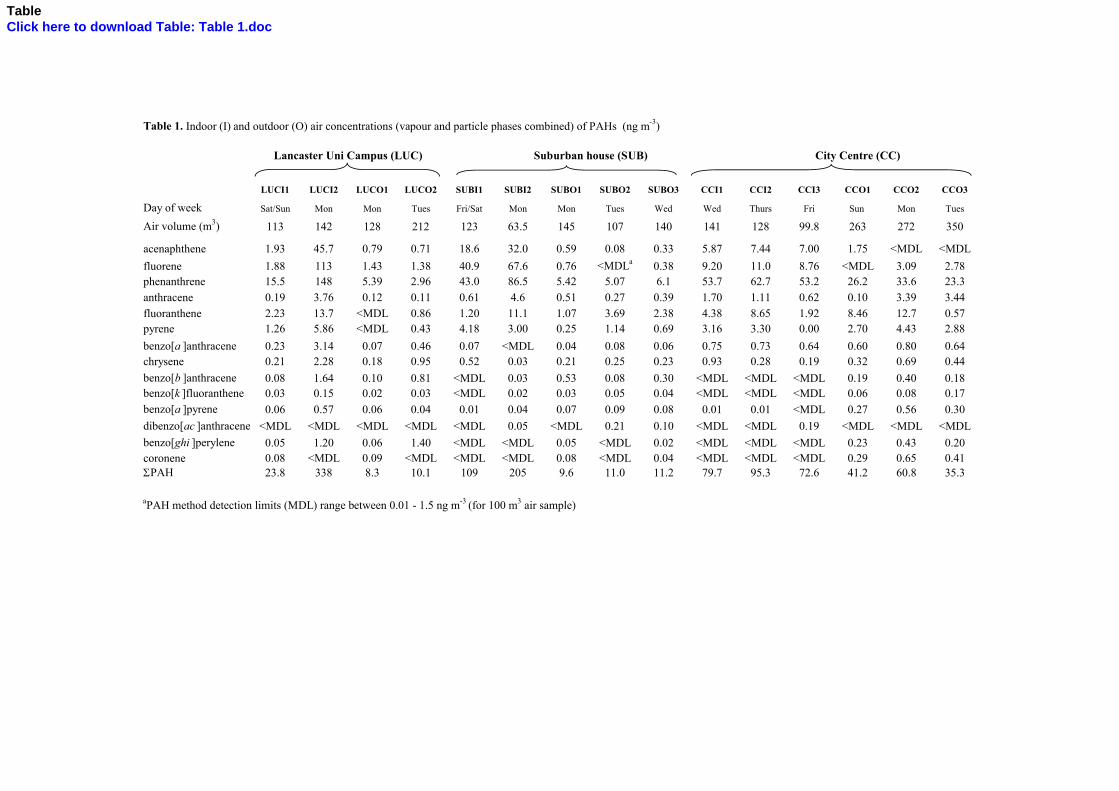
Table 1. Indoor (I) and outdoor (O) air concentrations (vapour and particle phases combined) of PAHs (ng m-3)
Lancaster Uni Campus (LUC) Suburban house (SUB) City Centre (CC)
LUCI1 LUCI2 LUCO1 LUCO2 SUBI1 SUBI2 SUBO1 SUBO2 SUBO3 CCI1 CCI2 CCI3 CCO1 CCO2 CCO3
Day of week Sat/Sun Mon Mon Tues Fri/Sat Mon Mon Tues Wed Wed Thurs Fri Sun Mon Tues
Air volume (m3) 113 142 128 212 123 63.5 145 107 140 141 128 99.8 263 272 350
acenaphthene 1.93 45.7 0.79 0.71 18.6 32.0 0.59 0.08 0.33 5.87 7.44 7.00 1.75 <MDL <MDL
fluorene 1.88 113 1.43 1.38 40.9 67.6 0.76 <MDLa 0.38 9.20 11.0 8.76 <MDL 3.09 2.78phenanthrene 15.5 148 5.39 2.96 43.0 86.5 5.42 5.07 6.1 53.7 62.7 53.2 26.2 33.6 23.3
anthracene 0.19 3.76 0.12 0.11 0.61 4.6 0.51 0.27 0.39 1.70 1.11 0.62 0.10 3.39 3.44
fluoranthene 2.23 13.7 <MDL 0.86 1.20 11.1 1.07 3.69 2.38 4.38 8.65 1.92 8.46 12.7 0.57pyrene 1.26 5.86 <MDL 0.43 4.18 3.00 0.25 1.14 0.69 3.16 3.30 0.00 2.70 4.43 2.88
benzo[a ]anthracene 0.23 3.14 0.07 0.46 0.07 <MDL 0.04 0.08 0.06 0.75 0.73 0.64 0.60 0.80 0.64chrysene 0.21 2.28 0.18 0.95 0.52 0.03 0.21 0.25 0.23 0.93 0.28 0.19 0.32 0.69 0.44
benzo[b ]anthracene 0.08 1.64 0.10 0.81 <MDL 0.03 0.53 0.08 0.30 <MDL <MDL <MDL 0.19 0.40 0.18benzo[k ]fluoranthene 0.03 0.15 0.02 0.03 <MDL 0.02 0.03 0.05 0.04 <MDL <MDL <MDL 0.06 0.08 0.17benzo[a ]pyrene 0.06 0.57 0.06 0.04 0.01 0.04 0.07 0.09 0.08 0.01 0.01 <MDL 0.27 0.56 0.30
dibenzo[ac ]anthracene <MDL <MDL <MDL <MDL <MDL 0.05 <MDL 0.21 0.10 <MDL <MDL 0.19 <MDL <MDL <MDL
benzo[ghi ]perylene 0.05 1.20 0.06 1.40 <MDL <MDL 0.05 <MDL 0.02 <MDL <MDL <MDL 0.23 0.43 0.20coronene 0.08 <MDL 0.09 <MDL <MDL <MDL 0.08 <MDL 0.04 <MDL <MDL <MDL 0.29 0.65 0.41SPAH 23.8 338 8.3 10.1 109 205 9.6 11.0 11.2 79.7 95.3 72.6 41.2 60.8 35.3
aPAH method detection limits (MDL) range between 0.01 - 1.5 ng m-3 (for 100 m3 air sample)
TableClick here to download Table: Table 1.doc