Condition Monitoring Through Non Destructive Technique Seminar
A non-destructive technique for chemical mapping of insectinclusions in amberAnezka Popovski Kolaceke Corresp., 1 , Ryan C McKellar 2, 3 , Mauricio Barbi 1
1 Physics Department, University of Regina, Regina, Saskatchewan, Canada2 Palaeontology, Royal Saskatchewan Museum, Regina, Saskatchewan, Canada3 Biology Department, University of Regina, Regina, Saskatchewan, Canada
Corresponding Author: Anezka Popovski KolacekeEmail address: [email protected]
Synchrotron-based techniques offer a wealth of elemental, molecular, and structuralinsights in biological samples, but the application of these techniques to fossils is arelatively new development. Here we examine how Synchrotron Radiation Micro X-RayFluorescence (SR µXRF) provides insights into the chemical composition of insects trappedin amber, while leaving the inclusions unaltered. By analyzing a series of ants(Hymenoptera: Formicidae) that range from modern material, to Eocene Baltic amber, andLate Cretaceous North Carolina amber, we investigate how variable preservationinfluences the results obtained through SR µXRF analyses, as well as the various meritsand pitfalls associated with the application of this technique to amber inclusions. The initialresults from this line of research are encouraging. They provide new avenues to studyelements that are original to the specimens involved, as well as those generated throughdecay, or introduced during taphonomic processes. This new technique also suggests arange of complementary techniques that may allow future studies to pursue traces oforiginal colour and cuticular reinforcement in amber inclusions. Ultimately, this workserves as an introduction to the underlying principles, strengths, and limitations associatedwith applying SR µXRF in a palaeontological context.
PeerJ Preprints | https://doi.org/10.7287/peerj.preprints.2337v1 | CC BY 4.0 Open Access | rec: 4 Aug 2016, publ: 4 Aug 2016
A non-destructive technique for chemical mapping of insect inclusions in amber
Anezka Popovski Kolaceke1, Ryan C. McKellar2,3, Mauricio Barbi1
1 Physics Department, University of Regina, Regina, Saskatchewan, Canada2 Palaeontology, Royal Saskatchewan Museum, Regina, Saskatchewan, Canada3 Biology Department, University of Regina, Regina, Saskatchewan, Canada
Corresponding Author:Anezka Popovski Kolaceke1
Email address: [email protected]
1
2
3
45
6
7
89
10
111213
1415161718192021222324252627282930313233343536373839404142
PeerJ Preprints | https://doi.org/10.7287/peerj.preprints.2337v1 | CC BY 4.0 Open Access | rec: 4 Aug 2016, publ: 4 Aug 2016

Abstract:Synchrotron-based techniques offer a wealth of elemental, molecular, and structural insights in biological samples, but the application of these techniques to fossils is a relatively new development. Here we examine how Synchrotron Radiation Micro X-Ray Fluorescence (SR µXRF) provides insights into the chemical composition of insects trapped in amber, while leaving the inclusions unaltered. By analyzing a series of ants (Hymenoptera: Formicidae) that range from modern material, to Eocene Baltic amber, and Late Cretaceous North Carolina amber, we investigate how variable preservation influences the results obtained through SR µXRF analyses, as well as the various merits and pitfalls associated with the application of this technique to amber inclusions. The initial results from this line of research are encouraging. They provide new avenues to study elements that are original to the specimens involved, as well as those generated through decay, or introduced during taphonomic processes. This new technique also suggests a range of complementary techniques that may allow future studies to pursue traces of original colour and cuticular reinforcement in amber inclusions. Ultimately, this work serves as an introduction to the underlying principles, strengths, and limitations associated with applying SR µXRF in a palaeontological context.
Key words: synchrotron, x-ray fluorescence, fossil, preservation, Formicidae, amber, imaging, palaeontology
1. Introduction:Synchrotron radiation has been utilized in the study of fossil insects for over a decade (Tafforeau et al., 2006). However, most of these analytical efforts have been focussed on morphology, making use of techniques such as synchrotron radiation x-ray microtomography (SR x-ray µCT). This technique has shed new light on fossil insects trapped in nearly opaque amber (Lak et al., 2008), and on structures within insects and arthropods that are highly informative in terms of their evolutionary relationships, or palaeoecology (e.g., Kirejtshuk et al., 2009; Edgecombe et al., 2012; Henderickx et al., 2013). A recent review of these efforts has been conducted by Soriano et al. (2010).
To date, few studies have examined chemistry within fossil insects using synchrotron radiation. Fossils of vertebrates, such as avian and non-avian theropods, and reptiles have received most attention (e.g., Bergmann et al., 2010; Edwards et al., 2011; Wogelius et al., 2011). Because of the size of the samples involved, Synchrotron Rapid Scanning X-ray Fluorescence (SRS-XRF) has been the primary technique utilized to map elemental distributions. The state of the art for scanning larger specimens was recently reviewed in the work of Bergmann et al. (2012). Analyses of smaller fossils, such as insects, have been limited to work with Scanning Electron Microscopy (SEM), employing an Energy Dispersive Spectrometer (EDS) to probe exposed compression fossils. Examples of this style of research include studies that have searched for traces of vertebrate blood within the body cavities of biting insects in the Eocene Kishenehn Formation (Greenwalt et al., 2013), or examined mineral replacement within the insects of the Cretaceous Crato Formation, Brazil (Barling et al., 2015).
43
44
45
46
47
48
49
50
51
52
53
54
55
56
57
58
59
60
61
62
63
64
65
66
67
68
69
70
71
72
73
74
75
76
77
78
79
80
81
82
83
PeerJ Preprints | https://doi.org/10.7287/peerj.preprints.2337v1 | CC BY 4.0 Open Access | rec: 4 Aug 2016, publ: 4 Aug 2016

The focus on larger fossils in chemical mapping efforts utilizing synchrotron radiation has created a situation in which the samples approached with leading-edge techniques often lack the quality of preservation seen within amber deposits, because they are mainly compression fossils (carbon films) or partially replaced (e.g., permineralized or diagenetically altered skeletal material). Amber offers an unmatched degree of preservation, with some deposits preserving mummified or partially carbonized soft tissues that are tens of millions of years old (Henwood, 1992a, 1992b; Grimaldi et al., 1994). The best examples of this degree of preservation are the uncommon findings of muscle, brain, and glandular tissue within Dominican amber insects (Henwood, 1992b; Grimaldi et al., 1994), and rare occurrences of muscle tissue preserved within Baltic amber insects (Van de Kamp et al., 2014). Previous works have examined tissues through ‘crack-out’ studies, where the amber is split in order to sample the inner cavities of insect inclusions. These destructive techniques have provided exceptional scanning electron microscopy (SEM) images of various tissues, and have created the opportunity for Transmission Electron Microscopy (TEM) or chemical observations of extracted tissues (Henwood, 1992b; Grimaldi, 1994). However, these techniques rely on damaging specimens, and there are no definitive external indicators for soft tissue preservation before a specimen is split. Utilizing Synchrotron Radiation Micro X-Ray Fluorescence (SR µXRF) permits the exploration of fossils as small as insect inclusions. The technique also holds much promise for investigating other fossils with exceptional preservation at a micrometre scale (e.g., McNamara et al., 2010).
To date, the closest approach to a non-destructive technique for examining the makeup of amber inclusions has been the use of Confocal Laser Scanning Microscopy (CLSM). This technique has been used to study fossil fungi and plant trichomes with great success (e.g., Speranza et al., 2010, Clark and Daly, 2010). However, CLSM relies heavily on autofluorescence of biological samples in amber. The range of energies utilized (and therefore molecules examined) is restricted by the wavelengths of laser light employed, and in many deposits the amber itself autofluoresces, producing a masking effect. SR µXRF does not suffer from these particular drawbacks, but the technique has its own limitations, which we describe below.
The samples used in this study are comprised of ants (Hymenoptera: Formicidae) ranging from recent exemplars to those found in Eocene Baltic amber (~50 Ma: Weitschat and Wichard, 2010), and Cretaceous North Carolina amber (~83.6 to 72.1 Ma: Krynicki, 2013). This series of samples was chosen to examine the fidelity with which amber preserves the original chemistry of tissues and decay products. Modern analogues are compared to some of the oldest examples of soft tissue preservation available within amber (Baltic amber), and to insects that belong to the same family, but have progressed beyond the limits of soft tissue preservation (North Carolina amber). This is an effort to lay the groundwork for analyses of additional elements across a wider range of amber deposits and fossil taxa. It is also an attempt to introduce the palaeontological community to the underlying principles, strengths, and caveats associated with using this form of chemical analysis in fossil samples.
2. Materials & Methods:
84
85
86
87
88
89
90
91
92
93
94
95
96
97
98
99
100
101
102
103
104
105
106
107
108
109
110
111
112
113
114
115
116
117
118
119
120
121
122
123
124
PeerJ Preprints | https://doi.org/10.7287/peerj.preprints.2337v1 | CC BY 4.0 Open Access | rec: 4 Aug 2016, publ: 4 Aug 2016
2.1. Samples and PreparationEach amber sample was embedded in mineralogical grade epoxy and cut with a water-cooled lapidary saw, so that the amber layer between the surface and the insect was between one and two millimetres thick. Subsequently, each specimen was polished with a series of lapidary wheels and wet sanding baths, until the amber layer was as thin as possible without creating any risk of causing damage to the insect (total specimen thickness was approximately two millimetres in most cases). The overlying amber layer varied in thickness from sample to sample, due to specimen and limb orientations, but this layer was typically in the range of tens to hundreds of micrometres in thickness. In cases where the insect’s appendages were directed toward a polished surface in the preparation, a thicker layer of overlying amber was left in place in an attempt to prevent infiltrations and damage to the samples. Once the amber pieces reached the target size and before the data acquisition, they were cleaned using isopropanol: otherwise, there was no other chemical pre-treatment. SR µXRF measurements were taken from the epoxy surrounding the samples, in order to ensure that no trace metals were present within the mountant, and that the polishing and handling process had not introduced contaminants that may influence sample observations. Comparative ant samples were prepared by inserting modern ants into the same epoxy resin that was used for amber embedding (Epo-Tek 301). Two treatments were attempted (live and dead embedding), to observe any differences in interaction with resin. This was meant to simulate different scenarios in which ants could end up trapped in resin, and to investigate any differences in tissue impregnation as a result of these interactions. Once the resin solidified, the samples were prepared with the same steps as the amber specimens. Museum specimens included in this study came from the Royal Saskatchewan Museum Palaeontology Collections, Regina, SK, Canada (RSM, P specimen prefixes); and the Division of Entomology, University of Kansas Natural History Museum , Lawrence, Kansas (SEMC, NC 272-276).
2.2. Data AcquisitionThe specimens were mounted using carbon tape, upon an aluminum sample holder at the Soft X-ray Micro-characterization Beamline (SXRMB), at the Canadian Light Source (CLS) (Fig. 1). Because the use of lower energy x-rays on this beamline requires experiments conducted in vacuum (due to their low penetration in air), more than one specimen was often mounted at a time, in order to save time at the beamline.
125
126
127
128
129
130
131
132
133
134
135
136
137
138
139
140
141
142
143
144
145
146
147
148
149150
151
152
153
154
155
156
PeerJ Preprints | https://doi.org/10.7287/peerj.preprints.2337v1 | CC BY 4.0 Open Access | rec: 4 Aug 2016, publ: 4 Aug 2016
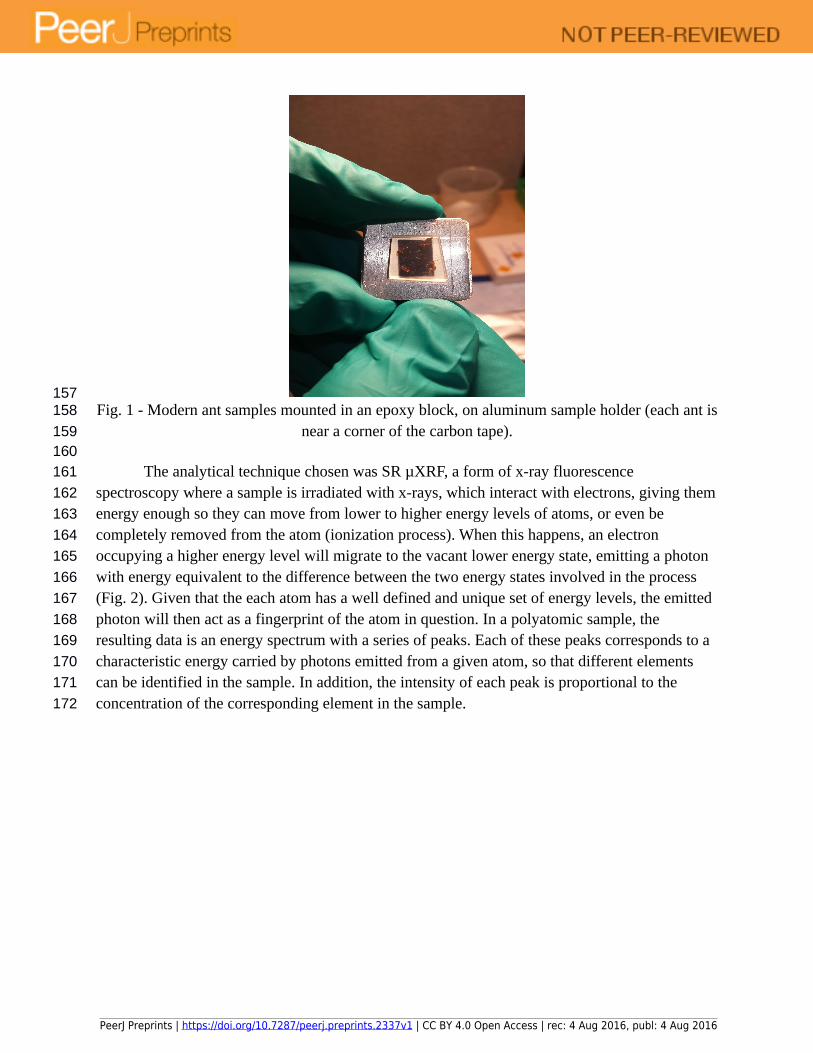
Fig. 1 - Modern ant samples mounted in an epoxy block, on aluminum sample holder (each ant is near a corner of the carbon tape).
The analytical technique chosen was SR µXRF, a form of x-ray fluorescence spectroscopy where a sample is irradiated with x-rays, which interact with electrons, giving them energy enough so they can move from lower to higher energy levels of atoms, or even be completely removed from the atom (ionization process). When this happens, an electron occupying a higher energy level will migrate to the vacant lower energy state, emitting a photon with energy equivalent to the difference between the two energy states involved in the process (Fig. 2). Given that the each atom has a well defined and unique set of energy levels, the emitted photon will then act as a fingerprint of the atom in question. In a polyatomic sample, the resulting data is an energy spectrum with a series of peaks. Each of these peaks corresponds to a characteristic energy carried by photons emitted from a given atom, so that different elements can be identified in the sample. In addition, the intensity of each peak is proportional to the concentration of the corresponding element in the sample.
157158
159160
161
162
163
164
165
166
167
168
169
170
171
172
PeerJ Preprints | https://doi.org/10.7287/peerj.preprints.2337v1 | CC BY 4.0 Open Access | rec: 4 Aug 2016, publ: 4 Aug 2016
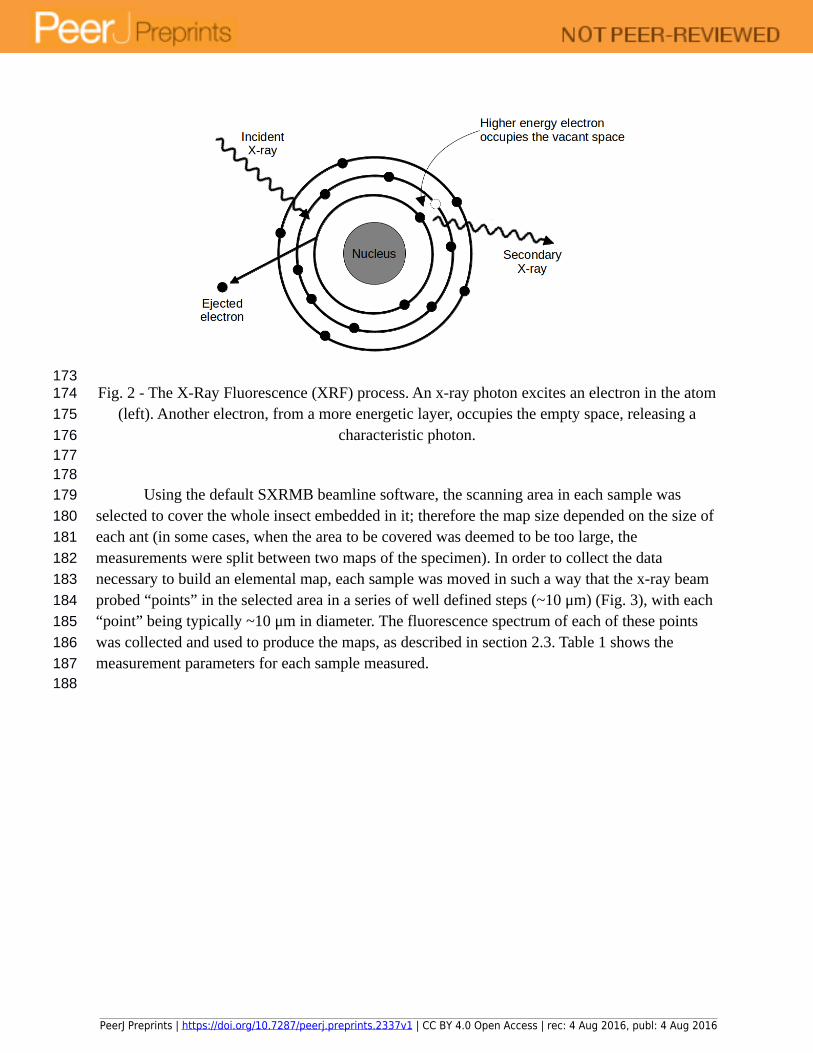
Fig. 2 - The X-Ray Fluorescence (XRF) process. An x-ray photon excites an electron in the atom (left). Another electron, from a more energetic layer, occupies the empty space, releasing a
characteristic photon.
Using the default SXRMB beamline software, the scanning area in each sample was selected to cover the whole insect embedded in it; therefore the map size depended on the size of each ant (in some cases, when the area to be covered was deemed to be too large, the measurements were split between two maps of the specimen). In order to collect the data necessary to build an elemental map, each sample was moved in such a way that the x-ray beam probed “points” in the selected area in a series of well defined steps (~10 μm) (Fig. 3), with each “point” being typically ~10 μm in diameter. The fluorescence spectrum of each of these points was collected and used to produce the maps, as described in section 2.3. Table 1 shows the measurement parameters for each sample measured.
173174
175
176177178
179
180
181
182
183
184
185
186
187188
PeerJ Preprints | https://doi.org/10.7287/peerj.preprints.2337v1 | CC BY 4.0 Open Access | rec: 4 Aug 2016, publ: 4 Aug 2016

Fig. 3 - Mapping with the SXRMB beamline software.
Table 1 - Data acquisition parameters for all samples analyzed.
Sample Step size (µm) Map size (mm) Acquisition time (s)
Beam energy (eV)
Modern ant 50.0 x 50.0 2.50 x 3.50 3.0 7200Modern ant (dead) 60.0 x 60.0 2.60 x 1.90 2.0 7200Baltic amber 6 40 x 40 4.00 x 2.90 4.0 7200Baltic amber 13 45.0 x 45.0 2.40 x 3.20 3.0 7200Baltic amber 8 40.0 x 40.0 2.40 x 2.10 3.0 7200North Carolina amber 40.0 x 40.0 3.40 x 1.40
3.85 x 1.803.0 7200
189190191192
193
PeerJ Preprints | https://doi.org/10.7287/peerj.preprints.2337v1 | CC BY 4.0 Open Access | rec: 4 Aug 2016, publ: 4 Aug 2016
2.3. Data Analysis MethodologyThe methodology used to produce each map is discussed in this section.
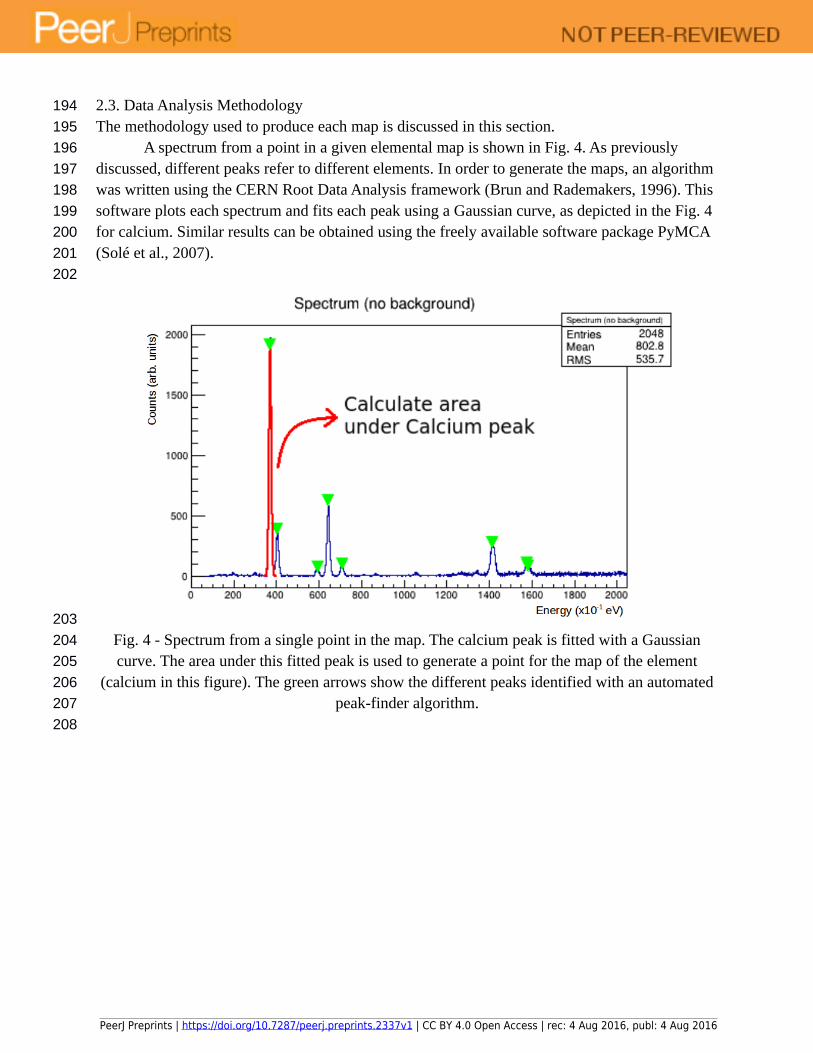
A spectrum from a point in a given elemental map is shown in Fig. 4. As previously discussed, different peaks refer to different elements. In order to generate the maps, an algorithm was written using the CERN Root Data Analysis framework (Brun and Rademakers, 1996). This software plots each spectrum and fits each peak using a Gaussian curve, as depicted in the Fig. 4 for calcium. Similar results can be obtained using the freely available software package PyMCA (Solé et al., 2007).
Fig. 4 - Spectrum from a single point in the map. The calcium peak is fitted with a Gaussian curve. The area under this fitted peak is used to generate a point for the map of the element
(calcium in this figure). The green arrows show the different peaks identified with an automated peak-finder algorithm.
194
195
196
197
198
199
200
201
202
203
204
205
206
207
208
PeerJ Preprints | https://doi.org/10.7287/peerj.preprints.2337v1 | CC BY 4.0 Open Access | rec: 4 Aug 2016, publ: 4 Aug 2016
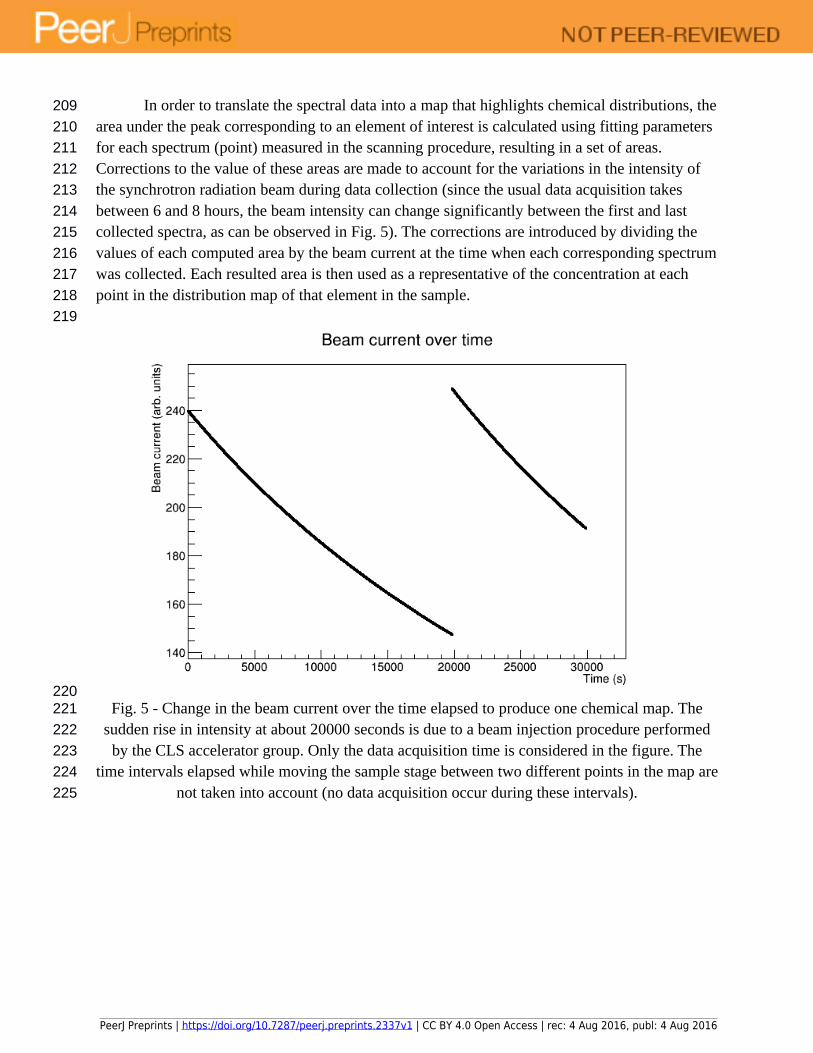
In order to translate the spectral data into a map that highlights chemical distributions, the area under the peak corresponding to an element of interest is calculated using fitting parameters for each spectrum (point) measured in the scanning procedure, resulting in a set of areas. Corrections to the value of these areas are made to account for the variations in the intensity of the synchrotron radiation beam during data collection (since the usual data acquisition takes between 6 and 8 hours, the beam intensity can change significantly between the first and last collected spectra, as can be observed in Fig. 5). The corrections are introduced by dividing the values of each computed area by the beam current at the time when each corresponding spectrum was collected. Each resulted area is then used as a representative of the concentration at each point in the distribution map of that element in the sample.
Fig. 5 - Change in the beam current over the time elapsed to produce one chemical map. The sudden rise in intensity at about 20000 seconds is due to a beam injection procedure performed
by the CLS accelerator group. Only the data acquisition time is considered in the figure. The time intervals elapsed while moving the sample stage between two different points in the map are
not taken into account (no data acquisition occur during these intervals).
209
210
211
212
213
214
215
216
217
218
219
220221
222
223
224
225
PeerJ Preprints | https://doi.org/10.7287/peerj.preprints.2337v1 | CC BY 4.0 Open Access | rec: 4 Aug 2016, publ: 4 Aug 2016
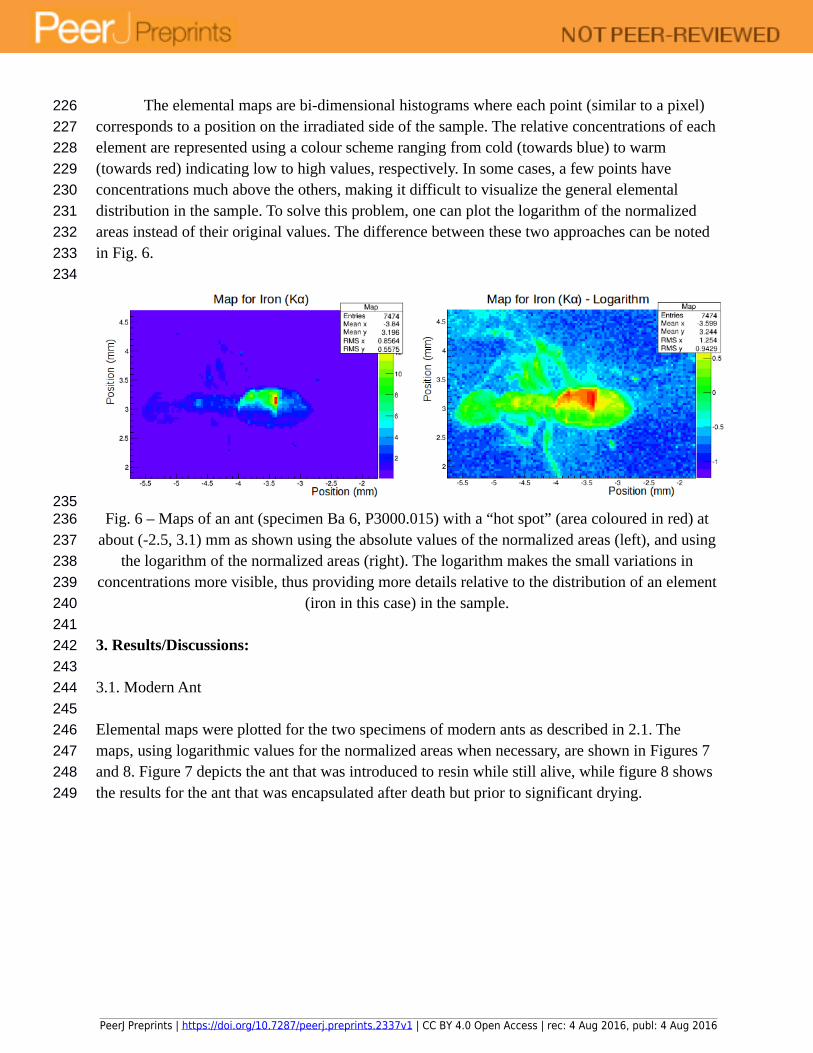
The elemental maps are bi-dimensional histograms where each point (similar to a pixel) corresponds to a position on the irradiated side of the sample. The relative concentrations of each element are represented using a colour scheme ranging from cold (towards blue) to warm (towards red) indicating low to high values, respectively. In some cases, a few points have concentrations much above the others, making it difficult to visualize the general elemental distribution in the sample. To solve this problem, one can plot the logarithm of the normalized areas instead of their original values. The difference between these two approaches can be noted in Fig. 6.
Fig. 6 – Maps of an ant (specimen Ba 6, P3000.015) with a “hot spot” (area coloured in red) at about (-2.5, 3.1) mm as shown using the absolute values of the normalized areas (left), and using
the logarithm of the normalized areas (right). The logarithm makes the small variations in concentrations more visible, thus providing more details relative to the distribution of an element
(iron in this case) in the sample.
3. Results/Discussions:
3.1. Modern Ant
Elemental maps were plotted for the two specimens of modern ants as described in 2.1. The maps, using logarithmic values for the normalized areas when necessary, are shown in Figures 7 and 8. Figure 7 depicts the ant that was introduced to resin while still alive, while figure 8 shows the results for the ant that was encapsulated after death but prior to significant drying.
226
227
228
229
230
231
232
233
234
235236
237
238
239
240
241
242
243
244
245
246
247
248
249
PeerJ Preprints | https://doi.org/10.7287/peerj.preprints.2337v1 | CC BY 4.0 Open Access | rec: 4 Aug 2016, publ: 4 Aug 2016

Fig. 7 - Maps for the live modern ant compared to its optical microscope image.
250
251252253254
PeerJ Preprints | https://doi.org/10.7287/peerj.preprints.2337v1 | CC BY 4.0 Open Access | rec: 4 Aug 2016, publ: 4 Aug 2016
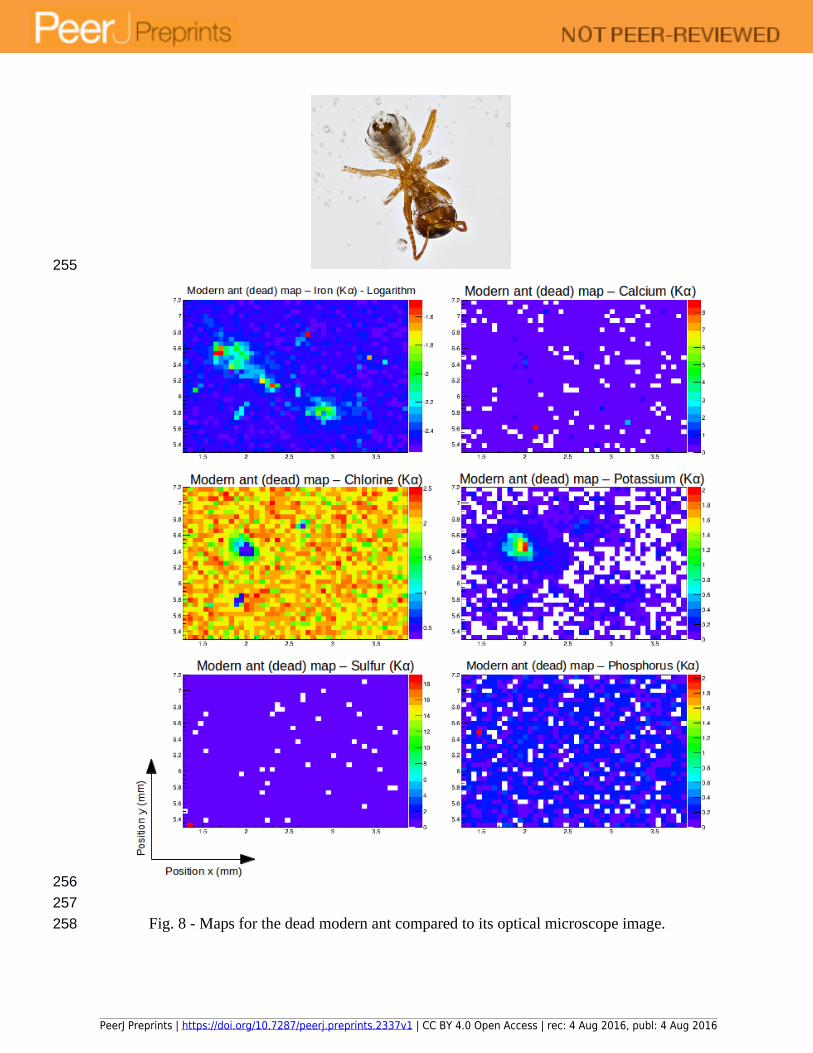
Fig. 8 - Maps for the dead modern ant compared to its optical microscope image.
255
256
257
258
PeerJ Preprints | https://doi.org/10.7287/peerj.preprints.2337v1 | CC BY 4.0 Open Access | rec: 4 Aug 2016, publ: 4 Aug 2016
The epoxy material used does not change the measured chemical composition of the ant since the elements in its composition cannot be detected within the energy range used in the measurements with SR µXRF in the SXRMB beamline. The one exception is chlorine, which is an impurity in the resin, but also it is not an element of interest within the insects. These properties were verified by the measurement of a single point spectrum targeting the resin, which provided no signal that could change the results presented herein. The presence of chlorine almost exclusively in the resin can be seen on the maps, where it shows high concentrations everywhere except in positions where the epoxy layer is very thin, (i.e., directly above the insect inclusion). However, the thickness of the layer of epoxy (or amber) does play a role on the resulting maps. As exemplified in Fig. 7, the fact that the ant is not positioned parallel with the surface of the epoxy block, and perpendicular in relation to the beam, affects the results. In these chemical maps, only the head of the ant is visible, because this is the part of the body with the thinnest layer of epoxy overlying it. This particular analytical artefact is due to two penetration effects: 1) the thicker the epoxy layer, the less x-rays will reach the ant in the first place; and, 2) once the x-rays reach the ant, the fluorescence photons still have to travel through the epoxy in order to reach the detector, so a thicker layer will attenuate this signal as well. These two effects together may reduce the number of photons detected to the point where they are overwhelmed by background and noise counts, and a measurement cannot be made. Since the thickness effect is also present in amber samples, every effort should be made to orient insect inclusions parallel to the upper sampling surface, and to achieve an overlying layer that is as thin as possible without damaging the specimens in order to obtain the clearest mapping results possible.
Although the effects of the thickness of the epoxy and amber layers on the quality of the data are similar, the compositions of the two materials are different, with the epoxy containing a larger amount of chlorine than the amber, as can be noted by comparing the results presented in Fig. 7 and 8 with the results discussed in section 3.2. This difference should not heavily influence analytical results in palaeontological studies because, as mentioned before, the distribution of chlorine is not of particular interest within the insect inclusions, but it can be used to determine physical properties of the amber itself. For example, the distribution of chlorine can be informative in amber samples that have been embedded in epoxy for stabilization. In this case, cracks that have been infilled by epoxy would show a much higher concentration of chlorine than the adjacent areas.
3.2. Baltic AmberThree specimens of ants in Baltic amber (P3000.015, P3000.016 and P3000.017) were mapped and the plots are shown in Figs. 9, 10 and 11 (in logarithm scale). The maps in Fig. 9 were generated using the data collected with an older version of the SXRMB beamline data acquisition software. This older version did not provide the user with the data to plot each spectrum, but only the area under the peaks corresponding to each selected element for each point in the map. The consequence of this procedure was that only the maps for the elements chosen at the data acquisition time were reconstructed, and that there was no control over the algorithm used to produce the maps.
259
260
261
262
263
264
265
266
267
268
269
270
271
272
273
274
275
276
277
278
279
280
281
282
283
284
285
286
287
288
289290
291
292
293
294
295
296
297
298
299
PeerJ Preprints | https://doi.org/10.7287/peerj.preprints.2337v1 | CC BY 4.0 Open Access | rec: 4 Aug 2016, publ: 4 Aug 2016
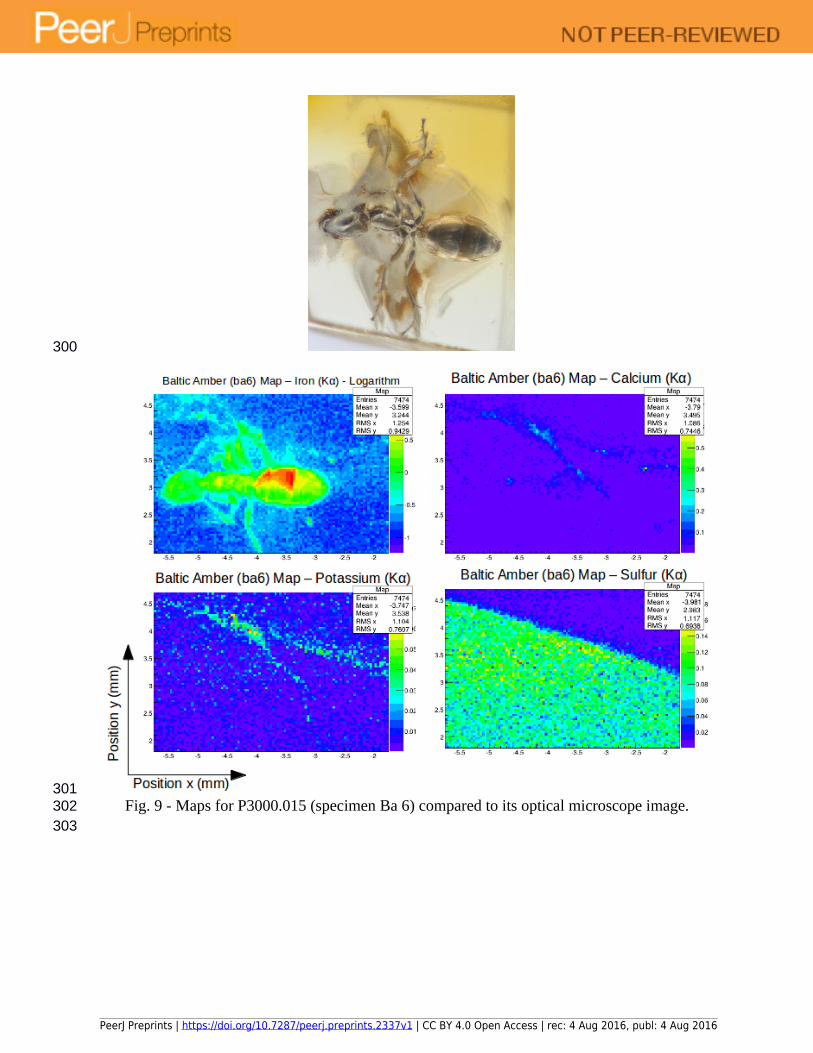
Fig. 9 - Maps for P3000.015 (specimen Ba 6) compared to its optical microscope image.
300
301302303
PeerJ Preprints | https://doi.org/10.7287/peerj.preprints.2337v1 | CC BY 4.0 Open Access | rec: 4 Aug 2016, publ: 4 Aug 2016
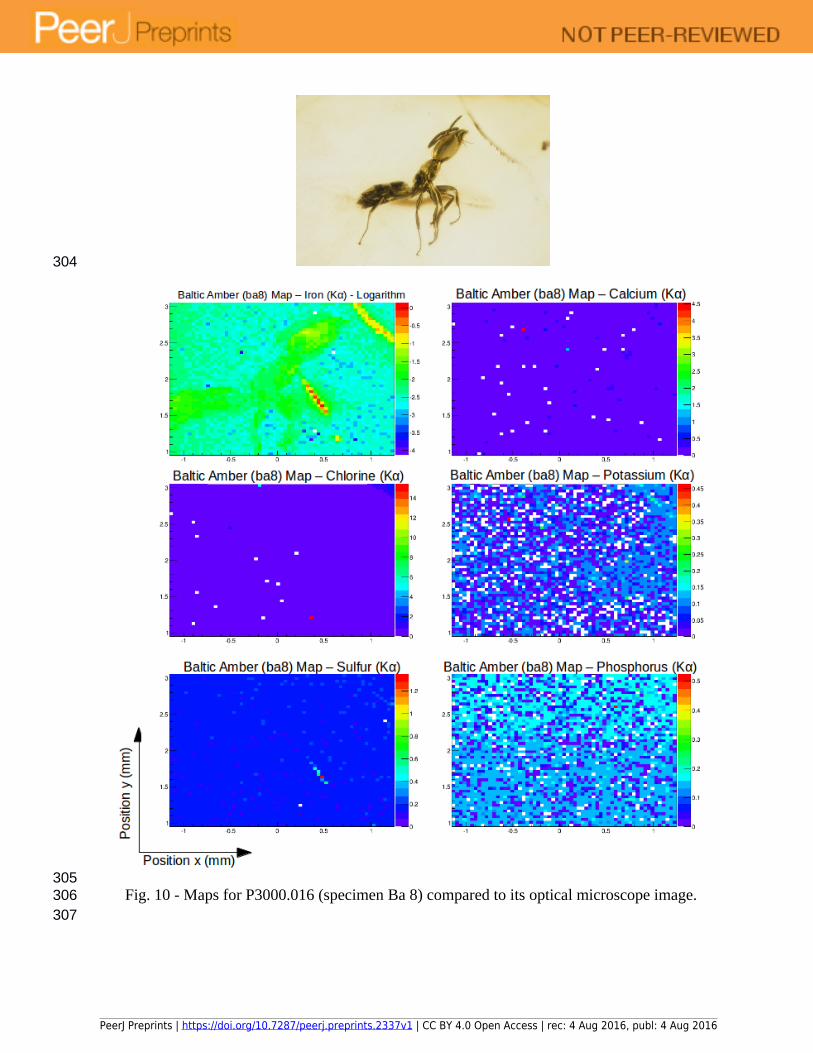
Fig. 10 - Maps for P3000.016 (specimen Ba 8) compared to its optical microscope image.
304
305306307
PeerJ Preprints | https://doi.org/10.7287/peerj.preprints.2337v1 | CC BY 4.0 Open Access | rec: 4 Aug 2016, publ: 4 Aug 2016

Fig. 11 - Maps for P3000.017 (specimen Ba 13) compared to its optical microscope image.
308
309310
PeerJ Preprints | https://doi.org/10.7287/peerj.preprints.2337v1 | CC BY 4.0 Open Access | rec: 4 Aug 2016, publ: 4 Aug 2016

All the specimens show a clear distribution of iron, which seems to be the best preserved element. Differences in concentrations, however, can be due to several factors such as: relative position of the insect relative to the x-ray beam direction; different levels of preservation within different parts of the insect; presence of different tissues and/or organs or decay products. It is, thus, useful to incorporate at least one additional imaging technique that can add detailed structural and positional information regarding the insect. For this purpose and as an extension of the current study, we are currently collecting and analysing data using Synchrotron Radiation X-ray micro-CT to assess the preservation of different tissues in some of the ant specimens examined herein. This will allow us to overlay chemical and structural data to further the studies presented in this work.
Iron is a material with biological relevance for insects. It is present in large quantities while insects are alive, and it is also retained as a product of their soft tissue decay after death. The main difference between biologically sourced iron and that introduced during diagenesis is its oxidation state. Although this is a possibility that has yet to be explored, it seems probable that synchrotron radiation could also be used to infer the source of elements within fossils by means of using X-ray Absorption Near Edge Structure (XANES), which provides information about the chemical state of the elements. This analysis can usually be made at the same beamlines where SR µXRF is performed. A major caveat for the use of XANES to infer the presence of original iron is that some minerals, such as pyrite, also contain ferrous iron.
Although XRF mapping is not usually a quantitative method, it provides valuable distribution information that in general can outclass others provided by more conventional methods for insect inclusions. It is also mostly non-destructive (it requires the amber to be modified, but not the insect), and non-invasive. Minimal sample preparation is required, with the main concern related to the thickness of the amber layer between the insect and the x-ray beam. Potential exists to use this technique in a semi-quantitative fashion, but this would require comparisons between the samples being analyzed and standards (an example of such an attempt can be seen on Tolhurst et al., 2015). However, it is difficult to envision this approach in the context of non-destructive amber research, because of the range of sample thicknesses, orientations, and chemical heterogeneity that are present within this setting.
3.3. North Carolina AmberThe North Carolina amber specimen (NC 272-276) contains five partial ant inclusions, one of which was mapped (Fig. 12). The choice of the inclusion to be mapped was made based on preliminary x-ray images provided by a benchtop µCT (Cooper Lab, University of Saskatchewan). The ant selected was the specimen that showed the greatest contrast in the benchtop analyses.
311
312
313
314
315
316
317
318
319
320
321
322
323
324
325
326
327
328
329
330
331
332
333
334
335
336
337
338
339340341
342
343
344
345
346
347348
PeerJ Preprints | https://doi.org/10.7287/peerj.preprints.2337v1 | CC BY 4.0 Open Access | rec: 4 Aug 2016, publ: 4 Aug 2016
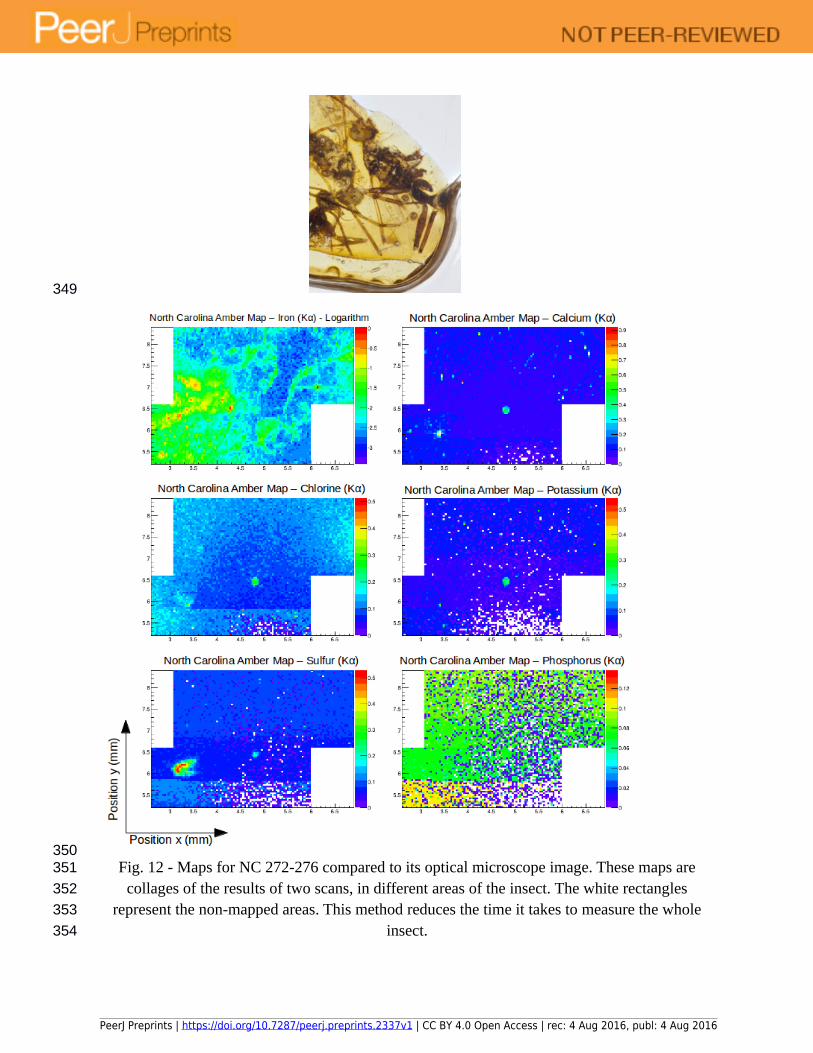
Fig. 12 - Maps for NC 272-276 compared to its optical microscope image. These maps are collages of the results of two scans, in different areas of the insect. The white rectangles
represent the non-mapped areas. This method reduces the time it takes to measure the whole insect.
349
350351
352
353
354
PeerJ Preprints | https://doi.org/10.7287/peerj.preprints.2337v1 | CC BY 4.0 Open Access | rec: 4 Aug 2016, publ: 4 Aug 2016

Although it is possible to see somewhat of an iron distribution, the insect is not as clearly outlined as those seen in the elemental maps for the Baltic amber specimens, making the interpretation of the results more difficult. This difference can be explained by the state of preservation of the insect. Compared to the Baltic amber specimens, the specimens found in North Carolina amber are much older, and the exoskeletons are not so well preserved. In the Cretaceous material, each exoskeleton has become carbonized, and broken up into sheets of cuticle that have a much lower concentration of iron. Even without chemical data, it is possible to see that the insects have been heavily altered when compared to the specimens measured in 3.2. However, it appears as though some traces of the iron content within their original cuticle stayed trapped within their carbonized remains.
Another obstacle encountered in the SR µXRF analysis of the North Carolina amber sample (which decreases the quality of the collected data), is the fact that the amber piece has a curved outer surface. In this case, there was no way in which the amber piece could be polished flat without damaging the insect inclusions. The problem with round samples is that not only is the amber layer on top of the insect variable in thickness due to sample curvature, but the beam can only be focused at one distance when the data for the map are being collected. A rounded outer surface means that the beam focal distance should change in order to maintain focus on the exoskeleton. Since the focal distance did not change during the course of our scans, there may be additional uncertainties to the results of the scan. In particular, variable thickness and focal distances may lower the quality of the measurements, or even add structures that do not reflect real differences in the distribution of the elements, but rather geometric effects.
4. Conclusions:Measuring chemical properties of amber inclusions in a non-destructive and non-invasive way is possible using synchrotron radiation, as long as the insect is well preserved, and can be prepared in an appropriate manner. In all of the well-preserved insects that we have examined to date, a good iron distribution can be observed, and this distribution appears to be directly related to the original cuticle, tissue, or decay products of the insect.
Moving forward, the best measurements will be the result of making sure the insect is as flat as possible in relation to the x-ray beam and that the sample is polished parallel to the insect. Curvatures or angles can interfere with beam focusing and beam penetration, and thus generate uncertainties and distribution patterns that are not reflective of the insect itself. When considering which samples to analyze through SR µXRF, factors such as age, diagenetic history, deposit type, and inclusion type, among others should be taken into account. These factors can affect the preservation state of the insect, and they can dramatically alter the possibility of obtaining good measurements from fossil specimens.
355
356
357
358
359
360
361
362
363
364
365
366
367
368
369
370
371
372
373
374
375376377
378
379
380
381
382
383
384
385
386
387
388
389
390
391
PeerJ Preprints | https://doi.org/10.7287/peerj.preprints.2337v1 | CC BY 4.0 Open Access | rec: 4 Aug 2016, publ: 4 Aug 2016

Future work will include chemical state analyses, using synchrotron techniques such as XANES, so it will be possible to determine if the iron being measured is introduced, a product of decay, or if it is original to the insect. Also, a different beamline, which can reach higher levels of energy, could provide insights into the distribution of copper and zinc, which could give information about the insect with respect to its cuticular reinforcement or colour, for example.
Acknowledgements
The authors thank David Cooper, Isaac Pratt, and Kim Harrison (University of Saskatchewan) for assistance in benchtop x-ray µCT scanning of amber inclusions in preparation for this project; thanks are also given to Michael Engel (University of Kansas) and Victor Krynicki, for access to the North Carolina ant specimens. The research described in this paper was performed at the Canadian Light Source. Anezka P. Kolaceke acknowledges the receipt of support from the Canadian Light Source Graduate Student Travel Support Program and from the Faculty of Graduate Studies and Research at the University of Regina.
ReferencesBarling N, Martill DM, Heads SW, Gallien S. 2014. High fidelity preservation of fossil insects
from the Crato Formation (Lower Cretaceous) of Brazil. Cretaceous Research 52:605-622.
Bergmann U, Morton RW, Manning PL, Sellers WI, Farrar S, Huntley KG, Wogelius RA, Larson P. 2010. Archaeopteryx feathers and bone chemistry fully revealed via synchrotron imaging. Proceedings of the National Academy of Sciences 107(20):9060-9065.
Bergmann U, Manning PL, Wogelius RA. 2012. Chemical mapping of paleontological and archeological artifacts with synchrotron X-rays. Annual Review of Analytical Chemistry 5:361-389.
Brun R, Rademakers, F. 1997. ROOT - An Object Oriented Data Analysis Framework. Proceedings AIHENP'96 Workshop, Lausanne, Sep. 1996, Nucl. Inst. & Meth. in Phys. Res. A 389: 81-86. See also http://root.cern.ch/.
Clark ND, Daly C. 2010. Using confocal laser scanning microscopy to image trichome inclusions in amber. Journal of Paleontological Techniques 8:1-7.
Dietz W, Richter W, Schäfer U, Schmidt A. 2003. Investigation of microfossils in 100 million-year-old amber. Microscopy and Microanalysis 9(S03):472-473.
Edgecombe GD, Vahtera V, Stock SR, Kallonen A, Xiao X, Rack A, Giribet G. 2012. A scolopocryptopid centipede (Chilopoda: Scolopendromorpha) from Mexican amber: synchrotron microtomography and phylogenetic placement using a combined morphological and molecular data set. Zoological Journal of the Linnean Society 166(4):768-786.
392
393
394
395
396397
398399
400
401
402
403
404
405
406407
408
409
410
411
412
413
414
415
416
417
418
419
420
421
422
423
424
425
426
427
428
429
PeerJ Preprints | https://doi.org/10.7287/peerj.preprints.2337v1 | CC BY 4.0 Open Access | rec: 4 Aug 2016, publ: 4 Aug 2016
Edwards NP, Barden HE, Van Dongen BE, Manning PL, Larson PL, Bergmann U, Sellers WI, Wogelius RA. 2011. Infrared mapping resolves soft tissue preservation in 50 million year-old reptile skin. Proceedings of the Royal Society of London B: Biological Sciences 278(1722):3209-18.
Greenwalt DE, Goreva YS, Siljeström, SM, Rose T, Harbach RE. 2013. Hemoglobin-derived porphyrins preserved in a Middle Eocene blood-engorged mosquito. Proceedings of the National Academy of Sciences USA 110(1849):18496-18500.
Grimaldi D, Bonwich E, Delannoy M, Doberstein S. 1994. Electron microscopic studies of mummified tissues in amber fossils. American Museum Novitates 3097:1-31.
Henderickx H, Bosselaers J, Pauwels E, Van Hoorebeke L, Boone M. 2013. X-ray micro-CT reconstruction reveals eight antennomeres in a new fossil taxon that constitutes a sister clade to Dundoxenos and Triozocera (Strepsiptera: Corioxenidae). Palaeontologia Electronica 16(3):16-31.
Henwood A. 1992a. Exceptional preservation of dipteran flight muscle and the taphonomy of insects in amber. Palaios 7(2):203-212.
Henwood A. 1992b. Soft-part preservation of beetles in Tertiary amber from the Dominican Republic. Palaeontology 35(4):901-912.
Kirejtshuk AG, Azar D, Tafforeau P, Boistel R, Fernandez V. 2009. New beetles of Polyphaga (Coleoptera, Polyphaga) from Lower Cretaceous Lebanese amber. Denisia 26:119-130.
Krynicki VE. 2013. Primitive ants (Hymenoptera: Sphecomyrminae) in the Campanian (Late Cretaceous) of North Carolina (USA). Life: The Excitement of Biology 1:156-165.
Lak M, Néraudeau D, Nel A, Cloetens P, Perrichot V, Tafforeau P. 2008. Phase contrast X-ray synchrotron imaging: opening access to fossil inclusions in opaque amber. Microscopy and Microanalysis. 14:251-259.
McNamara M, Orr PJ, Kearns SL, Alcalá L, Anadón P, Peñalver-Mollá E. 2010. Organic preservation of fossil musculature with ultracellular detail. Proceedings of the Royal Society of London B: Biological Sciences 277:423–427.
Solé VA, Papillon E, Cotte M, Walter Ph, Susini J. 2007. A multiplatform code for the analysis of energy-dispersive X-ray fluorescence spectra. Spectrochim. Acta Part B 62: 63-68.
Soriano C, Archer M, Azar D, Creaser P, Delclòs X, Godthelp H, Hand S, Jones A, Nel A, Néraudeau D, Ortega-Blanco J. 2010. Synchrotron X-ray imaging of inclusions in amber. Comptes Rendus Palevol 9(6):361-368.
Speranza M, Wierzchos J, Alonso J, Bettuchi L, Martín-González A, Ascaso C. 2010. Traditional and new microscopy techniques applied to the study of microscopic fungi included in amber. Microscopy: Science, Technology, Application and Education 2:1135-1145.
Tafforeau P, Boistel R, Boller E, Bravin A, Brunet M, Chaimanee Y, Cloetens P, Feist M, Hoszowska J, Jaeger JJ, Kay RF. 2006. Applications of X-ray synchrotron microtomography for non-destructive 3D studies of paleontological specimens. Applied Physics A 83(2):195-202.
Tolhurst T, Barbi M, Tokaryk T. 2015. Effective beam method for element concentrations. J. Synchrotron Rad. 22: 393-399.
430
431
432
433
434
435
436
437
438
439
440
441
442
443
444
445
446
447
448
449
450
451
452
453
454
455
456
457
458
459
460
461
462
463
464
465
466
467
468
469
470
PeerJ Preprints | https://doi.org/10.7287/peerj.preprints.2337v1 | CC BY 4.0 Open Access | rec: 4 Aug 2016, publ: 4 Aug 2016

Van de Kamp T, Rolo S, Baumbach T. 2014. Scanning the past–synchrotron X-ray microtomography of fossil wasps in amber. Entomologie heute 26:151-160.
Weitschat W, Wichard W. 2010. Baltic amber. In: Penney D, ed. Biodiversity of fossils in amber from the major world deposits. Manchester: Siri Scientific Press, 80-115.
Wogelius RA, Manning PL, Barden HE, Edwards NP, Webb SM, Sellers WI, Taylor KG, Larson PL, Dodson P, You H, Da-Qing L. 2011. Trace metals as biomarkers for eumelanin pigment in the fossil record. Science 333(6049):1622-1626.
471
472
473
474
475
476
477
PeerJ Preprints | https://doi.org/10.7287/peerj.preprints.2337v1 | CC BY 4.0 Open Access | rec: 4 Aug 2016, publ: 4 Aug 2016