A nocturnal atmospheric loss of CH2I2 in the remote … · A nocturnal atmospheric loss of CH 2I 2...
12
A nocturnal atmospheric loss of CH 2 I 2 in the remote marine boundary layer Lucy J. Carpenter 1 & Stephen J. Andrews 1 & Richard T. Lidster 1 & Alfonso Saiz-Lopez 2 & Miguel Fernandez-Sanchez 2 & William J. Bloss 3 & Bin Ouyang 4 & Roderic L. Jones 4 Received: 28 April 2015 /Accepted: 25 September 2015 / Published online: 5 October 2015 # The Author(s) 2015. This article is published with open access at Springerlink.com Abstract Ocean emissions of inorganic and organic iodine compounds drive the biogeochem- ical cycle of iodine and produce reactive ozone-destroying iodine radicals that influence the oxidizing capacity of the atmosphere. Di-iodomethane (CH 2 I 2 ) and chloro-iodomethane (CH 2 ICl) are the two most important organic iodine precursors in the marine boundary layer. Ship-borne measurements made during the TORERO (Tropical Ocean tRoposphere Exchange of Reactive halogens and Oxygenated VOC) field campaign in the east tropical Pacific Ocean in January/February 2012 revealed strong diurnal cycles of CH 2 I 2 and CH 2 ICl in air and of CH 2 I 2 in seawater. Both compounds are known to undergo rapid photolysis during the day, but models assume no night-time atmospheric losses. Surprisingly, the diurnal cycle of CH 2 I 2 was lower in amplitude than that of CH 2 ICl, despite its faster photolysis rate. We speculate that night-time loss of CH 2 I 2 occurs due to reaction with NO 3 radicals. Indirect results from a laboratory study under ambient atmospheric boundary layer conditions indicate a k CH2I2+NO3 of ≤4 × 10 −13 cm 3 molecule −1 s −1 ; a previous kinetic study carried out at ≤100 Torr found k CH2I2+NO3 of 4 × 10 −13 cm 3 molecule −1 s −1 . Using the 1-dimensional atmospheric THAMO model driven by sea-air fluxes calculated from the seawater and air measurements (averaging 1.8 +/− 0.8 nmol m −2 d −1 for CH 2 I 2 and 3.7 +/− 0.8 nmol m −2 d −1 for CH 2 ICl), we show that J Atmos Chem (2017) 74:145–156 DOI 10.1007/s10874-015-9320-6 * Lucy J. Carpenter [email protected] 1 Wolfson Atmospheric Chemistry Laboratories, Department of Chemistry, University of York, York YO10 5DD, UK 2 Atmospheric Chemistry and Climate Group, Institute of Physical Chemistry Rocasolano, Spanish National Research Council (CSIC), 28006 Madrid, Spain 3 School of Geography, Earth and Environmental Sciences, University of Birmingham, Birmingham B15 2TT, UK 4 Department of Chemistry, University of Cambridge, Cambridge CB2, 1EW, UK
Transcript of A nocturnal atmospheric loss of CH2I2 in the remote … · A nocturnal atmospheric loss of CH 2I 2...

A nocturnal atmospheric loss of CH2I2 in the remotemarine boundary layer
Lucy J. Carpenter1 & Stephen J. Andrews1 &
Richard T. Lidster1 & Alfonso Saiz-Lopez2 &
Miguel Fernandez-Sanchez2 & William J. Bloss3 &
Bin Ouyang4 & Roderic L. Jones4
Received: 28 April 2015 /Accepted: 25 September 2015 /Published online: 5 October 2015# The Author(s) 2015. This article is published with open access at Springerlink.com
Abstract Ocean emissions of inorganic and organic iodine compounds drive the biogeochem-ical cycle of iodine and produce reactive ozone-destroying iodine radicals that influence theoxidizing capacity of the atmosphere. Di-iodomethane (CH2I2) and chloro-iodomethane(CH2ICl) are the two most important organic iodine precursors in the marine boundary layer.Ship-borne measurements made during the TORERO (Tropical Ocean tRoposphere Exchangeof Reactive halogens and Oxygenated VOC) field campaign in the east tropical Pacific Oceanin January/February 2012 revealed strong diurnal cycles of CH2I2 and CH2ICl in air and ofCH2I2 in seawater. Both compounds are known to undergo rapid photolysis during the day, butmodels assume no night-time atmospheric losses. Surprisingly, the diurnal cycle of CH2I2 waslower in amplitude than that of CH2ICl, despite its faster photolysis rate. We speculate thatnight-time loss of CH2I2 occurs due to reaction with NO3 radicals. Indirect results from alaboratory study under ambient atmospheric boundary layer conditions indicate a kCH2I2+NO3of ≤4 × 10⁻¹³ cm3 molecule−1 s−1; a previous kinetic study carried out at ≤100 Torr foundkCH2I2+NO3 of 4 × 10⁻¹³ cm3 molecule−1 s−1. Using the 1-dimensional atmospheric THAMOmodel driven by sea-air fluxes calculated from the seawater and air measurements (averaging1.8 +/− 0.8 nmol m−2 d−1 for CH2I2 and 3.7 +/− 0.8 nmol m−2 d−1 for CH2ICl), we show that
J Atmos Chem (2017) 74:145–156DOI 10.1007/s10874-015-9320-6
* Lucy J. [email protected]
1 Wolfson Atmospheric Chemistry Laboratories, Department of Chemistry, University of York,York YO10 5DD, UK
2 Atmospheric Chemistry and Climate Group, Institute of Physical Chemistry Rocasolano, SpanishNational Research Council (CSIC), 28006 Madrid, Spain
3 School of Geography, Earth and Environmental Sciences, University of Birmingham,Birmingham B15 2TT, UK
4 Department of Chemistry, University of Cambridge, Cambridge CB2, 1EW, UK
the model overestimates night-time CH2I2 by >60 % but reaches good agreement withthe measurements when the CH2I2 + NO3 reaction is included at 2–4 × 10⁻¹³ cm3
molecule−1 s−1. We conclude that the reaction has a significant effect on CH2I2 andhelps reconcile observed and modeled concentrations. We recommend further directmeasurements of this reaction under atmospheric conditions, including of productbranching ratios.
Keywords di-iodomethane . NO3 radical . Atmosphere . Ocean . Iodine
1 Introduction
The potential for tropospheric ozone destruction by iodine was recognized manydecades ago (Chameides and Davis 1980) and confirmed later by measurements ofthe iodine oxide radical (IO) (Alicke et al. 1999; Read et al. 2008; Mahajan et al.2010a, b; Gómez Martín et al. 2013; Großmann et al. 2013; Dix et al. 2013; Prados-Roman et al. 2015). A ubiquitous global marine boundary layer (MBL) background ofaround 0.5–1 pptv IO has been established by these measurements. The presence ofIO establishes that active atmospheric iodine chemistry is occurring, driven by pho-tochemical breakdown of iodine precursors. Iodine is a significant ozone-depletingagent in the MBL, being responsible for 20–30 % of the total ozone loss in thatregion (Saiz-Lopez et al. 2014; Prados-Roman et al. 2015; Sherwen et al. 2015).Calculations from global chemistry transport models indicate that globally iodineprovides an odd oxygen (Ox) loss of 12–16 % of the total, at around ~720 Tgyr.−1 (Saiz-Lopez et al. 2014; Sherwen et al. 2015).
Oceanic emissions of the inorganic gases I2 and HOI, produced from ozonolysis ofsurface iodide (Carpenter et al. 2013; MacDonald et al. 2014), are believed tocontribute ~2–2.5 Tg I yr.−1, around 80 % of global iodine emissions (Sherwenet al. 2015; Prados-Roman et al. 2015). However, in certain regions - including athigh latitudes where surface ocean iodide levels are low, and in locations where windspeeds are high and surface ozone (O3(g)) mixing ratios are relatively low - organicgases may contribute 50 % or more of the iodine source (Prados-Roman et al. 2015).There are few oceanic flux measurements of CH2I2 and CH2ICl, but available datasuggest that they contribute ~0.11 and 0.17 Tg I yr.−1 to the global atmosphere (Joneset al. 2010) similar in total to methyl iodide (CH3I) emissions (Carpenter et al. 2014).
Both CH2I2 and CH2ICl are known to have short photolysis lifetimes in theatmosphere of ~5 min and ~1 h at midday in mid-latitudes, respectively (Rattiganet al. 1997; Roehl et al. 1997; Mössinger et al. 1998), leading to strong diurnal cycles(Carpenter et al. 1999; Jones et al. 2010). Photolysis is assumed to be the sole driverof atmospheric loss of these compounds, and in the presence of chloride ions likelydominates aqueous loss also (Jones and Carpenter 2005; Martino et al. 2005).Laboratory determination of the photolysis rates in CH2I2 and CH2ICl in seawaterindicate aqueous lifetimes at midday in mid- latitudes of 9–12 min for CH2I2 and 9–13 h for CH2ICl (Jones and Carpenter 2005; Martino et al. 2005).
So far, the possibility of night-time losses of the di-halomethanes remains unexplored interms of analysis of field data and atmospheric modeling. Nakano et al. (2006) performed akinetic study of the atmospheric reaction of NO3 with CH2I2 (reaction 1) and determined a rate
146 J Atmos Chem (2017) 74:145–156
constant of (4.0 ± 1.2) × 10−13 cm3 molecule−1 s−1. This would result in a nocturnal lifetime of~3 h for CH2I2 in the clean MBL.
NO3 þ CH2I2→Products ð1Þ
However this study was carried out at low pressure (25–100 Torr of N2 diluent)and there appear to be no corroborating studies in the literature.
Here we report seawater and air measurements and calculated ocean emissions ofCH2I2 and CH2ICl from the eastern tropical Pacific Ocean. We focus on a 4-dayperiod of near constant sea surface temperatures, chlorophyll a levels, and windspeeds, whilst sampling water from the North Equatorial Current. Measurements arecompared to the 1D Tropospheric Halogen Chemistry Model (THAMO) (Saiz-Lopezet al. 2008) to test understanding of the atmospheric losses of CH2I2 and CH2ICl. Wealso infer a range of possible values for kCH2I2+NO3 from kinetic results obtainedduring a laboratory study of the reaction of the Criegee intermediate CH2OO withNO2¸which are the first data (to our knowledge) for this reaction obtained underambient atmospheric boundary layer conditions (Ouyang et al. 2013).
2 Methods
2.1 Cruise track and shipboard measurements
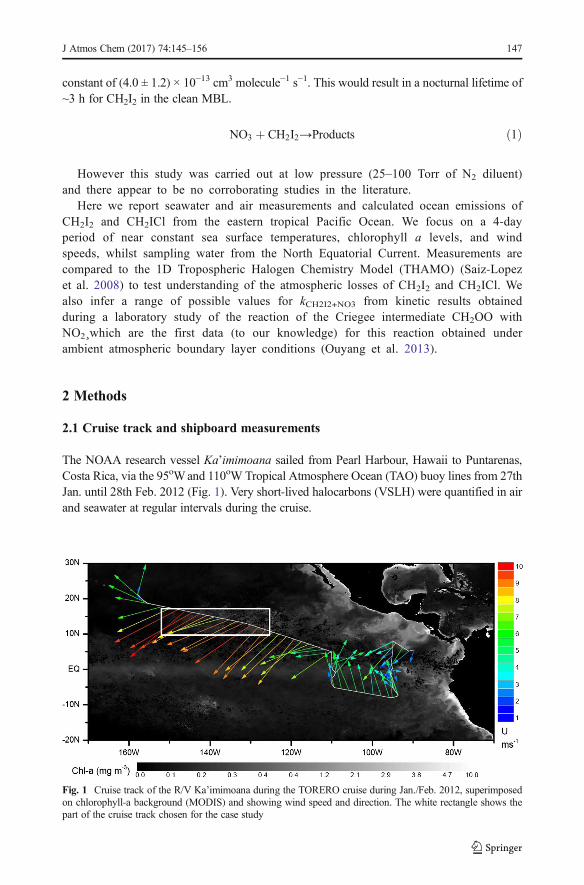
The NOAA research vessel Ka’imimoana sailed from Pearl Harbour, Hawaii to Puntarenas,Costa Rica, via the 95oWand 110oW Tropical Atmosphere Ocean (TAO) buoy lines from 27thJan. until 28th Feb. 2012 (Fig. 1). Very short-lived halocarbons (VSLH) were quantified in airand seawater at regular intervals during the cruise.
Fig. 1 Cruise track of the R/V Ka’imimoana during the TORERO cruise during Jan./Feb. 2012, superimposedon chlorophyll-a background (MODIS) and showing wind speed and direction. The white rectangle shows thepart of the cruise track chosen for the case study
J Atmos Chem (2017) 74:145–156 147

2.1.1 Halocarbon measurements
Air was sampled from the top of the 10 m bow tower through a 60 m sampling line (1/2″ PFA,Swagelok). A diaphragm pump (KNF, NO35.1.2AN.18) was used to pull ~30 L min−1 downthe line. At 1 m before the diaphragm pump, a T-union connected approximately 50 cm of 1/4″heated instrument grade stainless steel line (Restek) to an inverted metal bellows pump (SeniorAerospace MB-158) which provided 10 psi of positive pressure to the instrument via ~1.5 m of1/8″ heated instrument grade stainless steel tubing with a pressure relief valve maintainingflow and draining any water whilst the instrument was not sampling. An ozone analyser(Thermo Scientific Model 49i) drawing 3 L min−1 was also connected downstream of themetal bellows pump. Water was removed from the sample stream using a Nafion drier(Permapure, MD-050-72S-2) with a nitrogen counter current.
The absence of any line losses of VSLH using 100 m of 1/2″ PFA sampling linewas verified in laboratory tests. A 35 L electropolished cylinder (Essex Cyrogenics)was filled with ambient air at 60 bar using a clean, high-pressure compressor (RIXSA-6). The cylinder air was (1) introduced directly into the instrument, using apressure regulator and (2) used to over-flow the inlet of the pumped sampling systemusing 100 m of PFA line. This was performed at an open T-union so as not toinfluence the pressure in the sample line. The results of multiple analyses of airintroduced directly and through the pumped sample line were compared and showedno significant losses (deviations less than the instrument reproducibility) for all of thehalocarbons measured.
Calibrations were run daily using 1 L of a National Oceanic and AtmosphericAdministration (NOAA) VSLH standard (SX-3570). All analytes in this standard weretested to be stable over 4 years by comparison with subsequently prepared standards,SX-3576 and SX-3581 at 2 and 4 years, respectively. In order to correct for short-term sensitivity changes between calibrations, atmospheric CCl4 was used as aninternal standard. The air samples (1 L at 100 mL min−1), calibration and zero(nitrogen, n6.0) gas streams were selected (Markes, CIA8) and pre-concentrated ona cooled absorbent trap at −30 °C (Markes, Unity2). Samples were desorbed at300 °C onto a gas chromatograph (GC, Agilent 7890) and separated on a capillarycolumn (Restek, RTX502.2, 30 m, 0.25 mm ID, 1.25 μm) using an oven temperatureramp (40–250 °C, 3 min hold, 20 °C min−1 ramp). Eluents were ionized usingelectron ionization and analysed by an Agilent 5975C mass spectrometer (MS).CH2ICl and CH2I2 were measured using m/z 176/178 and 268/254 as quantification/qualification ions, respectively.
Surface seawater was sampled from the ship’s seawater inlet, located approx. 2–4 m (depending on sea-state) below the waterline, every 55 min (as well as at variousdepths from conductivity, temperature, depth (CTD) casts at specific points during thevoyage, which are not discussed here). The seawater was pumped through the bow ofthe ship and through a vortex de-bubbler (Seabird) to remove any air bubbles, at aflow of around 10 L min−1 through ½^ PFA tubing. A peristaltic pump was used todivert a portion of the water to an automated purge and trap (AutoP&T) system(Andrews et al. 2015). Briefly, the AutoP&T comprises a heated glass purge vesselautomatically filled and emptied using a series of valves. A fixed sample volume(20 mL) was filtered (0.45 μm, PTFE filter) and de-gassed at 50 °C using 1 L of zerograde nitrogen at 50 mL min−1. Analysis was carried out using a second GC-MS with
148 J Atmos Chem (2017) 74:145–156

the same set-up as the air instrument. Similarly to the air measurements, atmosphericCCl4 was used to correct for short-term sensitivity changes between calibrations, byrapid sampling of 500 mL of air between each water sample.
2.1.2 Ozone measurements
Atmospheric ozone concentrations were measured throughout the cruise using aThermo Scientific Model 49i Ozone Analyzer. The ozone analyzer was connected tothe main air sampling line just downstream of the tee connecting the metal bellowspump.
2.2 Sea-air flux determination
Fluxes of VSLH across the ocean-atmosphere interface were calculated from the seawater-airconcentration gradients using the two-layer model (Liss and Slater 1974);
F ¼ kT Cw−Cg=H� � ð2Þ
and
l=kT ¼ 1=kw þ 1=Hka ð3Þwhere Cw and Cg are the respective bulk water and gaseous concentrations, H is the dimen-sionless gas- over-liquid form of the Henry’s law coefficient and kT, kw and ka are the total,liquid and air mass transfer coefficients, respectively. We use the Nightingale et al. (2000)parameterization for kw, and for ka the parameterization recommended by Johnson (2010). Purewater values of H from the compilation of Sander (1999) were corrected for salinity using thescheme of Johnson (2010).
2.3 THAMO model
The Tropospheric Halogen Chemistry model (THAMO) is a one-dimensional chemis-try transport model with 200 stacked boxes at a vertical resolution of 5 m and a totalheight of 1 km (see Saiz-Lopez et al. 2008). The lowest level is the ocean surface,where gas phase deposition and upward flux can occur. Deposition to a specifiedaerosol surface area occurs with uptake coefficients taken from the recommendationsof Sander et al. (2006) and Atkinson et al. (2000). The chemical scheme used for thisstudy is from Saiz-Lopez et al. (2008) and is updated according to Mahajan et al.(2010a, b).
The modeled data discussed herein are the THAMO results at a height of 10 mabove sea level (asl). The injection of CH2I2 and CH2ICl in the model is constrainedby the fluxes measured in the field campaign. Photolysis rate constants for CH2I2 andCH2ICl were calculated by an explicit two-stream radiation scheme, which calculatesthe solar irradiance as a function of altitude, wavelength and solar zenith angle. Forthese simulations we assumed clear sky conditions. The modelled loss due to drydeposition of these species to the ocean is about 2 %. Measured O3 concentrationsand assumed ranges of oceanic NO2 mixing ratios (see section 3.3) were used tocalculate NO3 radical concentrations.
J Atmos Chem (2017) 74:145–156 149
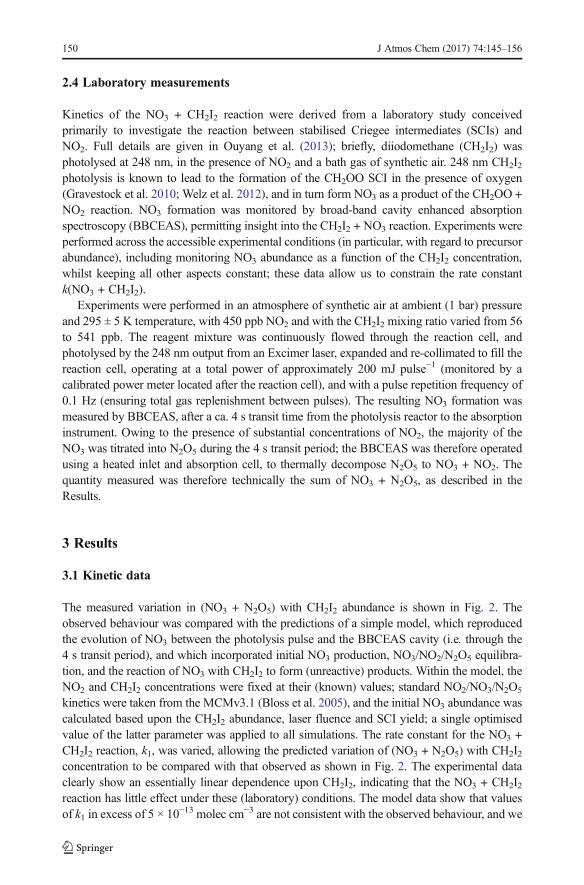
2.4 Laboratory measurements
Kinetics of the NO3 + CH2I2 reaction were derived from a laboratory study conceivedprimarily to investigate the reaction between stabilised Criegee intermediates (SCIs) andNO2. Full details are given in Ouyang et al. (2013); briefly, diiodomethane (CH2I2) wasphotolysed at 248 nm, in the presence of NO2 and a bath gas of synthetic air. 248 nm CH2I2photolysis is known to lead to the formation of the CH2OO SCI in the presence of oxygen(Gravestock et al. 2010; Welz et al. 2012), and in turn form NO3 as a product of the CH2OO +NO2 reaction. NO3 formation was monitored by broad-band cavity enhanced absorptionspectroscopy (BBCEAS), permitting insight into the CH2I2 + NO3 reaction. Experiments wereperformed across the accessible experimental conditions (in particular, with regard to precursorabundance), including monitoring NO3 abundance as a function of the CH2I2 concentration,whilst keeping all other aspects constant; these data allow us to constrain the rate constantk(NO3 + CH2I2).
Experiments were performed in an atmosphere of synthetic air at ambient (1 bar) pressureand 295 ± 5 K temperature, with 450 ppb NO2 and with the CH2I2 mixing ratio varied from 56to 541 ppb. The reagent mixture was continuously flowed through the reaction cell, andphotolysed by the 248 nm output from an Excimer laser, expanded and re-collimated to fill thereaction cell, operating at a total power of approximately 200 mJ pulse−1 (monitored by acalibrated power meter located after the reaction cell), and with a pulse repetition frequency of0.1 Hz (ensuring total gas replenishment between pulses). The resulting NO3 formation wasmeasured by BBCEAS, after a ca. 4 s transit time from the photolysis reactor to the absorptioninstrument. Owing to the presence of substantial concentrations of NO2, the majority of theNO3 was titrated into N2O5 during the 4 s transit period; the BBCEAS was therefore operatedusing a heated inlet and absorption cell, to thermally decompose N2O5 to NO3 + NO2. Thequantity measured was therefore technically the sum of NO3 + N2O5, as described in theResults.
3 Results
3.1 Kinetic data
The measured variation in (NO3 + N2O5) with CH2I2 abundance is shown in Fig. 2. Theobserved behaviour was compared with the predictions of a simple model, which reproducedthe evolution of NO3 between the photolysis pulse and the BBCEAS cavity (i.e. through the4 s transit period), and which incorporated initial NO3 production, NO3/NO2/N2O5 equilibra-tion, and the reaction of NO3 with CH2I2 to form (unreactive) products. Within the model, theNO2 and CH2I2 concentrations were fixed at their (known) values; standard NO2/NO3/N2O5
kinetics were taken from the MCMv3.1 (Bloss et al. 2005), and the initial NO3 abundance wascalculated based upon the CH2I2 abundance, laser fluence and SCI yield; a single optimisedvalue of the latter parameter was applied to all simulations. The rate constant for the NO3 +CH2I2 reaction, k1, was varied, allowing the predicted variation of (NO3 + N2O5) with CH2I2concentration to be compared with that observed as shown in Fig. 2. The experimental dataclearly show an essentially linear dependence upon CH2I2, indicating that the NO3 + CH2I2reaction has little effect under these (laboratory) conditions. The model data show that valuesof k1 in excess of 5 × 10⁻¹³ molec cm−3 are not consistent with the observed behaviour, and we
150 J Atmos Chem (2017) 74:145–156

derive an upper limit of k1 ≤ 4 × 10⁻¹³ molec cm−3, at 295 K and 1 bar total pressure (i.e.nominal ambient MBL conditions).
3.2 Field data
We choose as a case study 4 days of measurements during 29th Jan. – 2nd Feb. 2012 whilsttransiting the North Equatorial Current in a southeasterly direction (Fig. 1). This periodencountered stable surface chlorophyll a concentrations (0.1–0.2 μg m−3), sea surface tem-peratures (SSTs) (24.3 ± 0.3 °C), wind speeds (8.5 ± 0.8 ms−1) and wind direction (Fig. 1), andshowed similar daily patterns of CH2I2 and CH2ICl atmospheric and seawater concentrations(Fig. 3).
Both gases displayed notable diurnal cycles in the atmosphere with mixing ratiossteadily increasing during the night and rapidly decreasing at sunrise. Mean night-time/early morning maxima and day-time minima were (max: 0.047 +/− 0.01) pptvand (min: 0.023 +/− 0.004) pptv for CH2I2 and (max: 0.17 +/− 0.03) pptv and (min:0.03 +/− 0.01) pptv for CH2ICl. Thus, the ratio of night-time maxima to day-timeminima was more than a factor of two higher for CH2ICl mixing ratios (average of5.3) than for CH2I2 (average of 2.0). This is surprising since the atmosphericphotolysis lifetime of CH2I2 is much shorter than that of CH2ICl, as discussed inthe Introduction. Seawater concentrations also showed diurnal cycles in CH2I2, asexpected due to its fast photochemical decay in seawater (Jones and Carpenter 2005).Fluxes averaged 1.8 +/− 0.8 nmol m−2 d- 1 for CH2I2 and 3.7 +/− 0.8 nmol m−2 d- 1
for CH2ICl for the case study period, with night-time fluxes around 2–3 times higherthan day-time for CH2I2 (but only 15 % higher and within the data variability forCH2ICl). Thus, in the absence of any night-time loss, nocturnal CH2I2 mixing ratiosshould be higher than expected given an assumption of a constant sea-air flux,
0
200
400
600
800
0 100 200 300 400 500 600 700
(NO
3 +
N2O
5) /p
pt
CH2I
2 / ppb
No Reaction
5.00E-14
1e-13
2e-13
5e-13
Experiment
Fig. 2 Measured (NO3 + N2O5) mixing ratio (filled grey circles, with ±2 σ error bars, reflecting combinedprecision and systematic (uncertainties in the NO3 absorption spectrum & fitting) components), compared withmodel predictions of the variation in (NO3 + N2O5) (coloured lines), as a function of CH2I2, for different valuesof k1 (NO3 + CH2I2) in units of cm3 molecule−1 s−1
J Atmos Chem (2017) 74:145–156 151
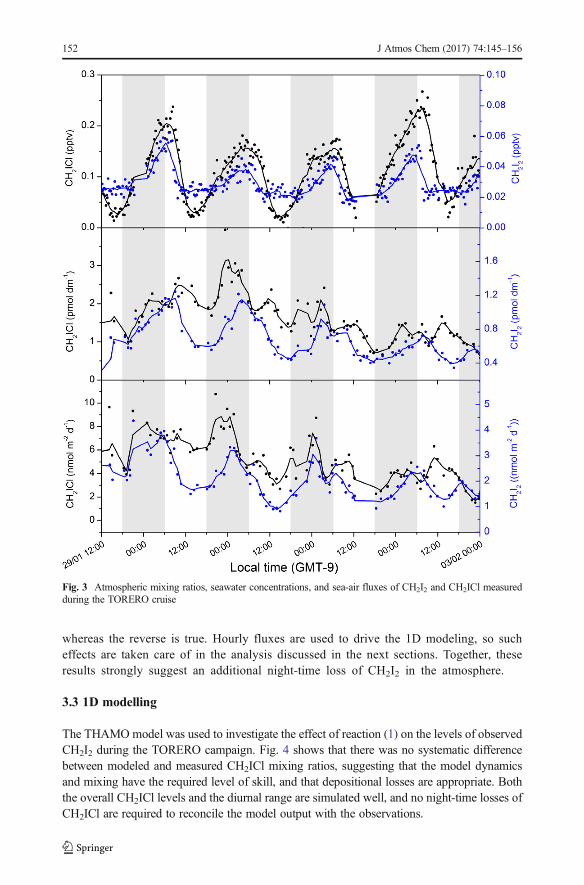
whereas the reverse is true. Hourly fluxes are used to drive the 1D modeling, so sucheffects are taken care of in the analysis discussed in the next sections. Together, theseresults strongly suggest an additional night-time loss of CH2I2 in the atmosphere.
3.3 1D modelling
The THAMOmodel was used to investigate the effect of reaction (1) on the levels of observedCH2I2 during the TORERO campaign. Fig. 4 shows that there was no systematic differencebetween modeled and measured CH2ICl mixing ratios, suggesting that the model dynamicsand mixing have the required level of skill, and that depositional losses are appropriate. Boththe overall CH2ICl levels and the diurnal range are simulated well, and no night-time losses ofCH2ICl are required to reconcile the model output with the observations.
Fig. 3 Atmospheric mixing ratios, seawater concentrations, and sea-air fluxes of CH2I2 and CH2ICl measuredduring the TORERO cruise
152 J Atmos Chem (2017) 74:145–156
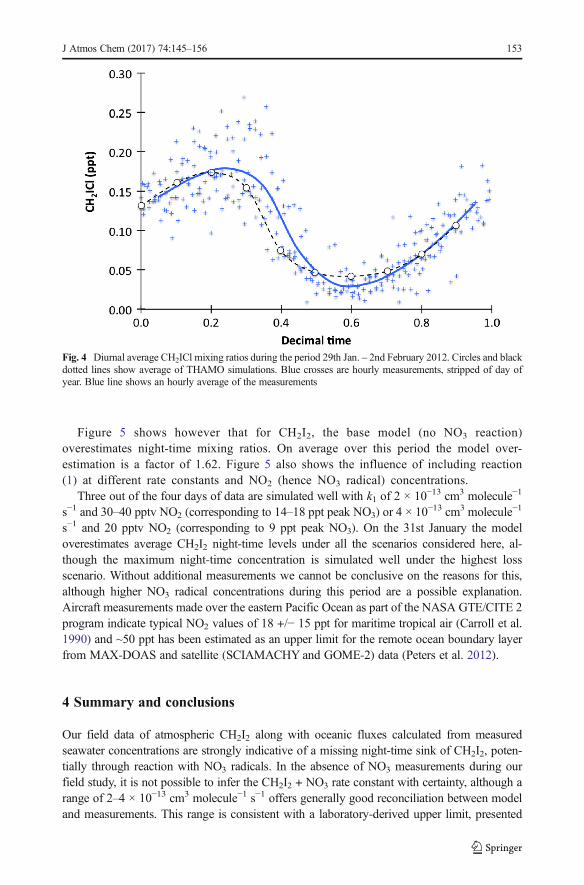
Figure 5 shows however that for CH2I2, the base model (no NO3 reaction)overestimates night-time mixing ratios. On average over this period the model over-estimation is a factor of 1.62. Figure 5 also shows the influence of including reaction(1) at different rate constants and NO2 (hence NO3 radical) concentrations.
Three out of the four days of data are simulated well with k1 of 2 × 10⁻¹³ cm3 molecule−1
s−1 and 30–40 pptv NO2 (corresponding to 14–18 ppt peak NO3) or 4 × 10⁻¹³ cm3 molecule−1
s−1 and 20 pptv NO2 (corresponding to 9 ppt peak NO3). On the 31st January the modeloverestimates average CH2I2 night-time levels under all the scenarios considered here, al-though the maximum night-time concentration is simulated well under the highest lossscenario. Without additional measurements we cannot be conclusive on the reasons for this,although higher NO3 radical concentrations during this period are a possible explanation.Aircraft measurements made over the eastern Pacific Ocean as part of the NASA GTE/CITE 2program indicate typical NO2 values of 18 +/− 15 ppt for maritime tropical air (Carroll et al.1990) and ~50 ppt has been estimated as an upper limit for the remote ocean boundary layerfrom MAX-DOAS and satellite (SCIAMACHY and GOME-2) data (Peters et al. 2012).
4 Summary and conclusions
Our field data of atmospheric CH2I2 along with oceanic fluxes calculated from measuredseawater concentrations are strongly indicative of a missing night-time sink of CH2I2, poten-tially through reaction with NO3 radicals. In the absence of NO3 measurements during ourfield study, it is not possible to infer the CH2I2 + NO3 rate constant with certainty, although arange of 2–4 × 10⁻¹³ cm3 molecule−1 s−1 offers generally good reconciliation between modeland measurements. This range is consistent with a laboratory-derived upper limit, presented
Fig. 4 Diurnal average CH2ICl mixing ratios during the period 29th Jan. – 2nd February 2012. Circles and blackdotted lines show average of THAMO simulations. Blue crosses are hourly measurements, stripped of day ofyear. Blue line shows an hourly average of the measurements
J Atmos Chem (2017) 74:145–156 153

herein, and previous direct measurements made at low pressure. Given the importance of thisreaction for understanding the atmospheric behavior of CH2I2, we recommend furtherlaboratory measurements of the rate constant and the products of the reaction. Nakano et al.(2006) suggest that the possible products may be the compounds produced from H- transferand I-transfer reactions:
NO3 þ CH2I2→HNO3 þ CHI2 ð1aÞ
NO3 þ CH2I2→IONO2 þ CH2I ð1bÞThe available thermodynamic data suggest that channel 1a is favourable but 1b is endo-
thermic (Atkinson et al. 2004; Marshall et al. 2005; Sander et al. 2006), indicating that thereaction NO3 + CH2I2 represents a loss of NOx to HNO3. Further reactions of CHI2 and CH2Iare uncertain, although in both cases I atoms are eventually produced which will form IO in thepresence of O3. Oxidation of CH2I (by O2) leads to the Criegee intermediate CH2OO alongwith other products (Gravestock et al. 2010; Stone et al., 2013 and references therein). Inlocations with high CH2I2 emissions and sufficient NO3, such as polluted coastlines, the
Fig. 5 The influence of different k1 and NO2 mixing ratios on modelled CH2I2, compared with measurements.Lines are model results, purple triangles indicate CH2I2 measurements. Upper panel: 20 ppt NO2 at different k1(red - no reaction, magenta – k1 = 5 × 10⁻¹⁴, green - k1 = 2 × 10⁻¹³, dark blue - k1 = 4 × 10⁻¹³ cm3 molecule−1
s−1); Middle panel: 30 ppt NO2 at different k1 (lines as before); Lower panel: varying NO2 concentrations atk1 = 2 × 10⁻¹³ cm3 molecule−1 s−1 (solid line - NO2 = 20 ppt, dashed line - NO2 = 30 ppt; dotted line -NO2 = 40 ppt)
154 J Atmos Chem (2017) 74:145–156

reaction may result in production of nighttime IO, or at least in modification of the diurnalprofile of IO.
Acknowledgments LJC acknowledges NERC (NE/J00619X/1) and the National Centre for AtmosphericScience (NCAS) for funding. The laboratory work was supported by the NERC React-SCI (NE/K005448/1)and RONOCO (NE/F005466/1) grants.
Open Access This article is distributed under the terms of the Creative Commons Attribution 4.0International License (http://creativecommons.org/licenses/by/4.0/), which permits unrestricted use, distribu-tion, and reproduction in any medium, provided you give appropriate credit to the original author(s) and thesource, provide a link to the Creative Commons license, and indicate if changes were made.
References
Alicke B., Hebestreit K., Stutz J., Platt U.: Iodine oxide in the marine boundary layer. Nature. 397, 572–573(1999)
Andrews, SJ, Hackenberg, SC, Carpenter, LJ.: Technical note: a fully automated purge and trap GC-MS systemfor quantification of volatile organic compound (VOC) fluxes between the ocean and atmosphere. OceanSci. 11: pp. 1–9 (2015). doi:10.5194/os-11-1-2015
Atkinson R., Baulch D.L., Cox R.A., Crowley J.N., Hampson J., Hynes R.G., Jenkin M.E., Kerr J.A., Rossi M.J.,Troe J.: Summary of evaluated kinetic and photochemical data for atmospheric chemistry. IUPAC. J. Phys.Chem. Ref. Data. 29, 167–266 (2000)
Atkinson R., Baulch D.L., Cox R.A., Crowley J.N., Hampson J., Hynes R.G., Jenkin M.E., Kerr J.A., Rossi M.J.,Troe J.: Evaluated kinetic and photochemical data for atmospheric chemistry: volume I - gas phase reactionsof ox, HOx, NOx and SOx species. Atmos. Chem. Phys. 4, 1461–1738 (2004)
Bloss, C, Wagner, V, Jenkin, ME, Wirtz, K, Wenger, J, Bloss, WJ, Lee, JD. Heard, DE, and Pilling MJ (2005)Development of a detailed chemical mechanism (MCMv3.1) for the atmospheric oxidation of aromatichydrocarbons. Atmos. Chem. Phys. 5: pp. 641–664.
Carpenter L.J., Sturges W.T., Penkett S.A., Liss P.S., Alicke B., Hebestreit K., Platt U.: Short-lived alkyl iodidesand bromides at mace head, Ireland: links to biogenic sources and halogen oxide production. J. Geophys.Res. 104(D1), 1679–1689 (1999)
Carpenter L.J., MacDonald S.M., Shaw M.D., Kumar R., Saunders R.W., Parthipan R., Wilson J., Plane J.M.C.:Atmospheric iodine levels influenced by sea surface emissions of inorganic iodine. Nat. Geosci. 6, 108–111(2013). doi:10.1038/ngeo1687
Carpenter, LJ, Reimann, S, Burkholder, JB, Clerbaux, C, Hall, BD, Hossaini, R, Laube, JC, Yvon-Lewis, SA.:Update on Ozone-Depleting Substances (ODSs) and Other Gases of Interest to the Montreal Protocol:Chapter 1 in Scientific Assessment of Ozone Depletion: 2014, Global ozone research and monitoring project– report no. 55, World Meteorological Organization, Geneva (2014)
Carroll M.A. et al.: Aircraft measurements of NOx over the eastern Pacific and continental United States andimplications for ozone production. J. Geophys. Res. 95, 10,205–10,233 (1990)
Chameides W.L., Davis D.: Iodine: its possible role in tropospheric photochemistry. J. Geophys. Res. 85, 7383–7398 (1980)
Dix B., Baidar S., Bresch J.F., Hall S.R., Schmidt K.S., Wang S., Volkamer R.: Detection of iodine monoxide inthe tropical free troposphere. P. Natl. Acad. Sci. USA. 110, 2035–2040 (2013). doi:10.1073/pnas.1212386110
GómezMartín J.C., Mahajan A.S., Hay T.D., Prados-Román C., Ordóñez C., MacDonald S.M., Plane J.M.C., SorribasM.,GilM., ParedesMora J.F., AgamaReyesM.V.,OramD.E., LeedhamE., Saiz-LopezA.: Iodine chemistry in theeastern Pacific marine boundary layer. J. Geophys. Res.-Atmos. 118, 887–904 (2013). doi:10.1002/jgrd.50132
Gravestock T.J., Blitz M.A., Bloss W.J., Heard D.E.: A multidimensional study of the reaction CH2I + O2:products and atmospheric implications. Chem. Phys. Chem. 11, 3928–3941 (2010)
Großmann K., Frieß U., Peters E., Wittrock F., Lampel J., Yilmaz S., Tschritter J., Sommariva R., von Glasow R.,Quack B., Krüger K., Pfeilsticker K., Platt U.: Iodine monoxide in the western Pacific marine boundarylayer. Atmos. Chem. Phys. 13, 3363–3378 (2013). doi:10.5194/acp-13-3363-2013
Johnson M.T.: A numerical scheme to calculate temperature and salinity dependent air-water transfer velocitiesfor any gas. Ocean Sci. 6, 913–932 (2010)
J Atmos Chem (2017) 74:145–156 155
Jones C.E., Carpenter L.J.: Solar photolysis of CH2I2, CH2ICl, and CH2IBr in water, saltwater, and seawater.Environ. Sci. Technol. 39, 6130–6137 (2005)
Jones, CE, Hornsby, KE, Sommariva, R, Dunk, RM, von Glasow, R, McFiggans, G, Carpenter, LJ.: Quantifyingthe contribution of marine organic gases to atmospheric iodine. Geophys. Res. Lett. 37: L18804 (2010).
Liss P.S., Slater P.G.: Flux of gases across the air-sea interface. Nature. 247, 181–184 (1974)MacDonald S.M., Gómez Martín J.C., Chance R., Warriner S., Saiz-Lopez A., Carpenter L.J., Plane J.M.C.: A
laboratory characterisation of inorganic iodine emissions from the sea surface: dependence on oceanicvariables and parameterisation for global modeling. Atmos. Chem. Phys. 14, 5841–5852 (2014)
Mahajan A.S., Plane J.M.C., Oetjen H., Mendes L., Saunders R.W., Saiz-Lopez A., Jones C.E., Carpenter L.J.,McFiggans G.B.: Measurement and modelling of tropospheric reactive halogen species over the tropicalAtlantic ocean. Atmos. Chem. Phys. 10, 4611–4624 (2010a). doi:10.5194/acp-10-4611-2010
Mahajan, AS, Shaw, M, Oetjen, H, Hornsby, KE, Carpenter, LJ, Kaleschke, L, Tian-Kunze, X, Lee, JD, Moller,SJ, Edwards, P, Commane, R, Ingham, T, Heard, DE, Plane, JMC.: Evidence of reactive iodine chemistry inthe Arctic boundary layer. J. Geophys. Res., 115: D20303, (2010b). doi: 10.1029/2009JD013665
Marshall P., Srinivas G.N., Schwartz M.: A computational study of the thermochemistry of bromine- and iodine-containing methanes and methyl radicals. J. Phys. Chem. A. 109, 6371–6379 (2005)
Martino M., Liss P.S., Plane J.M.C.: The photolysis of dihalomethanes in surface seawater. Environ. Sci.Technol. 39(18), 7097–7101 (2005)
Mössinger J., Shallcross D.E., Cox R.A.: UV–VIS absorption cross-sections and atmospheric lifetimes ofCH2Br2, CH2I2 and CH2BrI. J. Chem. Soc. Faraday Trans. 94, 1391–1396 (1998)
NakanoY., Ukeguchi H., Ishiwata T.: Rate constant of the reaction of NO3with CH2I2 measuredwith use of cavityring-down spectroscopy. Chemical Physics Letters. 430, 235–239 (2006). doi:10.1016/j.cplett.2006.09.002
Nightingale P.D. et al.: In situ evaluation of air-sea gas exchange parameterizations using novel conservative andvolatile tracers. Glob. Biogeochem. Cycles. 14, 373–387 (2000)
Ouyang B., McLeodM.W., Jones R.L., BlossW.J.: NO3 radical production from the reaction between the criegeeintermediate CH2OO and NO2. Phys. Chem. Chem. Phys. 15, 17070–17075 (2013)
Peters E., Wittrock F., Großmann K., Frieß U., Richter A., Burrows J.P.: Formaldehyde and nitrogen dioxide overthe remote western Pacific Ocean: SCIAMACHY and GOME-2 validation using ship-based MAX-DOASobservations. Atmos. Chem. Phys. 12, 11179–11197 (2012). doi:10.5194/acp-12-11179-2012
Prados-Roman C., Cuevas C.A., Hay T., Fernandez R.P., Mahajan A.S., Royer S.J., Galí M., Simó R., Dachs J.,Großmann K., Kinnison D.E., Lamarque J.F., Saiz-Lopez A.: Iodine oxide in the global marine boundarylayer. Atmos. Chem. Phys. 15, 583–593 (2015)
Rattigan O.V., Shallcross D.E., Cox R.A.: UVabsorption cross-sections and atmospheric photolysis rates of CF3I,CH3I, C2H5I and CH2ICl. J. Chem. Soc. Faraday Trans. 93, 2839–2846 (1997)
Read K.A., Mahajan A.S., Carpenter L.J., Evans M.J., Faria B.V.E., Heard D.E., Hopkins J.R., Lee J.D., MollerS., Lewis A.C., Mendes L., McQuaid J.B., Oetjen H., Saiz-Lopez A., Pilling M.J., Plane J.M.C.: Extensivehalogen-mediated ozone destruction over the tropical Atlantic ocean. Nature. 453(7199), 1232–1235 (2008)
Roehl C.M., Burkholder J.B., Moortgat G.K., Ravishankara A.R., Crutzen P.J.: Temperature dependence of UVabsorption cross sections and atmospheric implications of several alkyl iodides. J. Geophys. Res. 102,12819–12829 (1997)
Saiz-Lopez A., Plane J.M.C., Mahajan A.S., Anderson P.S., Bauguitte S.J.B., Jones A.E., Roscoe H.K., SalmonR.A., Bloss W.J., Lee J.D., Heard D.E.: On the vertical distribution of boundary layer halogens over coastalAntarctica: implications for O3, HOx, NOx and the Hg lifetime. Atmos. Chem. Phys. 8, 887–900 (2008). doi:10.5194/acp-8-887-2008
Saiz-Lopez A., Fernandez R.P., Ordóñez C., Kinnison D.E., Gómez Martín J.C., Lamarque J.-F., Tilmes S.:Iodine chemistry in the troposphere and its effect on ozone. Atmos. Chem. Phys. 14, 13119–13143 (2014)
Sander, R.: Compilation of Henry’s law constants for inorganic and organic species of potential importance inenvironmental chemistry (version 3), http://www.mpchmainz.mpg.de/~sander/re/henry.html. (1999)
Sander S.P., Friedl R.R., Ravishankara A.R., Golden D.M., Kolb C.E., Kurylo M.J., Huie R.E., Orkin V.L.,Molina M.J., Moortgart G.K., Finlayson-Pitts B.J.: Chemical kinetics and photochemical data for use inatmospheric studies, evaluation number 14. Administration, Jet Propulsion Laboratory and NationalAeronautics and Space (2006)
Sherwen T., Evans M.J., Carpenter L. J., Andrews S. J., Lidster R. T., Dix B., Koenig T. K. , Volkamer R., Saiz-Lopez A., Prados-Roman C., Mahajan A. S. , Ordóñez C., Iodine's impact on tropospheric oxidants: a globalmodel study in GEOS-Chem, Atmos. Chem. Phys. Discuss. 15, 20957–21023 (2015)
Stone D., Blitz M., Daubney L., Ingham T., Seakins P.: CH2OO Criegee biradical yields following photolysis ofCH2I2 in O2. Phys. Chem. Chem. Phys. 15, 19119–19124 (2013)
Welz O., Savee J.D., Osborn D.L., Vasu S.S., Percival C.J., Shallcross D.E., Taatjes C.A.: Direct Kinetic Measurementsof Criegee Intermediate (CH2OO) Formed by Reaction of CH2I with O2. Science. 335, 204 (2012)
156 J Atmos Chem (2017) 74:145–156