A new technique for building maps of large scientific...
17
Jointly published by AkadØmiai Kiad, Budapest Scientometrics, and Kluwer Academic Publishers, Dordrecht Vol. 61, No. 1 (2004) 129145 Received April 23, 2004 Address for correspondence: FLIX MOYA-ANEGN University of Granada, Library and Information Science Faculty Campus Cartuja, 18071 Granada, Spain E-mail: [email protected] 01389130/2004/US $ 20.00 Copyright ' 2004 AkadØmiai Kiad, Budapest All rights reserved A new technique for building maps of large scientific domains based on the cocitation of classes and categories FLIX MOYA-ANEGN, BENJAM˝N VARGAS-QUESADA, VICTOR HERRERO-SOLANA, ZAIDA CHINCHILLA-RODR˝GUEZ, ELENA CORERA-`LVAREZ, FRANCISCO J. MUNOZ-FERN`NDEZ University of Granada, Library and Information Science Faculty, Granada (Spain) Our objective is the generation of schematic visualizations as interfaces for scientific domain analysis. We propose a new technique that uses thematic classification (classes and categories) as entities of cocitation and units of measure, and demonstrate the viability of this methodology through the representation and analysis of a domain of great dimensions. The main features of the maps obtained are discussed, and proposals are made for future improvements and applications. Introduction Scientific information is spread out over disciplines which, to the outside observer, may seem to have little in common. For this reason, when traditional methods are used to study a domain pertaining to one specific field of knowledge, one is sometimes left with a sensation of not grasping the domain as a whole. It is like trying to complete a puzzle and not knowing where to put the piece held in the hand, not seeing which puzzle pieces it fits in with. The representation of scientific information in ways easier for the human mind to embrace is nothing new. To make visible to the mind that which is not visible to the eye, or to create a mental image of something that is not obvious (e.g. an abstraction) 1 , are two definitions of the word visualization that point to the intrinsic need to represent information in a non-traditional manner. To paraphrase Costa 2 , visualizing is neither the implicit result of the act of seeing, nor a spontaneous product of the individual receiving visible input. To visualize is a task of the communicative process, through which abstract data and complex phenomena of reality are transformed into visible messages. This enables individuals to apprehend with their own eyes certain data and phenomena that cannot be directly retrieved from a hidden body of knowledge.
Transcript of A new technique for building maps of large scientific...

Jointly published by Akadémiai Kiadó, Budapest Scientometrics,and Kluwer Academic Publishers, Dordrecht Vol. 61, No. 1 (2004) 129–145
Received April 23, 2004Address for correspondence:FÉLIX MOYA-ANEGÓNUniversity of Granada, Library and Information Science FacultyCampus Cartuja, 18071 Granada, SpainE-mail: [email protected]
0138–9130/2004/US $ 20.00Copyright © 2004 Akadémiai Kiadó, BudapestAll rights reserved
A new technique for building maps of large scientificdomains based on the cocitation of classes and categoriesFÉLIX MOYA-ANEGÓN, BENJAMÍN VARGAS-QUESADA, VICTOR HERRERO-SOLANA,
ZAIDA CHINCHILLA-RODRÍGUEZ, ELENA CORERA-ÁLVAREZ,FRANCISCO J. MUNOZ-FERNÁNDEZ
University of Granada, Library and Information Science Faculty, Granada (Spain)
Our objective is the generation of schematic visualizations as interfaces for scientific domainanalysis. We propose a new technique that uses thematic classification (classes and categories) asentities of cocitation and units of measure, and demonstrate the viability of this methodologythrough the representation and analysis of a domain of great dimensions. The main features of themaps obtained are discussed, and proposals are made for future improvements and applications.
Introduction
Scientific information is spread out over disciplines which, to the outside observer,may seem to have little in common. For this reason, when traditional methods are usedto study a domain pertaining to one specific field of knowledge, one is sometimes leftwith a sensation of not grasping the domain as a whole. It is like trying to complete apuzzle and not knowing where to put the piece held in the hand, not seeing whichpuzzle pieces it fits in with.
The representation of scientific information in ways easier for the human mind toembrace is nothing new. To make visible to the mind that which is not visible to theeye, or to create a mental image of something that is not obvious (e.g. an abstraction)1,are two definitions of the word “visualization” that point to the intrinsic need torepresent information in a non-traditional manner. To paraphrase Costa2, visualizing isneither the implicit result of the act of seeing, nor a spontaneous product of theindividual receiving visible input. To visualize is a task of the communicative process,through which abstract data and complex phenomena of reality are transformed intovisible messages. This enables individuals to apprehend with their own eyes certain dataand phenomena that cannot be directly retrieved from a hidden body of knowledge.

F. MOYA-ANEGÓN et al.: Maps of large scientific domains
130 Scientometrics 61 (2004)
The realm of graphic languages for visualizing these “invisible effects” constitutes anew science of visual communication – schematics – which Costa has defined as the“third language” after the image and the sign.
The present study proposes a new technique for schematic visualization applied tothe analysis of large scientific domains. The scientific domain is understood in the termsput forth by Hjørland and Albrechten3, as the reflection of interactions between authors,and their role in science, through citation. The methodology applied allows the analysisof data and can serve as an intermediate step in information retrieval.
We shall begin with an overview of different contributions to, or attempts at, therepresentation of large scientific domains, to see how they approached the visualizationof small domains while available tools and techniques matured. The elements and unitsof measure that could be used for the graphic representation of vast domains are thendiscussed, as is the methodology developed for the generation of maps that makebrowsing easier. Finally, our results and conclusions are presented, and the particularfeatures of several examples of maps are mentioned.
A brief bibliographic review of contributions to the representation oflarge scientific domains
The first author to articulate this need was Doyle, in 1961.4 He underlined theimportance of computers in producing maps similar to those that the brain generates,and showed how they can be projected in multidimensional spaces. He also offered hisopinions as to how to construct such maps. To get “the big picture” of a large scientificdomain has allured many researchers since. Garfield,5 in an article published inAmerican Documentation, showed vivid interest in the construction of historical mapsby means of citation. This interest, taken up by Sher in 1964, led to the creation of ahistorical map showing the development of DNA from Mendel to Nirenberg. That sameyear Garfield, Sher and Torpie6 generated manually distinct historic-topological sciencemaps, on the basis of citation of DNA research, using bibliographic coupling as avariable. DeSolla Price7 showed that the patterns of citations by the authors of scientificarticles would define research fronts, and could also be used to sketch a topologyreflecting the intellectual structure of a scientific domain. But the giant leap forward inthe possibilities for building domain maps or graphs came, in our opinion, from Small8
and Marshakova,9 each of whom proposed the use of document cocitation as a variableof study in the analysis of citations of scientific production. Science maps showing allthe special fields of the natural sciences, elaborated by Small and Griffith10 or Griffith,Small, Stonehill and Dey,11 using the Science Citation Index (SCI) as their source ofinformation and cocitation as a variable of relation, stand as a landmark in thedevelopment of the representation of scientific domains.
F. MOYA-ANEGÓN et al.: Maps of large scientific domains
Scientometrics 61 (2004) 131
The most important point about the methodology used by the above authors is thatthe groups of documents with common intellectual interests were identified. This wasproof that science is a network of interconnected special fields that can be contemplatedthrough the quantitative analysis of written production. In 1975, along these same lines,Aaronson12 X-rayed the biomedical publications from the years 1972 and 1973 toobserve their evolution over this time and highlight, on the 1973 map, what the authorcalled a supercluster, showing the convergence of special fields. The maps by Aaronsonare another turning point in the history of domain representation; not only do they showits evolution and how the different disciplines mutually interact, but they also supplyinformation: the documents conform a map of clusters. Each cluster is characterized bya name, a precise number of documents comprising it, and their degree of interrelation.This is represented by connecting lines that indicate the value of cocitation. The mostimportant clusters stand out very clearly, as they have a greater number of relationshipswith the rest.
Shortly after the appearance of the Aaronson maps, Garfield13 reported that theInstitute for Science Information (ISI) was working on the elaboration of an Atlas ofScience. This project took six years to materialize. It was finally in 198114 when the firsttwo volumes of the Atlas appeared, on biochemistry and molecular biology. Thetechniques used for the generation of the Atlas maps are quite similar to those used bySmall and Griffith in 1974 (that is, based on the cocitation of documents of a specificdiscipline), yet a new spatial positioning of the clusters is achieved by applyingMultidimensional Scaling (MDS). Over time, new volumes of the Atlas of Science havepresented biotechnology and molecular genetics,15 and biochemistry, immunology, andplant and animal biology,16 then drew to a close, to date at least, after the volume onPharmacology.17 Meanwhile, Small has continued to work on the design of maps ofscientific domains, refining the techniques used in his early maps. He can be consideredthe ISI´s top specialist in the research and development of science maps.18-25
After the 90’s, new methods of information retrieval and new techniques for theanalysis, visualization and spatial positioning of information (well reviewed by Börner,Chen and Boyack26), studies based on techniques for visualizing the structure of smallscientific domains begin to proliferate. So, for instance, Braam, Moed and van Raan27,28
propose the combined use of cocitation with co-word analysis for the generation ofscience maps, emphasizing their structure and dynamic aspects. Lin, Soergel andMarchionini29 develop a Self-Organizing Map (SOM) that represents the semanticrelationships among documents and can be used as a bibliographic interface for theretrieval of online information. Hjørland and Albrechtsen3 put forth a new model basedon the way of thinking or speaking of the society, in turn determined by the social,economic, or work setting, and which they call domain analysis. White and McCain,30
on the basis of this domain analysis, propose graphic representation or visualization as amodel for information retrieval and analysis. To corroborate their theory, in 1988 they
F. MOYA-ANEGÓN et al.: Maps of large scientific domains
132 Scientometrics 61 (2004)
analyzed information science31 in terms of the authors of the 12 journals that, accordingto their criteria, were most important between 1972 and 1995. Garfield32states that thenew techniques of visualization make possible the generation of global science mapswhich, by zooming over or representing different time periods, allow us to identify theemerging research fronts, revealing the interests of researchers now at work andallowing us to associate author names to each front.
White, Lin and McCain33 compare the relatively traditional mode of visualizingscientific domains using MDS with the Self-organizing Maps (SOM), to conclude thatthe latter make it slightly easier to integrate and retrieve bibliographic information.Ding, Chowdhury, Foo and Qiang34 use bibliometric techniques to break down an areaof knowledge into its main elements, and represent the areas and subareas graphically.White35 presents networks revolving around on a subject, and proposes that maps bemade with an author name supplied by a non-expert user. This involves a lessercognitive load (for the user) the development of interfaces for inexpert users facilitatethe retrieval of information from the bibliographic information, and the possibility thatthese interfaces can be generated in a dynamic way. Noyons, Moed and Luwel,36 Buterand Noyons,37 and Noyons38 point to the great potential of science maps as an interfacefor information retrieval, and suggest some ways to aid the user in exploring andcomprehending what he sees. Chen and Paul39 describe a method that broadens andtransforms traditional coauthor analysis into structural patterns of scientific literaturethat can be represented in 3D maps. For Chen, Paul and O’Keefe,40 the essence ofknowledge, whether in a geographical, thematic, or intellectual context, is the key tovisualization. The proliferation of techniques for the visualization of information allowsthe core of knowledge to be represented. This is a key role in the process ofmodelization and representation of the structure or intellectual map of a given domain,be it geographical, thematic or intellectual.
Again, Ding, Chowdhury and Foo41 make a map of the intellectual structure of thefield of information retrieval, this time over a ten-year period (1987–1997), showingmodels, patterns and trends of the field as well as different measurements of the degreesof association among the most relevant terms of the document produced under theheading “information retrieval.” Ingwersen and Larsen42 use MDS to create a map ofthe production of 17 European countries in nine areas of the social sciences. GuerreroBote, Moya Anegón and Herrero Solana43 classify database documents automaticallyusing a SOM, and describe how it can be used for browsing and retrieving informationfrom the database. White, Buzydlowski and Lin,44-46 on the basis of the Pathfindernetworks (PFNET) used by Chen,47 and White’s CAMEOs,48 devise a dynamic systemof visualization called Authorlink (using author cocitation) that allows browsing andinformation retrieval in real time from a database with records of the Arts andHumanities Citation Index (A&HCI). Small49 theorizes about the design of a web toolable to detect and monitor, in real time, the changes on research fronts resulting from its

F. MOYA-ANEGÓN et al.: Maps of large scientific domains
Scientometrics 61 (2004) 133
interactions. Chen and Kuljis,50 using citation and cocitation, study the appearance andevolution of new research fronts in the field of physics. Morris, Yen, Wu and Asnake51
work on visualization, detection and identification of changes on research fronts overtime. Boyack and Börner,52 in an evaluative study, generate maps of scientificpublications with government grants to reveal connections between funding and thenumber of citations received.
What we can clearly derive from this general overview is that domain maps orvisualizations are primarily used, thus far, to reveal relationships among documents, todetect the most important authors within a given discipline, or to analyze the structureof an area of knowledge and its evolution. The methodology may involve clustering,MDS, factor analysis, or social networks based on models of graphs, or somecombination thereof.
At present, a great deal of research shares the common objective of producing aninitial map of a domain (a blueprint of sorts) that is general and informative enough toorient the non-expert user, while also capable of panning over or zooming in on levelsof a discipline using multivariate techniques or network analysis.
Our proposal
In our opinion, cocitation is to date the best tool for obtaining relational informationon documents with which to schematically represent the image of a domain. Thus,depending on the type of variable analyzed (words, documents, authors, journals), it ispossible to offer different snapshots of a domain to reflect the relationships existingamong the component elements. The use of one variable or another in cocitation willdepend largely on the size of the domain to be represented, as well as on the possibilityor interest in obtaining dynamic visualizations – that is, either online or offline maps.30
But there may also be persistent physical limitations, such as the representation ofinformation in a low-resolution reduced and static space, which has drawn the attentionof Tufte53,54 for over a decade.
Our proposal entails the graphic and schematic representation of vast thematic,geographical or institutional domains based on cocitation. It is obviously necessary toperform some type of clustering, if we hope to corral the intellectual structure of a largedomain on a computer screen, making it quickly intelligible for the human eye andmind. We propose the cocitation of classes and categories based on the followingscheme:
It is generally accepted by the research community that the frequency with whichany two documents are cocited reflects their degree of affinity in the opinion of theciting authors.

F. MOYA-ANEGÓN et al.: Maps of large scientific domains
134 Scientometrics 61 (2004)
In Figure 1, documents A and B are cocited in document X. The intensity with whichA and B are mutually related depends on the number of times that they are cocited.
Figure 1. Cocitation scheme
Just as the reseach community accepts the fact that documents A and B are an entity ofcocitation valid for the representation of the structure of a domain, making evident theirsemantic and intellectual relationships, it also accepts the use of authors as the entity ofcocitation and as the unit of measure for representing this domain. The same happens inthe case of journals.
The ISI, in the Journal Citation Report (JCR),55 places every journal in at least onesubject category. For example, the journal Scientometrics is situated in the categoryComputer Science, Interdisciplinary Applications. By analogy, the cocitation ofcategories assigned by the ISI-JCR could be used as the entity of measure following theorder established in Figure 1, that is: documents, authors, journals, and ISI-JCRsubjects. To go back to our example, if document A was published in Scientometricsand therefore has been assigned to the above category, while document B appears inPattern Recognition Letters, assigned to the ISI-JCR categories of Computer Science,Artificial Intelligence, the interrelationship of all these categories becomes evident. Theintensity of the connections will depend on the number of times that documentspublished in journals of these subject categories are cocited.
There are different classifications that group ISI-JCR subject categories in superiorconglomerates – heretofore referred to as classes. Because we attempt to represent thestructure of Spain’s scientific production, we have adopted the classification of theAgencia Nacional de Evaluación y Prospectiva (ANEP),56 which is a taxonomy carriedout by experts in the evaluation of science for the technical and scientific assessment of

F. MOYA-ANEGÓN et al.: Maps of large scientific domains
Scientometrics 61 (2004) 135
the action plans of the National Plan of Spanish Scientific Research, adapting the ISI-JCR categories as a distinctive classifying element of scientific output in Spain, totwenty-five classes. As is the case in the ISI-JCR, one same category can belong todifferent subject areas. Accordingly, the classes may perfectly well be used as the entityof cocitation and as a unit of greater measure, valid for representing the intellectualstructure of a domain, as we will show later on.
In short, we propose the use of the cocitation of classes and categories as entities ofcocitation and units of measurement for the generation of great schematic visualizationsthat act as graphic interfaces for domain analysis.
Methodology
For strictly academic purposes we downloaded from the Web of Science57 –specifically from: the Science Citation Index-Expanded (SCI-E), the Social ScienceCitation Index (SSCI) and the Arts and Humanities Citation Index (A&HCI) – therecords with at least one Spanish address in the field “address” from the year 2000, andput them into an ad hoc database for consultation. The database held 172,562 authornames, who published a total of 26,062 documents (articles, biographical items, bookreviews, corrections, editorial materials, letters, meeting abstracts, news items andreviews) in 3,838 different ISI journals. When these were broken down into the 243categories established by the ISI-JCR for the year 2000, 222 categories were covered.(Spain did not produce any scientific communications pertaining to the remaining 21categories within the year 2000.) These 222 categories were grouped, based on theANEP classification, in 25 classes, again taking into account that one single categorymay belong to different classes.
Because we try to show the relationships existing among diverse disciplines in thenatural sciences, social sciences, arts and humanities, we must first solve the problem ofuneven level of citation, as suggested by Small and Garfield.19 For this reason, whencarrying out the cocitation queries corresponding to the classes or categories, wenormalize this measurement of association by dividing the cocitation by the square rootof the product of the frequency of the cites of the cocited documents:
cjciCcijCc
· = , (Measurement of normalized cocitation58)
where: – Cc is cocitation – c is citation.

F. MOYA-ANEGÓN et al.: Maps of large scientific domains
136 Scientometrics 61 (2004)
Kamada & Kawai’s algorithm59 was used to automatically produce representationson a plane, starting from a circular position of the nodes. It generates social networkswith aesthetic criteria such as the maximum use of available space, the minimumnumber of crossed links, the forced separation of nodes, building balanced maps, etc.
The result is a tree structure with the following characteristics: a map representingthe Spanish scientific structure as a whole dividing it in 25 big classes, 25 maps, one forevery ANEP class, each of which containing the ISI-JCR categories that ANEPevaluation experts have considered appropriate. And finally, 222 maps of ISI-JCRcategories, one for every ISI-JCR category with its nearest neighbours.
Class cocitation map (first level)
To obtain the basic data needed for a graphic representation of the whole domain ofSpain, we carry out a cocitation query of classes under the ANEP classification, asdescribed above.
The result is a symmetrical class cocitation matrix of 25 × 25. Of course, the degreeof intellectual connections shown by the cocitation matrix among certain classes is veryhigh, making it difficult in some zones to clearly visualize the structure of the domain.In following the advice of Small,25 therefore, we believe it better to eliminate someconnections, as “the loss of information of the structure implies a gain in simplicity,justifying the sacrifice in some cases.” We therefore prune the relations between classesusing the Minimum Spanning Tree (MST): when relationships among classes are undera threshold value, they are successively deleted until only one is left, totallydisconnected from the rest. Then the threshold value is re-established, leaving no classdisconnected. Other available pruning tools include PFNET; but as White60 points out,this algorithm prunes all the paths except those having the highest degree of meaningfulcocitation, leaving a very reduced number of coincidences in the matrix, where
1−= nq and ∞=r . Since our aim is to show the highest number of possible links torepresent the structure of a domain as well as its semantic and intellectual relationships,we opted to use MST, because it allows us to reduce the minimum number of links inorder to facilitate the domain visualization and analysis without loose information.Similar results might be obtained using PFNET with a lower q, such as 2=q forexample, but this will be addressed in the future.
We assign each class a different color to distinguish it from the rest, and a sizeproportional to the totality of Spanish scientific output in the year 2000, as well as anANEP label. This information, together with the cocitation matrix, is processed by theKamada & Kawai algorithm to produce a social network where each class isrepresented by a node connected with other nodes by undirected links. The relationshipsamong them and their intensity is seen in the thickness of the links. In just a few casesin which the tag of a node is partly superimposed on another, we manually modified the
F. MOYA-ANEGÓN et al.: Maps of large scientific domains
Scientometrics 61 (2004) 137
location assigned by the algorithm a bit. The definitive network is exported to anScalable Vector Graphic (SVG) format,61,62 which allows us to zoom in on or shift thegraphics in any direction on the screen.
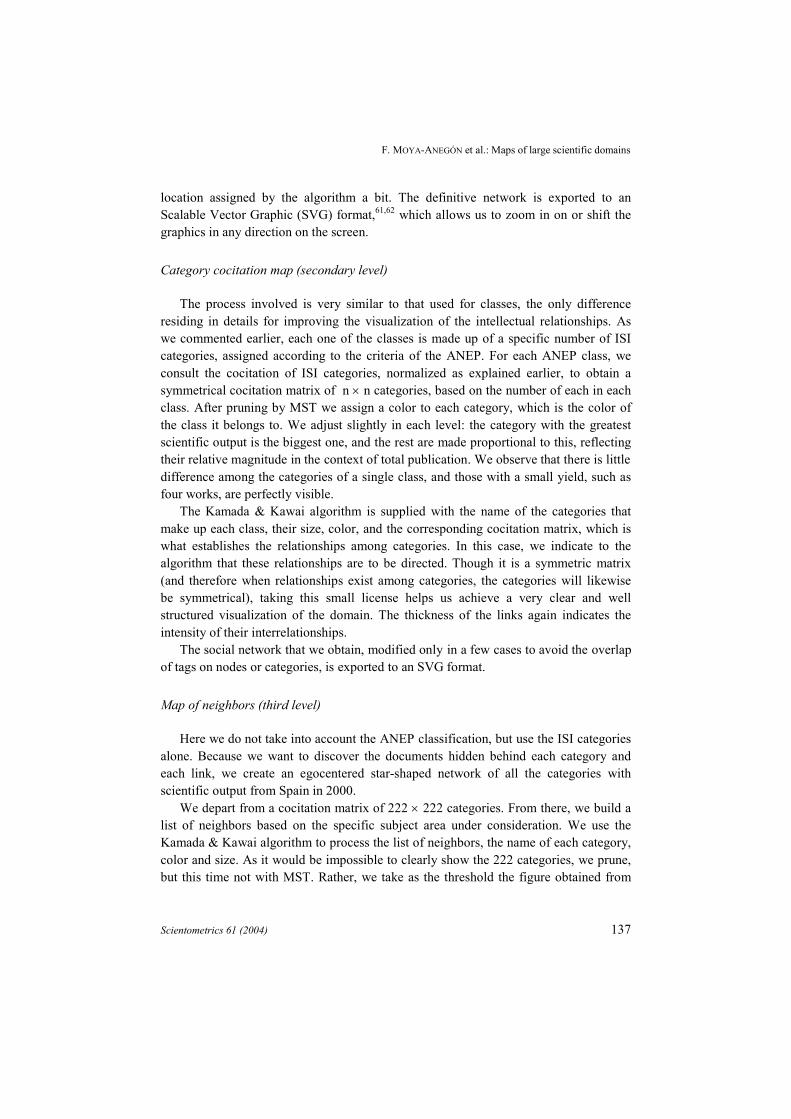
Category cocitation map (secondary level)
The process involved is very similar to that used for classes, the only differenceresiding in details for improving the visualization of the intellectual relationships. Aswe commented earlier, each one of the classes is made up of a specific number of ISIcategories, assigned according to the criteria of the ANEP. For each ANEP class, weconsult the cocitation of ISI categories, normalized as explained earlier, to obtain asymmetrical cocitation matrix of n × n categories, based on the number of each in eachclass. After pruning by MST we assign a color to each category, which is the color ofthe class it belongs to. We adjust slightly in each level: the category with the greatestscientific output is the biggest one, and the rest are made proportional to this, reflectingtheir relative magnitude in the context of total publication. We observe that there is littledifference among the categories of a single class, and those with a small yield, such asfour works, are perfectly visible.
The Kamada & Kawai algorithm is supplied with the name of the categories thatmake up each class, their size, color, and the corresponding cocitation matrix, which iswhat establishes the relationships among categories. In this case, we indicate to thealgorithm that these relationships are to be directed. Though it is a symmetric matrix(and therefore when relationships exist among categories, the categories will likewisebe symmetrical), taking this small license helps us achieve a very clear and wellstructured visualization of the domain. The thickness of the links again indicates theintensity of their interrelationships.
The social network that we obtain, modified only in a few cases to avoid the overlapof tags on nodes or categories, is exported to an SVG format.
Map of neighbors (third level)
Here we do not take into account the ANEP classification, but use the ISI categoriesalone. Because we want to discover the documents hidden behind each category andeach link, we create an egocentered star-shaped network of all the categories withscientific output from Spain in 2000.
We depart from a cocitation matrix of 222 × 222 categories. From there, we build alist of neighbors based on the specific subject area under consideration. We use theKamada & Kawai algorithm to process the list of neighbors, the name of each category,color and size. As it would be impossible to clearly show the 222 categories, we prune,but this time not with MST. Rather, we take as the threshold the figure obtained from
F. MOYA-ANEGÓN et al.: Maps of large scientific domains
138 Scientometrics 61 (2004)
calculating the average plus the standard deviation of those categories which, within thecomplete cocitation matrix, belong to the vector of the category that we are going torepresent, and which have a value greater than zero. In other words, we use a pruningmechanism with a variable threshold, established by the idiosyncrasy of the links ofeach central category itself, with respect to the rest. We eliminate the links and verticesthat are connected to the central node or category, with a threshold value under theaverage plus standard deviation. To represent this as a network we again use theKamada & Kawai algorithm, but now specifying that the value of the distance betweenvertices is a similarity function of cocitation. Hence, the thickness of the lines is alwaysthe same, while their length varies. It is thus obvious which categories are closest to thecentral one, and share a greater topic affinity. In some instances, when links or nodetags overlap, they are manually shifted a bit. The map obtained is exported to the SVGformat.
Results
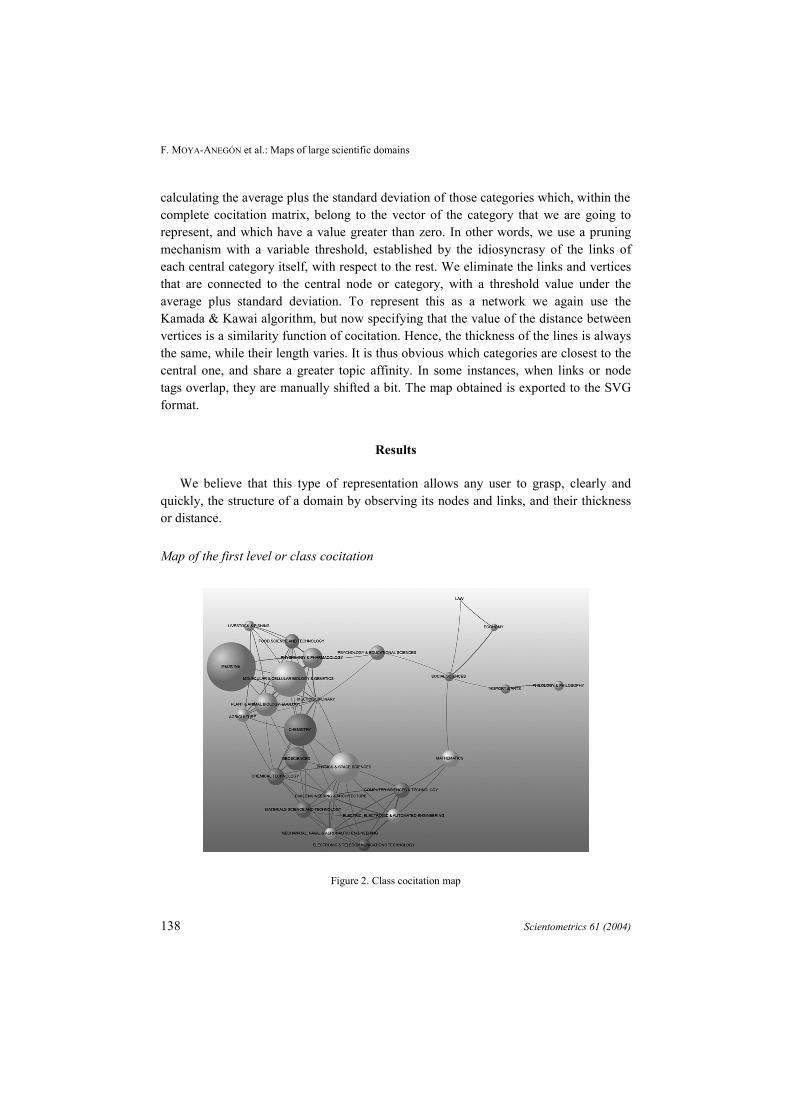
We believe that this type of representation allows any user to grasp, clearly andquickly, the structure of a domain by observing its nodes and links, and their thicknessor distance.
Map of the first level or class cocitation
Figure 2. Class cocitation map
F. MOYA-ANEGÓN et al.: Maps of large scientific domains
Scientometrics 61 (2004) 139
Each class is represented by a node in the network with its name. At first glance,Spain’s scientific output for the year 2000 is widely distributed, over the length andwidth of the graphic area. We note that there is a large “gap” in the center, indicatingthere is no subject area associated directly with all the others. This is also what happenswith MDS representations. Even Multidisciplinary, the class with the greatest numberof relationships, is found at a roughly left-center position, closer to the area of Sciences.
From a general standpoint, we can clearly distinguish the three ISI databases. In theleftward area SCI-E is vaguely contoured, wheras in the upper right the SSCI databaseis reflected, and pendent from it, the contents of what would be the A&HCI. Within theSCI-E zone, there are three prominent blocks: one we could call Life Sciences,including Livestock and Fishing, Food Sciences and Technology, Medicine, Physiologyand Pharmacology, Psychology and Educational Sciences, Molecular & CellularBiology & Genetics, Plant & Animal Biology & Ecology, and Agriculture. Anotherblock would be that of Physics, Chemistry and Earth and Space Sciences, containingChemistry, Geosciences, Chemical Technology, Physics and Space Sciences andMaterials Science & Technology. Finally, the group of Engineering and ComputerSciences would contain Civil Engineering & Architecture, Computer Sciences &Technology, Electric, Electronic & Automated Engineering, Mechanical, Naval andAeronautical Engineering, Mathematics and Electronic & TelecommunicationsTechnology. We have deliberately left the Multidisciplinary Sciences out of thisclassification because its contents could belong to all three blocks. In the upper rightzone of Social Sciences and Art and the Humanities we quickly infer the SSCI databaserepresented by Social Sciences, Economy and Law, as well as the A&HCI database,with History & Arts and Philology & Philosophy. It is noteworthy that Psychology andEducational Sciences, Mathematics and Social Sciences act as a bridge for the networkas a whole, connecting the three major component groups, which coincide with thethree ISI databases.
The nodes with a greater number of links occupy more or less central positionseasily related with the rest (for example Multidisciplinary Sciences, Physics & SpaceSciences or Chemistry), whereas those with fewer links are situated in the periphery,(among others, Philology & Philosophy, Economy, Law and even Medicine). At aglance we note that the link between Social Sciences and Economy is thicker thanSocial Sciences’ links with History & Arts, Law, Psychology & Educational Sciencesor Mathematics. Similarly, in the lower part of the Graph, this happens with Electronic& Telecommunications Technology, Electric, Electronic & Automated Engineering,Computer Sciences & Technology, Civil Engineering & Architecture and Mechanical,Naval and Aeronautic Engineering. The thicker links serve as evidence that the use ofcommon sources is greater.

F. MOYA-ANEGÓN et al.: Maps of large scientific domains
140 Scientometrics 61 (2004)
Maps of the second level or cocitation of categories
Each one of the nodes in the class cocitation maps gives rise to the generation of anew map of ISI category cocitation, which gives us a total of 25 maps, as explained inMethodology. For reasons of research affinity, we shall use as an example the map ofSocial Sciences, which includes the category Library and Information Sciences.
Figure 3a. Category cocitation map: Social Sciences
Figure 3b. Category cocitation map: Social Sciences

F. MOYA-ANEGÓN et al.: Maps of large scientific domains
Scientometrics 61 (2004) 141
Every node in the network represents an ISI-JCR category. The numeral alongside isthe number of published works in that field produced by Spanish research institutionswithin the year 2000. In the case of the Social Sciences, the most central nodes are, inthis order: Sociology, Planning & Development, Social Sciences-MathematicalMethods, Social Sciences-Interdisciplinary and Management. The rest, includingLibrary & Information Sciences, are in more or less peripheral positions.
As in class cocitation maps, the intensity of the links is shown by their thickness. Inthe case of the maps of category cocitation alone, however, we have included a smallapplication that allows us to hide the links in order to enhance visibility. The linksbecome visible when the cursor is positioned over one of the nodes or tags, as seen inFigures 3a and 3b.
Of the six links that Library & Information Sciences shares with other nodes, twoare very weak – those with Operation Research & Management Science and SocialSciences-Interdisciplinary – while the other four are somewhat stronger. Sociology hasfifteen different relationships, with two particularly strong ones: Social Sciences-Interdisciplinary and Industrial Relations & Labor.
Neighbor maps
Each node from the category cocitation maps becomes the starting point of a newmap, giving rise to a total of 222 graphs we shall call Neighbor Maps. Tracking downLibrary & Information Sciences once again, we show its neighbors in Figure 4.
Figure 4. Neighbor map. Social Sciences

F. MOYA-ANEGÓN et al.: Maps of large scientific domains
142 Scientometrics 61 (2004)
The characteristic feature of this map type is that it depicts an egocentered network,where the node studied is always situated in the center, and the rest orbit around it.Although the representation is balanced and tends to occupy all the available space, theintensity of the relationships is reflected here by the distance between nodes. Thus, themost closely related categories are, respectively, Computer Sciences & InformationSystems, Communication, History & Philosophy of Science, Management, ComputerSciences & Interdisciplinary Applications, Planning & Development, Business andSocial Sciences-Interdisciplinary. The central node or category “attracts” those nodeswith which it maintains a closer relationship (in terms of common sources) regardless ofthe ANEP class it belongs to. This makes it very easy to perceive category groupingsand their intensity of correlation without referring to any external classification system.
Conclusions
We have shown that the cocitation of classes or categories can be used to build mapsof large geographic domains. This methodology could be applied to comparative studiesof similar domains with a geographic reference, or even with a thematic or institutionalpoint of reference. Moreover, the evolution of research fronts within a single domaincan be inferred through sequences of representations over time.
In our view, domain analysis is best organized as a hierarchy that would begin withmaps of classes, followed by category maps, and then by neighbor maps. The logicalcontinuation of this proposal would be for the latter to be followed by maps of journalcocitation and author cocitation, in that order. Our current work takes us in thisdirection.
While it is true that we present off-line maps here, we are also testing a set of toolsthat would allow the automatic generation of schematic representations for a domain thesize of Spain. However, we must remember that the re-generation of these maps isrequired as new information is added to the database (to date, annually). At some futuredate we may even have the means for dynamic updatings of such maps. For the timebeing, however, a “demo” or thematic prototype of Spain is available online, as is as aprototype of the institutions of Andalucía, for any interested browsers atwww.atlasofscience.net.

F. MOYA-ANEGÓN et al.: Maps of large scientific domains
Scientometrics 61 (2004) 143
References
1. Framework of a Visualization System [Web page], Available at: http://www.siggraph.org/education/materials/HyperVis/abs_con1/main.htm [Review at: 08/08/2003], (1999).
2. COSTA, J., La esquemática: visualizar la información, Barcelona, Paidós, 1998.3. HJØRLAND, B., ALBRECHTSEN, H., Toward a new horizon in information science: domain analysis,
Journal of the American Society for Information Science (JASIS), 46 (1995) 400–425.4. DOYLE, L. B., Semantic roadmaps for literature searchers, Journal of the Association for Computing
Machinery, 8 (1961) 553–578.5. GARFIELD, E., Citation indexes in sociological and historical research, American Documentation, 14
(1963) 289–291.6. GARFIELD, E., SHER, I. H., TORPIE, R. J., The Use of Citation Data in Writing the History of Science,
Philadelphia, Institute for Scientific Information, (1964).7. PRICE D., J. D., Networks of scientific papers, Science, 149 (1965) 510–515.8. SMALL, H., Co-citation in the scientific literature: a new measure of the relationship between two
documents, Journal of the American Society for Information Science (JASIS), 24 (1973) 265–269.9. MARSHAKOVA, I. V., System of document connection based on references, Nauchno-Teknichescaya
Informatisya, Series II (6) (1973) 3–8.10. SMALL, H., GRIFFITH, B. C., The structure of scientific literature, I: Identifying and graphing
specialyties, Science Studies, 4 (1974) 17–40.11. GRIFFITH, B. C., SMALL, H., STONEHILL, J. A., DEY, S., The structure of scientific literature, II: Toward
a macro and microstructure for science, Science Studies, 4 (1974) 339–365.12. AARONSON, S., The footnotes of science, Mosaic, 6 (March-April) (1975) 22–27.13. GARFIELD, E., ISI’s Atlas of Science may help students in choice of career in science, Current Contents,
29 (July 21) (1975) 5–8.14. GARFIELD, E., Introducing the ISI Atlas of Science: Biochemistry and molecular biology, 1978-80,
Current Contents, (42) (1981) 5–13.15. GARFIELD, E., Introducing the ISI Atlas of Science: Biotechnology and molecular genetics, 1981/82 and
bibliographic update for 1983/84, Current Contents, (41) (1984) 3–15.16. GARFIELD, E., The encyclopedic ISI-Atlas of Science launches 3 new sections: bochemistry,
inmunology, and animal and plant sicences, Current Contents, (7) (1988) 3–8.17. SEIDEN, L. S., SWANSON, D. R., ISI Atlas of Science: Pharmacology 1987, Vol 1, Library Quarterly, 59
(1989) 72–73.18. SMALL, H., The relationship of information science to the social sciences: a co-citation analysis,
Information Processing & Management, 17 (1981) 39–50.19. SMALL, H., GARFIELD, E., The geography of science: disciplinary and national mappings, Journal of
Information Science, 11 (4) (1985) 147–159.20. SMALL, H., SWEENEY, E., Clustering the science citation index using co-citations. 1. A comparison of
methods, Scientometrics, 7 (1985) 391–409.21. SMALL, H., SWEENEY, E., GREENLEE, E., Clustering the science citation index using co.citations. 2.
Mapping science, Scientometrics, 8 (1985) 321–340.22. SMALL, H., Macrolevel changes in the structure of cocitation clusters: 1983-1989, Scientometrics, 26
(1993) 5–20.23. SMALL, H., A SCI-MAP case-study: building a map of aids research, Scientometrics, 30 (1994)
229–241.24. SMALL, H., Visualizing science by citation mapping, Journal of the American Society for Information
Science (JASIS), 50 (1999) 799–813.25. SMALL, H., Charting pathways through science: exploring Garfield’s vision of a unified index to science,
In: B. CRONIN, H. B. ATKINS (Eds), The Web of Knowledge: A Festschrift in Honor of Eugene Garfield .Medford, N. J. Information Today, 2000, pp. 449–473.
26. BÖRNER, K., CHEN, C., BOYACK, K. W., Visualizing knowledge domains, Annual Review of InformationScience & Technology, 37 (2003) 179–255.

F. MOYA-ANEGÓN et al.: Maps of large scientific domains
144 Scientometrics 61 (2004)
27. BRAAM, R. R., MOED, H. F., VAN RAAN, A. F. J., Mapping of Science by combined co-citation and wordanalysis. I: Structural aspects, Journal of the American Society for Information Science (JASIS), 42(1991) 233–251.
28. BRAAM, R. R., MOED, H. F., VAN RAAN, A. F. J., Mapping of Science by combined co-citation and wordanalysis. II: Dynamic aspects, Journal of the American Society for Information Science (JASIS), 42(1991) 252–266.
29. LIN, X., SOERGEL, D., MARCHIONINI, G., A self-organizing semantic map for information retrieval, In:Proceedings of the Fourteenth Annual International ACM/SIGIR Conference on Research andDevelopment in Information Retrieval, Chicago, 1991, pp. 262–269.
30. WHITE, H. D., MCCAIN, K. W., Visualization of literatures, Annual Review of Information Systems andTechnology (ARIST), 32 (1997) 99–168.
31. WHITE, H. D., MCCAIN, K. W., Visualizing a discipline: an author co-citation analysis of informationscience, 1972-1995, Journal of the American Society for Information Science (JASIS), 49 (1998)327–355.
32. GARFIELD, E., Mapping the World of Science (at the 150 Anniversary Meeting of the AAAS,Philadelphia, PA), [On-line],http://www.garfield.library.upenn.edu/papers/mapsciworld.html [Consulted: 07/05/2003], 1998.
33. WHITE, H. D., LIN, X., MCCAIN, K. W., Two modes of automated domain analysis: multidimensionalscaling vs. Kohonen feature mapping of information science authors, In: Proceedings of the FifthInternational ISKO Conference, Würzberg, Ergon Verlag, 1998, pp. 57–61.
34. DING, Y., CHOWDHURY, G. G., FOO, S., QIAN, W., Bibliometric information retrieval systems (BIRS): aweb search interface utilizing bibliometric research results, Journal of the American Society forInformation Science (JASIS), 51 (2000) 1190–1204.
35. WHITE, H. D., Toward ego-centered citation analysis, In: B. CRONIN, H. B. ATKINS (Eds), The Web ofKnowledge: A Festschrift in Honor of Eugene Garfield, Medford, N. J. Information Today, 2000,pp. 475–498.
36. NOYONS, E. C. M., MOED, H. F., LUWEL, M., Combining mapping and citation analysis for evaluativebibliometric purposes: a bibliometric study, Journal of the American Society for Information Science(JASIS), 50 (1999) 115–131.
37. BUTER, R. K., NOYONS, E. C. M., Improving the functionality of interactive bibliometric science maps,Scientometrics, 51 (2001) 55–67.
38. NOYONS, E. C. M., Bibliometric mapping of science in a science policy context, Scientometrics, 50(2001) 83–98.
39. CHEN, C., PAUL, R. J., Visualizing a knowledge domain's intellectual structure, Computer, 34 (3) (2001)65–71.
40. CHEN, C., PAUL, R. J., O’Keefe, B., Fitting the jigsaw of citation: information visualization in domainanalysis, Journal of the American Society for Information Science and Technology (JASIST), 52 (2001)315–330.
41. DING, Y., CHOWDHURY, G. G., FOO, S., Bibliometric cartography of information retrieval research byusing co-word analysis, Information Processing & Management, 37 (2001) 801–817.
42. INGWERSEN, P., LARSEN, B., Mapping national research profiles in social science disciplines, Journal ofDocumentation, 57 (2001) 715–740.
43. GUERRERO BOTE, V. P., MOYA ANEGÓN, F. D., HERRERO SOLANA, V., Document organization usingKohonen's algorithm, Information Processing & Management, 38 (2002) 79–89.
44. WHITE, H. D., BUZYDLOWSKI, J., LIN, X., Co-cited author maps as interfaces to digital libraries:designing Pathfinder Networks in the humanities, In: IEEE International Conference on InformationVisualization, London, 2000, pp. 25–30.
45. BUZYDLOWSKI, J., WHITE, H. D., LIN, X., Term co-occurrence analysis as an interface for digitallibraries, Lecture Notes in Computer Science Series, 2539 (2002) 133–144.
46. LIN, X., WHITE, H. D., BUZYDLOWSKI, J., Real-time author co-citation mapping for online searching,Information Processing & Management, (2003) 689–706.
47. CHEN, C., Information Visualization and Virtual Environments, Berlin, Springer, (1999).

F. MOYA-ANEGÓN et al.: Maps of large scientific domains
Scientometrics 61 (2004) 145
48. WHITE, H. D., Author-centered bibliometrics through CAMEOs: characterizations automatically madeand edited online, Scientometrics, 51 (2001) 607–637.
49. SMALL, H., Paradigms, citations and maps of science: a personal history, Journal of the AmericanSociety for Information Science and Technology (JASIST), 54 (2003) 394–399.
50. CHEN, C., KULJIS, J., The rising landscape: a visual exploration of superstring revolutions in physics,Journal of the American Society for Information Science and Technology (JASIST), 54 (2003) 435–446.
51. MORRIS, S. A., YEN, G., WU, Z., ASNAKE, B., Time line visualization of research fronts, Journal of theAmerican Society for Information Science and Technology (JASIST), 54 (2003) 413–422.
52. BOYACK, K. W., BÖRNER, K., Indicator-assisted evaluation and funding of research: visualizing theinfluence of grants on the number and citation counts of research papers, Journal of the American Societyfor Information Science and Technology (JASIST), 54 (2003) 447–461.
53. TUFTE, E. R., Envisioning Information, Cheshire, Graphics Press, 1994.54. TUFTE, E. R., The Visual Display of Quantitative Information, Cheshire, Graphics Press, (2001).55. Thomson-ISI, ISI Journal Citation Reports [Web page], Available at: http://isi6.isiknowledge.com
[Review at: 09/07/2003], 2003.56. ANEP, Agencia Nacional de Evaluación y Prospectiva [Web page], Available at:
http://www.mcyt.es/sepct/ANEP/anep.htm [Review at: 09/07/2003], 2003.57. Thomson-ISI, ISI Web of Science [Web page], Available at: http://wos.cica.es/58. SALTON, G., BERGMARK, D., A citation study of computer science literature, Professional
Communication, IEEE Transaction, PC-22 (1979) 146–158.59. KAMADA, T., KAWAI, S., An algorithm for drawing general undirected graphs, Information Processing
Letters, 31 (1989) 7–15.60. WHITE, H. D., Pathfinder networks and author cocitation analysis: a remapping of paradigmatic
information scientist, Journal of the American Society for Information Science and Technology (JASIST),54 (2003) 423–434.
61. W3C, Scalable Vector Graphics (SVG) [Web page], Available at: http://www.w3.org/Graphics/SVG/[Review at: 10/09/2003], 2003.
62. W3C, Scalable Vector Graphics (SVG) 1.1 Especification [Web page], Available at:http://www.w3.org/TR/SVG11/ [Review at: 12/09/2003], 2003.