
A NEW STANDARD IN METEOROLOGICAL MONITORING SYSTEMS INSTALLED AT THE PERRY NUCLEAR POWER PLANT Jim...
66
A NEW STANDARD IN METEOROLOGICAL MONITORING SYSTEMS INSTALLED AT THE PERRY NUCLEAR POWER PLANT Jim Holian (SAIC) and Jamie Balstad (First Energy Corp)
-
Upload
maurice-justin-moody -
Category
Documents
-
view
215 -
download
2
Transcript of A NEW STANDARD IN METEOROLOGICAL MONITORING SYSTEMS INSTALLED AT THE PERRY NUCLEAR POWER PLANT Jim...

A NEW STANDARD IN METEOROLOGICAL
MONITORING SYSTEMS INSTALLED AT THE
PERRY NUCLEAR POWER PLANT
Jim Holian (SAIC) and
Jamie Balstad (First Energy Corp)

Meteorological Parameters
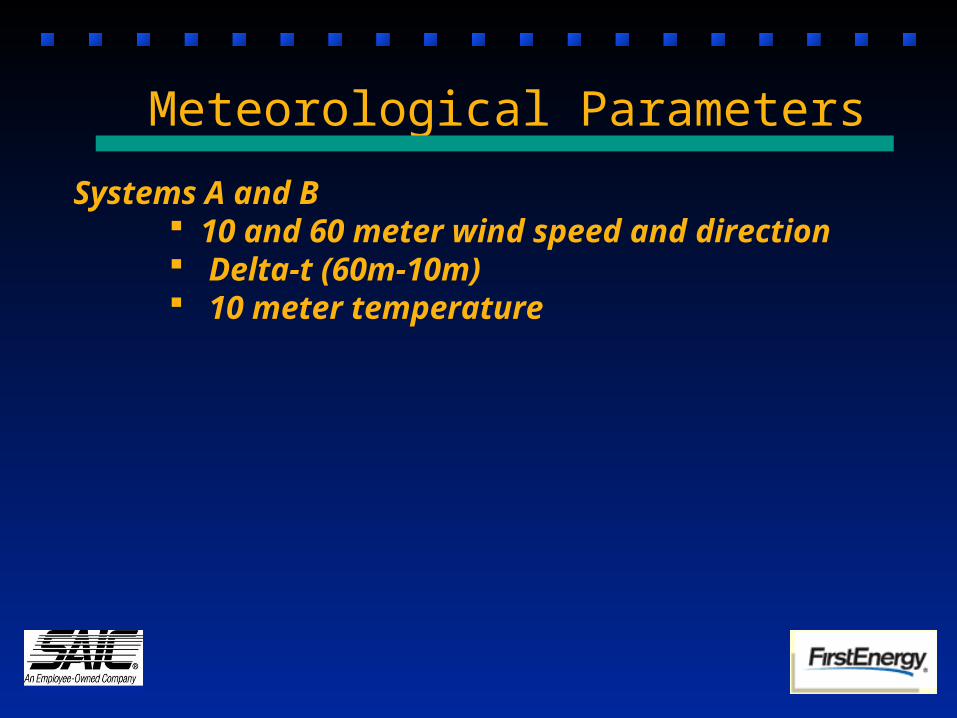
Systems A and B 10 and 60 meter wind speed and direction Delta-t (60m-10m) 10 meter temperature
Meteorological Parameters

Systems A and B 10 and 60 meter wind speed and direction Delta-t (60m-10m) 10 meter temperature
System A only 10 meter dew point Station Pressure Precipitation
Meteorological Parameters

Design Basis

•Two Beers
Design Basis

•Two Beers
•Validation without elimination
Design Basis
•Two Beers
•Validation without elimination
•Reduce false 9 out of data
Design Basis
•Two Beers
•Validation without elimination
•Reduce false 9 out of data
•Include onsite conditions/climatology
Design Basis

•Produce a valid data set that is the “best of”
Design Basis (continued)

•Produce a valid data set that is the “best of”
•Reduce manual labor
Design Basis (continued)

•Produce a valid data set that is the “best of”
•Reduce manual labor
•Decrease maintenance costs
Design Basis (continued)
•Produce a valid data set that is the “best of”
•Reduce manual labor
•Decrease maintenance costs
•Independently shut down individual sensors
Design Basis (continued)

Site-Specific Software
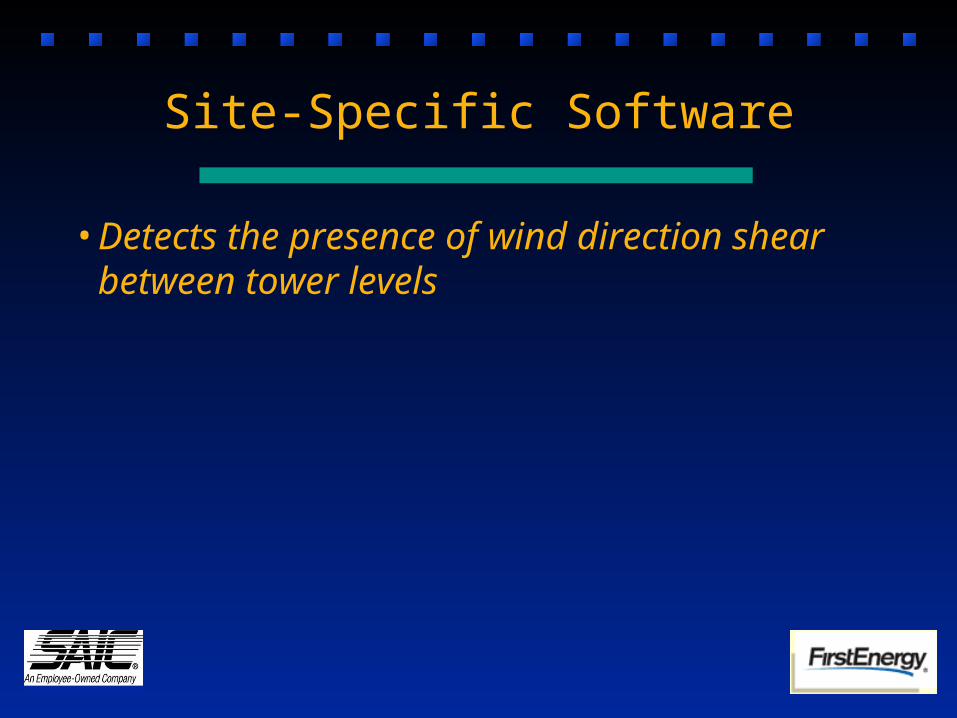
• Detects the presence of wind direction shear between tower levels
Site-Specific Software

• Detects the presence of wind direction shear between tower levels
• Identifies differences in the data attributable to tower interference
Site-Specific Software
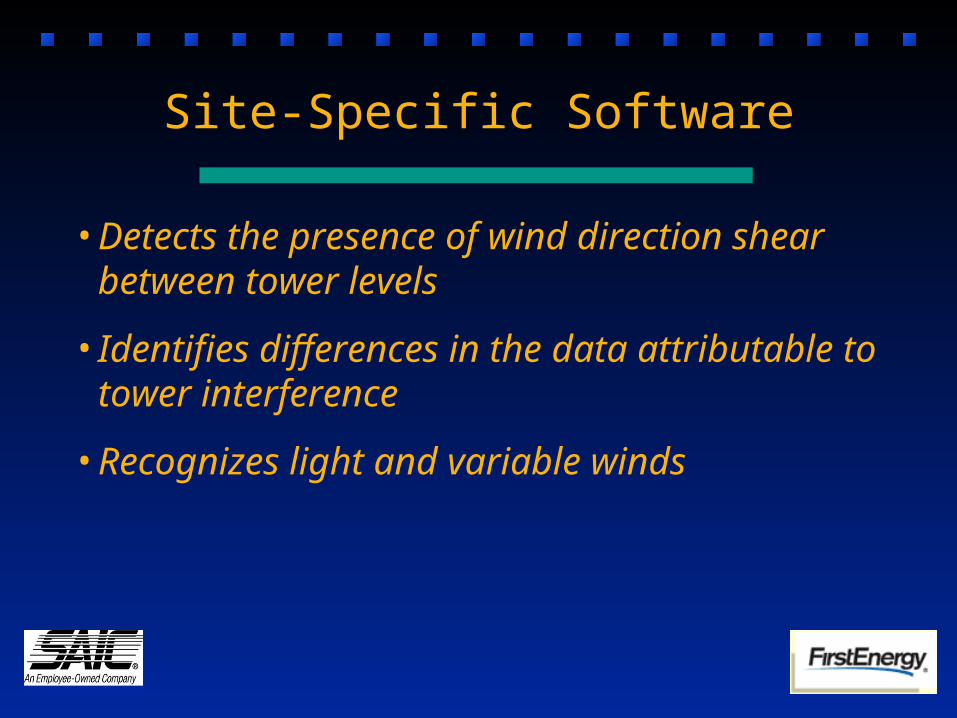
• Detects the presence of wind direction shear between tower levels
• Identifies differences in the data attributable to tower interference
• Recognizes light and variable winds
Site-Specific Software

• Detects the presence of wind direction shear between tower levels
• Identifies differences in the data attributable to tower interference
• Recognizes light and variable winds
• Identifies wind speed cup/threshold problems before they become obvious
Site-Specific Software

Site-Specific Software (cont’d)
•Recognizes delta-t differences attributed to sunrise/sunset/precipitation onset

Site-Specific Software (cont’d)
•Recognizes delta-t differences attributed to sunrise/sunset/precipitation onset
• Identifies aspirator trips/fluctuations
Site-Specific Software (cont’d)
•Recognizes delta-t differences attributed to sunrise/sunset/precipitation onset
• Identifies aspirator trips/fluctuations
• Identifies problems associated with temperature/dew point/precipitation interactions

Site-Specific Software (cont’d)
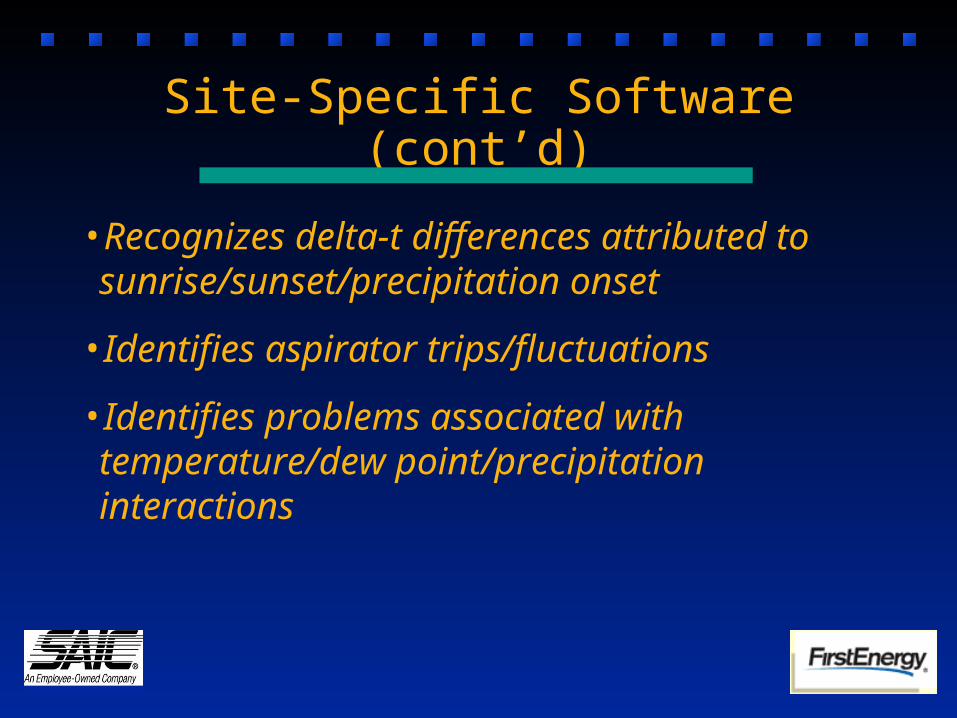
•Recognizes delta-t differences attributed to sunrise/sunset/precipitation onset
• Identifies aspirator trips/fluctuations
• Identifies problems associated with temperature/dew point/precipitation interactions
•Ability to turn off any sensor remotely

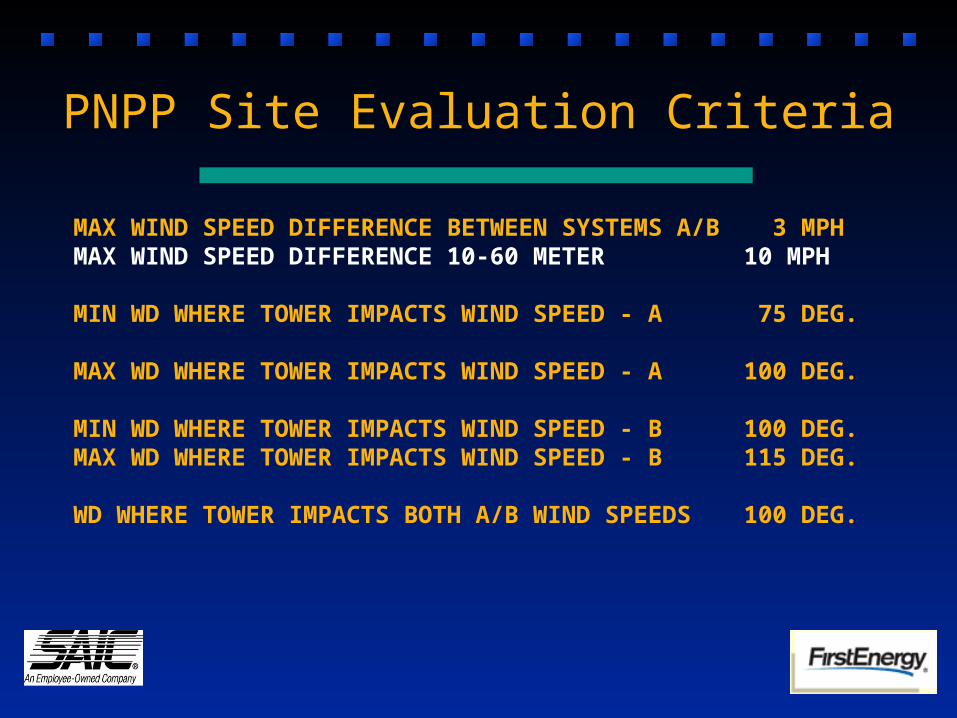
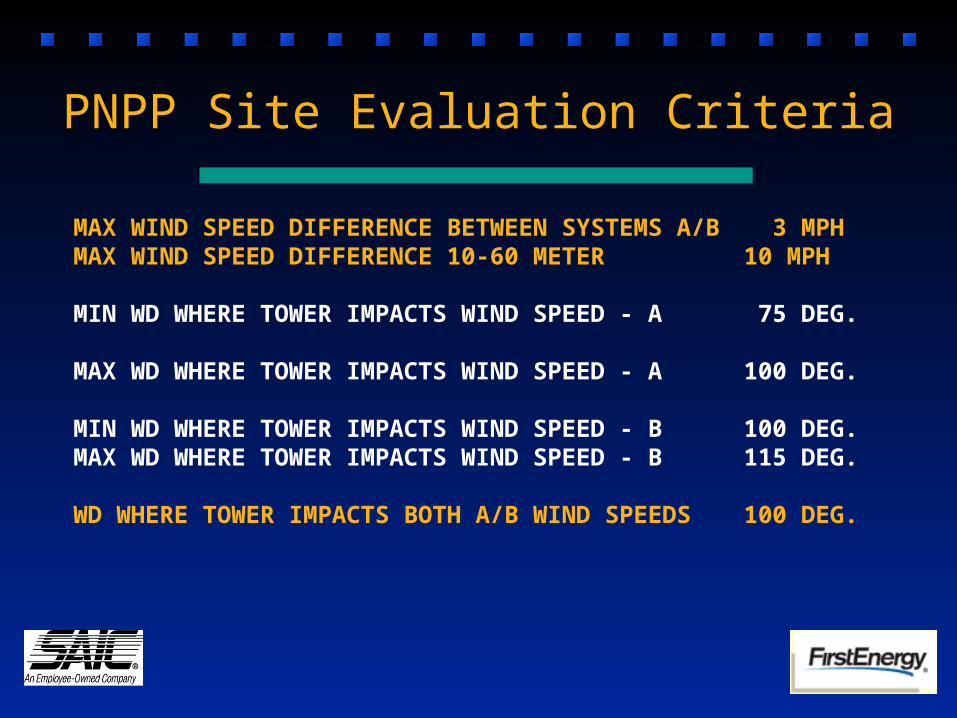
MAX WIND SPEED DIFFERENCE BETWEEN SYSTEMS A/B 3 MPHMAX WIND SPEED DIFFERENCE 10-60 METER 10 MPH
MIN WD WHERE TOWER IMPACTS WIND SPEED - A 75 DEG.MAX WD WHERE TOWER IMPACTS WIND SPEED - A 100 DEG.
MIN WD WHERE TOWER IMPACTS WIND SPEED - B 100 DEG.MAX WD WHERE TOWER IMPACTS WIND SPEED - B 115 DEG.
WD WHERE TOWER IMPACTS BOTH A/B WIND SPEEDS 100 DEG.
PNPP Site Evaluation Criteria
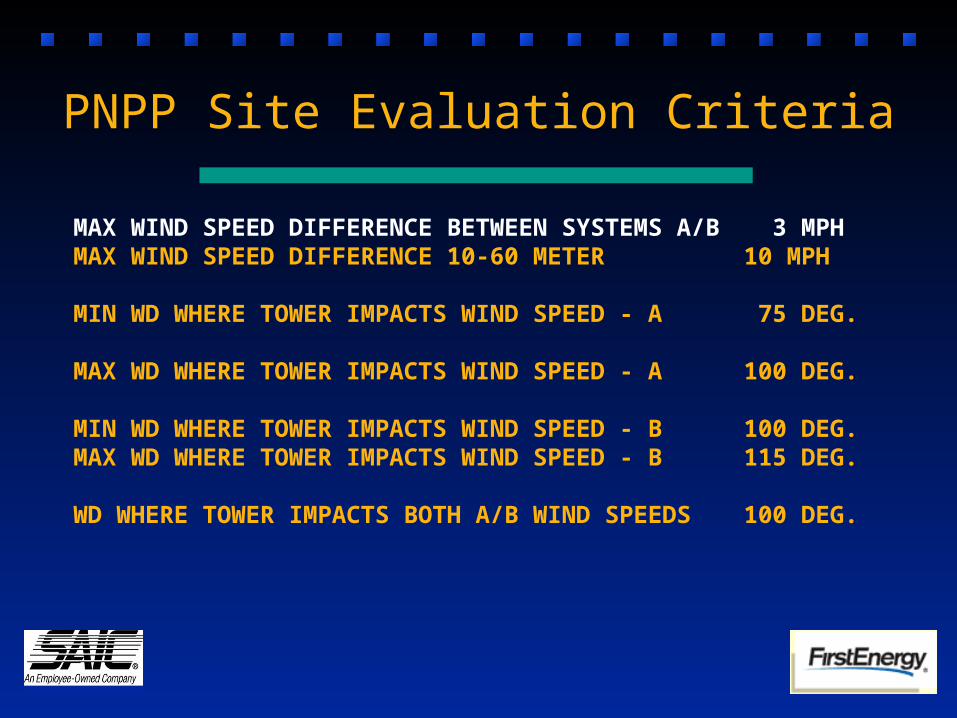
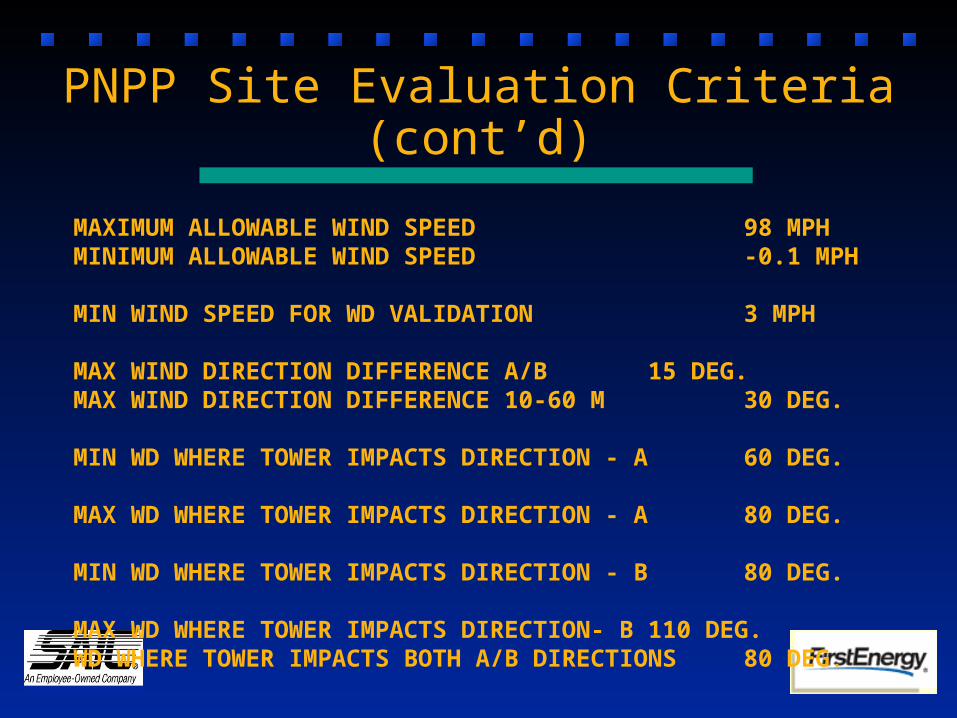
MAXIMUM ALLOWABLE WIND SPEED 98 MPHMINIMUM ALLOWABLE WIND SPEED -0.1 MPH
MIN WIND SPEED FOR WD VALIDATION 3 MPH
MAX WIND DIRECTION DIFFERENCE A/B 15 DEG.MAX WIND DIRECTION DIFFERENCE 10-60 M 30 DEG.
MIN WD WHERE TOWER IMPACTS DIRECTION - A 60 DEG.MAX WD WHERE TOWER IMPACTS DIRECTION - A 80 DEG.
MIN WD WHERE TOWER IMPACTS DIRECTION - B 80 DEG.MAX WD WHERE TOWER IMPACTS DIRECTION- B 110 DEG.WD WHERE TOWER IMPACTS BOTH A/B DIRECTIONS 80 DEG.
PNPP Site Evaluation Criteria (cont’d)

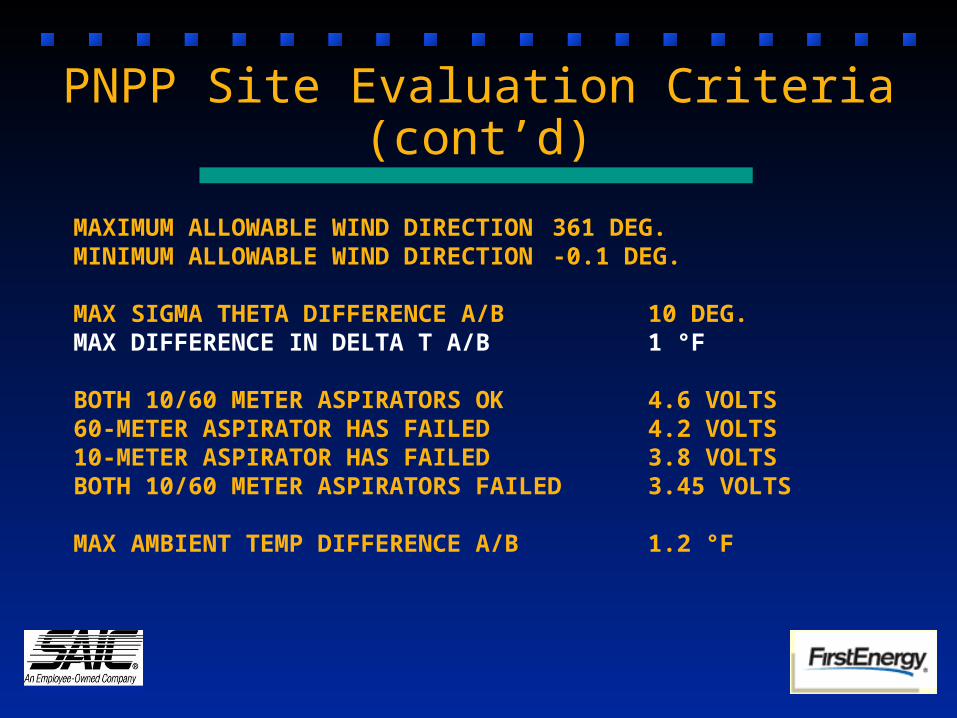
MAXIMUM ALLOWABLE WIND DIRECTION 361 DEG.MINIMUM ALLOWABLE WIND DIRECTION -0.1 DEG.
MAX SIGMA THETA DIFFERENCE A/B 10 DEG.MAX DIFFERENCE IN DELTA T A/B 1 °F
BOTH 10/60 METER ASPIRATORS OK 4.6 VOLTS60-METER ASPIRATOR HAS FAILED 4.2 VOLTS10-METER ASPIRATOR HAS FAILED 3.8 VOLTSBOTH 10/60 METER ASPIRATORS FAILED 3.45 VOLTS
MAX AMBIENT TEMP DIFFERENCE A/B 1.2 °F
PNPP Site Evaluation Criteria (cont’d)
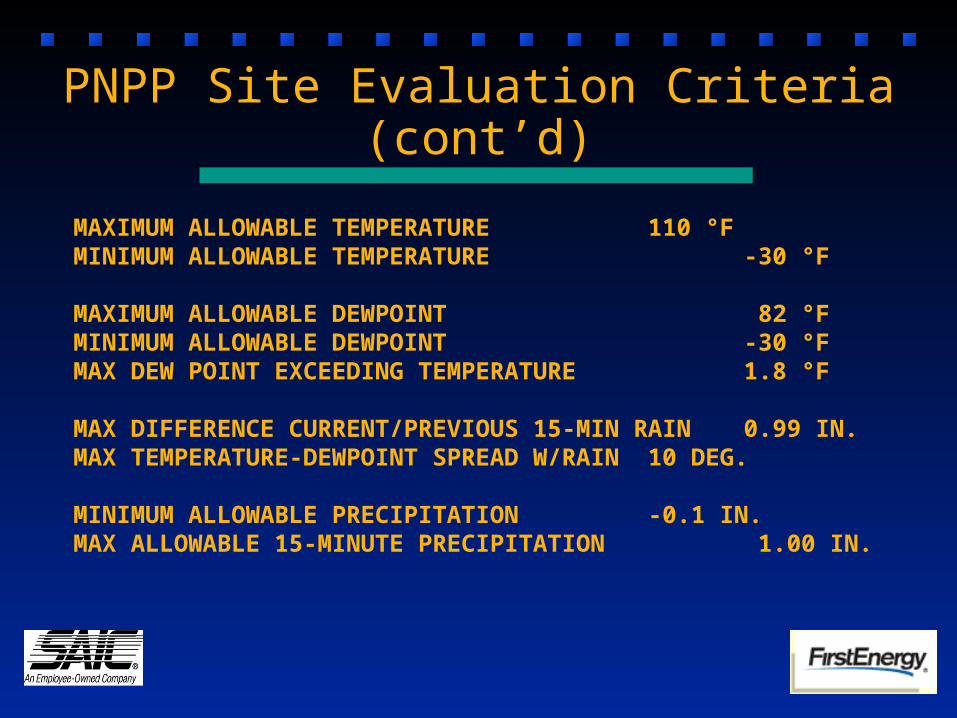
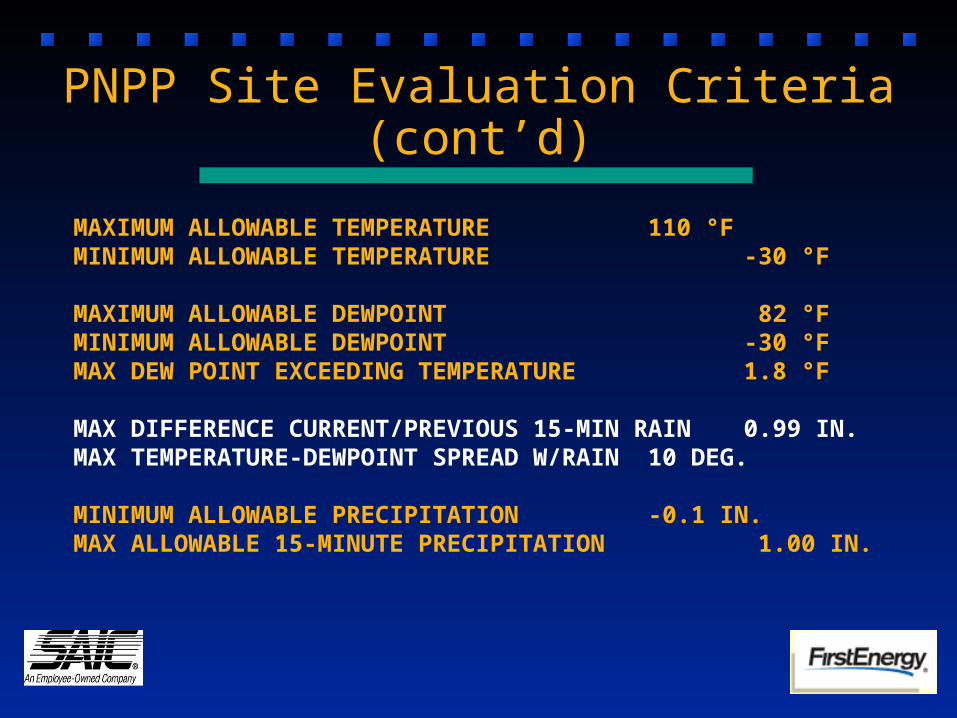
MAXIMUM ALLOWABLE TEMPERATURE 110 °FMINIMUM ALLOWABLE TEMPERATURE -30 °F
MAXIMUM ALLOWABLE DEWPOINT 82 °FMINIMUM ALLOWABLE DEWPOINT -30 °FMAX DEW POINT EXCEEDING TEMPERATURE 1.8 °F
MAX DIFFERENCE CURRENT/PREVIOUS 15-MIN RAIN 0.99 IN.MAX TEMPERATURE-DEWPOINT SPREAD W/RAIN 10 DEG.
MINIMUM ALLOWABLE PRECIPITATION -0.1 IN.MAX ALLOWABLE 15-MINUTE PRECIPITATION 1.00 IN.
PNPP Site Evaluation Criteria (cont’d)

MAX ALLOWABLE STATION PRESSURE 30.75 IN/HGMIN ALLOWABLE STATION PRESSURE 27.75 IN/HGMAX 15-MINUTE PRESSURE CHANGE 0.2 IN/HG
MAXIMUM ALLOWABLE DELTA-T 15.0 DEG.MINIMUM ALLOWABLE DELTA-T -6.0 DEG.
DEWPOINT ASPIRATOR HAS FAILED 3.25 VOLTSDEW POINT & 60 METER ASPIRATOR FAILED 2.95 VOLTSDEW POINT & 10 METER ASPIRATOR FAILED 2.75 VOLTSALL ASPIRATORS FAILED 2.58 VOLTS
PNPP Site Evaluation Criteria (cont’d)
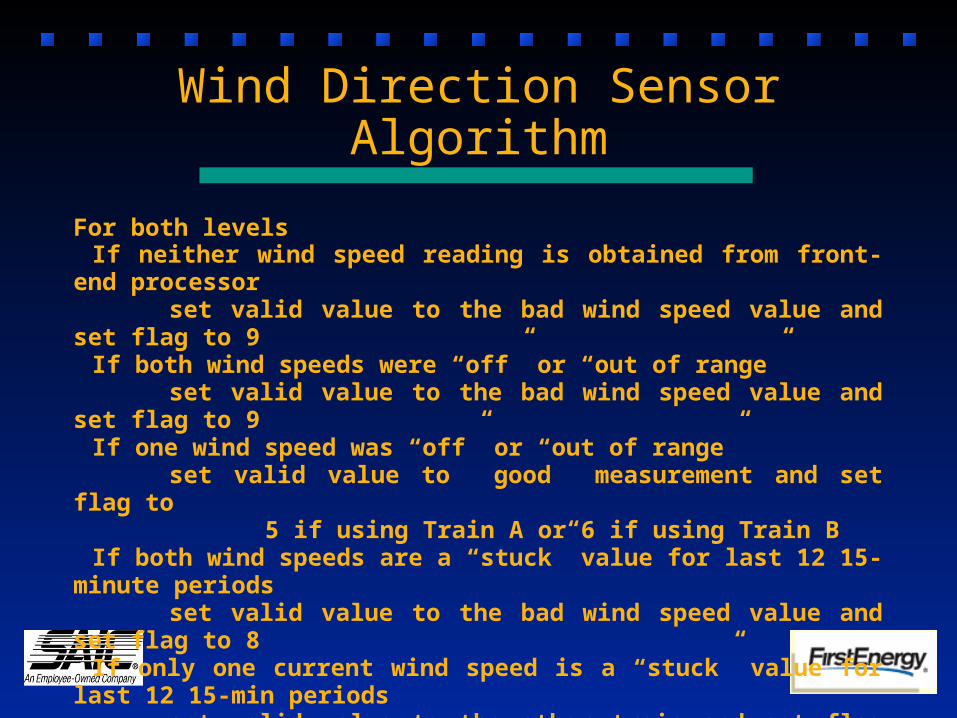
For both levelsIf neither wind speed reading is obtained from front-end processor
set valid value to the bad wind speed value and set flag to 9If both wind speeds were “off” or “out of range”
set valid value to the bad wind speed value and set flag to 9If one wind speed was “off” or “out of range”
set valid value to good measurement and set flag to5 if using Train A or 6 if using Train B
If both wind speeds are a “stuck” value for last 12 15-minute periodsset valid value to the bad wind speed value and set flag to 8
If only one current wind speed is a “stuck” value for last 12 15-min periodsset valid value to the other train and set flag to 7
Wind Direction Sensor Algorithm
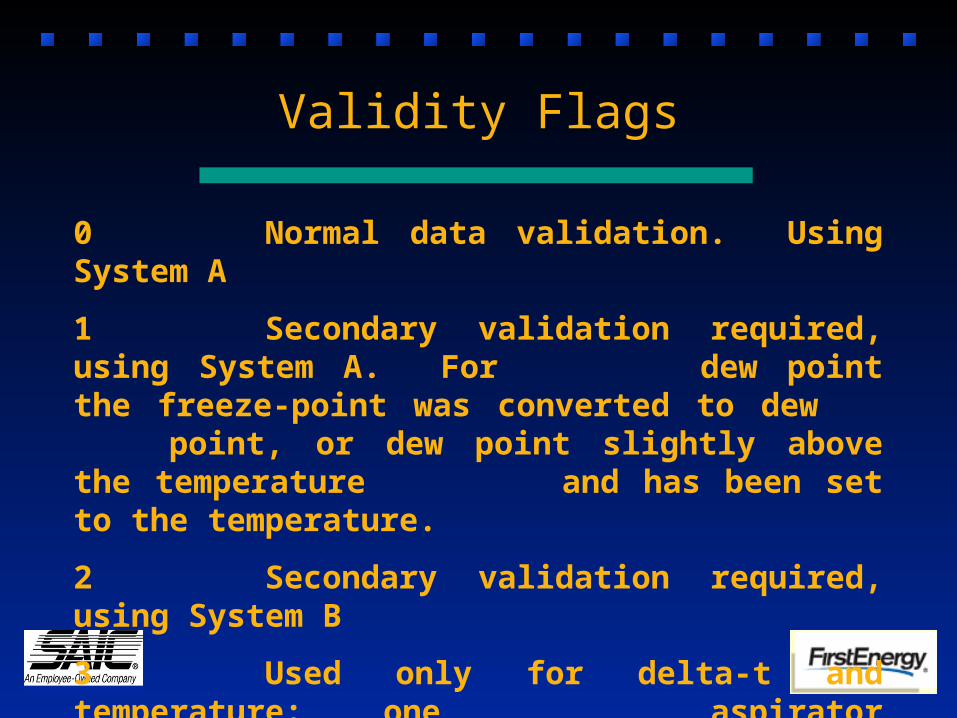
0 Normal data validation. Using System A
1 Secondary validation required, using System A. For dew point the freeze-point was converted to dew point, or dew point slightly above the temperature and has been set to the temperature.
2 Secondary validation required, using System B
3 Used only for delta-t and temperature: one aspirator failed. Using the other system sensor.
Validity Flags
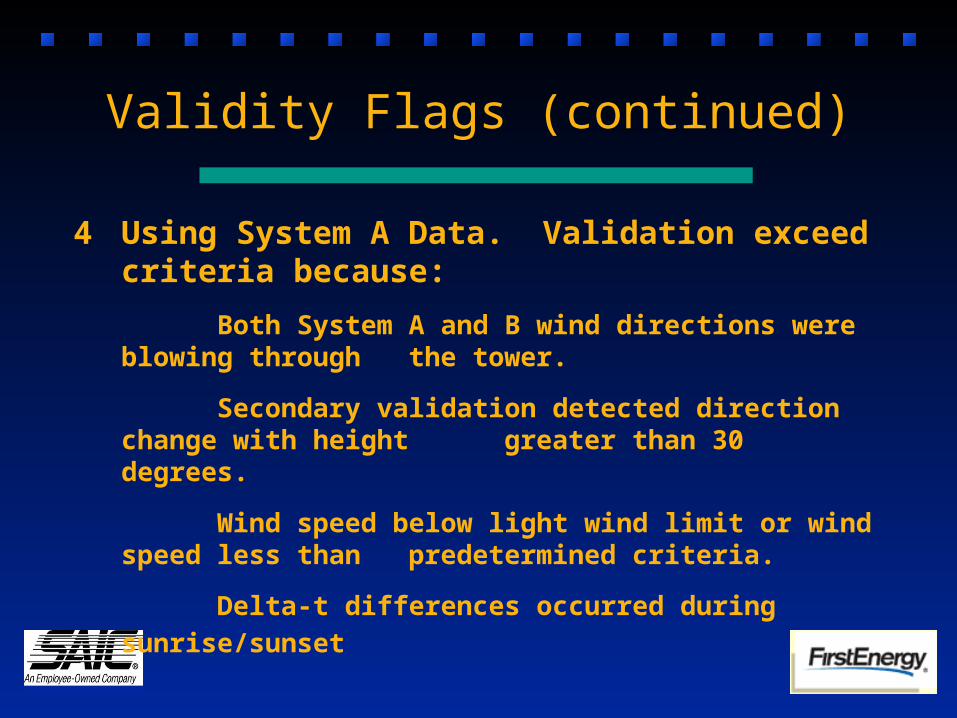
4 Using System A Data. Validation exceed criteria because:
Both System A and B wind directions were blowing through the tower.
Secondary validation detected direction change with height greater than 30 degrees.
Wind speed below light wind limit or wind speed less than predetermined criteria.
Delta-t differences occurred during sunrise/sunset
Validity Flags (continued)

5/6 No Validation. Problem detected with System B/A sensor (turned “off” or problem with time/date stamp or reading data logger file) using System A/B
7 Ambient Temperature/Delta-T --Both aspirators off, results could be affected
Dew point --possible “stuck” sensor (same reading for 5 readings)
Precipitation --Difference between temperature and dew point greater than 10 F.
Wind Speed --One sensor at same level is “stuck” (same reading for 13 readings)
Pressure --possible “stuck” sensor (same reading for 5 readings).
Validity Flags (continued)

8 Failed all validation checks. System A values passed if possible.
Dew point exceeded temperature by greater than allowable criteria. Dew point reset to temperature.
Wind Speed --Both sensors at same level are “stuck” (same reading for 13 readings)
9 No data obtained from either data logger or all similar sensors on same level turned “off”
Validity Flags (continued)

Validity Flags Summary

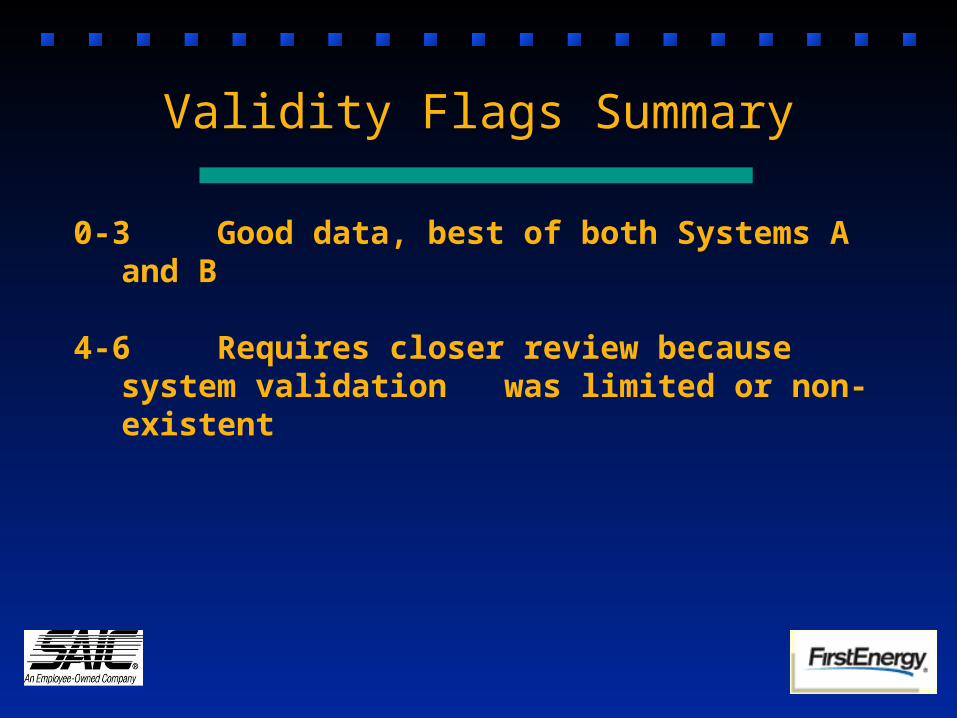
0-3 Good data, best of both Systems A and B
Validity Flags Summary
0-3 Good data, best of both Systems A and B
4-6 Requires closer review because system validation was limited or non-existent
Validity Flags Summary
0-3 Good data, best of both Systems A and B
4-6 Requires closer review because system validation was limited or non-existent
7-8 Requires intense scrutiny because data failed system validation
Validity Flags Summary

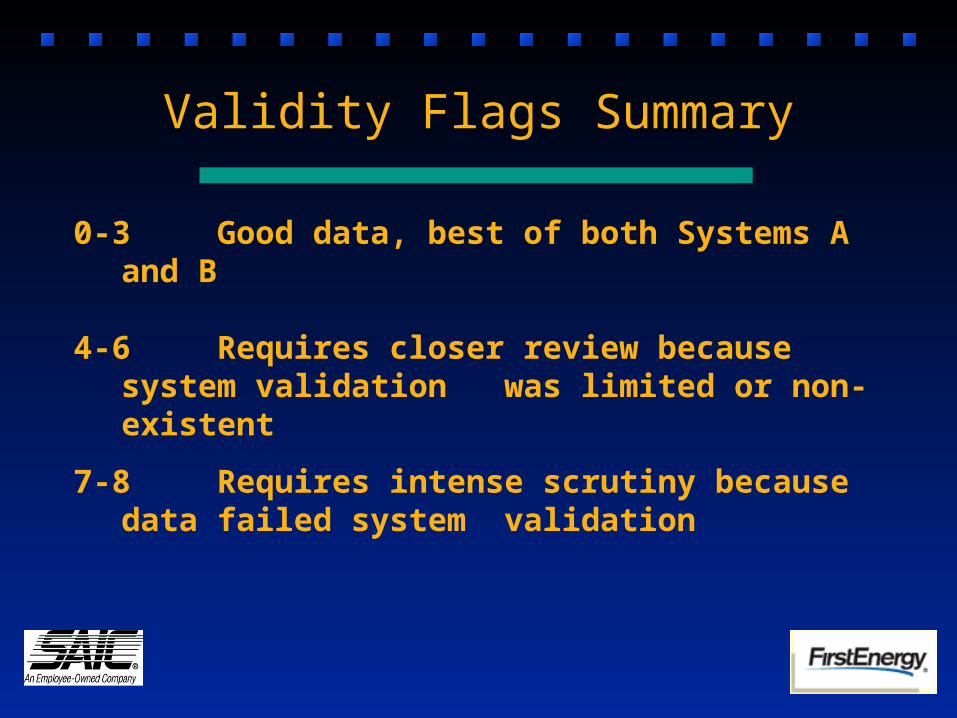
0-3 Good data, best of both Systems A and B
4-6 Requires closer review because system validation was limited or non-existent
7-8 Requires intense scrutiny because data failed system validation
9 Bad or missing data
Validity Flags Summary

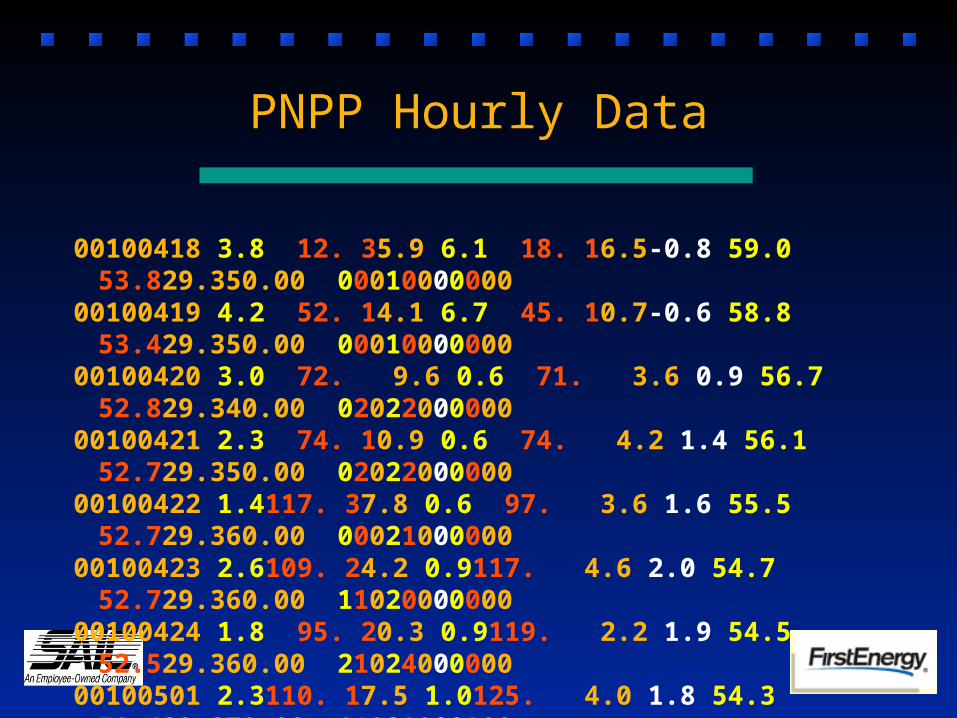
00100418 3.8 12. 35.9 6.1 18. 16.5-0.8 59.0 53.829.350.00 0001000000000100419 4.2 52. 14.1 6.7 45. 10.7-0.6 58.8 53.429.350.00 0001000000000100420 3.0 72. 9.6 0.6 71. 3.6 0.9 56.7 52.829.340.00 0202200000000100421 2.3 74. 10.9 0.6 74. 4.2 1.4 56.1 52.729.350.00 0202200000000100422 1.4117. 37.8 0.6 97. 3.6 1.6 55.5 52.729.360.00 0002100000000100423 2.6109. 24.2 0.9117. 4.6 2.0 54.7 52.729.360.00 1102000000000100424 1.8 95. 20.3 0.9119. 2.2 1.9 54.5 52.529.360.00 2102400000000100501 2.3110. 17.5 1.0125. 4.0 1.8 54.3 52.629.370.00 1102000000000100502 4.0139. 14.2 0.8146. 4.1 0.5 55.6 52.929.380.00 0002000000000100503 2.5 92. 12.4 0.9122. 3.4 1.0 55.0 52.429.370.00 2102400000000100504 2.4 76. 23.1 8.3101. 5.6 1.2 54.3 52.029.360.00 2201100000000100505 4.1107. 16.5 9.7106. 6.8 0.3 54.7 51.829.340.01 11011000000
PNPP Hourly Data

PNPP System Performance

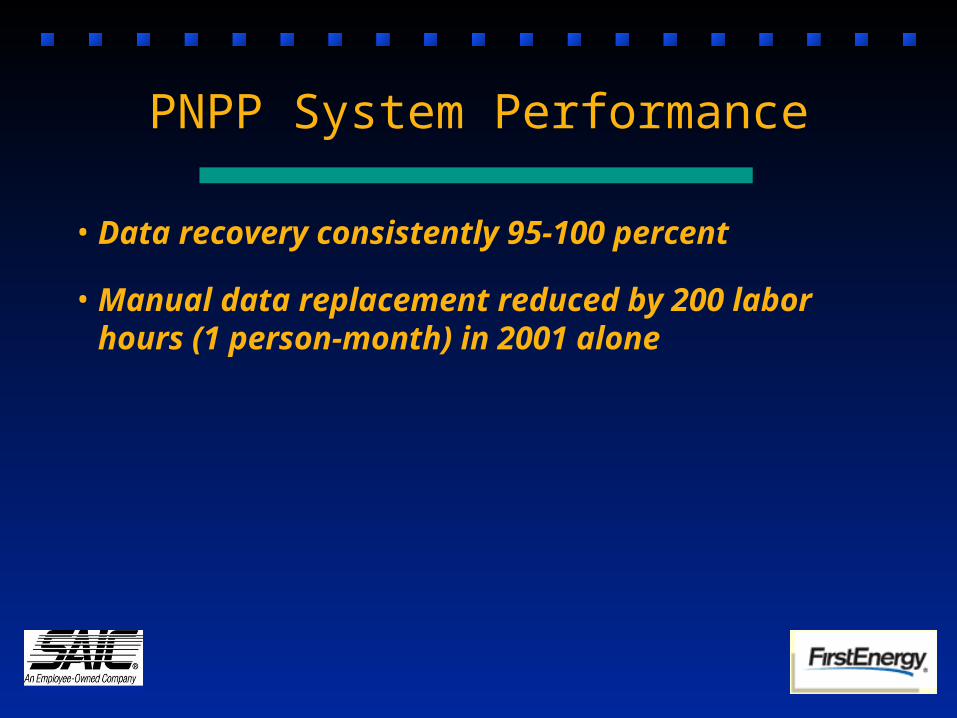
• Data recovery consistently 95-100 percent
PNPP System Performance
• Data recovery consistently 95-100 percent
• Manual data replacement reduced by 200 labor hours (1 person-month) in 2001 alone
PNPP System Performance
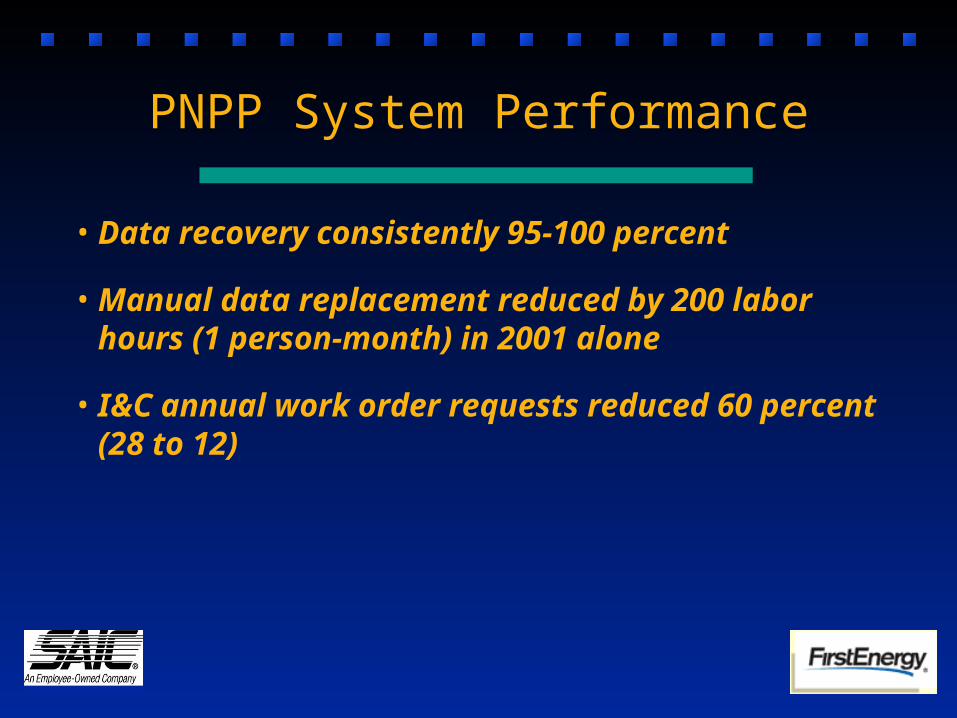
• Data recovery consistently 95-100 percent
• Manual data replacement reduced by 200 labor hours (1 person-month) in 2001 alone
• I&C annual work order requests reduced 60 percent (28 to 12)
PNPP System Performance

• Data recovery consistently 95-100 percent
• Manual data replacement reduced by 200 labor hours (1 person-month) in 2001 alone
• I&C annual work order requests reduced 60 percent (28 to 12)
• Capital equipment inventory/tracking reduced
PNPP System Performance

• Data recovery consistently 95-100 percent
• Manual data replacement reduced by 200 labor hours (1 person-month) in 2001 alone
• I&C annual work order requests reduced 60 percent (28 to 12)
• Capital equipment inventory/tracking reduced
• Validation software has identified every sensor /electronic problem since October 1999
PNPP System Performance

Summary

Summary
• Meteorological monitoring system that– validates data without elimination

Summary
• Meteorological monitoring system that– validates data without elimination– uses onsite conditions and climatology
Summary
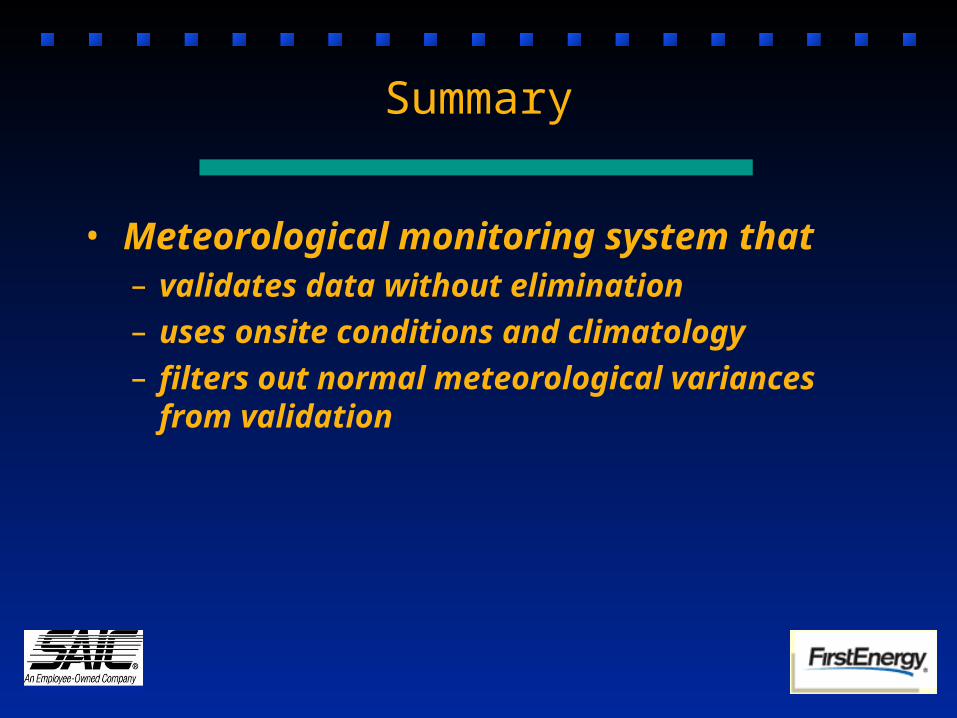
• Meteorological monitoring system that– validates data without elimination– uses onsite conditions and climatology– filters out normal meteorological variances
from validation

Summary
• Meteorological monitoring system that– validates data without elimination– uses onsite conditions and climatology– filters out normal meteorological variances
from validation– provides early notification to reviewer of
potential problems

Summary
• Meteorological monitoring system that– validates data without elimination– uses onsite conditions and climatology– filters out normal meteorological variances
from validation– provides early notification to reviewer of
potential problems– reduces Control Room interference/anxiety
Summary (continued)
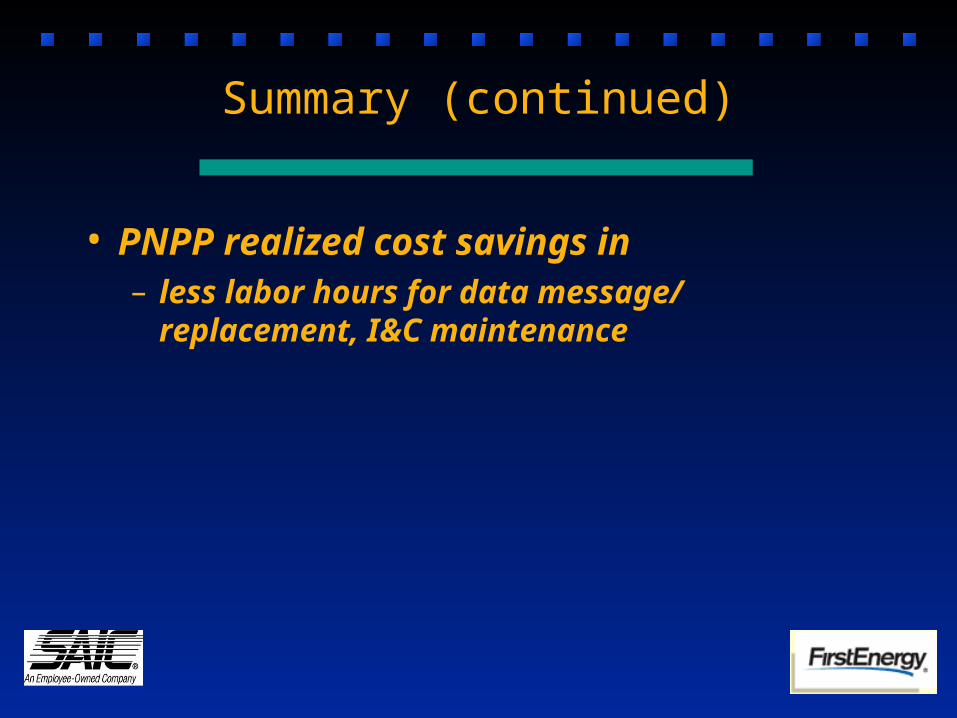
• PNPP realized cost savings in– less labor hours for data message/
replacement, I&C maintenance

Summary (continued)
• PNPP realized cost savings in– less labor hours for data message/
replacement, I&C maintenance– reduced capitol equipment/supplies

Summary (continued)
• PNPP realized cost savings in– less labor hours for data message/
replacement, I&C maintenance– reduced capitol equipment/supplies– 40 percent reduction in sensor refurbishment

Summary (continued)
• PNPP realized cost savings in– less labor hours for data message/
replacement, I&C maintenance– reduced capitol equipment/supplies– 40 percent reduction in sensor refurbishment
• PNPP has estimated that the system will nearly pay for itself within the first 3 years.

Summary (continued)
• PNPP realized cost savings in– less labor hours for data message/
replacement, I&C maintenance– reduced capitol equipment/supplies– 40 percent reduction in sensor refurbishment
• PNPP has estimated that the system will nearly pay for itself within the first 3 years.


![Science Applications International Corporation (SAIC ... · PDF fileScience Applications International Corporation (SAIC) [NYSE: SAIC] ... Science Applications International Corporation](https://static.fdocuments.in/doc/165x107/5ab54bee7f8b9a6e1c8ca2a2/science-applications-international-corporation-saic-applications-international.jpg)