A New, Simplified Accurate Method Determining Ejection ... · LAIR G. RIBEIRO, M.D., AND RICHARD R....
11
A New, Simplified and Accurate Method for Determining Ejection Fraction with Two-dimensional Echocardiography MIGUEL A. QUINONES, M.D., ALAN D. WAGGONER, R.D.M.S., LAWRENCE A. REDUTO, M.D., JEAN G. NELSON, R.D.M.S., JAMES B. YOUNG, M.D., WILLIAM L. WINTERS, JR., M.D., LAIR G. RIBEIRO, M.D., AND RICHARD R. MILLER, M.D. SUMMARY A new method to determine left ventricular (LV) ejection fraction (EF) with wide-angle, two- dimensional echocardiography (2-D echo) has been developed using the parasternal long-axis, apical four- chamber and apical long-axis views. End-diastolic and end-systolic measurements of LV short axes at the base and mid-LV cavity in the parasternal long-axis view and at the upper, middle and lower thirds of the cavity in the apical views are made, from which an averaged minor axis at end-diastole and at end-systole is calculated. Fractional shortening of the LV long axis (AL) is estimated from apical contraction. Satisfactory 2-D echoes were obtained in 55 of 58 nonselected patients (all three views in 32 patients, two views in 22 and one view in one); 42 of 55 patients had coronary artery disease. EF by 2-D echo was compared with EF by gated cardiac blood pool imaging in all patients (r = 0.927, SEE = 6.7%) and to EF by single-plane cineangiography (angio) in 35 of 55 patients (r = 0.913, SEE = 7.4%). LV dyssynergy was frequently present and involved the apex in 29 of 55 patients. Using angio as the standard for evaluating wall motion at the apex, 2-D echo was 100% sensitive and specific in detecting abnormal apical wall motion. We condude that EF can be determined accurately with 2-D echo in a large group of patients with and without dyssynergy by a simple method that eliminates the need for planimetry or computer assistance. DETERMINATIONS of left ventricular (LV) ejec- tion fraction (EF) by two-dimensional echocardiog- raphy (2-D echo) have required measurements of end-diastolic and end-systolic volumes by tracing the appropriate images and applying either the area- length method' or modifications of Simpson's rule.2B These methods have yielded variable results compared with angiography or radionuclide techniques.'-' We have developed a method for determining EF with 2-D echo by measuring several LV internal dimensions and modifying the area-length method. All measurements were obtained directly from the video playback with a pair of calipers. The calculations are easily made without computer assistance. Methods Fifty-eight patients (40 males and 18 females, mean age 47 years, range 19-75 years) in regular sinus rhythm were studied prospectively. All patients under- went 2-D and gated cardiac blood pool imaging within 24 hours of each other. Three patients had technically From the Section of Cardiology, Department of Medicine, Baylor College of Medicine, and the Methodist Hospital, Houston, Texas. Supported in part by grant HL-17269, National Heart, Lung and Blood Vessel Research and Demonstration Center, Baylor College of Medicine. Computational assistance was provided by the CLINFO Project, funded by grant RR-00350, Division of Research Resources, NIH. Presented in part at the 52nd Annual Scientific Sessions of the American Heart Association, November 1979, Anaheim, Califor- nia. Address for correspondence: Miguel A. Quinones, M.D., Section of Cardiology, MS. FIOOI, The Methodist Hospital, 6516 Bertner Boulevard, Houston, Texas 77030. Received May 9, 1980; revision accepted February 10, 1981. Circulation 64, No. 4, 1981. unsatisfactory 2-D echoes and were excluded from further analysis. The radionuclide studies were ade- quate for quantification of EF in all patients. Di- agnostic cardiac catheterization with single-plane, LV angiography was performed in 35 of 55 patients within 24 hours of the noninvasive procedures. The echo- cardiographic, radionuclide and angiographic studies were analyzed by independent observers. Among the 55 patients, 42 had coronary artery dis- ease, three had chronic aortic insufficiency, two had primary myocardial disease, two had mitral valve prolapse, one patient had calcific aortic stenosis, one had rheumatic mitral stenosis, and one had ascending aortic aneurysm; three patients had normal cardiac evaluations. Echocardiographic Measurement of EF Wide-angle 2-D echoes were obtained in each patient using a commercially available mechanical sector scan (Advanced Technology Laboratories Mark V). The scan head consists of three rotating 3- MHz piezoelectric crystals that are sequentially pulsed as they pass through a 900 sector. The frame rate of the system varies from 45.5 frames/sec at a scan depth of 5 cm to 18.5 frames/sec at a depth of 21 cm. The images are converted to digital format by a digital scan converter and presented in video format to the observer, allowing greater resolution and an enhanced gray scale. All studies were video-taped on a ¾h-inch Umatic video-cassette recorder (Panasonic VD-2600) interfaced to a back spacer search module (Dynasciences EJ-104 model 1), which allows frame- by-frame bidirectional playback. The video frame rate of the system is approximately 60 frames/sec. All patients were studied in the left lateral recum- 744 by guest on May 2, 2017 http://circ.ahajournals.org/ Downloaded from
Transcript of A New, Simplified Accurate Method Determining Ejection ... · LAIR G. RIBEIRO, M.D., AND RICHARD R....

A New, Simplified and Accurate Methodfor Determining Ejection Fraction
with Two-dimensional EchocardiographyMIGUEL A. QUINONES, M.D., ALAN D. WAGGONER, R.D.M.S., LAWRENCE A. REDUTO, M.D.,JEAN G. NELSON, R.D.M.S., JAMES B. YOUNG, M.D., WILLIAM L. WINTERS, JR., M.D.,
LAIR G. RIBEIRO, M.D., AND RICHARD R. MILLER, M.D.
SUMMARY A new method to determine left ventricular (LV) ejection fraction (EF) with wide-angle, two-dimensional echocardiography (2-D echo) has been developed using the parasternal long-axis, apical four-chamber and apical long-axis views. End-diastolic and end-systolic measurements of LV short axes at the baseand mid-LV cavity in the parasternal long-axis view and at the upper, middle and lower thirds of the cavity inthe apical views are made, from which an averaged minor axis at end-diastole and at end-systole is calculated.Fractional shortening of the LV long axis (AL) is estimated from apical contraction. Satisfactory 2-D echoeswere obtained in 55 of 58 nonselected patients (all three views in 32 patients, two views in 22 and one view inone); 42 of 55 patients had coronary artery disease. EF by 2-D echo was compared with EF by gated cardiacblood pool imaging in all patients (r = 0.927, SEE = 6.7%) and to EF by single-plane cineangiography (angio)in 35 of 55 patients (r = 0.913, SEE = 7.4%). LV dyssynergy was frequently present and involved the apex in 29of 55 patients. Using angio as the standard for evaluating wall motion at the apex, 2-D echo was 100% sensitiveand specific in detecting abnormal apical wall motion. We condude that EF can be determined accurately with2-D echo in a large group of patients with and without dyssynergy by a simple method that eliminates the needfor planimetry or computer assistance.
DETERMINATIONS of left ventricular (LV) ejec-tion fraction (EF) by two-dimensional echocardiog-raphy (2-D echo) have required measurements ofend-diastolic and end-systolic volumes by tracing theappropriate images and applying either the area-length method' or modifications of Simpson's rule.2BThese methods have yielded variable results comparedwith angiography or radionuclide techniques.'-' Wehave developed a method for determining EF with 2-Decho by measuring several LV internal dimensions andmodifying the area-length method. All measurementswere obtained directly from the video playback with apair of calipers. The calculations are easily madewithout computer assistance.
MethodsFifty-eight patients (40 males and 18 females, mean
age 47 years, range 19-75 years) in regular sinusrhythm were studied prospectively. All patients under-went 2-D and gated cardiac blood pool imaging within24 hours of each other. Three patients had technically
From the Section of Cardiology, Department of Medicine,Baylor College of Medicine, and the Methodist Hospital, Houston,Texas.
Supported in part by grant HL-17269, National Heart, Lung andBlood Vessel Research and Demonstration Center, Baylor Collegeof Medicine.
Computational assistance was provided by the CLINFO Project,funded by grant RR-00350, Division of Research Resources, NIH.
Presented in part at the 52nd Annual Scientific Sessions of theAmerican Heart Association, November 1979, Anaheim, Califor-nia.
Address for correspondence: Miguel A. Quinones, M.D., Sectionof Cardiology, MS. FIOOI, The Methodist Hospital, 6516 BertnerBoulevard, Houston, Texas 77030.
Received May 9, 1980; revision accepted February 10, 1981.Circulation 64, No. 4, 1981.
unsatisfactory 2-D echoes and were excluded fromfurther analysis. The radionuclide studies were ade-quate for quantification of EF in all patients. Di-agnostic cardiac catheterization with single-plane, LVangiography was performed in 35 of 55 patients within24 hours of the noninvasive procedures. The echo-cardiographic, radionuclide and angiographic studieswere analyzed by independent observers.Among the 55 patients, 42 had coronary artery dis-
ease, three had chronic aortic insufficiency, two hadprimary myocardial disease, two had mitral valveprolapse, one patient had calcific aortic stenosis, onehad rheumatic mitral stenosis, and one had ascendingaortic aneurysm; three patients had normal cardiacevaluations.
Echocardiographic Measurement ofEF
Wide-angle 2-D echoes were obtained in eachpatient using a commercially available mechanicalsector scan (Advanced Technology LaboratoriesMark V). The scan head consists of three rotating 3-MHz piezoelectric crystals that are sequentiallypulsed as they pass through a 900 sector. The framerate of the system varies from 45.5 frames/sec at ascan depth of 5 cm to 18.5 frames/sec at a depth of 21cm. The images are converted to digital format by adigital scan converter and presented in video format tothe observer, allowing greater resolution and anenhanced gray scale. All studies were video-taped on a¾h-inch Umatic video-cassette recorder (PanasonicVD-2600) interfaced to a back spacer search module(Dynasciences EJ-104 model 1), which allows frame-by-frame bidirectional playback. The video frame rateof the system is approximately 60 frames/sec.
All patients were studied in the left lateral recum-
744
by guest on May 2, 2017
http://circ.ahajournals.org/D
ownloaded from
EF BY 2-D ECHO/Quinones et al.
End - Diastole End - Systole
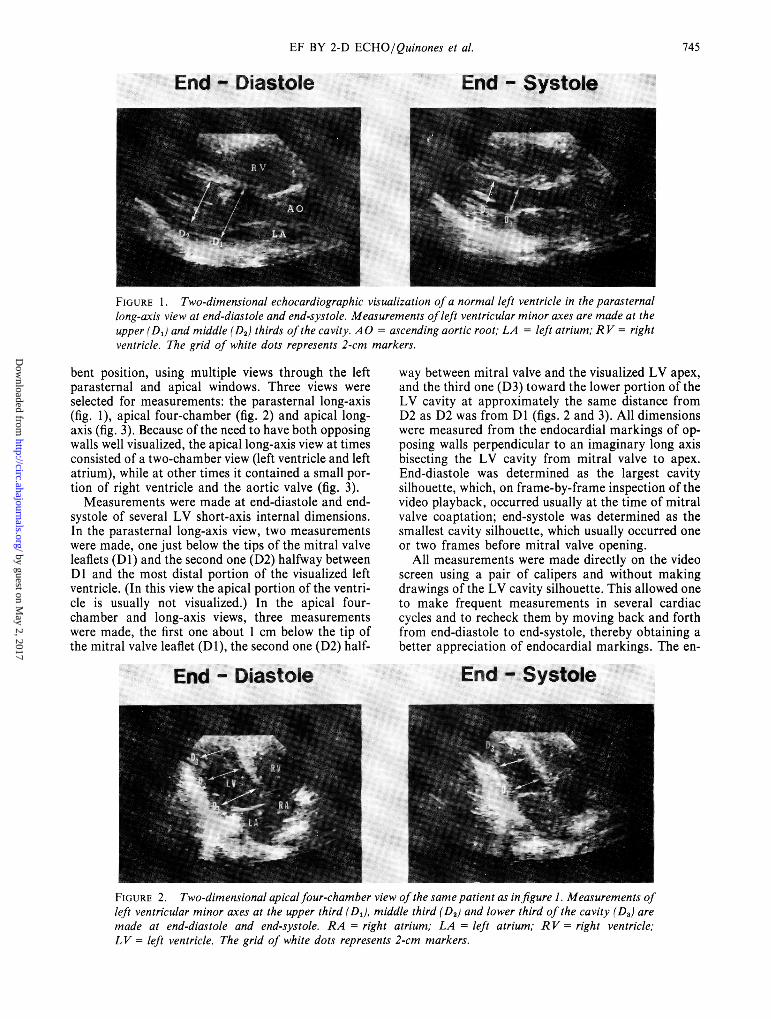
FIGURE 1. Two-dimensional echocardiographic visualization of a normal left ventricle in the parasternallong-axis view at end-diastole and end-systole. Measurements ofleft ventricular minor axes are made at theupper (D,) and middle (D2) thirds of the cavity. A O ascending aortic root; LA = left atrium; RV = rightventricle. The grid of white dots represents 2-cm markers.
bent position, using multiple views through the leftparasternal and apical windows. Three views wereselected for measurements: the parasternal long-axis(fig. 1), apical four-chamber (fig. 2) and apical long-axis (fig. 3). Because of the need to have both opposingwalls well visualized, the apical long-axis view at timesconsisted of a two-chamber view (left ventricle and leftatrium), while at other times it contained a small por-tion of right ventricle and the aortic valve (fig. 3).Measurements were made at end-diastole and end-
systole of several LV short-axis internal dimensions.In the parasternal long-axis view, two measurementswere made, one just below the tips of the mitral valveleaflets (D1) and the second one (D2) halfway betweenDl and the most distal portion of the visualized leftventricle. (In this view the apical portion of the ventri-cle is usually not visualized.) In the apical four-chamber and long-axis views, three measurementswere made, the first one about 1 cm below the tip ofthe mitral valve leaflet (D1), the second one (D2) half-
way between mitral valve and the visualized LV apex,and the third one (D3) toward the lower portion of theLV cavity at approximately the same distance fromD2 as D2 was from D1 (figs. 2 and 3). All dimensionswere measured from the endocardial markings of op-posing walls perpendicular to an imaginary long axisbisecting the LV cavity from mitral valve to apex.End-diastole was determined as the largest cavitysilhouette, which, on frame-by-frame inspection of thevideo playback, occurred usually at the time of mitralvalve coaptation; end-systole was determined as thesmallest cavity silhouette, which usually occurred oneor two frames before mitral valve opening.
All measurements were made directly on the videoscreen using a pair of calipers and without makingdrawings of the LV cavity silhouette. This allowed oneto make frequent measurements in several cardiaccycles and to recheck them by moving back and forthfrom end-diastole to end-systole, thereby obtaining abetter appreciation of endocardial markings. The en-
End - Diastole End systole
FIGURE 2. Two-dimensional apicalfour-chamber view of the same patient as infigure 1. Measurements ofleft ventricular minor axes at the upper third (D1, middle third (D2) and lower third of the cavity (D,) aremade at end-diastole and end-systole. RA = right atrium; LA = left atrium; RV - right ventricle;L V - left ventricle. The grid of white dots represents 2-cm markers.
745
by guest on May 2, 2017
http://circ.ahajournals.org/D
ownloaded from

VOL 64, No 4, OCTOBER 1981
End - Diastole End - Systole
FIGURE 3. Two-dimensional apical long-axis view of the same patient as infigure 1. Measurements ofleftventricular (L V) minor axes at the upper third (DJ, middle third (D2) and lower third of the cavity (D,3) aremade at end-diastole and end-systole. A 0 = ascending aortic root; LA = left atrium; L V = left ventricle.The grid of white dots represents 2-cm markers.
tire process of measuring dimensions could be usuallyperformed in about 5 minutes. An LV minor axis atend-diastole and at end-systole was derived by averag-ing the end-diastolic and the end-systolic LV dimen-sions measured from all the views, respectively.LV volumes may be measured using a simplifica-
tion of the ellipsoidal formula as
7r/6 X D2XL (1)
where D the LV minor axis and L = the LV longaxis. EF (Ved - Ves)/Ved, so EF may be mea-sured as
7r/6[Ded2 X Led) - (Des2 X Les)] (2)7r/6 (Ded2>X Led)
where Ded = LV minor axis at end-diastole,Led = LV long axis at end-diastole, Des = LV minoraxis at end-systole, and Les = LV long axis at end-systole.
Equation 2 may be algebraically converted into
(Ded2- Des2) +1r (Ded2- Des2) 1Ded2 J (Ded2)
[(Led- Les)1 X lO (3)L Led X10(3
Equation 3 expresses EF as a function of two com-ponents, one representing the fractional shortening ofthe square of the minor axis (%AD2) and one the frac-tional shortening of the long axis (%AL). Thus, equa-tion 3 may be expressed as
(%AD2) + [(1 - %AD2) (%AL)] (4)
Conventionally, the LV minor axis is determinedangiographically by planimetry of the area (A) of theLV cavity as D = 4 A/irL.i This is done to enhancethe accuracy of the measurements, particularly in the
presence of LV dyssynergy. In the present study, theLV minor axis was derived by averaging all of the up-per, middle and lower LV dimensions obtained fromthe multiple tomographic views. In doing this, weassumed that the fractional shortening of thisaveraged minor axis would be representative of thefractional shortening of the true minor axis. Thisassumption was tested angiographically.
In our experience, the long axis of the left ventriclecannot be consistently measured at end-diastole andend-systole with 2-D echo because of dropout of endo-cardial echoes at the apex, the depth required to seethe entire left ventricle from apex to base frequentlydoes not allow precise definition of endocardial wallmotion at the apex, and the apical views needed todetermine the length of the long axis frequently fore-shorten the left ventricle. Therefore, we elected to es-timate the fractional shortening of the long axis(%AL) from a subjective assessment of apical wallmotion using the apical views at short scan depths (5or 7 cm) to better visualize the motion of the apex. Indoing this, we assumed that shortening of the long axisis primarily dependent on contraction of the apex andelected to ignore any contribution arising from down-ward motion of the base. Based on previous reports ofnormal values for fractional shortening of the long ax-is,5' 6 we assigned a value of 15% for %zAL when nor-mal apical contraction was present. Following thereasoning that depressed apical motion should reducethe shortening of the long axis, the following valuesfor %AL were empirically assigned when abnormalapical wall motion was observed (wall motionclassified as the more abnormal of the two apicalviews): +5% when apex appeared hypokinetic; 0 whenapex appeared akinetic; -5% when apex appearedslightly dyskinetic; and -10% when apex appearedfrankly dyskinetic. Figure 4 illustrates the measure-ment and calculation of EF in a patient with abnormalLV function.The interobserver variability of the method was
assessed in 30 of 55 studies by two investigators who
746 CIRCULATION
by guest on May 2, 2017
http://circ.ahajournals.org/D
ownloaded from

EF BY 2-D ECHO/Quinones et alt
Parasternal Long Axis Apical 4-Chamber Apical Long Axis
Average Ded = 5.6cmAverage Des - 4.9cm
Estimated % A L = -10%%EF=(23%+a(77%) (-1O%)=15%
FIGURE 4. Two-dimensional echocardiogram from a patient with a large apical aneurysm illustrating themeasurements ofleft ventricular minor axes and the calculation ofejection fraction (EF). Notice the normalshortening ofthe minor-axis dimension at the upper third ofthe left ventricle in contrast to thepoor shorten-ing of the other dimensions. A veraging the dimensions and applying equation 2 (with an estimated long-axisshortening [1/%ALJ of - 10%) resulted in a calculated EF of15%. EF by gated cardiac bloodpool imaging was16%. Ded and Des = averaged end-diastolic and end-systolic dimensions: %AL = fractional shortening ofthe long axis. The grid of white dots represents 2-cm markers.
interpreted the same study and measured the EF in-dependent of each other. Intraobserver variability wasevaluated by one of the investigators repeating themeasurements in 20 of 55 studies selected at randomat least 1 month after his first interpretation and with-out knowledge of his first measurements. To assess thereproducibility of the method, 15 additional patients(four normal, nine with coronary artery disease andLV dyssynergy and two with cardiomyopathy) werestudied in two consecutive mornings. All 30 tapes werecoded and given randomly to an investigator to inter-pret and measure the EF.A conventional M-mode echocardiogram was ob-
tained in each patient and when technically suitable,shortening fraction was calculated using standardtechniques.7
Radionuclide Measurement of EF
Gated cardiac blood pool imaging was selected asthe principal standard in this study because of its es-tablished accuracy compared with angiographic tech-niques,'-" and because of its relative independencefrom geometric assumptions. The studies were per-formed in all 55 patients with 5 mg of i.v. stannouspyrophosphate, followed 10-15 minutes later by20-35 mCi of i.v. technetium pertechnetate for invivo labeling of red blood cells. Cardiac imaging wasperformed 5-10 minutes later in a 450 left anterioroblique view with a 15° caudal tilt using a small fieldof view Ohio Nuclear camera with a dedicated com-
puter. Acquisition generally took 6-10 minutes andyielded counts greater than 300,000 per frame. EF wasmeasured as
(end-diastolic counts) - (end-systolic counts) X 100(end-diastolic counts) (5)
Angiographic Measurement of EF
Single-plane LV angiograms were obtained in 35 of55 patients in the 30° right anterior oblique projec-tion with the injection of 40-50 ml of Renografin 76 ata flow rate of 10-15 ml/sec. The LV silhouette wastraced at end-diastole (largest cavity size) and at end-systole (smallest cavity size) and EF was measured bythe single-plane modification of the area-lengthmethod.4 Only beats in sinus rhythm not preceded by apremature contraction were used for analysis. In addi-tion, a subjective assessment of wall motion at theapex (normal, hypokinetic, akinetic or dyskinetic) wasmade.The LV angiograms from 20 of 35 patients (five
normal subjects and 15 with LV dyssynergy) wereused to test the assumption that the average of the up-per, middle and lower LV minor axis dimensions atend-diastole and end-systole provided a measurementof the fractional shortening of the minor axis. Thelong axis of the ventricle was quadrisected by threeequidistant short axes drawn perpendicular to the longaxis. The average of these minor axes at end-diastoleand end-systole was compared to the respective minor
EndSystole
747
by guest on May 2, 2017
http://circ.ahajournals.org/D
ownloaded from
VOL 64, No 4, OCTOBER 1981
axis determined by planimetry (minor axis = [LVarea X 4]/[ir X L]).
Statistical Analysis
Statistical correlation between methods were madeusing linear regression analysis. Chi-square analysiswas used to compare the subjective assessment of wallmotion at the apex by 2-D echo vs angiography.
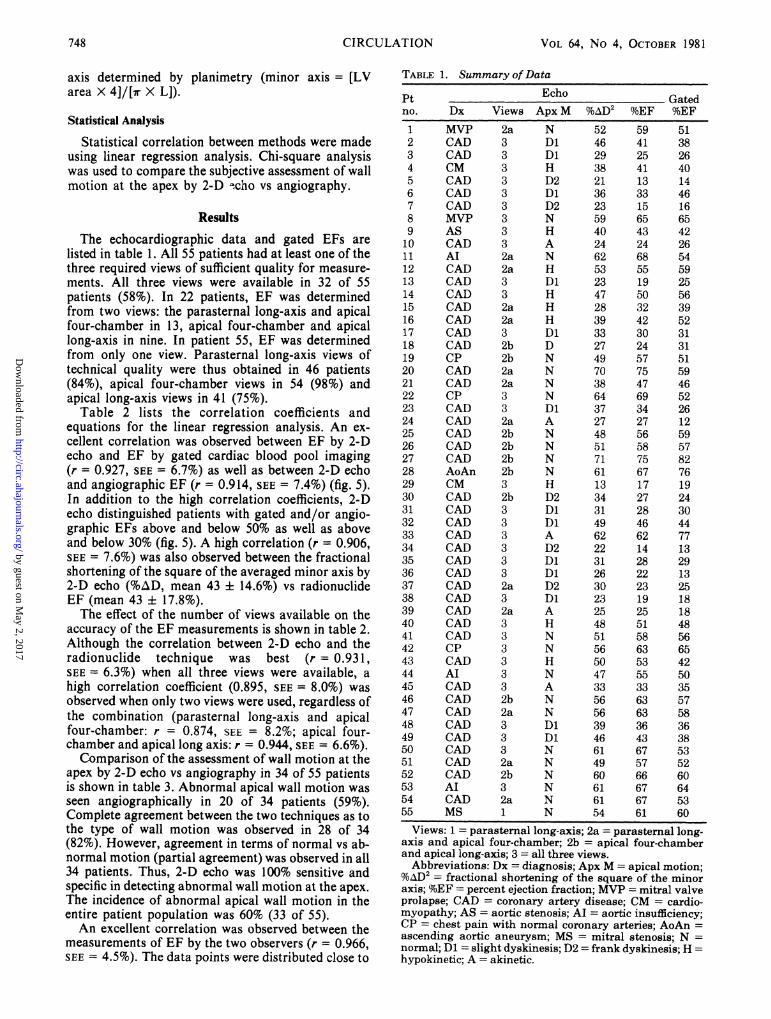
ResultsThe echocardiographic data and gated EFs are
listed in table 1. All 55 patients had at least one of thethree required views of sufficient quality for measure-ments. All three views were available in 32 of 55patients (58%). In 22 patients, EF was determinedfrom two views: the parasternal long-axis and apicalfour-chamber in 13, apical four-chamber and apicallong-axis in nine. In patient 55, EF was determinedfrom only one view. Parasternal long-axis views oftechnical quality were thus obtained in 46 patients(84%), apical four-chamber views in 54 (98%) andapical long-axis views in 41 (75%).Table 2 lists the correlation coefficients and
equations for the linear regression analysis. An ex-cellent correlation was observed between EF by 2-Decho and EF by gated cardiac blood pool imaging(r = 0.927, SEE = 6.7%) as well as between 2-D echoand angiographic EF (r = 0.914, SEE = 7.4%) (fig. 5).In addition to the high correlation coefficients, 2-Decho distinguished patients with gated and/or angio-graphic EFs above and below 50% as well as aboveand below 30% (fig. 5). A high correlation (r = 0.906,SEE = 7.6%) was also observed between the fractionalshortening of the square of the averaged minor axis by2-D echo (%WD, mean 43 ± 14.6%) vs radionuclideEF (mean 43 ± 17.8%).The effect of the number of views available on the
accuracy of the EF measurements is shown in table 2.Although the correlation between 2-D echo and theradionuclide technique was best (r = 0.931,SEE = 6.3%) when all three views were available, ahigh correlation coefficient (0.895, SEE = 8.0%) wasobserved when only two views were used, regardless ofthe combination (parasternal long-axis and apicalfour-chamber: r = 0.874, SEE - 8.2%; apical four-chamber and apical long axis: r = 0.944, SEE = 6.6%).Comparison of the assessment of wall motion at the
apex by 2-D echo vs angiography in 34 of 55 patientsis shown in table 3. Abnormal apical wall motion wasseen angiographically in 20 of 34 patients (59%).Complete agreement between the two techniques as tothe type of wall motion was observed in 28 of 34(82%). However, agreement in terms of normal vs ab-normal motion (partial agreement) was observed in all34 patients. Thus, 2-D echo was 100% sensitive andspecific in detecting abnormal wall motion at the apex.The incidence of abnormal apical wall motion in theentire patient population was 60% (33 of 55).An excellent correlation was observed between the
measurements of EF by the two observers (r = 0.966,SEE - 4.5%). The data points were distributed close to
TABLE 1. Summary of Data
Pt Echo Gatedno. Dx Views Apx M %AD2 %EF %EF1
23456789101112131415161718
19202122232425262728293031323334353637383940414243444546474849505152535455
MVPCADCADCM
CADCADCADMVPASCADAICADCADCADCADCADCADCADCPCADCADCPCADCADCADCADCADAoAnCM
CADCADCADCADCADCADCADCADCADCADCADCADCPCADAICADCADCADCADCADCADCADCADAICADMS
2a3333333332a2a332a2a32b2b2a2a332a2b2b2b2b32b3333332a32a3333332b2a3332a2b32a1
NDlDlHD2DlD2NHANHDIHHHDIDNNNNDlANNNNHD2DlDIAD2DlDlD2DlAHNNHNANNDlDINNNNNN
52462938213623594024625323472839332749703864372748517161133431496222312630232548515650473356563946614960616154
59412541133315654324685519503242302457754769342756587567172728466214282223192551586353553363633643675766676761
51382640144616654226545925563952313151594652261259578276192430447713291325181848566542503557583638535260645360
Views: 1 = parasternal long-axis; 2a = parasternal long-axis and apical four-chamber; 2b = apical four-chamberand apical long-axis; 3 = all three views.Abbreviations: Dx = diagnosis; Apx M = apical motion;
%AD2 = fractional shortening of the square of the minoraxis; %EF = percent ejection fraction; MVP = mitral valveprolapse; CAD = coronary artery disease; CM = cardio-myopathy; AS = aortic stenosis; AI= aortic insufficiency;CP = chest pain with normal coronary arteries; AoAn =ascending aortic aneurysm; MS = mitral stenosis; N =normal; Dl = slight dyskinesis; D2 frank dyskinesis; H =hypokinetic; A = akinetic.
748 CIRCULATION
by guest on May 2, 2017
http://circ.ahajournals.org/D
ownloaded from

EF BY 2-D ECHO/Quinones et al.
TABLE 2. Important Linear Regression AnalysisVariable x vs y n r EquationEF 2Dvs G 55 0.927 y=0.9x +3.0EF 2D vs A 35 0.914 y = 0.85x + 7.1EF 2D (3 views) vs G 32 0.931 y = 0.9x + 3.17EF 2D (2 views) vs G 22 0.895 y = 0.9x + 2.79EF 2D (2a) vs G 13 0.874 y = 0.78x + 5.85EF 2D (2b) vs G 9 0.944 y = 1.Ox + 0.67%WID 2D vs G 55 0.906 y = 1.1x - 4.51EF Observer 2 vs 1 30 0.966 y = 0.96x - 0.65Ded Observer 2 vs 1 30 0.849 y = 0.82x + 1.02Des Observer 2 vs 1 30 0.909 y = 0.87x + 0.60%zID Observer 2 vs 1 30 0.930 y = 0.92x + 2.26EF 2nd observation vs 1st 20 0.976 y = 0.94x + 4.6EF 2nd study vs 1st study 15 0.977 y = 1.04x - 3.68Angio Ded Average vs planimetry 20 0.993 y = 1.06x - 0.248Angio Des Average vs planimetry 20 0.996 y = 1.06x + 0.249Angio %AD Average vs planimetry 20 0.990 y = 0.84x + 1.99Angio %AD Average vs planimetry 20 0.985 y = 0.88x + 2.34Abbreviations: Ded = left ventricular minor axis at end-diastole; Des = left ventricular minor axis at
end-systole; Angio = angiographic; others as in table 1.
the line of identity, as depicted by the slope of 0.96 andthe small intercept (-0.65) in the regression equation.Although EF by the second observer tended to beslightly greater than by the first observer, the meandifference between the two was only 2% and of noclinical significance, as shown in figure 6B. The in-terobserver variability appeared to be greater for theabsolute dimensions (averaged at end-diastole:observer 1 = 4.94 ± 1.0 cm, observer 2 = 4.81 ± 1.0cm, r = 0.849, SEE = 0.56 cm, averaged at end-
A801-
0 .
601-
EF (%) 40Gated
201-
* S.*-
*. *
5 0*
systole: observer 1 = 3.75 ± 1.10 cm, observer2 = 3.61 ± 1.15 cm, r = 0.909, SEE = 0.49 cm).thanfor the fractional shortening of the square of thedimensions (%AD2: observer 1 = 43.8 ± 13%,observer 2 = 45.3 ± 13.2%, r = 0.930, SEE = 4.9%) orEF. Both observers agreed on the type of apical wallmotion in 30 of 32 patients (94%); the two disagree-ments resulted in insignificant differences in EF.
In a similar manner, an excellent intraobservervariability was observed in the 20 randomly selected
B801-
601-
EF (%) 40Angio
r = 0.927, n = 55SEE= 6.7
20 -
*g. :
*1 .
.
r= 0.914, n= 35SEE= 7.4
I I A
0 20 40 60 80 0 20 40 60 80
EF(%) EF (%)2-D Echo 2-D Echo
FIGURE 5. Correlation of ejection fraction (EF) by two-dimensional echocardiography (2-D echo) withgated cardiac blood pool imaging (gated) (A) and with single-plane cineangiography (angio) (B). Two-dimensional echo vs gated: y = 0.90x + 3.0; 2-D echo vs angio: y = 0.95x + 7.1. Cross bars are drawn at50O% and 30%.
I
749
I I I I I I
by guest on May 2, 2017
http://circ.ahajournals.org/D
ownloaded from

VOL 64, No 4, OCTOBER 1981
TABLE 3. Apical Wall Motion: Two-dimensional Echo-cardiography vs Angiocardiography
LV angiographyHypo- Dys-
2-D echo Normal kinetic Akinetic kinetic TotalNormal 14 14Hypokinetic 3 1 4Akinetic 4 1 5Dyskinetic 3 1 7 11Total 14 6 6 8 34
patients (table 2, fig. 7). The first observation cor-related with the second one (r = 0.976, SEE = 4.4%).The mean difference between the two observations was2%.
Table 4 lists the EFs measured from two consecu-tive studies in 15 patients performed to determine thereproducibility of the technique. The close agreementbetween the two studies is demonstrated by the lack ofstatistical difference between the means (47.5% vs45.9%), the high correlation coefficient (r = 0.977),and the low standard error (SEE ± 3.2%).Measurements of shortening fraction by M-mode
echo were possible in 45 of 55 patients (82%). In 10patients the M-mode studies were of suboptimalquality and did not allow standard measurements ofLV dimensions. Although a significant correlation(p < 0.001) was observed between M-mode shorten-ing fraction and EF by gated cardiac blood pool imag-ing, the correlation coefficient was only 0.732(SEE = 12.2%).
A
80 _
60 -
EF (%)2-D Echo 40_Observer 1
20
80
60 [
EF(%)2-D Echo
1st Observation40 [
20 [
0
r=0. 976, n=20SEE=4. 4y=0. 942x +4. 6
20EF(%)
2-D Echo-2nd Observation
FIGURE 7. Intraobserver comparison of ejection fraction(EF) by two-dimensional echocardiography (2-D echo) in 20patients. The line drawn represents the line of identity.
In 20 angiograms, measurements of the LV minoraxis by averaging dimensions from the upper, middleand lower thirds of the cavity compared well with theminor axis determined by planimetry both at end-diastole (r = 0.993) as well as at end-systole(r = 0.996) (table 2). Likewise, an excellent correla-tion was observed between the fractional shortening ofthe averaged minor axis and the fractional shorteningof the planimetered minor axis (r = 0.990), as well asbetween %AD2 averaged vs planimetry (r = 0.985).
B
0
0
r= 0.966, n= 30SEE= 4.5y = 0.96 x -0.65
EF (%)Gated
EF (%)Gated
8'
64
44
24
Observer 1
Observer 2U
0.
* r= 0.9410 * SEE= 5.9
,, , .,-ja0 20 40 60 80 0 20 40 60 80
EF (%) EF (%)2-D Echo 2-D EchoObserver 2
FIGURE 6. (A) Comparison of two-dimensional echocardiographic (2-D echo) ejection fractions (EF)determined by two independent observers from the same videotape in 30 patients. The line drawn representsthe line of identity. (B) Correlation ofEF by each observer with EF by gated cardiac blood pool imaging.
750 CIRCULATION
n _
by guest on May 2, 2017
http://circ.ahajournals.org/D
ownloaded from

EF BY 2-D ECHO/Quinones et al.
TABLE 4.Fraction
Reproducibility of Two-dimensional Ejection
Ejection Fraction (%)Pt 1st Study 2nd Study1 47 412 55 553 47 424 42 455 63 586 41 437 40 438 46 469 57 5310 63 6611 67 6412 34 3013 17 1214 27 2315 66 67Mean 47.5 45.9± SD 14.7 15.7
First study (y) vs second study (x): r = 0.977; y = 1.04x-3.68; standard error = 3.2%.
DiscussionThe development of 2-D echo has raised new expec-
tations and hopes of improving the accuracy of echo-cardiography in quantitating LV function. Thecapacity of 2-D echo to visualize the left ventricle inmultiple tomographic planes vs the single "ice-pick"view of the M-mode echocardiogram shouldtheoretically lead to improved assessment of LV func-tion, particularly in the presence of regionaldyssynergy. Although studies in animals'2-'4 or withLV casts'5' 16 have established the accuracy of 2-Decho in quantitating ventricular volumes and mass,results using similar methods in patients have beendisappointing. All clinical studies have demonstratedconsistent underestimation of end-diastolic and end-systolic volumes by 2-D echo compared withangiography.18' 16, 17 Comparison of EF derived fromthese volumes to the angiographic or radionuclidestandards have yielded satisfactory but not excellentresults.2' a, 16The principal limitations of 2-D echo in the clinical
quantification of LV volumes and function appear tobe related to loss of image quality by dropout ofechoes from the endocardium and to foreshortening ofthe LV cavity in the apical views, probably because thetomographic plane of the 2-D echo does not alwaystransect the center of the LV cavity from apex to base.A second practical limitation relates to the amount oftime required to properly trace images for planimetryand the dependency of most methods on computerassistance, which limits the widespread application ofthe technique to clinical practice. The recognition ofthese limitations recently led Beeder and associates'`
to develop an indirect method for quantitating LVfunction in coronary artery disease by determining thepercentage of normally contracting myocardium fromapical views and relating this value to radionuclideEF.
In the present investigation, we evaluated a new-and simplified method of quantitating LVEF. Theresults with this method compare extremely well witha radionuclide technique, which is independent ofLV geometry, as well as with single-plane angiog-raphy, over a wide range of EFs and in the presence ofregional dyssynergy. The method obviates the need forplanimetry of the LV cavity or the use of complicatedmathematical models. In addition, measurements ofEF may be repeated on the same videotape by a sec-ond observer or by the first observer with excellentreproducibility. The same results can be reproducedon repeated examinations.The greatest contribution of this new method,
perhaps, relates to the frequency with which it can beused. The nonselectivity of the patient population isemphasized by the large number of patients (18%) inwhom standard M-mode echo measurements ofshortening fraction could not be made properly. In thepresent study, 55 of 58 patients (95%) could be mea-sured; 54 of 55 with at least two separate views.Although results appeared to be more accurate whenall three views were available, the correlation withradionuclide EF remained high when only two viewswere used. Patient 55, in whom only the parasternalview was obtainable (table 1), had mitral stenosis witha small, normal left ventricle, much of which could bevisualized with the parasternal view. In general, asingle parasternal view should not be expected toprovide accurate results in the presence of regionaldyssynergy.The rationale for the method described in this in-
vestigation is as follows: First, the appreciation ofendocardial motion is frequently better when the im-ages are in motion than on standstill. By combiningvisual inspection of the images in motion with aselected still frame, a trained observer can follow theinner motion of the endocardial surfaces, and thus,measure an internal LV minor axis dimension. Thismay be accomplished more easily than outlining theentire endocardial surface of the cavity.
Second, LVEF is primarily dependent on the frac-tional shortening of the square of the minor axis. Thecontribution of long-axis shortening to EF is only3-7% (equation 2), and thus explains the excellent cor-relation observed in this study between %ID2 andradionuclide EF despite the frequent occurrence ofapical dyssynergy. Also in support of this concept isthe well-established accuracy of M-mode echo-cardiography in deriving EF from the fractionalshortening of the LV dimension in the absence ofregional dyssynergy.7, 19-21
Third, small errors or differences in absolute mea-surements of the LV dimensions at end-diastole andend-systole may cancel each other and result in onlyminor differences in fractional shortening. Analysis of
751
by guest on May 2, 2017
http://circ.ahajournals.org/D
ownloaded from

VOL 64, No 4, OCTOBER 1981
the measurements made by the two independentobservers supports this concept; although some dis-crepancy (and, thus, lower correlation) was seenbetween the two observers' measurement of end-diastolic and end-systolic dimensions, an excellentcorrelation was found between the measurement of%AD2 and EF by the two observers.
Fourth, the present method assumes that the frac-tional change from end-diastole to end-systole of anaverage of the minor axes at the upper, middle andlower thirds of the LV cavity is representative of thefractional change of the true minor axis measured byplanimetry. This is especially important in thepresence of regional dyssynergy, particularly at theapex (a single measurement of the LV minor axis atmidcavity is sufficient in the presence of normal ordiffusely abnormal wall motion, as indicated byprevious work with M-mode and angiographicstudies7' 22, 28). We tested this assumption in 20 single-plane LV angiograms that showed various degrees ofdyssynergy and found an excellent correlation betweenthe fractional shortening (as well as the absolute mea-surements) of the planimetered minor axis and frac-tional shortening of the averaged minor axis. Thus,averaging multiple minor axes appears to be areasonable substitute for planimetry of LV area todetermine of the true minor axis.
Finally, our method assumes that fractionalshortening of the long axis results primarily from con-traction of the apex and that this index may be es-timated from visual assessment of apical wall motion.Comparison with angiography revealed that 2-D echowas 100% sensitive and specific in detecting normal vsabnormal wall motion at the apex; differences betweenthe two techniques related only to the degree of abnor-mality. In addition, a 94% agreement was foundbetween two observers' classification of apical wallmotion. The normal value selected for long-axisshortening based on apical wall motion (15%), wasderived from review of previous reports on normalfractional shortening of the long axis.6' 6 Given theconcept that apical contraction represents the majorsource of long-axis shortening, the logical step thatfollowed was to assign empirically a modest value of5% to long-axis shortening in the presence of apicalhypokinesis, a value of 0 in the presence of akinesisand a small negative value (implying systolic lengthen-ing) in the presence of dyskinesis.The overall contribution of long-axis shortening to
EF is small (3-7%) and, therefore, potential errors inestimating its true value from apical wall motion willgenerally lead to minor errors in measuring EF. Infact, ignoring this factor altogether by using %ADD2alone resulted in only a small fall in the correlationcoefficient between echo and gated EF (0.927 to0.906). This should not imply that this factor may beneglected without losing some accuracy. The long-axisshortening derived from apical wall motion broughtthe EF measurement by 2-D echo closer to theradionuclide EF in 34 of 55 patients, while in only four(patients 6, 13, 18 and 43) did it produce a discrepancy
between echo and gated wall motion of meaningfulclinical significance (table 1). The example in figure 4of patient 7 (table 1) with frank dyskinesis is illustra-tive of the contribution of the apical component to themeasurement of EF. The fractional shortening of thesquare of the averaged minor axis was 23%. Applyinga factor of -10% for long-axis shortening resulted in acalculated EF of 15%. EF by gated cardiac blood poolimaging in this patient was 16%.
In summary, the present method of quantitating EFprovides results equivalent to those obtained byradionuclide or angiographic techniques with excellentreproducibility. The technique is applicable to a large,nonselected clinical population of patients with coro-nary artery disease. However, the method is directedat measuring relative changes and does not attempt toquantitate absolute ventricular volumes.
References1. Carr KW, Engler RL, Forsythe JR, Johnson AD, Gosink B:
Measurement of left ventricular ejection fraction by mechanicalcross-sectional echocardiography. Circulation 59: 1196, 1979
2. Schiller NB, Acquatella H, Ports TA, Drew D, Goerke J,Ringertz H, Silverman NH, Brundage B, Botvinick EH,Boswell R, Carlsson E, Parmley WW: Left ventricular volumefrom paired biplane two-dimensional echocardiography. Cir-culation 60: 547, 1979
3. Folland ED, Parisi AF, Moynihan PF, Jones DR, Feldman CL,Tow DE: Assessment of left ventricular ejection fraction andvolumes by real time, two-dimensional echocardiography. Cir-culation 60: 760, 1979
4. Kasser IS, Kennedy JW: Measurement of left ventricularvolumes in man by single-plane cineangiocardiography. InvestRadiol 4: 86, 1969
5. Cavett JW: Mechanics of contraction in the intact heart. InBiomechanics, edited by Fund RC, Penon N, Anliber M.Englewood Cliffs, NJ, Prentice-Hall, 1972, p 289
6. Herman MV, Heinle RA, Klein MD, Gorlin R: Localized dis-orders in myocardial contraction: asynergy and its role in con-gestive heart failure. N Engl J Med 277: 222, 1967
7. Quinones MA, Pickering E, Alexander JK: Percentage ofshortening of the echocardiographic left ventricular dimension:its use in determining ejection fraction and stroke volume.Chest 74: 59, 1978
8. Burow RD, Strauss HW, Singleton R, Pond M, Rehn T, BaileyIK, Griffith LC, Nickoloff E, Pitt B: Analysis of left ventric-ular function from multiple gated acquisition cardiac bloodpool imaging. Circulation 56: 1024, 1977
9. Folland ED, Hamilton GW, Larson SM, Kennedy JW,Williams DL, Ritchie JL: The radionuclide ejection fraction: acomparison of three radionuclide techniques with contrastangiography. J Nucl Med 18: 1159, 1977
10. Wackers FJT, Berger JH, Johnstone DE, Goldman L, RedutoLA, Langou RA, Gottschalk A, Zaret BL: Multiple gated car-diac blood pool imaging for left ventricular ejection fraction:validation of technique and assessment of variability. Am JCardiol 43: 1159, 1979
11. Reduto LA, Lawrie GM, Reid JW, Whissenand HH, NoonGP, Kanon D, DeBakey ME, Miller RR: Sequential postoperative assessmnent of left ventricular performance with gatedcardiac blood pool imaging following aorto coronary bypasssurgery. Am Heart J 101: 59, 1981
12. Eaton LW, Maughan WL, Shoukas AA, Weiss JL: Accuratevolume determination in the isolated ejecting canine left ventri-cle by two-dimensional echocardiography. Circulation 60: 320,1979
13. Wyatt HL, Heng MK, Meerbaum S, Hestenes JD, Cobo JM,Davidson RM, Corday E: Cross-sectional echocardiography. 1.Analysis of mathematical models for quantifying mass of the
752 CIRCULATION
by guest on May 2, 2017
http://circ.ahajournals.org/D
ownloaded from

SERVO METHOD FOR BP DETERMINATION/Aaslid and Brubakk
left ventricle in dogs. Circulation 60: 1104, 197914. Eaton LW, Maughan WL, Weiss JL: Accurate volume deter-
mination in the isolated ejecting canine heart from a limitednumber of two-dimensional echocardiographic cross-sections.(abstr) Am J Cardiol 45: 470, 1980
15. Helak J, Reichek N, Pearlman E, Weber K, Pietra G, KastorJA: Quantitation of human left ventricular mass and volume bycross-sectional echocardiography: in vitro anatomic validation.(abstr) Am J Cardiol 45: 470, 1980
16. Bommer W, Chun T, Kwan OL, Neumann A, Mason DT,DeMaria AN: Biplane apex echocardiography versus biplanecineangiography in the assessment of left ventricular volumeand function: validation by direct measurements. (abstr) Am JCardiol 45: 471, 1980
17. Starling M, Crawford M, Levi B, Sorensen S, Richards K,O'Rourke R: Comparative efficacy of cross-sectional echocar-diography and gated equilibrium radionuclide angiography forassessing left ventricular size and performance (abstr). Am JCardiol 45: 403, 1980
18. Beeder C, Charuzi Y, Meerbaum S, Berman D, Staniloff H,
Davidson R, Corday E, Swan HJC: Cross-sectional echocar-diography: improved assessment of left ventricular function.(abstr) Circulation 60 (suppl II): II-26, 1979
19. Quinones MA, Gaasch WH, Alexander JK: Echocardio-graphic assessment of left ventricular function: with specialreference to normalized velocities. Circulation 50: 42, 1974
20. Schuler G, Peterson KL, Johnson AD, Francis G, Ashburn W,Dennish G, Daily PO, Ross J Jr: Serial non-invasive assess-ment of left ventricular hypertrophy and function after surgicalcorrection of aortic regurgitation. Am J Cardiol 44: 585, 1979
21. Linhart JW, Mintz GS, Segal BL, Kawai N, Kotler MN: Leftventricular volume measurement by echocardiography: fact orfiction. Am J Cardiol 36: 114, 1975
22. Greene DG, Carlisle R, Grant C, Bunnel IL: Estimation of leftventricular volume by one-plane cineangiography. Circulation35: 61, 1967
23. Cohn PF, Gorlin R, Adams DF, Chahine RA, Vokonas PS,Herman MV: Comparison of bi-plane and single plane left ven-triculograms in patients with coronary artery disease. Am JCardiol 33: 1, 1974
Accuracy of an Ultrasound Doppler Servo Methodfor Noninvasive Determination of Instantaneous
and Mean Arterial Blood PressureRUNE AASLID, PH.D., AND ALF 0. BRUBAKK, M.D.
SUMMARY A new noninvasive method for determining arterial blood pressure is presented. Using a fastservo system, the pressure in the arm cuff is controlled so that the flow is maintained at a low value.Transcutaneous ultrasound Doppler techniques are used to detect flow to the artery.
Comparison with invasive pressure measurements demonstrated that the servo method reproduced beat-to-beat variations in arterial blood pressure faithfully. Mean arterial blood pressure was determined from thenoninvasive recordings using the same mathematically valid procedure as was used for the invasive recordings.The deviation between the invasive and the noninvasive determinations of this measurement was -0.6 ± 2.2mm Hg (mean i SD) in 23 subjects.
ACCURATE DETERMINATION of arterial bloodpressure is frequently necessary for patient monitor-ing. It is also the basis for rational antihypertensivetherapy. A noninvasive method is usually preferredbecause it is more convenient and avoids the risksassociated with arterial puncture. Traditional indirectmethods use a slow deflation rate of the cuff, 2-4 mmHg per beat or per second. Therefore, information onthe blood pressure is obtained only intermittently.
In principle, it is possible to control the cuffpressure so that it is tracking the pressure inside theartery continuously. Then, the transmural pressureover the arterial wall will be zero or very lowthroughout the pulse wave. Thus, the arterial wall willbe maintained in an unloaded state, suspendedbetween two nearly equal pressures.
From the Department of Clinical Physiology, the University ofTrondheim, Trondheim, Norway.
Address for correspondence: Rune Aaslid, Ph.D., Avdeling forMedisinsk Teknikk, Rikshospitalet, Oslo 1, Norway.
Received August 28, 1980; revision accepted February 2, 1981.Circulation 64, No. 4, 1981.
Marey' proposed that this could be achieved bymaintaining a constant vascular volume in the limb.However, servo techniques were not developed in thenineteenth century, so he had to unload the arterialwalls by enclosing the forearm in a stiff chamber filledwith water. This method was not practical for clinicaluse. In recent years, Penaz et al.2 3 used the constantvascular volume principle to record the instantaneousblood pressure in the finger. The pressure in the fingercuff was under servo control to maintain a constantblood volume as detected by a photoplethysmographunder the cuff. However, it may be difficult or impossi-ble to use this approach when the cuff is on the upperarm.
Methods
We investigated another method for recording theinstantaneous arterial blood pressure: control cuffpressure so that flow in the artery is restricted at all in-stants. If the flow is restricted, the artery must be par-tially constricted under the cuff. When unaffected bycalcification, the wall of the artery is flexible. This
753
by guest on May 2, 2017
http://circ.ahajournals.org/D
ownloaded from

Ribeiro and R R MillerM A Quinones, A D Waggoner, L A Reduto, J G Nelson, J B Young, W L Winters, Jr, L G
two-dimensional echocardiography.A new, simplified and accurate method for determining ejection fraction with
Print ISSN: 0009-7322. Online ISSN: 1524-4539 Copyright © 1981 American Heart Association, Inc. All rights reserved.
is published by the American Heart Association, 7272 Greenville Avenue, Dallas, TX 75231Circulation doi: 10.1161/01.CIR.64.4.744
1981;64:744-753Circulation.
http://circ.ahajournals.org/content/64/4/744the World Wide Web at:
The online version of this article, along with updated information and services, is located on
http://circ.ahajournals.org//subscriptions/
is online at: Circulation Information about subscribing to Subscriptions:
http://www.lww.com/reprints Information about reprints can be found online at: Reprints:
document. Permissions and Rights Question and Answer information about this process is available in the
located, click Request Permissions in the middle column of the Web page under Services. FurtherEditorial Office. Once the online version of the published article for which permission is being requested is
can be obtained via RightsLink, a service of the Copyright Clearance Center, not theCirculationpublished in Requests for permissions to reproduce figures, tables, or portions of articles originallyPermissions:
by guest on May 2, 2017
http://circ.ahajournals.org/D
ownloaded from