A new pricing framework for Openreach
207
A new pricing framework for Openreach A new pricing framework for Openreach Annexes Statement Publication date: 22 May 2009
Transcript of A new pricing framework for Openreach

A new pricing framework for Openreach
A new pricing framework for Openreach
Annexes
Statement
Publication date: 22 May 2009

A new pricing framework for Openreach
1
Contents
Annex Page
1 Scope of consultation 2
2 Review of the relevant markets 9
3 Legal Instruments 29
4 Choice of cost standard 59
5 Implications of cost calculations for prices 81
6 Review of the financial evidence 93
7 Volume forecasts 152
8 Cost of Capital 157
9 Efficiency gains 177
10 Ancillary services treatment and related issues 195
11 Responses to this consultation 205
1
A new pricing framework for Openreach
Annex 1
1 Scope of consultation Introduction
A1.1 This Section provides a list of the LLU services provided by Openreach and sets out how they have been considered within the scope of this review.
A1.2 Openreach provides wholesale access services in which BT has SMP (WLR, LLU and Ethernet access) to all Communications Providers (including BT and its competitors) on an equivalent basis.
A1.3 With respect to the WLR and LLU services, Openreach operates under controls that were introduced following SMP determinations in the wholesale narrowband and broadband access market reviews conducted by Ofcom and Oftel. These include:
charge ceilings for the key LLU and WLR services;
cost orientation obligations for most of the remaining LLU and WLR services; and
broader SMP remedies requiring no undue discrimination, price publication and the public provision of audited regulatory accounts.
A1.4 In the consultations, we have divided the services provided by Openreach into four categories, as follows:
“Core Rental Services”, which include the WLR, MPF and SMPF rentals;
“Ancillary Services”, which include the related services in the markets where SMP has been found. These can be further divided into three sub-categories, as follows:
a. SMP services that are subject to price controls;
b. SMP services that are subject to cost orientation obligations; and
c. SMP services that are not subject to cost orientation obligations.
“Non-Regulated Services”, which include the related services that are not subject to a finding of SMP; and
Services covered by the Business Connectivity Market Review (which are outside the scope of this review).
A1.5 The calculations underlying the current charge controls predate the creation of
Openreach. Fixed charge ceilings LLU services were set as follows:
For MPF, in the 30 November 2005 Statement, “Local loop unbundling: setting the fully unbundled rental charge ceiling and minor amendment to SMP conditions FA6 and FB6”; and

A new pricing framework for Openreach
3
For SMPF, in the 16 December 2004 Statement “Review of the Wholesale Local Access Market”.
A1.6 The other regulated services set out in Figure 2.1 are subject to a range of regulatory controls including cost orientation non-discrimination, price publication and the publication of audited accounts (which is also required in respect of the core rental services).
A1.7 Our approach to scope is covered in two ways. With respect to cost determination we have reviewed all Openreach costs and cost allocations impacting on the copper based services (including WLR services). With respect to the setting of charge controls we have focussed on those LLU services which are directly required to support the core LLU services. In this context, we have excluded services which while they may be subject to SMP cost-orientation are not directly required to provide a minimum service (see discussion in Section 6 and Annex 10). As discussed earlier, WLR charge controls will now be the subject of a separate consultation.
A1.8 Set out below are the services upon which we are imposing charge controls either individually or within a basket
Individual core services
Item
1 Share Metallic Path Facility (SMPF) rental
2 Metallic Path Facility (MPF) rental
Ancillary baskets
1. SMPF Ancillary Services
Item
1
SMPF Connection – Basic Provide on existing narrowband, Simultaneous Provide of SMPF with narrowband, Singleton Migration (Transfer or change of CP migrations) from Narrowband, MPF, SMPF and ISDN/ Highway
2 SMPF Bulk Migrations charge Normal – Deliverd during a 24 hour period
3 SMPF Tie Pair Modification (3 working day lead time Re-termination)
4 SMPF Tie Pair Modification (Multiple Re-termination)
5 SMPF Cease charge
6 SMPF MDF Remove Jumper Order Singleton Charge
7 SMPF MDF Remove Jumper Order Bulk Charge
8 SMPF Order rejected at initial validation
9 SMPF Order rejected at detailed evaluation
10 SMPF Order returned for amendment

A new pricing framework for Openreach
11 Cancellation of SMPF orders for Provide, Simultaneous provide, Migration, Modification or Amend
12 Amend orders. Allowable change to SMPF Order
13 SMPF standard line test (RWT)
14 Network RWT
15 SMPF Flexi Cease Fault Investigation Charges
2. MPF Ancillary Services
Item
1 MPF Transfer
2 MPF Connection Charge – Stopped Line Provide
3 MPF Connection charge – New Provide – Standard
4 MPF Expedite
5 MPF Same CP Mass Migration charge – Normal hours
6 MPF Tie Pair Modification (3 working day lead time Re-termination)
7 MPF Tie Pair Modification (Multiple Re-termination)
8 MPF Cease charge
9 MPF MDF Remove Jumper Order Singleton Charge
10 MPF MDF Remove Jumper Order Bulk Charge
11 MPF Order rejected at initial validation
12 MPF Order rejected at detailed evaluation
13 MPF Order returned for amendment
14 Cancellation of MPF orders for Provide, Migration, Modification or Amend
15 Amend orders. Allowable change to MPF Order
16 MPF Standard line test (RWT)
17 Network RWT
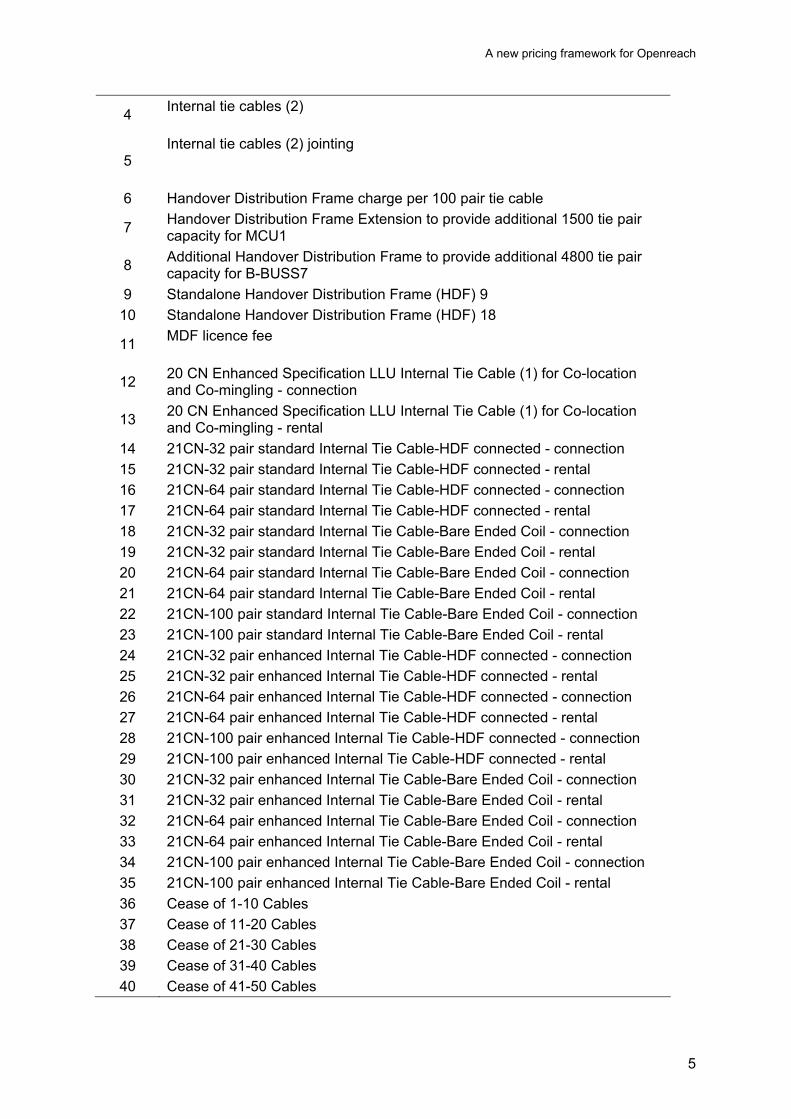
3. Co-Mingling Services
Item
1 Internal tie cables (1)
2 Internal tie cables (1)
3 Internal tie cables (2)
A new pricing framework for Openreach
5
4 Internal tie cables (2)
5 Internal tie cables (2) jointing
6 Handover Distribution Frame charge per 100 pair tie cable
7 Handover Distribution Frame Extension to provide additional 1500 tie pair capacity for MCU1
8 Additional Handover Distribution Frame to provide additional 4800 tie pair capacity for B-BUSS7
9 Standalone Handover Distribution Frame (HDF) 9
10 Standalone Handover Distribution Frame (HDF) 18
11 MDF licence fee
12 20 CN Enhanced Specification LLU Internal Tie Cable (1) for Co-location and Co-mingling - connection
13 20 CN Enhanced Specification LLU Internal Tie Cable (1) for Co-location and Co-mingling - rental
14 21CN-32 pair standard Internal Tie Cable-HDF connected - connection
15 21CN-32 pair standard Internal Tie Cable-HDF connected - rental
16 21CN-64 pair standard Internal Tie Cable-HDF connected - connection
17 21CN-64 pair standard Internal Tie Cable-HDF connected - rental
18 21CN-32 pair standard Internal Tie Cable-Bare Ended Coil - connection
19 21CN-32 pair standard Internal Tie Cable-Bare Ended Coil - rental
20 21CN-64 pair standard Internal Tie Cable-Bare Ended Coil - connection
21 21CN-64 pair standard Internal Tie Cable-Bare Ended Coil - rental
22 21CN-100 pair standard Internal Tie Cable-Bare Ended Coil - connection
23 21CN-100 pair standard Internal Tie Cable-Bare Ended Coil - rental
24 21CN-32 pair enhanced Internal Tie Cable-HDF connected - connection
25 21CN-32 pair enhanced Internal Tie Cable-HDF connected - rental
26 21CN-64 pair enhanced Internal Tie Cable-HDF connected - connection
27 21CN-64 pair enhanced Internal Tie Cable-HDF connected - rental
28 21CN-100 pair enhanced Internal Tie Cable-HDF connected - connection
29 21CN-100 pair enhanced Internal Tie Cable-HDF connected - rental
30 21CN-32 pair enhanced Internal Tie Cable-Bare Ended Coil - connection
31 21CN-32 pair enhanced Internal Tie Cable-Bare Ended Coil - rental
32 21CN-64 pair enhanced Internal Tie Cable-Bare Ended Coil - connection
33 21CN-64 pair enhanced Internal Tie Cable-Bare Ended Coil - rental
34 21CN-100 pair enhanced Internal Tie Cable-Bare Ended Coil - connection
35 21CN-100 pair enhanced Internal Tie Cable-Bare Ended Coil - rental
36 Cease of 1-10 Cables
37 Cease of 11-20 Cables
38 Cease of 21-30 Cables
39 Cease of 31-40 Cables
40 Cease of 41-50 Cables
A new pricing framework for Openreach
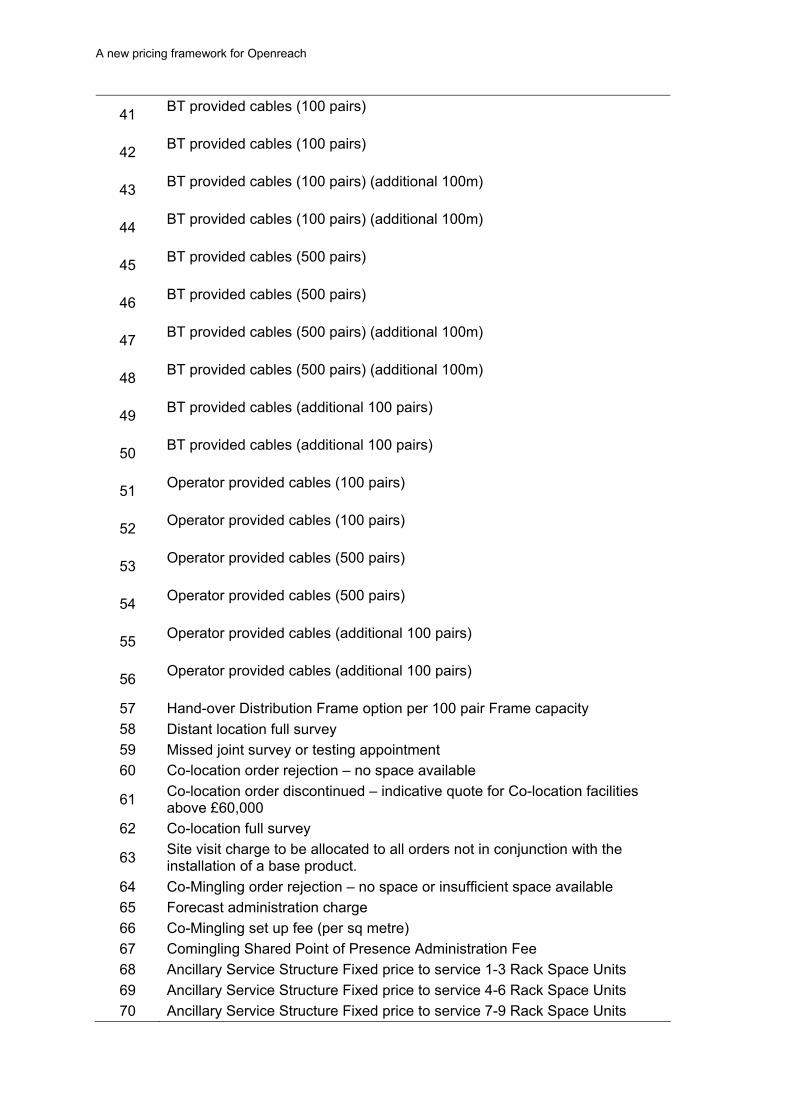
41 BT provided cables (100 pairs)
42 BT provided cables (100 pairs)
43 BT provided cables (100 pairs) (additional 100m)
44 BT provided cables (100 pairs) (additional 100m)
45 BT provided cables (500 pairs)
46 BT provided cables (500 pairs)
47 BT provided cables (500 pairs) (additional 100m)
48 BT provided cables (500 pairs) (additional 100m)
49 BT provided cables (additional 100 pairs)
50 BT provided cables (additional 100 pairs)
51 Operator provided cables (100 pairs)
52 Operator provided cables (100 pairs)
53 Operator provided cables (500 pairs)
54 Operator provided cables (500 pairs)
55 Operator provided cables (additional 100 pairs)
56 Operator provided cables (additional 100 pairs)
57 Hand-over Distribution Frame option per 100 pair Frame capacity
58 Distant location full survey
59 Missed joint survey or testing appointment
60 Co-location order rejection – no space available
61 Co-location order discontinued – indicative quote for Co-location facilities above £60,000
62 Co-location full survey
63 Site visit charge to be allocated to all orders not in conjunction with the installation of a base product.
64 Co-Mingling order rejection – no space or insufficient space available
65 Forecast administration charge
66 Co-Mingling set up fee (per sq metre)
67 Comingling Shared Point of Presence Administration Fee
68 Ancillary Service Structure Fixed price to service 1-3 Rack Space Units
69 Ancillary Service Structure Fixed price to service 4-6 Rack Space Units
70 Ancillary Service Structure Fixed price to service 7-9 Rack Space Units
A new pricing framework for Openreach
7
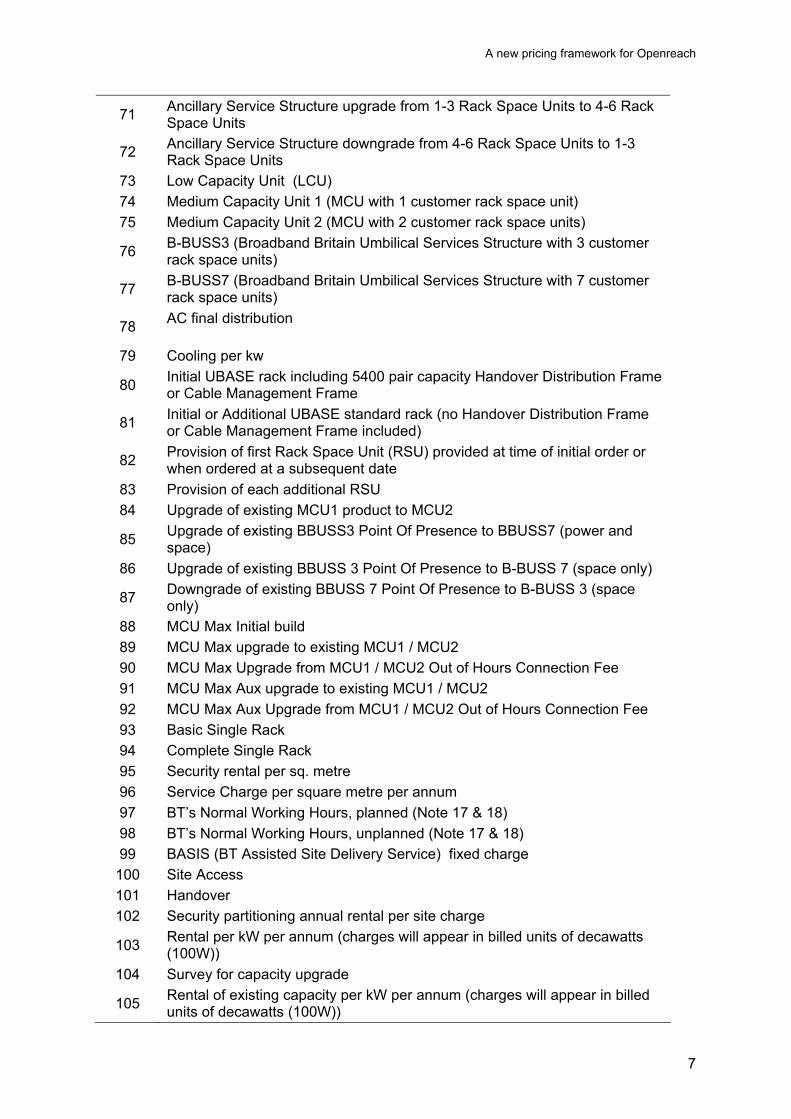
71 Ancillary Service Structure upgrade from 1-3 Rack Space Units to 4-6 Rack Space Units
72 Ancillary Service Structure downgrade from 4-6 Rack Space Units to 1-3 Rack Space Units
73 Low Capacity Unit (LCU)
74 Medium Capacity Unit 1 (MCU with 1 customer rack space unit)
75 Medium Capacity Unit 2 (MCU with 2 customer rack space units)
76 B-BUSS3 (Broadband Britain Umbilical Services Structure with 3 customer rack space units)
77 B-BUSS7 (Broadband Britain Umbilical Services Structure with 7 customer rack space units)
78 AC final distribution
79 Cooling per kw
80 Initial UBASE rack including 5400 pair capacity Handover Distribution Frame or Cable Management Frame
81 Initial or Additional UBASE standard rack (no Handover Distribution Frame or Cable Management Frame included)
82 Provision of first Rack Space Unit (RSU) provided at time of initial order or when ordered at a subsequent date
83 Provision of each additional RSU
84 Upgrade of existing MCU1 product to MCU2
85 Upgrade of existing BBUSS3 Point Of Presence to BBUSS7 (power and space)
86 Upgrade of existing BBUSS 3 Point Of Presence to B-BUSS 7 (space only)
87 Downgrade of existing BBUSS 7 Point Of Presence to B-BUSS 3 (space only)
88 MCU Max Initial build
89 MCU Max upgrade to existing MCU1 / MCU2
90 MCU Max Upgrade from MCU1 / MCU2 Out of Hours Connection Fee
91 MCU Max Aux upgrade to existing MCU1 / MCU2
92 MCU Max Aux Upgrade from MCU1 / MCU2 Out of Hours Connection Fee
93 Basic Single Rack
94 Complete Single Rack
95 Security rental per sq. metre
96 Service Charge per square metre per annum
97 BT’s Normal Working Hours, planned (Note 17 & 18)
98 BT’s Normal Working Hours, unplanned (Note 17 & 18)
99 BASIS (BT Assisted Site Delivery Service) fixed charge
100 Site Access
101 Handover
102 Security partitioning annual rental per site charge
103 Rental per kW per annum (charges will appear in billed units of decawatts (100W))
104 Survey for capacity upgrade
105 Rental of existing capacity per kW per annum (charges will appear in billed units of decawatts (100W))

A new pricing framework for Openreach
106 Provision of sub meter
107 Rental per kW per annum
A1.9 In order to ensure that a fixed reference on the meaning of the services is maintained BT will hold the current definitions and explanations of products on their website in addition to future product updates. These are found as follows:
For SMPF and MPF product information, please refer to http://www.openreach.co.uk/orpg/products/llu/mpfsmpf/msmpf.do
For assurance information including care levels and SFI, please refer to http://www.openreach.co.uk/orpg/products/llu/repair/repinfo.do
For Plan and Build (infrastructure) product information, please refer to http://www.openreach.co.uk/orpg/products/llu/planbuild/plan_build.do
For 21C related products including Test Access Product, please refer to the tactical system area of the secure web site at http://www.btinterconnect.com/llunbundle/index.htm Please note that a userID and password is required to access this information
A new pricing framework for Openreach
9
Annex 2
2 Review of the relevant markets Introduction
A2.1 We have set out in this Statement the basis for our decision to impose price controls in relation to BT’s Significant Market Power (“SMP”) in the market for wholesale local access in the UK excluding the Hull Area. Our setting of a new SMP condition, by which means that control is imposed, together with the related modification of SMP Condition FA3, is set out in the Notification at Annex 3 to this document.
A2.2 The purpose of this Annex is to address a specific legal requirement that Ofcom must comply with in setting or changing an SMP condition. Unless Ofcom fully reviews a previous market power determination and continues to find SMP, it must be satisfied that there has been no material change in the market since the SMP finding. This requirement is in addition to satisfying the tests considered and applied in Section 7.
A2.3 We last undertook a market review for the wholesale local access in the UK excluding the Hull Area in December 20041 (the “2004 Market Review”), and we last modified some of the SMP conditions applying to this market in November 2005, following a no material change assessment.
A2.4 As we are only setting a charge control with a two year duration, we have taken into account any expected or foreseeable market developments over the course of a two year period until such a further market analysis has been carried out by Ofcom. (We refer to that period in this Annex as the “interim forward look period”.)
A2.5 The remainder of this Annex sets out why we conclude that there has been no material change in the wholesale local access market since our last market review.
Legal framework
A2.6 Under specific circumstances, Ofcom can set, modify or revoke an SMP services condition without conducting a new market analysis process in accordance with sections 79 and 80 of the Act2. This is where, as noted above, Ofcom is satisfied that there has not, since the condition in question was set or last modified, or since the relevant market power determination was made (as the case may be), been a material change in the market identified or otherwise used for the purposes of the market power determination by reference to which the condition (if any) was set or last modified. According to section 86(6) of the Act, a change is a material change if
1 http://www.ofcom.org.uk/consult/condocs/rwlam/statement/rwlam161204.pdf 2 The Access Directive (especially its 15th recital) expressly confirms that the imposition of a specific obligation on an undertaking with SMP does not require an additional market analysis. However, in such circumstance, that recital also makes it clear that the obligation needs to be justified as appropriate and proportionate in relation to the nature of the problem already identified. In this context, the latter concerns the competition problems identified in the 2004 Market Review leading to our finding of BT’s SMP. As explained in Section 7 to this Statement, this Annex 2 sets out our no material change assessment also to show that the obligations under the new SMP Condition FA3(A) remain based on those competition problems as well as our consideration of the need to carry out further market analysis under section 84 of the Act.

A new pricing framework for Openreach
it is one that is material to the setting of the condition in question or the modification (or revocation) in question.
A2.7 The alternative way of setting, modifying or revoking an SMP condition, rather than satisfying that material change test, is for Ofcom to review under section 84 of the Act the identified services market used for the purposes of a market power determination in an earlier market analysis, here the 2004 Market Review.
A2.8 Section 84 requires Ofcom to carry out further analyses of the identified services market either:
where Ofcom considers it an appropriate interval to do so for the purposes of reviewing market power determinations made on the basis of an earlier analysis and/or deciding whether to make proposals for the modification of SMP conditions set by reference to a market power determination made on such a basis (section 84(2)); or
as soon as reasonably practicable after recommendations are made by the European Commission that affect the matters that were taken into account, or could have been taken into account, in the case of the last analysis of the market in question (section 84(3)).3
A2.9 We completed the 2004 Market Review over 4 years ago. We therefore consider it an appropriate interval to shortly begin our review in this market to take account of, in particular, any expected or foreseeable market developments over the course of a period longer than the interim forward look period in light of the European Commission’s recommendation on relevant product and service markets of 17 December 2007 (the “2007 Recommendation”)4, which replaces its initial recommendation published in February 2003 (the “2003 Recommendation”)5 of which we took due account when the 2004 Market Review was undertaken.
A2.10 Recently, other regulatory initiatives have also been taken that may be relevant to a further forward-looking market analysis. This includes the Commission’s draft recommendation on regulated access to Next Generation Access Networks6. Its purpose is to foster the application of consistent regulatory remedies to SMP operators throughout the EU in the Wholesale (physical) network infrastructure access (including shared or fully unbundled access) at a fixed location market (i.e. Market 4 of the 2007 Recommendation) and the wholesale broadband access market (i.e. Market 5 of the 2007 Recommendation). It includes a need to consider national and sub-national markets when defining markets and a need to mandate duct access (and supporting facilities) on SMP. The public consultation on that draft
3 Section 79(3) of the Act further requires Ofcom to take due account of all applicable guidelines and recommendations published by the European Commission in making or revising a market power determination in relation to a services market. 4 http://ec.europa.eu/information_society/policy/ecomm/doc/library/proposals/879/l_34420071228en00650069.pdf 5 http://ec.europa.eu/information_society/policy/ecomm/doc/library/recomm_guidelines/relevant_markets/i_11420030508en00450049.pdf 6 http://ec.europa.eu/information_society/policy/ecomm/doc/library/public_consult/nga/dr_recomm_nga.pdf
A new pricing framework for Openreach
11
recommendation ended on 14 November 2008. We intend to take due account of the final recommendation when our further market analysis is carried out.
A2.11 Meanwhile, for the purpose of addressing our concerns in relation to the LLU charge ceilings as fixed in nominal terms and for unlimited duration, we set out in this Annex our considerations also of the competition problems identified in the 2004 Market Review to ensure that the new charge controls imposed under SMP Condition FA3(A) are justified as appropriate and proportionate in relation to the nature of these problems. In this assessment, we have also taken account of the 2007 Recommendation for the duration of the interim forward look period and our views on this matter is summarised at the end of this Annex.
General approach to market definition
A2.12 The purpose of the market definition exercise is to identify the relevant constraints on the price setting behaviour of firms. There are two main competitive constraints to consider, namely:
the extent to which customers will substitute other services for those in question (demand-side substitution) in response to a price increase; and
the extent to which suppliers will switch, or expand, production to supply the relevant products or services (supply-side substitution) in response to a price increase.
A2.13 The ‘hypothetical monopolist’ or SSNIP test provides a useful tool to identify demand-side and supply-side substitutes which constrain pricing sufficiently. A product or group of products is considered to constitute a separate market if a hypothetical monopoly supplier of that product group could profitably impose a small but significant, non-transitory increase in price (“SSNIP”). If such a price rise would be unprofitable, because customers would switch to other products, or because suppliers of other products would begin to compete with the hypothetical monopolist, then the market definition should be expanded to include the substitute products.
A2.14 Markets are usually defined first on the demand-side. The analysis of demand-side substitution is usually undertaken by considering if other services could be considered as substitutes by consumers, in the event of the hypothetical monopolist introducing a SSNIP above the competitive level.
A2.15 Supply-side substitution possibilities are assessed to consider whether they provide any additional constraints on the pricing behaviour of the hypothetical monopolist which have not been captured in the demand-side analysis. Supply-side substitution is considered to be a low cost form of entry which can take place within a reasonable time frame7 (e.g. up to 12 months). The key point is that, for supply-side substitution to be relevant, not only must suppliers be able, in theory, to enter the market quickly and at low cost by virtue of their existing position in the supply of other services or areas, but there must also be an additional competitive constraint arising from such entry into the supply of the service in question.
7 See the European Commission’s guidelines on market analysis and the assessment of significant market power under the Community regulatory framework for electronic communications networks and services (2002/C 165/03), as published in the Official Journal of the European Communities on 11 July 2002, at paragraph 52.

A new pricing framework for Openreach
A2.16 Therefore, in identifying potential supply-side substitutes, it is important that providers of these services have not already been taken into consideration. There might be suppliers who provide other services but who might also be materially present in the provision of demand-side substitutes to the service for which the hypothetical monopolist has raised its price. Such suppliers are not relevant to supply-side substitution since they supply services already identified as demand-side substitutes. As such, their entry has already been taken into account and so supply-side substitution from these suppliers cannot provide an additional competitive constraint on the hypothetical monopolist. However, the impact of expansion by such suppliers can be taken into account in the assessment of market power.
A2.17 An additional consideration is whether there exist common pricing constraints across customers, services or areas, such that they should be included within the same relevant market even if demand and supply-side substitution are not present. Failure to consider the existence of a common pricing constraint could lead to unduly narrow markets being defined.
A2.18 There are two dimensions to the definition of a relevant market: the relevant products to be included in the market and the geographic extent of that market. The same considerations of the possible constraints on price setting behaviour are relevant to both dimensions of the definition of the relevant market.
A2.19 In considering the wholesale local access market, it is informative first to consider competition in downstream markets for factors relevant to the wholesale local access market. This is because demand for wholesale local access is driven by downstream wholesale demand and ultimately by retail demand. The main relevant downstream retail markets are the fixed narrowband exchange line markets (which are discussed immediately below) and the broadband internet access market. The relevant downstream wholesale markets are the wholesale narrowband exchange line markets and the wholesale broadband access market. In considering these downstream wholesale and retail markets, we need to assume that there is no SMP regulation in place in the wholesale local access market. To do otherwise would risk a circular and incorrect approach.
Retail markets relevant to wholesale local access market
Fixed narrowband retail exchange line markets
A2.20 The review into fixed narrowband retail exchange line markets undertaken in 2003 (the “2003 Narrowband Retail Market Review”8) identified a number of different fixed narrowband retail exchange line markets, including, for the UK excluding the Hull area:
residential analogue exchange line services; and
business analogue exchange line services;
A2.21 Such markets provide access to two main retail services:
switched telephony services, based on analogue or digital channels, each with a channel having a bandwidth of 64 kbit/s; and
8 http://www.ofcom.org.uk/consult/condocs/narrowband_mkt_rvw/fixednarrowbandrsm.pdf

A new pricing framework for Openreach
13
narrowband internet access, that is internet access that is not ‘always-on’ (i.e. it requires internet dial-up), that does not allow simultaneous voice and data calls and has slower downstream speeds than a broadband connection.
A2.22 From the point of view of the wholesale local access market, the considerations in the 2003 Narrowband Retail Market Review that are most relevant are that the fixed narrowband retail exchange line markets are distinct from:
mobile access; and
leased lines.
A2.23 We are currently in the process of reviewing the fixed narrowband retail services markets.9 The proposed conclusions we are currently consulting on are consistent with our conclusion here that there have been no material changes relevant to the wholesale local access market since the 2003 Narrowband Retail Market Review. In particular, our proposed conclusions are that:
fixed and mobile access are in different markets; and
leased lines are not in the same market as retail exchange line services
A2.24 The 2003 Narrowband Retail Market Review also considered that narrowband internet access is in a distinct market to broadband internet access, that business and residential services are in different markets, and analogue and digital services are in distinct markets. For the purposes of considering whether there has been any material change in the wholesale local access market, these distinctions are only relevant to the extent that they could feed through to the upstream wholesale local access market. As we consider the business and residential distinction and the analogue and digital distinction explicitly for the wholesale local access market in paragraphs A2.81 and A2.82 below, we do not consider them specifically for the fixed narrowband retail exchange line markets. While there continues to be switch from narrowband internet access to broadband internet access, we do not consider that there has been any material change relevant for the wholesale local access market.
Fixed narrowband exchange line access vs mobile access
A2.25 The 2003 Narrowband Retail Market Review considered that mobile access is not so much a substitute for fixed narrowband exchange line access as an adjunct to it. It said that evidence from consumer surveys showed that a majority of mobile phone calls made by consumers are short convenience calls such as calling someone whilst walking home from the station - the type of call that cannot be made from a fixed line. The conclusion was also supported by the fact that more than 90 per cent of UK adults use a fixed access telephone in addition to a mobile phone. If mobile access were a substitute for fixed narrowband exchange line access then this figure would be expected to be much lower.
A2.26 It remains common for users to have both fixed and mobile access. Our research shows that 79% of the UK adult population now choose to have both fixed and mobile access. This compares to only 70% who had both forms of access in 2003. While 91% of consumers now have a mobile phone, the number choosing mobile
9 http://www2.ofcom.org.uk/consult/condocs/retail_markets/

A new pricing framework for Openreach
access only is growing at a rate of only 1% per annum and currently stands at 12%. This is shown in Table A2.1 below.
Table A2.1 Fixed and Mobile Take-up
Type of Access % of UK adults 2003 % of UK adults 2008
Landline and mobile 70% 79%
Landline only 20% 8%
Mobile only 8% 12%
Neither 2% 1%
Source: Ofcom Technology Tracker Survey, November 2008
A2.27 We have also explored consumers’ willingness to switch between fixed and mobile access by asking them directly how they would respond to an increase in BT’s access price. In a hypothetical scenario where BT’s line rental price increased by 10% (and the price of other fixed and mobile access remained constant) only 4% of respondents stated that they would cancel the fixed line with 22% responding they would switch to a different supplier. Of those who indicated that they would switch calls, only 5% (1% of total sample) would switch to a mobile phone supplier. This suggests mobile access is not regarded by consumers as a particularly strong substitute for fixed line access.10
A2.28 Businesses appear to attach a similar or greater importance to retaining a landline than residential customers. For example, 82% of businesses agreed with the statement that “landline services are essential for the needs of our business and we would never consider getting rid of them.” This compares with 62% of residential consumers who indicated that they would never consider giving up a landline.
A2.29 Business’s preference to retain their landline appears to be primarily driven by non-price factors with only 24% of respondents indicating that they would be prepared to substitute mobile for fixed access should the current price differential be eliminated.
A2.30 Our evidence suggests that while there is some substitutability between fixed and mobile access, consumers predominantly view the two types of access as meeting different needs and have a strong preference to purchase both fixed and mobile access. We therefore conclude that there has been no material change in the conclusion of the 2003 Narrowband Retail Market Review that mobile access is not a substitute for fixed narrowband exchange line access on the demand side.
A2.31 On the supply side, the 2003 Narrowband Retail Market Review concluded that there was limited scope for substitution between mobile and fixed narrowband exchange line access services due to the high sunk costs associated with building a fixed narrowband exchange line access network and the economies of scale and density that characterise communications access networks. We consider this is unchanged.
10 See the current fixed narrowband retail services markets consultation for more detail on these and other results. http://www2.ofcom.org.uk/consult/condocs/retail_markets/

A new pricing framework for Openreach
15
Fixed narrowband exchange lines vs leased lines
A2.32 The 2003 Narrowband Retail Market Review considered that leased lines were not in the same market. Leased lines involve a permanently connected communications link between two premises dedicated to the customers’ exclusive use. They therefore do not provide the switched voice and data services that an exchange line provides. Leased lines are significantly more expensive than fixed narrowband exchange lines and are therefore unlikely to be effective in making a small price rise in fixed narrowband exchanges lines unprofitable. This suggests that they are in separate markets. We do not believe that this situation has changed materially since 2003.
A2.33 This is consistent with our statement on the wholesale broadband access market of May 2008 (the “2008 WBAM Review”)11 in which we found that leased lines were not in the same market as asymmetric broadband services, based on evidence from relative charges and costs and from consumer surveys.
A2.34 It is also consistent with our views on the business connectivity market of December 200812. In that review, we recognised that there may have been a decline in leased lines, which is probably partly attributable to customers switching to using ADSL over ordinary exchange lines, but considered that such switching is not necessarily sufficient to place those products in the same market. We considered that given the differences in relative prices identified, the extent of switching away from leased lines in fact appears rather limited. The fact that there continues to be significant retail demand for low bandwidth leased lines, despite the availability of other products at often significantly lower prices, suggests that these products are not sufficiently close substitutes to form part of the same market.
Fixed narrowband retail exchange line geographic markets
A2.35 The 2003 Narrowband Retail Market Review identified separate geographic markets for:
the UK excluding the Hull Area; and
the Hull Area.
A2.36 In defining these geographic markets, it was recognised that competition in these markets could have local geographic characteristics. If markets were defined very narrowly according to a strict hypothetical monopolist test, this would lead to a proliferation of markets. There is because, on the demand side, a customer will want a local loop that goes to its own premise and will not want to take one that goes to different premises. On the supply side, substitution is likely to be limited to suppliers who have made infrastructure investments in the vicinity of the end user’s premises. Moreover, such a narrow definition may fail to capture adequately other competitive constraints. In particular, such a hypothetical monopolist test takes no account of the geographic pricing constraints faced by specific firms in reality.
A2.37 The wider geographic markets were justified on the grounds that BT’s prices for narrowband exchange line services are uniform throughout the UK excluding the Hull Area, which remains the case. BT’s decision to set national tariffs for ISDN2 access and ISDN30 access is a commercial one. For analogue services, BT is
11 http://www.ofcom.org.uk/consult/condocs/wbamr07/statement/statement.pdf 12 http://www.ofcom.org.uk/consult/condocs/bcmr08/
A new pricing framework for Openreach
required to set geographically uniform tariffs. In the 2003 Narrowband Retail Market Review, we considered that it was appropriate to include the potential effect of this requirement when defining the relevant geographic market because the requirement was a Universal Service Obligation which was not dependent on an SMP finding in the market.
A2.38 Where firms adopt uniform pricing across local areas, local competitive pressures will have an impact only to the extent that they affect that single uniform price. Moreover, to the extent that local factors do influence that price, the effect will be transmitted beyond the particular area where the competitive pressure originally arose to all the areas subject to the uniform price. The Hull Area is not subject to this constraint, since BT does not operate in this area.
A2.39 Our current consultation on the on the fixed narrowband retail services markets proposes no change in the geographic markets.
A2.40 We conclude that there has been no material change in the fixed narrowband retail exchange line market relevant to our finding of BT having SMP in wholesale local access market.
Broadband internet access retail market
A2.41 At the time of the 2004 Market Review , the majority of local loop connections were used to provide voice and dial-up internet access only. Since then, broadband has grown considerably. In Q4 2008, 59 per cent of all households had broadband internet access, compared to 11 per cent in Q4 2003.
A2.42 In the 2008 WBAM Review, we considered the retail broadband access market and concluded that:
cable-based broadband access services are in the same market as ADSL-based services, on the basis of market evidence and consumer research into reactions to hypothetical price increases;
broadband access and narrowband access are in separate markets, on the basis of firstly a range of qualitative arguments, including the advantages of broadband’s distinctive functionality over narrowband which surveys showed consumers considered important, and secondly consumer research into reactions to hypothetical price increases;
symmetric and asymmetric broadband internet access services are in separate markets, because of the large differences in costs in the UK and the low value that customers of asymmetric broadband access place on symmetric broadband access;
residential and business customers are in the same market, because, amongst other things, there is no clear break between higher quality and lower quality products, in terms of price or quality; and
mobile and fixed broadband internet access services are in separate markets, as discussed further below.
A2.43 In considering whether mobile access is in the same market, we concluded that mobile access using a mobile device is not an effective demand-side substitute.

A new pricing framework for Openreach
17
Mobile devices have considerably less functionality compared to using a PC and fixed broadband access.
A2.44 We also considered an end-user accessing the internet using a PC and a mobile network operator’s data card. However, we noted that it is only very recently that ‘affordable’ mobile broadband products have been offered in the UK and thus their long-term sustainability was unknown.
A2.45 Since the 2008 WBAM Review, mobile broadband has continued to grow strongly. However, we do not believe that many consumers consider mobile broadband to be a substitute for fixed broadband. A survey in Q1 2008 found that 68 per cent of mobile broadband users have it in addition to a fixed-line connection.13
A2.46 The definition of the retail broadband access market product in the 2008 WBAM Review was unchanged from the previous wholesale broadband access market review of 2004 as far as these points are concerned.14
A2.47 On the geographic coverage of the retail market, we stated in the 2008 WBAM Review that the existence of geographic variations in product offerings and prices suggested that geographic markets were emerging at the retail level. However, it was not necessary for Ofcom to reach firm conclusions on the precise geographic definition of the retail market because this were not a determining factor for the assessment of the geographic nature of the markets for wholesale broadband access. Similarly, we do not need to consider the geographic coverage of the retail broadband access market in order to assess whether there have been any material changes in the wholesale local access market, as the geographic nature of the retail broadband access market was not a determining factor for the geographic definition of the wholesale local access market in the 2004 Market Review.
Downstream wholesale markets relevant to wholesale local access market
A2.48 The fixed narrowband wholesale exchange line markets and the wholesale broadband access market provide the link between the retail markets discussed above and the wholesale local access market. We consider these two wholesale markets in turn below.
Fixed narrowband wholesale exchange line markets
A2.49 The 2003 market review of the fixed narrowband wholesale exchange line markets15 found the wholesale markets to be analogous to those identified at the retail level. As the demand for fixed narrowband wholesale exchange line services is a derived demand from the retail level, considerations at the retail level were found to feed through to the wholesale level. The geographic extent of the wholesale markets were also found to be the same as for the retail market, namely a market covering the UK excluding the Hull area.
A2.50 One change that has occurred since 2003 is that there has been significant growth in LLU which could potentially affect the fixed narrowband wholesale exchange line markets. However, we are here considering the definitions of the fixed narrowband
13 The UK Communications Market 2008, Figure 2.13. 14 http://www.ofcom.org.uk/consult/condocs/wbamp/wholesalebroadbandreview/broadbandaccessreview.pdf 15 http://www.ofcom.org.uk/consult/condocs/narrowband_mkt_rvw/nwe/fixednarrowbandstatement.pdf

A new pricing framework for Openreach
wholesale exchange line geographic markets for the purposes of analysing the wholesale local access market. We therefore need to assume that there is no regulation in place in the wholesale local access market. Without a regulatory requirement, we consider it unlikely that BT would offer LLU, and therefore the growth in LLU is not relevant when considering the fixed narrowband wholesale exchange line markets for the purposes of analysing the wholesale local access market.
Wholesale broadband access markets
A2.51 In the 2008 WBAM Review, we concluded on product definition that wholesale cable-based broadband access services were in the same market as ADSL-based services. In reaching this conclusion, we considered that it was inappropriate to conduct the analysis on the assumption that BT would continue to provide a viable ADSL wholesale product in the absence of regulation, because it was not clear that it would do this. In the absence of ADSL wholesale product, there would clearly be no direct competition for broadband services between ADSL and cable at the wholesale level.
A2.52 However, it is still possible to consider the question of market definition at the wholesale level because competition would take place further downstream at the retail level. An increase in the price of wholesale ADSL based broadband services will tend to feed through to higher retail ADSL based broadband services. As there is competition at the retail level between ADSL based and cable based broadband, this will tend to mean lower volumes for ADSL based broadband at both the retail and wholesale level. The 2008 WBAM Review concluded that the competition with cable at the retail level was sufficient to act as an indirect constraint on pricing for wholesale ADSL based broadband services.
A2.53 There is also potentially a more direct constraint. For the market definition exercise, it is assumed that there is no regulation in the market being considered and competitive conditions. In these circumstances, it is possible that both cable operators and BT might have an incentive to offer a wholesale product. The 2008 WBAM Review considered that if this were the case they would be expected to exercise a competitive constraint on one another and hence be in the same product market.
A2.54 We did not regard mobile broadband access as in the same market as cable-based and ADSL-based services, for the reasons discussed above under the retail market for broadband access.
A2.55 We also considered in the 2008 WBAM Review the potential impact of other technologies, including:
WiFi;
broadband Fixed Wireless Access (BFWA);
worldwide Interoperability for Microwave Access (WiMax);
mesh networks;
satellite;
powerline Technology; and

A new pricing framework for Openreach
19
free space optics.
A2.56 We concluded that these technologies were not sufficiently widespread or utilised to have any real impact in the wholesale broadband access market within the period of the 2008 WBAM Review, which was to the end of 2010. We recognised, however, that it is possible that some of these technologies may emerge as a competitive threat in the longer term, though that would be beyond the period we are considering for this interim forward look.
A2.57 On the geographic market for wholesale broadband access, the 2008 WBAM Review concluded that there were a number of different geographic markets. This was as a result of the significant changes that had occurred since the previous wholesale broadband access market review carried out in 2003/04.16 Most significantly, LLU operators have used LLU to offer retail and wholesale broadband services. LLU operators have focussed their initial network deployment on the more densely populated areas where the commercial case is strongest. We considered that this concentration of LLU operators in dense areas meant that market conditions in wholesale broadband access vary considerably between different geographic areas.
A2.58 As we are looking at the wholesale broadband access market from the point of view of considering the wholesale local access market, we need to assume that there is no LLU remedy in the wholesale local access market. If this were the case, it is not clear that there would be more than one geographic market (outside of the Hull area). As discussed in paragraph A2.91 below, the fact that with the LLU remedy there are a number of geographically different wholesale broadband access markets does not have any necessary implications for the upstream wholesale local access market.
Wholesale local access market
A2.59 The analysis above has considered the markets downstream of the wholesale local access market. We conclude that there have not been any material changes in the downstream markets from the point of view of the SMP finding in the wholesale local access market. In light of that conclusion, we now turn to the wholesale local access itself. The following analysis considers first the wholesale local access product market and then the geographic market.
Wholesale local access product definition
A2.60 In the 2004 Market Review, we defined the wholesale local access market as encompassing fixed local access connection with a twisted metallic pair (i.e. a local loop connection) and also cable connections. Cable connections combine traditional twisted metallic pairs with a co-axial cable capable of supporting high bandwidth television and broadband delivery. This market definition is unusual in that it is technology-specific.
A2.61 This market definition was made by first hypothesising a wholesale local access market consisting only of the local loop connections, and then considering possible substitutes that might act as a competitive constraint on that narrowly defined market. The most plausible substitutes considered in the 2004 Market Review were:
cable connections;
16 http://www.ofcom.org.uk/consult/condocs/wbamr07/wbamr07.pdf

A new pricing framework for Openreach
fibre connections direct to end users’ premises;
fixed wireless links; and
mobile technology.
A2.62 We consider these four substitutes remain the most plausible substitutes, and we therefore focus our assessment on whether there have been any material changes in relation to them.
A2.63 A wider range of possible alternative technologies (such as, for example, powerline technology and satellite) were considered by Ofcom as part of the 2008 WBAM Review. We concluded that these other technologies were not sufficiently widespread or utilised to have any real impact in the wholesale broadband access market within the period considered by the 2008 WBAM Review. They are therefore unlikely to have any impact on the wholesale local access market within the period covered by this interim forward look.
Cable
A2.64 Virgin Media is the largest provider of cable access in the UK. It does not offer wholesale local access to third parties, but competes in the downstream retail markets of broadband access and fixed narrowband retail services. Competition with cable in these retail markets could act as an effective constraint on the wholesale pricing of loop-based local access. So if the price for loop-based wholesale local access were increased, this could result in the prices of the retail broadband and narrowband services being provided over the local loop increasing. This increase in the price of the retail products being provided over loop-based local access could result in end-users switching to retail products provided over cable access. This would reduce the demand for loop-based wholesale local access, and could mean that the original price increase in the wholesale local access was unprofitable. This process is known as indirect substitution.
A2.65 The extent to which such indirect substitution would effectively undermine a hypothetical price increase for loop-based wholesale local access is affected by:
the degree to which the wholesale SSNIP would be passed through to retail customers by the relevant service provider; and
whether the scale of the resulting reduction in (derived) wholesale demand would be sufficient to render the original price wholesale increase unprofitable.
A2.66 As concluded in the 2004 Market Review, we continue to believe that local wholesale access represents a substantial component of an exchange line product and there is scope for substitution at the retail level which could be expected to lead to a significant switch in retail demand away from the local-loop products. The 2004 Market Review concluded that the wholesale market for local access should include both loop-based and cable-based local access. While LLU prices have fallen significantly since 2004 (for example, the annual full LLU rental price has fallen from £105.09 in 2004 to £81.69 today, though the price controls now being imposed will raise it again), retail broadband prices have also fallen and retail level competition has increased. This suggests that wholesale local access is likely to have remained a substantial component of an exchange line product, meaning that the indirect substitution via retail markets is likely to remain an effective constraint on the

A new pricing framework for Openreach
21
wholesale pricing of loop-based local access. We therefore do not believe there have been any material changes affecting this position.
A2.67 In the 2004 Market Review, we noted that, even if the indirect substitution constraints provided by cable were not effective enough to make a price rise in local loop access unprofitable, this would mean that the market would be defined more narrowly as being only local loop. Narrowing the market definition in this way would only strengthen a determination that BT has SMP in the market for wholesale local access in the UK excluding the Hull Area.
Fibre
A2.68 The 2004 Market Review considered the possibility that local access could be provided by means of fibre connections direct to end users’ premises. There are currently fibre connections to a small number of business end users. Fibre could act as a pricing constraint on local loop and cable access either directly with wholesale access being offered by operators with locally-positioned equipment in place of loops or cable to provide connections with end users, or through indirect substitution through downstream retail markets as discussed in relation to cable above.
A2.69 However, very few residential premises are currently connected to fibre and, even for business users, the number of applications where loop-based and fibre based local access are deployed as alternatives is fairly small.
A2.70 We also stated in the 2004 Market Review that, where fibre infrastructure exists in the vicinity of end users premises, there are unlikely to be enough fibres available to replace loop based connections to even a small fraction of residential or business premises, unless a significant investment in local multiplexer equipment were to be made. Moreover, fibre does not exist in the vicinity of many residential premises currently served by loop-based or cable-based connections.
A2.71 We therefore concluded that a 5 per cent to 10 per cent increase in the wholesale price of loop-based and cable-based access would be unlikely to induce a significant switch at the retail level to fibre-based local access.
A2.72 Since the 2004 Market Review, there has been considerable interest in the deployment of fibre connections direct to end users’ premises. Developments and future plans include, amongst others:
Virgin Media has upgraded part of its cable network to the DOCSIS 3 standard, offering speeds of up to 50Mbps. Roll out of this upgrade to the rest of its network is expected to be completed during the summer of 2009. This upgrade consists of fibre-to-the-cabinet (“FTTC”).
BT announced its pilot of fibre-to-the-premises (“FTTP”) services for newly-built homes in Ebbsfleet, Kent in January 2008. The first customers moved into premises in September 2008, and the aim is to offer FTTP to all 10,000 homes that are being built. On 15 July 2008 BT announced plans to invest £1.5bn to upgrade the broadband services that seven to ten million homes could receive by 2012. These plans will deliver a mix of FTTC covering six to seven million homes plus FTTH deployments including new build areas. The majority of this deployment is scheduled to take place in 2011/12.

A new pricing framework for Openreach
H2O Networks Ltd17 is building a FTTP network using municipal sewers in
Bournemouth and has plans to start building such a network in Dundee this year. Additional projects may follow.
A2.73 In considering the possible implications of these developments, we need to distinguish between FTTC and FTTP. The 2004 Market Review definition of wholesale local access already includes connections to premises that rely on FTTC, as these ultimately rely on metallic connections for the final link to the end user.18 Increasing use by BT of FTTC in place of all-copper loops within its local access network therefore does not necessarily represent a material change in terms of BT’s SMP in the market.
A2.74 The situation with FTTP is different as this is outside the current market definition. As at the time of the 2004 Market Review, the number of FTTP connections currently is still very limited. However, the number of FTTP connections is likely to grow in the future. However, even with the planned FTTP deployments, for the duration of the interim forward look period the number of fibre connections is likely to remain relatively modest compared with over 30 million existing local loop and cable connections. This makes it unlikely that the threat of fibre at new building developments could act as an effective constraint on the price of existing local loops and cable connections in the immediate future. We therefore do not think that planned FTTP developments will represent a material change for the duration of our interim forward look.
Fixed wireless
A2.75 The 2004 Market Review considered whether wireless local access (including WiMax technology) could act as a pricing constraint on local loop and cable access. This could be directly with wholesale access being offered by operators with locally-positioned fixed wireless equipment to provide connections with end users, or indirectly through downstream retail markets.
A2.76 In the 2004 Market Review, we said that the roll-out and take-up of fixed wireless had been very limited, and that fixed wireless would therefore be unable to act as a competitive constraint on pricing in the loop-based or cable-based local access market at the current time.
A2.77 We do not believe that the situation has materially changed since then. While there are some trials of WiMax technologies, these remain very limited and are unlikely to become sufficiently widespread or utilised to act as a competitive constraint on the wholesale local access market during our interim forward look period.
Mobile access
A2.78 The 2004 Market Review set out that substitution could theoretically occur directly, with a mobile connection replacing the fixed link between the end user and an operator’s local equipment (e.g. a DSLAM at an MDF site) similar to fixed wireless access, or indirectly through downstream retail markets with downstream mobile voice and broadband substituting for similar services provided over fixed networks.
A2.79 Potential competition with mobile access through downstream narrowband and broadband services has been considered in the analysis of downstream markets
17 http://www.h2onetworksdarkfibre.com/ 18 This is clear from the fact that sub-loop unbundling is a remedy.
A new pricing framework for Openreach
23
above. To recap, we have concluded that there has not been any material change to the retail markets since the 2004 Market Review, from the point of view of considering the wholesale local access market. Similarly, we believe that the wholesale provision of mobile local access services would not constrain the profitability of a 5% to 10% increase in wholesale fixed local access prices. Technologies which would enable direct substitution of the local loop or cable access with a mobile link from the local exchange equipment to the end user are not currently deployed in the UK.
A2.80 We believe this is unlikely to change during our interim forward look period, and that there mobile local access is not part of the same relevant market.
Analogue and ISDN lines
A2.81 The 2004 Market Review noted that the differences between analogue and ISDN lines are concentrated in the equipment connected to either end of the local loop and in the supplementary services supplied. Therefore, at the wholesale local access level, the local loop itself is no different. We continue to believe that it was appropriate to define a single market for wholesale local access, including lines which are used for analogue and ISDN. This situation has not changed.
Residential and business
A2.82 The 2004 Market Review stated that there were plausible arguments for and against having separate markets for wholesale local access products for business and residential use. We decided it was appropriate to define a single wholesale local access market for supply to both residential and business customers. The main reason for this was that the local loops and cable connections provided for residential wholesale local access are essentially identical to those for business use. We believe that there have been no material changes to this situation.
Wholesale local access geographic market
A2.83 Having considered the relevant product market, we now turn to the issue of defining the relevant geographic market. The 2004 Market Review (as well as the November 2005 ‘no material change’ assessment19) concluded that there were two distinct wholesale geographic markets, namely:
the UK excluding the Hull Area; and
the Hull Area.
A2.84 We nevertheless recognised that the broad UK geographic market was characterised, to some extent, by local characteristics including some variation in the degrees of competitive pressure. This geographic variation in competition pressure was partly as a result of the cable companies operating in particular geographic areas.
A2.85 We reached the view that there were two markets after considering relevant competitive constraints. We consider the competitive conditions below and are conclude that there has been no material change in the wholesale local access market with regard to its geographical dimension.
19 See Annex 4 of http://www.ofcom.org.uk/consult/condocs/llu/statement/llu_statement.pdf

A new pricing framework for Openreach
A2.86 The 2004 Market Review recognised that the provision of a local loop or cable connection to particular premises is an inherently local activity. There is little scope for direct demand-side substitution to loops offered elsewhere. A wholesale local access customer can only purchase a loop or cable connection for a particular end-user if the supplier can provide a connection to the relevant end user’s premises.
A2.87 Supply side substitution is also likely to be limited to suppliers who have made investments in the vicinity of the end user’s premises. Some overlap in the ‘catchment’ areas that can be serviced by the infrastructure at a given location may arise, with substitution possible for at least those consumers in the overlap between catchments. However, we concluded that this mechanism is unlikely to result in an extensive broadening of the relevant market.
A2.88 These features could result in a very narrow definition of the geographic market. Given the difficulties of demand side substitution and supply side substitution, a hypothetical monopolist test could result in an individual end user’s premises being a market. Such a narrow definition may fail to capture adequately other competitive constraints.
A2.89 Another way of considering the relevant geographic market is by considering the homogeneity of competitive conditions. If the competitive conditions between two areas are broadly the same, then the two areas can be regarded as being in the same market. The 2004 Market Review regarded competitive conditions to be sufficiently similar to define a single market in the UK excluding Hull. Since the 2004 Market Review, we believe that there has been no material change in the homogeneity of competitive conditions. In particular, no significant change appears to have occurred in the geographic coverage of cable since the 2004 Market Review, which is one of the main factors that could potentially lead to local differences in competitive conditions.
A2.90 We therefore conclude that the geographic markets are unchanged and will remain so for the duration of our interim forward look period. We consider that the UK excluding the Hull Area remains a single market defined by local characteristics including some variation in the degrees of competitive pressure as a result of cable in some areas.
A2.91 As described earlier, in the 2008 WBAM Review we found a number of different geographic markets for wholesale broadband access, reflecting significant differences in competitive conditions. These variations in competitive conditions in downstream markets do not imply different markets for the upstream wholesale local access market. The different geographic markets in the wholesale broadband access market are largely due to competitive pressures resulting from using the wholesale local access remedy of LLU as an input.
Relationship between wholesale local access market definition and the 2007 Recommendation
A2.92 The 2003 Recommendation defined the following as a relevant market (i.e. Market 11) in which ex ante regulation may be warranted:
"Wholesale unbundled access (including shared access) to metallic loops and sub-loops for the purpose of providing broadband and voice services."

A new pricing framework for Openreach
25
A2.93 We noted in the 2004 Market Review that this definition appeared to include access to metallic loops supplied by cable operators but not to other physical media such as coaxial cable or fibre connections used by such operators to provide broadband services. Given the substantial deployment of cable systems in the UK market and the competitive constraint, albeit currently indirect, this places on wholesale services offered by local loop providers, we considered it appropriate to include cable access in the relevant product market. Cable access includes the combination of traditional metallic loops with a co-axial cable.
A2.94 As a result, we considered that our market definition corresponded closely to that set out in the 2003 Recommendation, taking account of national circumstances. In this context, we noted the Commission’s response to our consultation in that the exclusion of cable-based access from the relevant market definition would not impact on Ofcom’s SMP findings.
A2.95 The 2007 Recommendation has amended the relevant market definition (i.e. Market 4) as follows:
"Wholesale (physical) network infrastructure access (including shared or fully unbundled access) at a fixed location"
A2.96 This definition appears to include FTTP as it is no longer restricted to metallic loops and sub-loops as in the previous market definition.
A2.97 We explicitly considered whether fibre-to-the-home (“FTTH”) acted as a competitive constraint on local loop and cable connections in the 2004 Market Review. We concluded that it did not, because of very limited deployment of FTTH and the fact that this was not expected to change over a two or three year time horizon.
A2.98 In this assessment of whether there has been any material change, we have considered the impact of FTTP on the market definition and also on the assessment of BT’s SMP. The current role out of FTTP remains very limited in the UK. As discussed in paragraph A2.72 above, current plans for FTTP development are limited. Given the likely lead times in rolling out FTTP and the current stock of local loops, we do not believe that FTTP will act as a pricing constraint on local loops for the duration of the interim forward look.
Significant market power in wholesale local access market
A2.99 In the 2004 Market Review, our assessment of dominance focused on assessing the strengths of three distinct sources of actual or potential competitive constraint, namely:
existing competitors;
potential competitors (i.e. the entry threat); and
countervailing buyer power
A2.100 We consider each of these factors below. We conclude that there have been no material changes since the 2004 Market Review, and that BT continues to have SMP for the duration of the interim forward look.

A new pricing framework for Openreach
Exiting competitors
A2.101 The local access network remains one of the least competitive segments of communications networks. In the market outside the Hull area, BT’s market share of local access has been around 83% to 85% since 2000, as shown in the table below.
Table A2.2 Market share of local access connections for the UK excluding Hull Area
BT Virgin Media / ntl & Telewest
Other
2000 84% 13% 3%
2001 84% 14% 3%
2002 84% 13% 3%
2003 83% 13% 4%
2004 83% 14% 3%
2005 84% 14% 3%
2006 84% 13% 2%
2007 85% 14% 2%
2008 85% 14% 1% Source: Ofcom estimates from operator data (revised and updated estimates compared to the Second Consultation). Note: This table shows the ownership of exchange line connections (including both analogue and digital lines), except that due to data availability, up to the end of 2003, WLR lines are included in 'other'. From 2004, all lines owned by BT are included in the BT market share, regardless of whether they are WLR or LLU lines. A2.102 BT’s market share has therefore remained broadly constant since the 2004 Market
Review, and is expected to remain constant during our interim forward look period.
A2.103 One change that has occurred since the 2004 Market Review is that the two main cable companies ntl and Telewest merged in March 2006. They subsequently merged with Virgin Mobile, becoming Virgin Media. Combined, Virgin Media has around 13% to 14% of the market (as shown in the table above). There was little overlap between the geographic areas covered by ntl and Telewest and they therefore did not compete with one another before the merger in terms of local access. The OFT did not refer the merger to the Competition Commission because it did not believe there would be any substantial lessening of competition in any market.20 There has been no significant impact on BT’s market share since the merger. We do not regard this merger as a material change to BT’s market power.
A2.104 Table A2.2 gives information about the proportion of local access connections actually supplied by each of the major operators. However, such shares might understate the competitive pressures in the market place. In particular, even where customers do not choose to obtain services from the cable operator, the presence of a cable offering may constrain BT’s pricing of wholesale local access. Virgin Media’s cable network passes around half of UK households. Consequently, Virgin Media is an option for a substantially greater number of households than are currently serviced by it. However, the share of the market that can potentially be reached by cable has been fairly constant since 2004. We therefore conclude that there has been no material change since the 2004 Market Review.
20 http://www.oft.gov.uk/shared_oft/mergers_ea02/2005/ntltelewest.pdf

A new pricing framework for Openreach
27
Potential competitors (i.e. the entry threat)
A2.105 Even if the market were subject to limited actual competition, the operators in that market may be subject to effective constraint if it is easy for new operators to enter the market in response to any attempt to exploit market power.
A2.106 The 2004 Market Review found that the barriers to entry for the wholesale local access market are high. It would therefore be very difficult for a new operator to enter the market.
A2.107 The establishment of a similar wholesale local access network to BT’s would entail very significant capital investment. Given the scale of the work required to duplicate even a portion of BT’s extensive network, implementation would take a considerable period of time.
A2.108 In the 2004 Market Review, we stated that the development of fixed wireless technologies appeared a more likely route for new entry, but that these were unlikely to impose a constraining effect on fixed local access for the time horizon of that review. We do not believe that the situation has changed materially, which we believe will remain the case during the interim forward look period, and the potential development as well as deployment of such technologies is unlikely to be such as to impose a constraining effect on fixed local access.
A2.109 Since the 2004 Market Review, there has been some limited new entry. For example, in South Yorkshire, the regional authority is developing FTTC. New deployments of FTTP by companies such as H2O Networks Ltd could also exert some competitive restraint on BT. However, these developments are very limited in comparison to the volume of BT local loops. We therefore consider that there have been no material changes in the threat of entry compared to the 2004 Market Review.
Countervailing buyer power
A2.110 For countervailing buyer power to be effective, the customers of wholesale local access services must be able to make a credible threat to switch their demand away from BT.
A2.111 The 2004 Market Review noted that, in practice, the main purchaser of wholesale local access services from BT is BT itself. It did not seem likely to us that BT’s own downstream operations would utilise any buyer power they possess to undermine BT’s market position in the upstream market. BT Wholesale remains the largest customer of Openreach’s wholesale local access services. While BT Wholesale share of purchases has fallen with the growth of LLU, it remains the largest buyer.
A2.112 While in theory some wholesale customers might be able to threaten to switch their service provision to using cable-based access, if the cable operators were to start to offer an equivalent to LLU, the extent of such switching would be limited given BT’s significant presence in the downstream markets and the constraint that the cable network can only reach around half of homes.
A2.113 We believe there have been no changes in the possibility of countervailing buyer power since the 2004 Market Review, and that no purchasers would be able to exert this power. We believe that this will remain the case for the interim forward look period.

A new pricing framework for Openreach
Conclusion on SMP
A2.114 The 2004 Market Review set out that a change in the competitive conditions would require:
i) a radical increase in the competitive appeal of the services provided by the cable operators;
ii) the emergence of a credible new entrant in the supply of wholesale local access services; or
iii) a transformation in the buyer side of the market.
A2.115 We believe that none of these scenarios have occurred since 2004. We therefore conclude that there have been no material changes in the finding of BT having SMP.
A2.116 As a result, we also conclude that BT’s obligations under the new SMP Condition FA3(A) imposing the charge controls are appropriate and proportionate in relation to the competition problems identified in the 2004 Market Review. For reasons set out in that Review, we consider that the imposition of ex ante regulation, including these new charge controls, in this market is justified on the basis that it is not effectively competitive.
A2.117 In particular, we remain of the view that ex post competition law remedies are not
sufficient to address the identified competition problems, such as market dominance, network externality effects and entry barriers. We further discuss in Section 5 of this Statement the presence of a relevant risk of adverse effects arising from price distortion arising from our market analysis. In so doing, we have taken account of relevant guidance, particularly the ERG Common Position on Remedies.21
21 Revised ERG Common Position on the approach to Appropriate remedies in the new regulatory framework, ERG (06) 33, as complemented by ERG (06) 70 Rev1.

A new pricing framework for Openreach
29
Annex 3
3 Legal Instruments LLU charge control SMP condition; Withdrawals of MPF and Specified LLU Services charge ceilings Directions; Consent for the reduced period to notify MPF Rental charge change
Part I – Setting of, and modification to, SMP conditions
NOTIFICATION UNDER SECTIONS 48(1) AND 86 OF THE COMMUNICATIONS ACT
2003
Background
1. On 16 December 2004, the Office of Communications (“Ofcom”) published a document entitled ‘Review of the wholesale local access market — Identification and analysis of markets, determination of market power and setting of SMP conditions — Explanatory statement and notification’ (the “2004 Notification”).22
2. At Annex 1 to the 2004 Notification, Ofcom published a notification identifying, in accordance with section 79 of the Communications Act 2003 (the “Act”), the services market of wholesale local access services within the United Kingdom, but not including the Hull Area23, in which Ofcom determined that, for the purposes of making a market power determination under the Act 2003, BT24 has significant market power.
3. As a result of that market power determination, in accordance with section 48(1) of the Act, Ofcom set on BT pursuant to section 45 of the Act the SMP services conditions set out in Schedule 1 to the 2004 Notification, including Condition FA3 which imposes obligations on BT with regard to cost based charges, which conditions also apply to the provision of Co-Location.
4. On 30 November 2005, Ofcom published a document entitled ‘Local loop unbundling: setting the fully unbundled rental charge ceiling and minor amendment to SMP conditions FA6 and FB6’.25
5. On 30 May 2008, Ofcom published a document entitled ‘A New Pricing Framework for Openreach’ for initial consultation to review whether there is a need to change the existing level and structure of charges for the regulated wholesale access services.26 That first consultation document stated that any specific proposals would be set out in a further consultation document, but meanwhile Ofcom invited responses on a number of matters,
22 http://www.ofcom.org.uk/consult/condocs/rwlam/statement/rwlam161204.pdf 23 The expression "Hull Area" means the area defined as the 'Licensed Area' in the licence granted on 30 November 1987 by the Secretary of State under section 7 of the Telecommunications Act 1984 to Kingston upon Hull City Council and Kingston Communications (Hull) plc (see paragraph 11(b) of the 2004 Notification). 24 The expression "BT" means British Telecommunications plc, whose registered company number is 1800000, and any of its subsidiaries or holding companies, or any subsidiary of such holding companies, all as defined by section 736 of the Companies Act 1985, as amended by the Companies Act 1989 (see paragraph 11(b) of the 2004 Notification). 25 http://www.ofcom.org.uk/consult/condocs/llu/statement/llu_statement.pdf 26 http://www.ofcom.org.uk/consult/condocs/openreach/openreachcondoc.pdf
A new pricing framework for Openreach
including on Ofcom’s initial analysis and emerging views on the evidence obtained by that time, such as on movement in costs. Ofcom received 13 responses to that consultation.
6. On 5 December 2008, Ofcom published its second consultation document also entitled ‘A New Pricing Framework for Openreach’27 (the “Second Consultation”), which included a publication at Part I of Annex 8 to that document of a notification under sections 48(2) and 86 of the Act setting out Ofcom’s proposal to set a new SMP Condition FA3(A) for the purpose of imposing on BT a charge control on certain products and/or services falling within the market for wholesale local access services within the United Kingdom (excluding the Hull Area) and the provision of Co-Location. As a result of that proposal, that notification included Ofcom’s proposal of a consequential modification to SMP Condition FA3 (Basis of charges) and, in separate notifications under section 49 of the Act as published in Part II to VI of Annex 8, Ofcom’s proposals to withdraw and to modify related Directions as well as to give consent for the period under which BT must give advance notice of price changes.
7. Copies of the Second Consultation, including the notifications published in its Annex 8, were sent to the Secretary of State in accordance with section 50(1)(a) of the Act, as well as to the European Commission and to the regulatory authorities of every other member State in accordance with section 50(3) of the Act. Ofcom invited representations on its proposals by 20 February 2009. In light of comments received from stakeholders on the complexity of the issues under consideration, Ofcom extended the deadline by two weeks, with a new closing date for responses by 6 March 2009. At the same time, Ofcom published a short list of clarifications and typographic corrections to the consultation which had been identified since publication.28
8. By virtue of section 48(5) of the Act, Ofcom may give effect, with or without modifications, to a proposal with respect to which Ofcom has published a notification under section 48(2) of the Act only if—
(a) Ofcom has considered every representation about the proposal that is made to it within the period specified in the notification; and
(b) Ofcom has had regard to every international obligation of the United Kingdom (if any) which has been notified to it for this purpose by the Secretary of State.
9. Ofcom received 15 responses to the Second Consultation, including comments of the European Commission, and has considered every such representation duly made. The Secretary of State has not notified Ofcom of any international obligation of the United Kingdom for this purpose.
Decisions
10. Ofcom hereby, in accordance with section 48(1) of the Act and in relation to the services market identified in paragraph 1(a) of the 2004 Notification in which Ofcom has determined BT to be a person having significant market power, sets SMP Condition FA3(A) to apply to BT as set out in Schedule 1 to this Notification. In making that decision, Ofcom is, in accordance with section 86(1)(b) of the Act, satisfied there has been no material change in that market since the market power determination was made.
11. Ofcom also hereby, in accordance with section 48(1) of the Act and in relation to the services market identified in paragraph 1(a) of the 2004 Notification in which Ofcom has determined BT to be a person having significant market power, modifies SMP Condition FA3 in Part 2 of Schedule 1 to the 2004 Notification as set out in Schedule 2 to this Notification 27 http://www.ofcom.org.uk/consult/condocs/openreachframework/off.pdf 28 http://www.ofcom.org.uk/consult/condocs/openreachframework/extension/

A new pricing framework for Openreach
31
in respect of its application to BT. In making that decision, Ofcom is, in accordance with section 86(4)(a) of the Act, satisfied there has been no material change in that market since SMP Condition FA3 was set.
12. The effect of, and Ofcom’s reasons for making, these decisions are contained in Section 7 of the explanatory statement accompanying this Notification.
13. Ofcom considers that the setting of SMP Condition FA3(A) and modification to SMP Condition FA3 referred to above comply with the requirements of sections 45 to 47, 87 and 88 of the Act as appropriate and relevant to them.
13. In making these decisions, Ofcom has considered and acted in accordance with its general duties set out in section 3 of, and the six Community requirements set out in section 4, of the Act.
15. Copies of this Notification and the accompanying explanatory statement have been sent to the Secretary of State in accordance with section 50(1)(a) of the Act and to the European Commission in accordance with section 50(2)(a) of the Act.
Interpretation
16. Except for references made to the identified services market in this Notification as set out in the 2004 Notification and except as otherwise defined in paragraph 17 below, words or expressions used in this Notification shall have the same meaning as they have been ascribed in the Act.
17. In this Notification—
(a) “2004 Notification” has the meaning given to it in paragraph 1 above;
(b) “Act” means the Communications Act 2003 (c.21);
(c) “BT” has the meaning given to it in paragraph 2 above;
(d) “Hull Area” has the meaning given to it in paragraph 2 above;
(e) “Ofcom” means Office of Communications; and
(f) “Second Consultation” has the meaning given to it in paragraph 6 above.
18. For the purpose of interpreting this Notification—
(a) headings and titles shall be disregarded; and
(b) the Interpretation Act 1978 (c. 30) shall apply as if this Notification were an Act of Parliament.
19. Schedules 1 and 2 to this Notification shall form part of this Notification.
20. Unless otherwise stated in the Schedules to this Notification, the decisions set out above shall take effect on the day this Notification is published.

A new pricing framework for Openreach
CRAIG LONIE
Director of Competition Finance
A person duly authorised in accordance with paragraph 18 of the Schedule to the Office of Communications Act 2002
22 May 2009

A new pricing framework for Openreach
33
Schedule 1
Setting of new SMP Condition FA3(A)
1. The following new SMP Condition FA3(A) shall be set by inserting it after Condition FA3 in Part 2 of Schedule 1 to the 2004 Notification—
Condition FA3(A) – Charge control
FA3(A).1 Without prejudice to the generality of Condition FA3, and subject to paragraphs FA3(A).3 and FA3(A).6, the Dominant Provider shall take all reasonable steps to secure that, at the end of each Relevant Year, the Percentage Change in:
(a) the aggregate of charges for SMPF Ancillary Services;
(b) the aggregate of charges for MPF Ancilliary Services;
(c) the aggregate of charges for Co-Mingling Services;
(d) the charge for MPF Transfer, except for the First Relevant Year in relation to which the charge ceiling specified in paragraph FA3(A).2(c) applies;
(e) the charge for MPF New Provide, except for the First Relevant Year in relation to which the charge ceiling specified in paragraph FA3(A).2(d) applies;
(f) the charge for MPF Cease;
(g) the charge for SMPF Connection, except for the First Relevant Year in relation to which the charge ceiling specified in paragraph FA3(A).2(e) applies;
(h) the charge for SMPF Cease;
(i) the charge for MPF Rental, except for the First Relevant Year in relation to which the charge ceiling specified in paragraph FA3(A).2(a) applies;
(j) the charge for SMPF Rental, except for the First Relevant Year in relation to which the charge ceiling specified in paragraph FA3(A).2(b) applies,
in each of the ten categories of products and/or services specified in paragraphs FA3(A).1(a) to (j) above is not more than the Controlling Percentage (as determined in accordance with paragraph FA3(A).8).
FA3(A).2 The Dominant Provider shall not charge more than:
(a) for MPF Rental, the amount of £86.40 in the First Relevant Year;
(b) for SMPF Rental, the amount of £15.60 in the First Relevant Year;
(c) for the MPF Transfer, the amount of £38.00 in the First Relevant Year;

A new pricing framework for Openreach
(d) for MPF New Provide, the amount of £99.95 for the period beginning on 22 May 2009 and ending on 31 August 2009, and the amount of £76.00 for the remainder of the First Relevant Year;
(e) for the SMPF Connection, the amount of £38.00 in the First Relevant Year.
FA3(A).3 For the purpose of complying with paragraph FA3(A).1 (and except in relation to the charges specified in FA3(A).2 for the First Relevant Year), the Dominant Provider shall take all reasonable steps to secure that the revenue it accrues as a result of all relevant individual charge changes during any Relevant Year shall be no more than that which it would have accrued had all of those changes been made at the beginning of the Relevant Year. For the avoidance of doubt, this obligation shall be deemed to be satisfied where, in the case of a single change in charges during the Relevant Year, the following formula is satisfied:
TRCDRC 1
where:
RC is the revenue change associated with the single charge change made in the Relevant Year, calculated by the relevant Percentage Change immediately following the charge change multiplied by the revenue accrued during the Prior Financial Year;
TRC is the target revenue change required in the Relevant Year to achieve compliance with paragraph FA3(A).1, calculated by the Percentage Change required in the Relevant Year to achieve compliance with paragraph FA3(A).1 multiplied by the revenue accrued during the Prior Financial Year; and
D is the elapsed proportion of the Relevant Year, calculated as the date on which the change in charges takes effect, expressed as a numeric entity on a scale ranging from 22nd May = 0 to 31st March = 311, divided by 312 for the First Relevant Year and 1st April = 0 to 31st March = 364, divided by 365 for the Second Relevant Year.
FA3(A).4 The Percentage Change for the purposes of each of the categories of products and/or services (each of which is known as a ‘basket’) specified in paragraphs FA3(A).1(a), FA3(A).1(b) and FA3(A).1(c) respectively shall be calculated by employing the following formula:
n
ii
n
i i
iiti
t
R
p
ppR
C
1
1 ,0
,0, )(
where:
Ct is the Percentage Change in the aggregate of charges for the products and/or services in the specified category (‘basket’) at a particular time t during the Relevant Year;
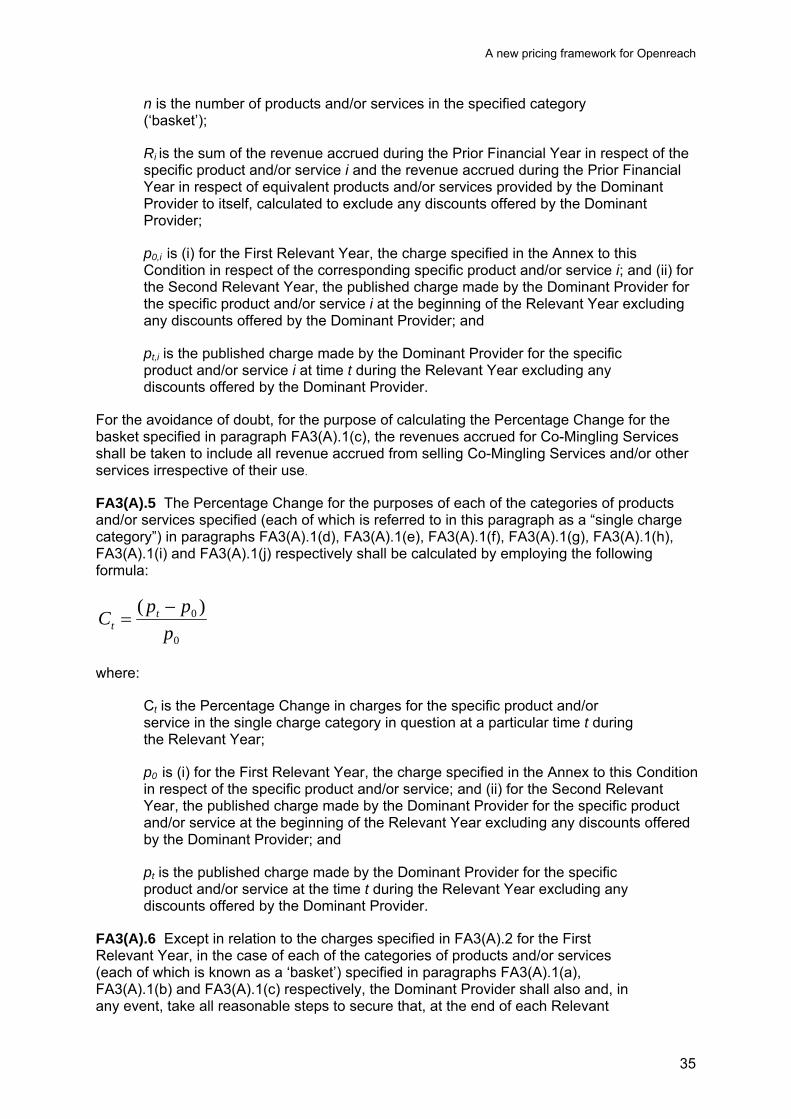
A new pricing framework for Openreach
35
n is the number of products and/or services in the specified category (‘basket’);
Ri is the sum of the revenue accrued during the Prior Financial Year in respect of the specific product and/or service i and the revenue accrued during the Prior Financial Year in respect of equivalent products and/or services provided by the Dominant Provider to itself, calculated to exclude any discounts offered by the Dominant Provider;
p0,i is (i) for the First Relevant Year, the charge specified in the Annex to this Condition in respect of the corresponding specific product and/or service i; and (ii) for the Second Relevant Year, the published charge made by the Dominant Provider for the specific product and/or service i at the beginning of the Relevant Year excluding any discounts offered by the Dominant Provider; and
pt,i is the published charge made by the Dominant Provider for the specific product and/or service i at time t during the Relevant Year excluding any discounts offered by the Dominant Provider.
For the avoidance of doubt, for the purpose of calculating the Percentage Change for the basket specified in paragraph FA3(A).1(c), the revenues accrued for Co-Mingling Services shall be taken to include all revenue accrued from selling Co-Mingling Services and/or other services irrespective of their use.
FA3(A).5 The Percentage Change for the purposes of each of the categories of products and/or services specified (each of which is referred to in this paragraph as a “single charge category”) in paragraphs FA3(A).1(d), FA3(A).1(e), FA3(A).1(f), FA3(A).1(g), FA3(A).1(h), FA3(A).1(i) and FA3(A).1(j) respectively shall be calculated by employing the following formula:
0
0 )(
p
ppC t
t
where:
Ct is the Percentage Change in charges for the specific product and/or service in the single charge category in question at a particular time t during the Relevant Year;
p0 is (i) for the First Relevant Year, the charge specified in the Annex to this Condition in respect of the specific product and/or service; and (ii) for the Second Relevant Year, the published charge made by the Dominant Provider for the specific product and/or service at the beginning of the Relevant Year excluding any discounts offered by the Dominant Provider; and
pt is the published charge made by the Dominant Provider for the specific product and/or service at the time t during the Relevant Year excluding any discounts offered by the Dominant Provider.
FA3(A).6 Except in relation to the charges specified in FA3(A).2 for the First Relevant Year, in the case of each of the categories of products and/or services (each of which is known as a ‘basket’) specified in paragraphs FA3(A).1(a), FA3(A).1(b) and FA3(A).1(c) respectively, the Dominant Provider shall also and, in any event, take all reasonable steps to secure that, at the end of each Relevant

A new pricing framework for Openreach
Year, the Percentage Change in discrete charges for each and every product and/or service falling within the basket in question is:
(a) no more than the Controlling Percentage increased by 10 percentage points; and
(b) no less than the Controlling Percentage reduced by 10 percentage points;
where, for the purposes of (a) and (b) above, Controlling Percentage is the Controlling Percentage (as determined in accordance with paragraph FA3(A).8) for the basket within which the product and/or service falls to which the discrete charges relate. For the purpose of this paragraph FA3(A).6, the Percentage Change shall be calculated by employing the formula set out in paragraph FA3(A).5 and its references to a single charge category shall be treated as references to charges for the specific product and/or service falling with the basket in question.
FA3(A).7 For the purpose of complying with paragraph FA3(A).6, the Dominant Provider shall take all reasonable steps to secure that the revenue it accrues as a result of all relevant individual charge changes during any Relevant Year shall be no more than that which it would have accrued had all of those changes been made at the beginning of the Relevant Year. For the avoidance of doubt, this obligation shall be deemed to be satisfied where, in the case of a single change in charges during the Relevant Year, the following formula is satisfied:
TRCDRC 1
where:
RC is the revenue change associated with the single charge change made in the Relevant Year, calculated by the relevant Percentage Change immediately following the charge change multiplied by the revenue accrued during the Prior Financial Year;
TRC is the target revenue change required in the Relevant Year to achieve compliance with paragraph FA3(A).1, calculated by the Percentage Change required in the Relevant Year to achieve compliance with paragraph FA3(A).1 multiplied by the revenue accrued during the Prior Financial Year; and
D is the elapsed proportion of the Relevant Year, calculated as the date on which the change in charges takes effect, expressed as a numeric entity on a scale ranging from 22nd May = 0 to 31st March = 311, divided by 312 for the First Relevant Year and 1st April = 0 to 31st March = 364, divided by 365 for the Second Relevant Year.
FA3(A).8 Subject to paragraphs FA3(A).9 and FA3(A).10, the Controlling Percentage in relation to any Relevant Year means:
(a) for the category of products and/or services specified in paragraph FA3(A).1(a),
i. for the First Relevant Year, 3 percentage points, and
ii. for the Second Relevant Year, RPI increased by 4.5 percentage points;

A new pricing framework for Openreach
37
(b) for the category of products and/or services specified in paragraph FA3(A).1(b),
i. for the First Relevant Year, 3 percentage points, and
ii. for the Second Relevant Year, RPI increased by 4.5 percentage points;
(c) for the category of products and/or services specified in paragraph FA3(A).1(c),
i. for the First Relevant Year, 3 percentage points, and
ii. for the Second Relevant Year, RPI increased by 4.5 percentage points;
(d) for the category of products and/or services specified in paragraph FA3(A).1(d), for the Second Relevant Year, RPI increased by 2.5 percentage points;
(e) for the category of products and/or services specified in paragraph FA3(A).1(e), for the Second Relevant Year, RPI decreased by 0.5 percentage points;
(f) for the category of products and/or services specified in paragraph FA3(A).1(f),
i. for the First Relevant Year, 3 percentage points, and
ii. for the Second Relevant Year, RPI increased by 4.5 percentage points;
(g) for the category of products and/or services specified in paragraph FA3(A).1(g) for the Second Relevant Year, RPI increased by 2.5 percentage points;
(h) for the category of products and/or services specified in paragraph FA3(A).1(h),
i. for the First Relevant Year, 3 percentage points, and
ii. for the Second Relevant Year, RPI increased by 4.5 percentage points;
(i) for the category of products and/or services specified in paragraph FA3(A).1(i) for the Second Relevant Year, RPI increased by 5.5 percentage points;
(j) for the category of products and/or services specified in paragraph FA3(A).1(j) for the Second Relevant Year, RPI increased by 1.0 percentage points;
For the avoidance of doubt, the MPF Transfer, MPF New Provide, SMPF Connection, MPF Rental and SMPF Rental charges are constrained by FA3(A).2 in the First Relevant Year.
A new pricing framework for Openreach
FA3(A).9 Where the Percentage Change in any Relevant Year is less than the Controlling Percentage, then for the purposes of each of the categories of products and/or services specified in paragraphs FA3(A).1(a), FA3(A).1(b), FA3(A).1(c), FA3(A).1(d), FA3(A).1(e), FA3(A).1(f), FA3(A).1(g), FA3(A).1(h), FA3(A).1(i) and FA3(A).1(j) respectively the Controlling Percentage for the following Relevant Year shall be determined in accordance with paragraph FA3(A).8, but increased by the amount of such deficiency.
FA3(A).10 Where the Percentage Change in any Relevant Year is more than the Controlling Percentage, then for the purposes of each of the categories of products and/or services specified in paragraphs FA3(A).1(a), FA3(A).1(b), FA3(A).1(c), FA3(A).1(d), FA3(A).1(e), FA3(A).1(f), FA3(A).1(g), FA3(A).1(h), FA3(A).1(i) and FA3(A).1(j) respectively the Controlling Percentage for the following Relevant Year shall be determined in accordance with paragraph FA3(A).8, but decreased by the amount of such excess.
FA3(A).11 Where the Dominant Provider makes a material change (other than to a charge) to any product or service which is subject to this Condition or to the date on which its financial year ends or there is a material change in the basis of the Retail Prices Index, paragraphs FA3(A).1 to FA3(A).10 shall have effect subject to such reasonable adjustment to take account of the change as Ofcom may direct to be appropriate in the circumstances. For the purposes of this paragraph, a material change to any product or service which is subject to this Condition includes the introduction of a new product or service wholly or substantially in substitution for that existing product or service.
FA3(A).12 The Dominant Provider shall record, maintain and supply to Ofcom in writing, no later than three months after the end of each Relevant Year, the data necessary for OFCOM to monitor compliance of the Dominant Provider with the price control by performing the calculation of the Percentage Change. The data shall include:
(a) pursuant to Condition FA3(A), the calculated percentage change relating to each category of products and services listed in conditions FA3(A).1 (a) through to (j);
(b) pursuant to Condition FA3(A).3, calculation of the revenue accrued as a result of all relevant individual charge charges during any Relevant Year compared to the target revenue change;
(c) all relevant data the Dominant Provider used in the calculation of the percentage change Ct pursuant to Conditions FA3(A).4, including for each specific product or service i ;
(d) all relevant revenues accrued during the Relevant Financial Year in respect of the specific product or service;
(e) published charges made by the Dominant Provider at time t during the Relevant Year excluding any discounts offered by the Dominant Provider;
(f) the relevant published charge at the start of the Relevant Year;
(g) all relevant data the Dominant Provider used in the calculation the percentage change Ct pursuant to Conditions FA3(A).5, for the category of
A new pricing framework for Openreach
39
products and services specified in paragraph FA3(A).1(a), FA3(A).1(b), and FA3(A).1(c);
(h) published charges made by the Dominant Provider at time t during the Relevant Year excluding any discounts offered by the Dominant Provider;
(i) the relevant published charge at the start of the Relevant Year; and
(j) other data necessary for monitoring compliance with the charge control.
FA3(A).13 Paragraphs FA3(A).1 to FA3(A).12 shall not apply to such extent as Ofcom may direct.
FA3(A).14 The Dominant Provider shall comply with any direction Ofcom may make from time to time under this Condition.
FA3(A).15 In this Condition:
(a) “Co-Mingling Services” means all of the products and/or services listed from time to time for the purpose of Part 3 of the Annex to this Condition;
(b) “Controlling Percentage” is to be determined in accordance with Condition FA3(A).8;
(c) “MPF Ancilliary Services” means all of the products and/or services listed from time to time for the purpose of Part 2 of the Annex to this Condition;
(d) “MPF Cease” shall be construed as having the same meaning as ‘MPF Cease’ has for the purpose of Part 2 of the Annex to this Condition;
(e) “MPF New Provide” shall be construed as having the same meaning as ‘MPF Connection – New Provide – Standard’ has for the purpose of Part 2 of the Annex to this Condition;
(f) “MPF Rental” shall be construed as the annual rental of access to Metallic Path Facilities;
(g) “MPF Transfer” shall be construed as having the same meaning as ‘MPF Transfer’ has for the purpose of Part 2 of the Annex to this Condition;
(h) “Ofcom” means the Office of Communications;
(i) “Prior Financial Year” means the period of 12 months ending on 31 March immediately preceding the Relevant Year;
(j) “Relevant Year” means either of the following two periods:
(1) the period beginning on 22 May 2009 and ending on 31 March 2010 (the “First Relevant Year”);
(2) the period beginning on 1st April 2010 and ending on 31 March 2011 (the “Second Relevant Year”);

A new pricing framework for Openreach
(k) “Retail Prices Index” means the index of retail prices complied by an agency or a public body on behalf of Her Majesty’s Government or a governmental department (which is the Office for National Statistics at the time of publication of this Notification) from time to time in respect of all items;
(l) “RPI” means the amount of the change in the Retail Prices Index in the period of twelve months ending on 31st October immediately before the beginning of a Relevant Year, expressed as a percentage (rounded to two decimal places) of that Retail Prices Index as at the beginning of that first mentioned period;
(m) “SMPF Ancillary Services” means all of the products and/or services listed from time to time for the purpose of Part 1 of the Annex to this Condition;
(n) “SMPF Cease” shall be construed as having the same meaning as ‘SMPF Cease’ has for the purpose of Part 1 of the Annex to this Condition;
(o) “SMPF Rental” shall be construed as rental of access to the non-voice band frequency of Metallic Path Facilities; and
(p) “SMPF Transfer” shall be construed as having the same meaning as ‘SMPF Connection – Basic Provide on existing narrowband, Simultaneous Provide of SMPF with narrowband, Singleton Migration (Transfer or change of CP migrations) from Narrowband, MPF, SMPF and ISDN/ Highway’ has for the purpose of Part 1 of the Annex to this Condition.
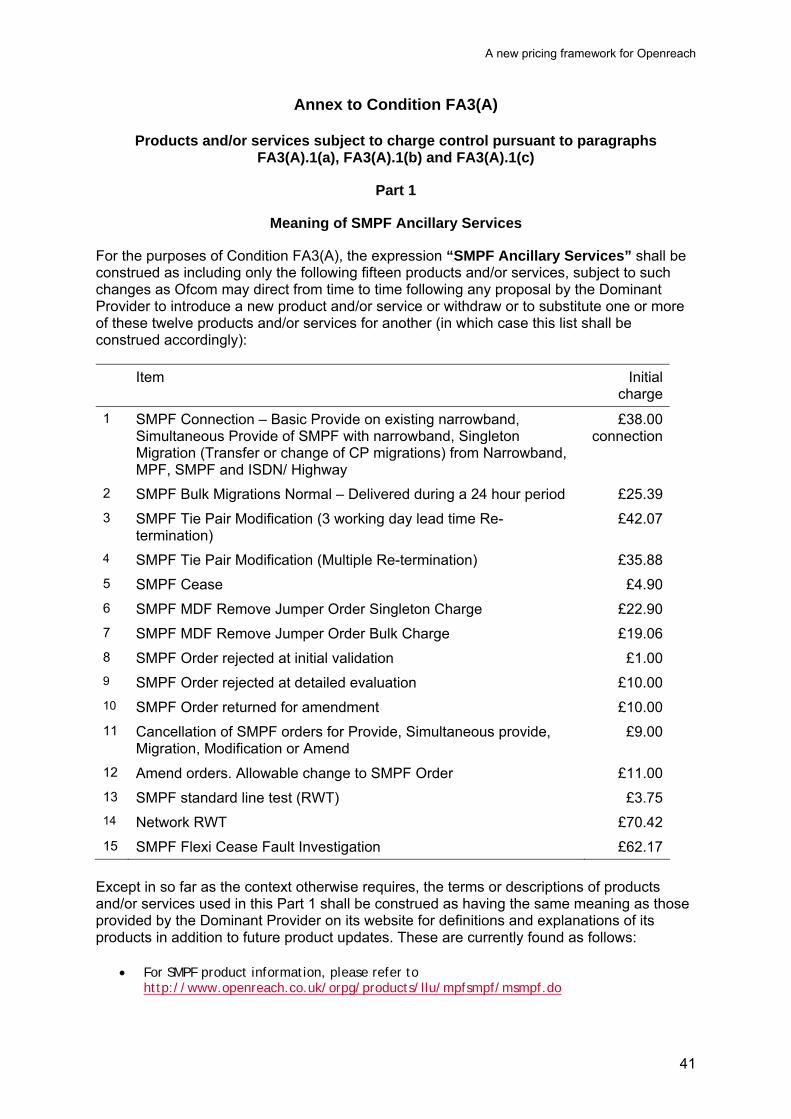
A new pricing framework for Openreach
41
Annex to Condition FA3(A)
Products and/or services subject to charge control pursuant to paragraphs FA3(A).1(a), FA3(A).1(b) and FA3(A).1(c)
Part 1
Meaning of SMPF Ancillary Services
For the purposes of Condition FA3(A), the expression “SMPF Ancillary Services” shall be construed as including only the following fifteen products and/or services, subject to such changes as Ofcom may direct from time to time following any proposal by the Dominant Provider to introduce a new product and/or service or withdraw or to substitute one or more of these twelve products and/or services for another (in which case this list shall be construed accordingly):
Item Initial charge
1 SMPF Connection – Basic Provide on existing narrowband, Simultaneous Provide of SMPF with narrowband, Singleton Migration (Transfer or change of CP migrations) from Narrowband, MPF, SMPF and ISDN/ Highway
£38.00 connection
2 SMPF Bulk Migrations Normal – Delivered during a 24 hour period £25.39
3 SMPF Tie Pair Modification (3 working day lead time Re-termination)
£42.07
4 SMPF Tie Pair Modification (Multiple Re-termination) £35.88
5 SMPF Cease £4.90
6 SMPF MDF Remove Jumper Order Singleton Charge £22.90
7 SMPF MDF Remove Jumper Order Bulk Charge £19.06
8 SMPF Order rejected at initial validation £1.00
9 SMPF Order rejected at detailed evaluation £10.00
10 SMPF Order returned for amendment £10.00
11 Cancellation of SMPF orders for Provide, Simultaneous provide, Migration, Modification or Amend
£9.00
12 Amend orders. Allowable change to SMPF Order £11.00
13 SMPF standard line test (RWT) £3.75
14 Network RWT £70.42
15 SMPF Flexi Cease Fault Investigation £62.17
Except in so far as the context otherwise requires, the terms or descriptions of products and/or services used in this Part 1 shall be construed as having the same meaning as those provided by the Dominant Provider on its website for definitions and explanations of its products in addition to future product updates. These are currently found as follows:
For SMPF product information, please refer to http://www.openreach.co.uk/orpg/products/llu/mpfsmpf/msmpf.do

A new pricing framework for Openreach
For assurance information including care levels, please refer to http://www.openreach.co.uk/orpg/products/llu/repair/repinfo.do
For information held in the price list, please refer to http://www.openreach.co.uk/orpg/pricing/loadPricing.do

A new pricing framework for Openreach
43
Part 2
Meaning of MPF Ancillary Services
For the purposes of Condition FA3(A), the expression “MPF Ancillary Services” shall be construed as including only the following seventeen products and/or services, subject to any such changes as Ofcom may direct from time to time following any proposal by the Dominant Provider to introduce a new product and/or service or withdraw or to substitute one or more of these seventeen products and/or services for another (in which case this list shall be construed accordingly):
Item Initial charge
1 MPF Transfer £38.00
2 MPF Connection – Stopped Line Provide £40.49
3 MPF Connection – New Provide – Standard £76.00
4 MPF Expedite £140.00
5 MPF Same CP Mass Migration charge – Normal hours £27.54
6 MPF Tie Pair Modification (3 working day lead time Re-termination)
£34.74
7 MPF Tie Pair Modification (Multiple Re-termination) £30.05
8 MPF Cease £4.90
9 MPF MDF Remove Jumper Order Singleton Charge £12.77
10 MPF MDF Remove Jumper Order Bulk Charge £8.92
11 MPF Order rejected at initial validation £1.00
12 MPF Order rejected at detailed evaluation £10.00
13 MPF Order returned for amendment £10.00
14 Cancellation of MPF orders for Provide, Migration, Modification or Amend
£9.00
15 Amend orders. Allowable change to MPF Order £11.00
16 MPF Standard line test (RWT) £3.75
17 Network RWT £70.42
Except in so far as the context otherwise requires, the terms or descriptions of products and/or services used in this Part 2 shall be construed as having the same meaning as those provided by the Dominant Provider on its website for definitions and explanations of its products in addition to future product updates. These are currently found as follows:
For MPF product information, please refer to http://www.openreach.co.uk/orpg/products/llu/mpfsmpf/msmpf.do
For assurance information including care levels, please refer to http://www.openreach.co.uk/orpg/products/llu/repair/repinfo.do
For information held in the price list, please refer to
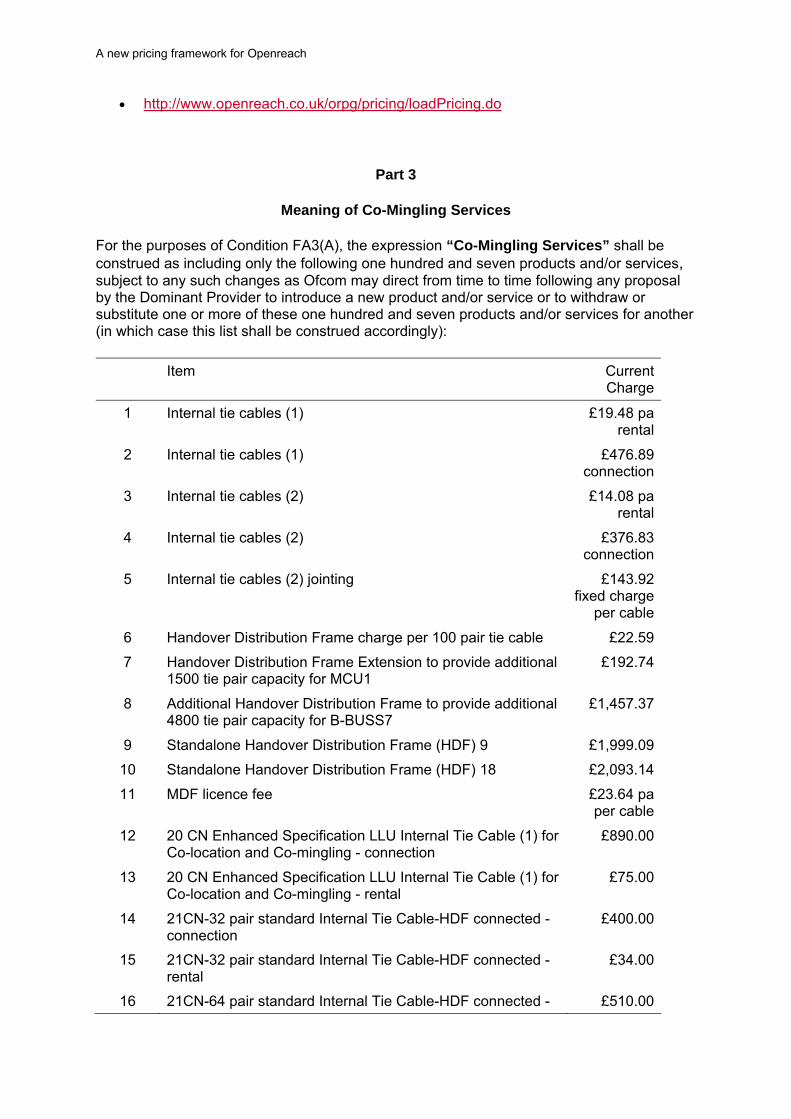
A new pricing framework for Openreach
http://www.openreach.co.uk/orpg/pricing/loadPricing.do
Part 3
Meaning of Co-Mingling Services
For the purposes of Condition FA3(A), the expression “Co-Mingling Services” shall be construed as including only the following one hundred and seven products and/or services, subject to any such changes as Ofcom may direct from time to time following any proposal by the Dominant Provider to introduce a new product and/or service or to withdraw or substitute one or more of these one hundred and seven products and/or services for another (in which case this list shall be construed accordingly):
Item Current Charge
1 Internal tie cables (1) £19.48 pa rental
2 Internal tie cables (1) £476.89 connection
3 Internal tie cables (2) £14.08 pa rental
4 Internal tie cables (2) £376.83 connection
5 Internal tie cables (2) jointing £143.92 fixed charge
per cable
6 Handover Distribution Frame charge per 100 pair tie cable £22.59
7 Handover Distribution Frame Extension to provide additional 1500 tie pair capacity for MCU1
£192.74
8 Additional Handover Distribution Frame to provide additional 4800 tie pair capacity for B-BUSS7
£1,457.37
9 Standalone Handover Distribution Frame (HDF) 9 £1,999.09
10 Standalone Handover Distribution Frame (HDF) 18 £2,093.14
11 MDF licence fee £23.64 pa per cable
12 20 CN Enhanced Specification LLU Internal Tie Cable (1) for Co-location and Co-mingling - connection
£890.00
13 20 CN Enhanced Specification LLU Internal Tie Cable (1) for Co-location and Co-mingling - rental
£75.00
14 21CN-32 pair standard Internal Tie Cable-HDF connected - connection
£400.00
15 21CN-32 pair standard Internal Tie Cable-HDF connected - rental
£34.00
16 21CN-64 pair standard Internal Tie Cable-HDF connected - £510.00
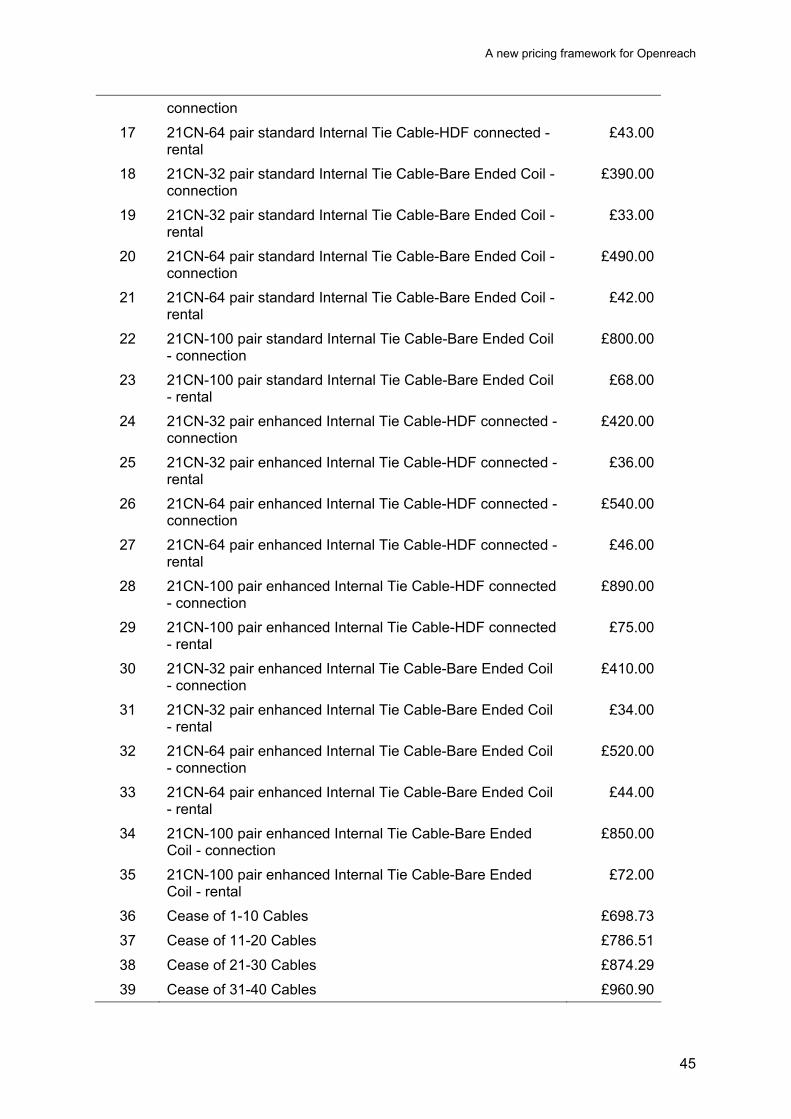
A new pricing framework for Openreach
45
connection
17 21CN-64 pair standard Internal Tie Cable-HDF connected - rental
£43.00
18 21CN-32 pair standard Internal Tie Cable-Bare Ended Coil - connection
£390.00
19 21CN-32 pair standard Internal Tie Cable-Bare Ended Coil - rental
£33.00
20 21CN-64 pair standard Internal Tie Cable-Bare Ended Coil - connection
£490.00
21 21CN-64 pair standard Internal Tie Cable-Bare Ended Coil - rental
£42.00
22 21CN-100 pair standard Internal Tie Cable-Bare Ended Coil - connection
£800.00
23 21CN-100 pair standard Internal Tie Cable-Bare Ended Coil - rental
£68.00
24 21CN-32 pair enhanced Internal Tie Cable-HDF connected - connection
£420.00
25 21CN-32 pair enhanced Internal Tie Cable-HDF connected - rental
£36.00
26 21CN-64 pair enhanced Internal Tie Cable-HDF connected - connection
£540.00
27 21CN-64 pair enhanced Internal Tie Cable-HDF connected - rental
£46.00
28 21CN-100 pair enhanced Internal Tie Cable-HDF connected - connection
£890.00
29 21CN-100 pair enhanced Internal Tie Cable-HDF connected - rental
£75.00
30 21CN-32 pair enhanced Internal Tie Cable-Bare Ended Coil - connection
£410.00
31 21CN-32 pair enhanced Internal Tie Cable-Bare Ended Coil - rental
£34.00
32 21CN-64 pair enhanced Internal Tie Cable-Bare Ended Coil - connection
£520.00
33 21CN-64 pair enhanced Internal Tie Cable-Bare Ended Coil - rental
£44.00
34 21CN-100 pair enhanced Internal Tie Cable-Bare Ended Coil - connection
£850.00
35 21CN-100 pair enhanced Internal Tie Cable-Bare Ended Coil - rental
£72.00
36 Cease of 1-10 Cables £698.73
37 Cease of 11-20 Cables £786.51
38 Cease of 21-30 Cables £874.29
39 Cease of 31-40 Cables £960.90

A new pricing framework for Openreach
40 Cease of 41-50 Cables £1,048.68
41 BT provided cables (100 pairs) £104.93 pa rental
42 BT provided cables (100 pairs) £1,340.11 connection
43 BT provided cables (100 pairs) (additional 100m) £71.24 pa rental
44 BT provided cables (100 pairs) (additional 100m) £209.35 connection
45 BT provided cables (500 pairs) £168.43 pa rental
46 BT provided cables (500 pairs) £2,191.83 connection
47 BT provided cables (500 pairs) (additional 100m) £131.98 pa rental
48 BT provided cables (500 pairs) (additional 100m) £209.35 connection
49 BT provided cables (additional 100 pairs) £89.60 pa rental
50 BT provided cables (additional 100 pairs) £422.28 connection
51 Operator provided cables (100 pairs) £24.68 pa rental
52 Operator provided cables (100 pairs) £1,188.02 connection
53 Operator provided cables (500 pairs) £27.44 pa rental
54 Operator provided cables (500 pairs) £1,689.03 connection
55 Operator provided cables (additional 100 pairs) £13.18 pa rental
56 Operator provided cables (additional 100 pairs) £406.18 connection
57 Hand-over Distribution Frame option per 100 pair Frame capacity
£108.40
58 Distant location full survey £911.24
59 Missed joint survey or testing appointment £17.00
60 Co-location order rejection – no space available £213.00
61 Co-location order discontinued – indicative quote for Co-location facilities above £60,000
£1,700.00
62 Co-location full survey £5,397.00
63 Site visit charge to be allocated to all orders not in conjunction with the installation of a base product.
£275.00
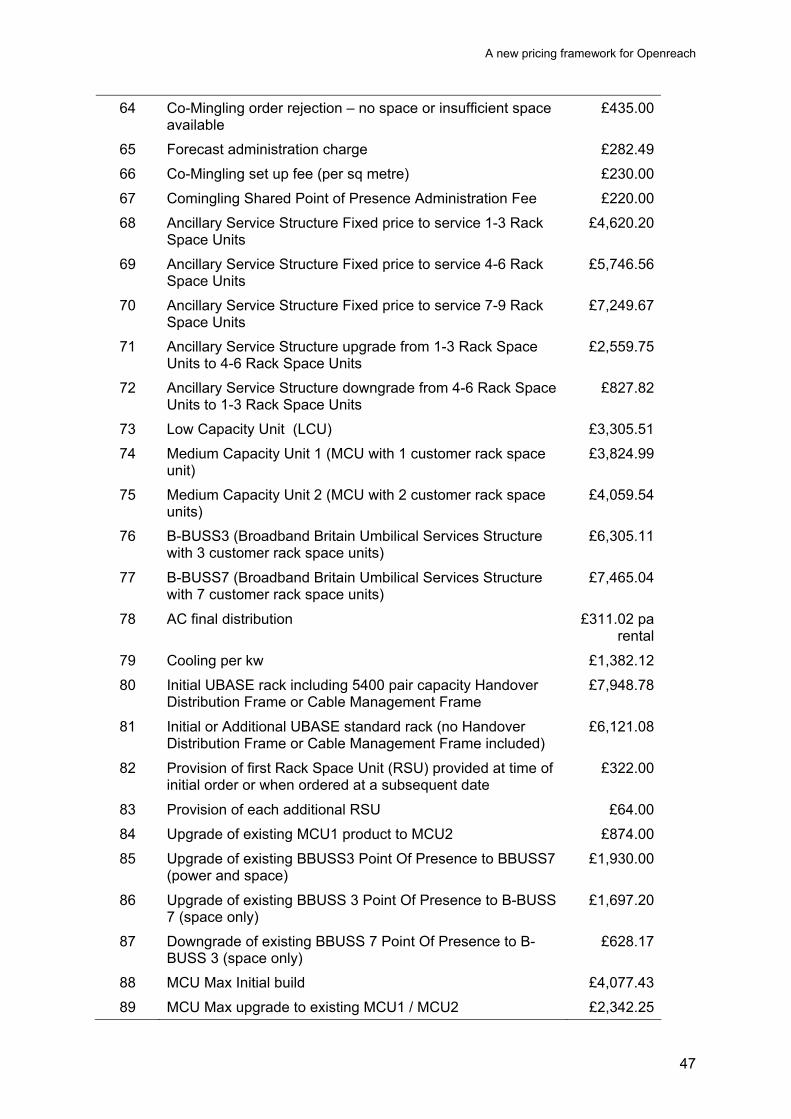
A new pricing framework for Openreach
47
64 Co-Mingling order rejection – no space or insufficient space available
£435.00
65 Forecast administration charge £282.49
66 Co-Mingling set up fee (per sq metre) £230.00
67 Comingling Shared Point of Presence Administration Fee £220.00
68 Ancillary Service Structure Fixed price to service 1-3 Rack Space Units
£4,620.20
69 Ancillary Service Structure Fixed price to service 4-6 Rack Space Units
£5,746.56
70 Ancillary Service Structure Fixed price to service 7-9 Rack Space Units
£7,249.67
71 Ancillary Service Structure upgrade from 1-3 Rack Space Units to 4-6 Rack Space Units
£2,559.75
72 Ancillary Service Structure downgrade from 4-6 Rack Space Units to 1-3 Rack Space Units
£827.82
73 Low Capacity Unit (LCU) £3,305.51
74 Medium Capacity Unit 1 (MCU with 1 customer rack space unit)
£3,824.99
75 Medium Capacity Unit 2 (MCU with 2 customer rack space units)
£4,059.54
76 B-BUSS3 (Broadband Britain Umbilical Services Structure with 3 customer rack space units)
£6,305.11
77 B-BUSS7 (Broadband Britain Umbilical Services Structure with 7 customer rack space units)
£7,465.04
78 AC final distribution £311.02 pa rental
79 Cooling per kw £1,382.12
80 Initial UBASE rack including 5400 pair capacity Handover Distribution Frame or Cable Management Frame
£7,948.78
81 Initial or Additional UBASE standard rack (no Handover Distribution Frame or Cable Management Frame included)
£6,121.08
82 Provision of first Rack Space Unit (RSU) provided at time of initial order or when ordered at a subsequent date
£322.00
83 Provision of each additional RSU £64.00
84 Upgrade of existing MCU1 product to MCU2 £874.00
85 Upgrade of existing BBUSS3 Point Of Presence to BBUSS7 (power and space)
£1,930.00
86 Upgrade of existing BBUSS 3 Point Of Presence to B-BUSS 7 (space only)
£1,697.20
87 Downgrade of existing BBUSS 7 Point Of Presence to B-BUSS 3 (space only)
£628.17
88 MCU Max Initial build £4,077.43
89 MCU Max upgrade to existing MCU1 / MCU2 £2,342.25
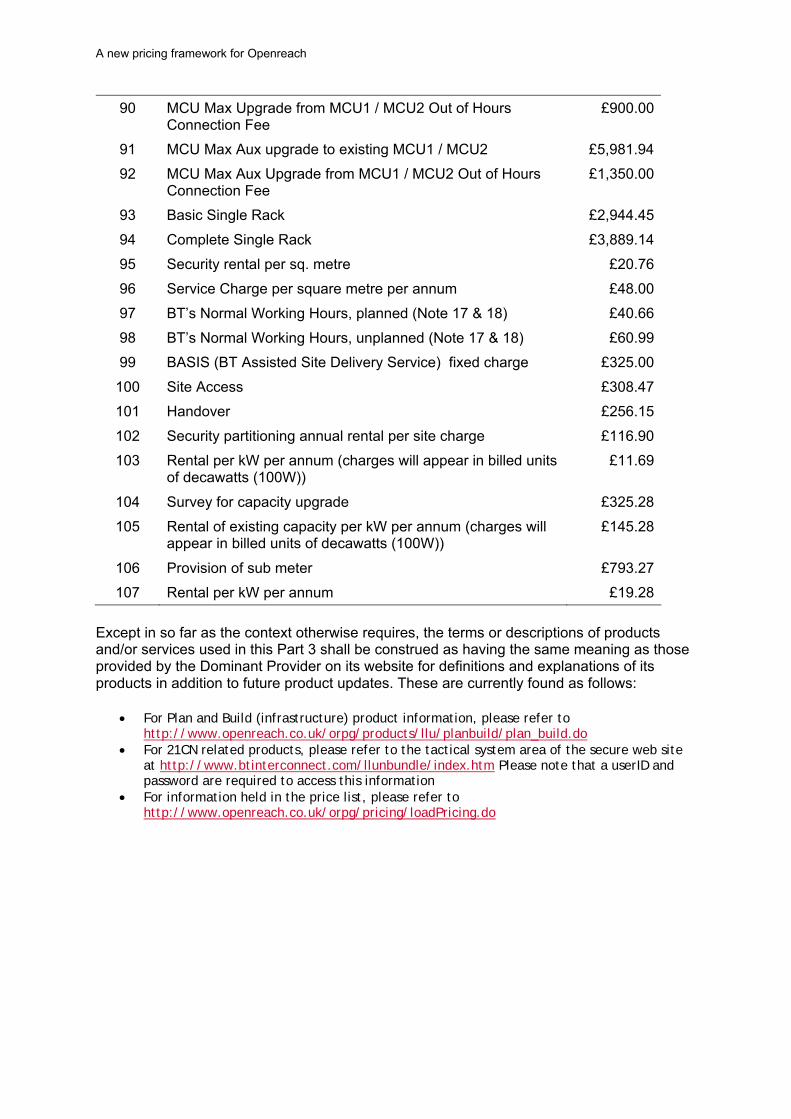
A new pricing framework for Openreach
90 MCU Max Upgrade from MCU1 / MCU2 Out of Hours Connection Fee
£900.00
91 MCU Max Aux upgrade to existing MCU1 / MCU2 £5,981.94
92 MCU Max Aux Upgrade from MCU1 / MCU2 Out of Hours Connection Fee
£1,350.00
93 Basic Single Rack £2,944.45
94 Complete Single Rack £3,889.14
95 Security rental per sq. metre £20.76
96 Service Charge per square metre per annum £48.00
97 BT’s Normal Working Hours, planned (Note 17 & 18) £40.66
98 BT’s Normal Working Hours, unplanned (Note 17 & 18) £60.99
99 BASIS (BT Assisted Site Delivery Service) fixed charge £325.00
100 Site Access £308.47
101 Handover £256.15
102 Security partitioning annual rental per site charge £116.90
103 Rental per kW per annum (charges will appear in billed units of decawatts (100W))
£11.69
104 Survey for capacity upgrade £325.28
105 Rental of existing capacity per kW per annum (charges will appear in billed units of decawatts (100W))
£145.28
106 Provision of sub meter £793.27
107 Rental per kW per annum £19.28
Except in so far as the context otherwise requires, the terms or descriptions of products and/or services used in this Part 3 shall be construed as having the same meaning as those provided by the Dominant Provider on its website for definitions and explanations of its products in addition to future product updates. These are currently found as follows:
For Plan and Build (infrastructure) product information, please refer to http://www.openreach.co.uk/orpg/products/llu/planbuild/plan_build.do
For 21CN related products, please refer to the tactical system area of the secure web site at http://www.btinterconnect.com/llunbundle/index.htm Please note that a userID and password are required to access this information
For information held in the price list, please refer to http://www.openreach.co.uk/orpg/pricing/loadPricing.do

A new pricing framework for Openreach
49
Schedule 2
Modification to SMP Condition FA3
1. SMP Condition FA3 shall be modified by inserting the following new paragraph FA3.1(X) after paragraph FA3.1 of Condition FA3 in Part 2 of Schedule 1 to the 2004 Notification—
FA3.1(X) For the avoidance of any doubt, except for the charge for MPF Rental, where the charge offered, payable or proposed for Network Access covered by Condition FA1 and/or Condition FA9 is for a service which is subject to a charge control under Condition FA3(A), the Dominant Provider shall secure, and shall be able to demonstrate to the satisfaction of Ofcom, that such a charge satisfies the requirements of paragraph FA3.1 above.

A new pricing framework for Openreach
Part II – Withdrawal of the MPF Charge Ceiling Direction
Withdrawal of the Direction dated 30 November 2005 setting a charge ceiling for
Metallic Path Facilities under SMP Services Conditions FA3.1 and FA9.2 imposed on BT as a result of a market power determination made by Ofcom that BT has significant market power in the market for wholesale local access services within the United
Kingdom, but not including the Hull Area
Background
1. On 16 December 2004, the Office of Communications (“Ofcom”) published a document entitled ‘Review of the wholesale local access market — Identification and analysis of markets, determination of market power and setting of SMP conditions — Explanatory statement and notification’ (the “2004 Notification”).29
2. At Annex 1 to the 2004 Notification, Ofcom published a notification identifying, in accordance with section 79 of the Communications Act 2003 (the “Act”), the services market of wholesale local access services within the United Kingdom, but not including the Hull Area30, in which Ofcom determined that, for the purposes of making a market power determination under the Act 2003, BT31 has significant market power.
3. As a result of that market power determination, Ofcom set pursuant to section 45 of the Act the SMP services conditions set out in Schedule 1 to the 2004 Notification to apply to BT, including:
(a) Condition FA3 which imposes obligations on BT with regard to cost based charges unless Ofcom directs otherwise from time to time;
(b) Condition FA9 which requires BT to provide Local Loop Unbundling Services on fair and reasonable terms, conditions and charges and on such terms, conditions and charges as Ofcom may direct from time to time.
4. On 30 November 2005, Ofcom published a Statement entitled ‘Local loop unbundling: setting the fully unbundled rental charge ceiling and minor amendment to SMP conditions FA6 and FB6’.32 At Annex 1 to that statement, Ofcom published its Direction pursuant to Conditions FA3.1 and FA9.2 imposing a charge ceiling for the annual rental charge for access to Metallic Path Facilities (the “MPF Charge Ceiling Direction”).
5. On 30 May 2008, Ofcom published a document entitled ‘A New Pricing Framework for Openreach’ for initial consultation to review whether there is a need to change the existing level and structure of charges for the regulated wholesale access services.33
6. On 5 December 2008, Ofcom published its second consultation document also entitled ‘A New Pricing Framework for Openreach’34 (the “Second Consultation”), which included a
29 http://www.ofcom.org.uk/consult/condocs/rwlam/statement/rwlam161204.pdf 30 The expression "Hull Area" means the area defined as the 'Licensed Area' in the licence granted on 30 November 1987 by the Secretary of State under section 7 of the Telecommunications Act 1984 to Kingston upon Hull City Council and Kingston Communications (Hull) plc (see paragraph 11(b) of the 2004 Notification). 31 The expression "BT" means British Telecommunications plc, whose registered company number is 1800000, and any of its subsidiaries or holding companies, or any subsidiary of such holding companies, all as defined by section 736 of the Companies Act 1985, as amended by the Companies Act 1989 (see paragraph 11(b) of the 2004 Notification). 32 http://www.ofcom.org.uk/consult/condocs/llu/statement/llu_statement.pdf 33 http://www.ofcom.org.uk/consult/condocs/openreach/openreachcondoc.pdf

A new pricing framework for Openreach
51
publication at Part II of Annex 8 to that document a notification under sections 49(4) of the Act setting out Ofcom’s proposal to withdraw the MPF Charge Ceiling Direction upon the precondition that Ofcom sets a new SMP Condition (as proposed in Part I of Annex 8 to the Second Consultation) to impose a charge control in respect of the annual rental for access to Metallic Path Facilities and upon such Condition taking effect.
7. Copies of the Second Consultation, including the notification published in its Annex 8 about that proposed withdrawal, were sent to the Secretary of State in accordance with section 50(1)(b) of the Act, as well as to the European Commission and to the regulatory authorities of every other member State in accordance with section 50(4) of the Act. Ofcom invited representations on its proposals by 20 February 2009. In light of comments received from stakeholders on the complexity of the issues under consideration, Ofcom extended the deadline by two weeks, with a new closing date for responses by 6 March 2009. At the same time, Ofcom published a short list of clarifications and typographic corrections to the consultation which had been identified since publication.35
8. By virtue of section 49(9) of the Act, Ofcom may give effect, with or without modifications, to a proposal with respect to which Ofcom has published a notification under section 49(4) of the Act only if—
(a) Ofcom has considered every representation about the proposal that is made to it within the period specified in the notification; and
(b) Ofcom has had regard to every international obligation of the United Kingdom (if any) which has been notified to it for this purpose by the Secretary of State.
9. Ofcom received 14 responses to the Second Consultation, including comments of the European Commission, and has considered every such representation duly made. The Secretary of State has not notified Ofcom of any international obligation of the United Kingdom for this purpose.
Decision
10. Ofcom hereby, pursuant to section 49 of the Act, withdraw the MPF Charge Ceiling Direction upon the precondition that the new SMP Condition FA3(A) in Part I of Annex 3 to the explanatory statement accompanying the publication of this Withdrawal, imposing a charge control in respect of the annual rental for access to Metallic Path Facilities, is being set and upon such Condition taking effect.
11. For the reasons set out in Section7 to the explanatory statement accompanying the publication of this Withdrawal, Ofcom is satisfied that, in accordance with section 49(2) of the Act, this Withdrawal of the MPF Charge Ceiling Direction is:
(a) objectively justifiable in relation to the networks, services, facilities, apparatus or directories to which it relates;
(b) not such as to discriminate unduly against particular persons or against a particular description of persons;
(c) proportionate to what it is intended to achieve; and
(d) in relation to what it is intended to achieve, transparent.
34 http://www.ofcom.org.uk/consult/condocs/openreachframework/off.pdf 35 http://www.ofcom.org.uk/consult/condocs/openreachframework/extension/

A new pricing framework for Openreach
12. In withdrawing the MPF Charge Ceiling Direction, Ofcom has considered and acted in accordance with its general duties in section 3 of the Act and the six Community requirements in section 4 of the Act.
13. Copies of this Withdrawal instrument and the accompanying explanatory statement have been sent to the Secretary of State in accordance with section 50(1)(d) of the Act and to the European Commission in accordance with section 50(2)(c) of the Act.
Interpretation
14. Except for references made to the identified services market in this Withdrawal as set out in the 2004 Notification and except as otherwise defined in paragraph 15 below, words or expressions used in this Withdrawal shall have the same meaning as they have been ascribed in the Act.
15. In this Withdrawal—
(a) “2004 Notification” has the meaning given to it in paragraph 1 above;
(b) “Act” means the Communications Act 2003 (c.21);
(c) “BT” has the meaning given to it in paragraph 2 above;
(d) “Hull Area” has the meaning given to it in paragraph 2 above;
(e) “MPF Charge Ceiling Direction” has the meaning given to it in paragraph 4;
(e) “Ofcom” means Office of Communications; and
(f) “Second Consultation” has the meaning given to it in paragraph 6 above.
16. For the purpose of interpreting this Withdrawal—(a) headings and titles shall be disregarded; and (b) the Interpretation Act 1978 (c. 30) shall apply as if this Withdrawal were an Act of Parliament.
17. Subject to the precondition set out in paragraph 10 being satisfied, this Withdrawal shall take effect on the day this instrument is published.
CRAIG LONIE
Director of Competition Finance
A person duly authorised in accordance with paragraph 18 of the Schedule to the Office of Communications Act 2002
22 May 2009

A new pricing framework for Openreach
53
Part III – Withdrawal of the Specified LLU Services Charge Ceilings Direction
Withdrawal of the Direction dated 16 December 2004 setting charge ceilings for Specified Local Loop Unbundling Services under SMP Services Condition FA9.2
imposed on BT as a result of a market power determination made by Ofcom that BT has significant market power in the market for wholesale local access services within the
United Kingdom, but not including the Hull Area
Background
1. On 16 December 2004, the Office of Communications (“Ofcom”) published a document entitled ‘Review of the wholesale local access market — Identification and analysis of markets, determination of market power and setting of SMP conditions — Explanatory statement and notification’ (the “2004 Notification”).36
2. At Annex 1 to the 2004 Notification, Ofcom published a notification identifying, in accordance with section 79 of the Communications Act 2003 (the “Act”), the services market of wholesale local access services within the United Kingdom, but not including the Hull Area37, in which Ofcom determined that, for the purposes of making a market power determination under the Act 2003, BT38 has significant market power.
3. As a result of that market power determination, Ofcom set pursuant to section 45 of the Act the SMP services conditions set out in Schedule 1 to the 2004 Notification to apply to BT, including:
(a) Condition FA3 which imposes obligations on BT with regard to cost based charges unless Ofcom directs otherwise from time to time;
(b) Condition FA9 which requires BT to provide Local Loop Unbundling Services on fair and reasonable terms, conditions and charges and on such terms, conditions and charges as Ofcom may direct from time to time.
4. At Annex 2, Schedule 1, to the 2004 Notification, Ofcom published its Direction pursuant to Condition FA9.2 imposing charge ceilings for the Specified Local Loop Unbundling Services (the “Specified LLU Services Charge Ceilings Direction”).
5. On 30 May 2008, Ofcom published a document entitled ‘A New Pricing Framework for Openreach’ for initial consultation to review whether there is a need to change the existing level and structure of charges for the regulated wholesale access services.39
6. On 5 December 2008, Ofcom published its second consultation document also entitled ‘A New Pricing Framework for Openreach’40 (the “Second Consultation”), which included a publication at Part III of Annex 8 to that document a notification under sections 49(4) of the Act setting out Ofcom’s proposal to withdraw the Specified LLU Services Charge Ceilings
36 http://www.ofcom.org.uk/consult/condocs/rwlam/statement/rwlam161204.pdf 37 The expression "Hull Area" means the area defined as the 'Licensed Area' in the licence granted on 30 November 1987 by the Secretary of State under section 7 of the Telecommunications Act 1984 to Kingston upon Hull City Council and Kingston Communications (Hull) plc (see paragraph 11(b) of the 2004 Notification). 38 The expression "BT" means British Telecommunications plc, whose registered company number is 1800000, and any of its subsidiaries or holding companies, or any subsidiary of such holding companies, all as defined by section 736 of the Companies Act 1985, as amended by the Companies Act 1989 (see paragraph 11(b) of the 2004 Notification). 39 http://www.ofcom.org.uk/consult/condocs/openreach/openreachcondoc.pdf 40 http://www.ofcom.org.uk/consult/condocs/openreachframework/off.pdf

A new pricing framework for Openreach
Direction upon the precondition that Ofcom sets a new SMP Condition (as proposed in Part I of Annex 8 to the Second Consultation) to impose a charge control in respect of matters to which the Specified LLU Services Charge Ceilings Direction relates and upon such Condition taking effect.
7. Copies of the Second Consultation, including the notification published in its Annex 8 about that proposed withdrawal, were sent to the Secretary of State in accordance with section 50(1)(b) of the Act, as well as to the European Commission and to the regulatory authorities of every other member State in accordance with section 50(4) of the Act. Ofcom invited representations on its proposals by 20 February 2009. In light of comments received from stakeholders on the complexity of the issues under consideration, Ofcom extended the deadline by two weeks, with a new closing date for responses by 6 March 2009. At the same time, Ofcom published a short list of clarifications and typographic corrections to the consultation which had been identified since publication.41
8. By virtue of section 49(9) of the Act, Ofcom may give effect, with or without modifications, to a proposal with respect to which Ofcom has published a notification under section 49(4) of the Act only if—
(a) Ofcom has considered every representation about the proposal that is made to it within the period specified in the notification; and
(b) Ofcom has had regard to every international obligation of the United Kingdom (if any) which has been notified to it for this purpose by the Secretary of State.
9. Ofcom received 15 responses to the Second Consultation, including comments of the European Commission, and has considered every such representation duly made. The Secretary of State has not notified Ofcom of any international obligation of the United Kingdom for this purpose.
Decision
10. Ofcom hereby, pursuant to section 49 of the Act, withdraw the Specified LLU Services Charge Ceilings Direction upon the precondition that the new SMP Condition FA3(A) in Part I of Annex 3 to the explanatory statement accompanying the publication of this Withdrawal, imposing a charge control in respect of all such products and/or services to which that Condition relates, is being set and upon such Condition taking effect.
11. For the reasons set out in Section 7 to the explanatory statement accompanying the publication of this Withdrawal, Ofcom is satisfied that, in accordance with section 49(2) of the Act, this Withdrawal of the Specified LLU Services Charge Ceilings Direction is:
(a) objectively justifiable in relation to the networks, services, facilities, apparatus or directories to which it relates;
(b) not such as to discriminate unduly against particular persons or against a particular description of persons;
(c) proportionate to what it is intended to achieve; and
(d) in relation to what it is intended to achieve, transparent.
41 http://www.ofcom.org.uk/consult/condocs/openreachframework/extension/

A new pricing framework for Openreach
55
12. In withdrawing the Specified LLU Services Charge Ceilings Direction, Ofcom has considered and acted in accordance with its general duties in section 3 of the Act and the six Community requirements in section 4 of the Act.
13. Copies of this Withdrawal instrument and the accompanying explanatory statement have been sent to the Secretary of State in accordance with section 50(1)(d) of the Act and to the European Commission in accordance with section 50(2)(c) of the Act.
Interpretation
14. Except for references made to the identified services market in this Withdrawal as set out in the 2004 Notification and except as otherwise defined in paragraph 15 below, words or expressions used in this Withdrawal shall have the same meaning as they have been ascribed in the Act.
15. In this Withdrawal—
(a) “2004 Notification” has the meaning given to it in paragraph 1 above;
(b) “Act” means the Communications Act 2003 (c.21);
(c) “BT” has the meaning given to it in paragraph 2 above;
(d) “Hull Area” has the meaning given to it in paragraph 2 above;
(e) “Specified LLU Services Charge Ceilings Direction” has the meaning given to it in paragraph 4;
(e) “Ofcom” means Office of Communications; and
(f) “Second Consultation” has the meaning given to it in paragraph 6 above.
16. For the purpose of interpreting this Withdrawal—(a) headings and titles shall be disregarded; and (b) the Interpretation Act 1978 (c. 30) shall apply as if this Withdrawal were an Act of Parliament.
17. Subject to the precondition set out in paragraph 10 being satisfied, this Withdrawal shall take effect on the day this instrument is published.
CRAIG LONIE
Director of Competition Finance
A person duly authorised in accordance with paragraph 18 of the Schedule to the Office of Communications Act 2002
22 May 2009

A new pricing framework for Openreach
Part IV – Consent for period to notify charges (LLU)
Consent under section 49 of the Communications Act 2003 and SMP Services Condition FA5.1 imposed on British Telecommunications plc (“BT”) as a result of the market power determinations made by Ofcom that BT has significant market power in
the market for wholesale local access services within the United Kingdom but not including the Hull Area
Background
1. On 16 December 2004, the Office of Communications (“Ofcom”) published a document entitled ‘Review of the wholesale local access market — Identification and analysis of markets, determination of market power and setting of SMP conditions — Explanatory statement and notification’ (the “2004 Notification”).
2. At Annex 1 to the 2004 Notification, Ofcom published a notification identifying, in accordance with section 79 of the Communications Act 2003 (the “Act”), the services market of wholesale local access services within the United Kingdom, but not including the Hull Area, in which Ofcom determined that, for the purposes of making a market power determination under the Act 2003, BT has significant market power.
3. As a result of that market power determination, in accordance with section 48(1) of the Act, Ofcom set on BT pursuant to section 45 of the Act the SMP services conditions set out in Schedule 1 to the 2004 Notification, including Condition FA5 which imposes obligations on BT with regard to prior notification of charges, terms and conditions before taking effect. In particular, paragraph FA5.2 of that Condition provides:
“FA5.2 Save where otherwise provided in Condition FA6, the Dominant Provider shall send to Ofcom and to every person with which it has entered into an Access Contract covered by Condition FA1 and/or Condition FA9 a written notice of any amendment to the charges, terms and conditions on which it provides Network Access or in relation to any charges, terms and conditions for new Network Access (an “Access Charge Change Notice”) not less than 90 days before any such amendment comes into effect for existing Network Access, or not less than 28 days before any such charges, terms and conditions come into effect for new Network Access provided after the date that this Condition enters into force. This obligation for prior notification will not apply where the new or amended charges or terms and conditions are directed or determined by Ofcom or are required by a notification or enforcement notification issued by Ofcom under sections 94 or 95 of the Act.”
7. On 5 December 2008, Ofcom published a Notification of a proposal to set a new SMP Condition FA3(A) entitled ‘Charge control’. In addition, Ofcom published a Notification of a proposal to give a Consent under section 49 of the Communications Act 2003 and SMP Services Condition FA5.1 in relation to charges to which that proposed Condition relates (the “Consent Proposal”).
8. In accordance with section 50 of the Act, a copy of the Consent Proposal was sent to the Secretary of State, the European Commission and the regulatory authorities of every of the Member State.
9. By virtue of section 49(9) of the Act, Ofcom may give effect to the Consent Proposal, with or without modification, only if—
(a) it has considered every representation about the proposal that is made to Ofcom within the period specified in the notification; and
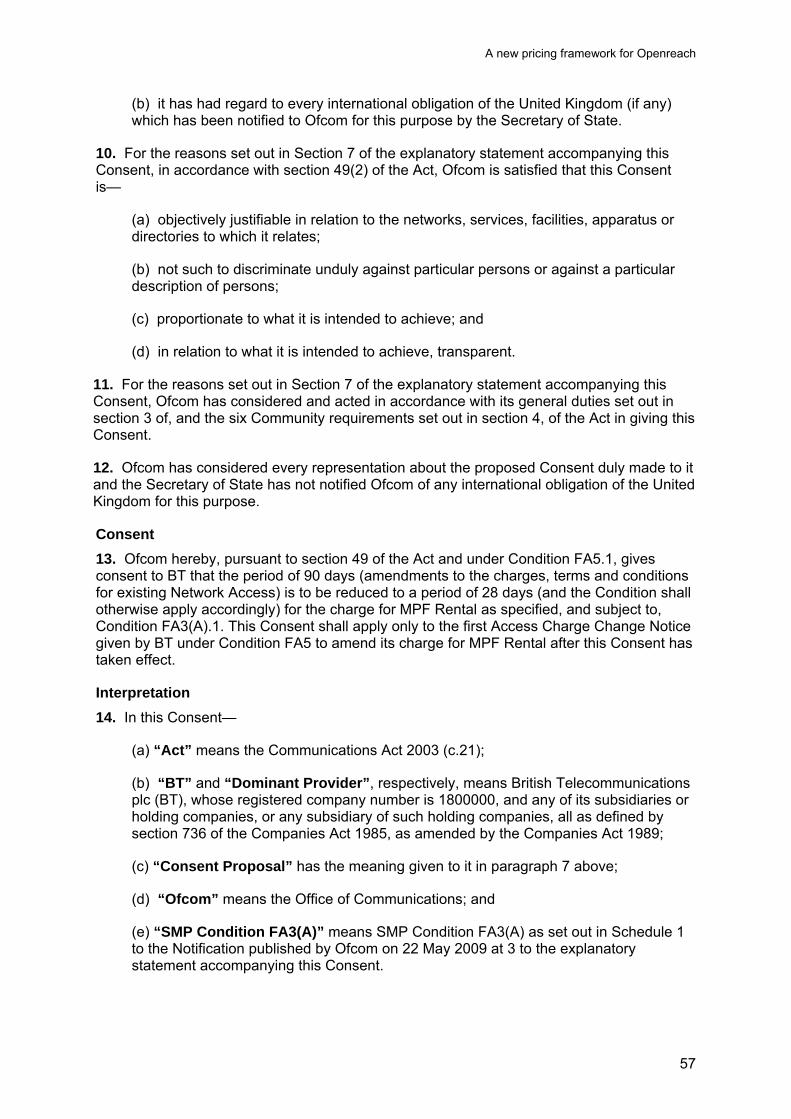
A new pricing framework for Openreach
57
(b) it has had regard to every international obligation of the United Kingdom (if any) which has been notified to Ofcom for this purpose by the Secretary of State.
10. For the reasons set out in Section 7 of the explanatory statement accompanying this Consent, in accordance with section 49(2) of the Act, Ofcom is satisfied that this Consent is—
(a) objectively justifiable in relation to the networks, services, facilities, apparatus or directories to which it relates;
(b) not such to discriminate unduly against particular persons or against a particular description of persons;
(c) proportionate to what it is intended to achieve; and
(d) in relation to what it is intended to achieve, transparent.
11. For the reasons set out in Section 7 of the explanatory statement accompanying this Consent, Ofcom has considered and acted in accordance with its general duties set out in section 3 of, and the six Community requirements set out in section 4, of the Act in giving this Consent.
12. Ofcom has considered every representation about the proposed Consent duly made to it and the Secretary of State has not notified Ofcom of any international obligation of the United Kingdom for this purpose.
Consent
13. Ofcom hereby, pursuant to section 49 of the Act and under Condition FA5.1, gives consent to BT that the period of 90 days (amendments to the charges, terms and conditions for existing Network Access) is to be reduced to a period of 28 days (and the Condition shall otherwise apply accordingly) for the charge for MPF Rental as specified, and subject to, Condition FA3(A).1. This Consent shall apply only to the first Access Charge Change Notice given by BT under Condition FA5 to amend its charge for MPF Rental after this Consent has taken effect.
Interpretation
14. In this Consent—
(a) “Act” means the Communications Act 2003 (c.21);
(b) “BT” and “Dominant Provider”, respectively, means British Telecommunications plc (BT), whose registered company number is 1800000, and any of its subsidiaries or holding companies, or any subsidiary of such holding companies, all as defined by section 736 of the Companies Act 1985, as amended by the Companies Act 1989;
(c) “Consent Proposal” has the meaning given to it in paragraph 7 above;
(d) “Ofcom” means the Office of Communications; and
(e) “SMP Condition FA3(A)” means SMP Condition FA3(A) as set out in Schedule 1 to the Notification published by Ofcom on 22 May 2009 at 3 to the explanatory statement accompanying this Consent.

A new pricing framework for Openreach
5. Except insofar as the context otherwise requires, words or expressions in this Consent shall have the meaning assigned to them in paragraph 14 above and otherwise any work or expression shall have the same meaning as it has in or for the purposes of the Accompanying Direction or, if the context so permits, any word or expression shall have the same meaning as it has in the Act.
16. For the purpose of interpreting this Consent—(a) headings and titles shall be disregarded; and (b) the Interpretation Act 1978 (c. 30) shall apply as if this Consent were an Act of Parliament.
Effective date
16. This Consent shall take effect on 22 May 2009.
CRAIG LONIE
Director of Competition Finance
A person duly authorised in accordance with paragraph 18 of the Schedule to the Office of Communications Act 2002
22 May 2009

A new pricing framework for Openreach
59
Annex 4
4 Choice of cost standard Introduction
A4.1 This Annex accompanies our conclusions in Section 5 in setting out our considerations of, and conclusions on, the appropriate cost standard.
A4.2 We first summarise our views on issues relating to the appropriate cost standard as set out in the Second Consultation. We then describe responses received on those matters, before we respond to them. This Annex also includes our views on the static and dynamic efficiency considerations in setting the MPF charge.
A4.3 We conclude that CCA FAC is a reasonable basis for informing the setting of charges. We consider that setting charges primarily on the basis of CCA FAC is broadly consistent with achieving an efficient outcome in this case. We therefore consider it to be in consumers’ interests.
Our proposed approach to setting charges
A4.4 In the Second Consultation, as in this Statement, our projected cost stacks were prepared on a CCA FAC basis. If applied consistently to Openreach’s regulated services, basing prices on the underlying efficient CCA FAC should prevent excessive charging and also ensure that the delivery of the regulated services is sustainable by allowing Openreach an opportunity to recover all of its relevant efficiently incurred costs.
A4.5 We said that, as a basis for modifying charges, the use of CCA FAC also offers some important practical advantages, including:
it is a widely understood concept and has been the anchor point for many previous price controls; and
it uses data that can be reconciled to the regulatory financial statements, which are audited and, generally, in the public domain.
A4.6 We preferred CCA FAC as a cost standard to using long run incremental costs42 with an equal proportionate mark-up (LRIC+EPMU), which is an alternative way of recovering common costs. This was because CCA FAC uses data that can be reconciled to the regulatory financial statements, which have been audited and are in the public domain. Given that LRIC+EPMU is not conceptually superior to CCA FAC and that CCA FAC is more practical and transparent we continue to consider that FAC remains preferable to LRIC+EPMU for this review. Using CCA FAC is also consistent with other charge controls set for Openreach and BT more generally. This is important for ensuring sustainability, in the sense that a consistent approach ensures all common costs can be recovered and BT can earn its cost of capital.
42 The long-run incremental cost (or "LRIC") of a good or service is the cost caused by the provision of a defined increment of output, taking a long run perspective, assuming that some output is already produced. The 'long run' means the time horizon over which all costs (including capital investment) are variable.

A new pricing framework for Openreach
A4.7 We also considered whether we should move away from CCA FAC for efficiency reasons. Our preliminary conclusion was that there were not strong efficiency reasons for moving away from CCA FAC.
A4.8 We considered the most important static efficiency consideration to be the potential distortions in the use of wholesale products. In general, where wholesale products are close substitutes, the choice between them could be distorted if the difference in charges does not reflect the difference in incremental costs. In the case of MPF and WLR+SMPF, these products are not in the same market, but are alternative wholesale inputs in the sense that either WLR+SMPF or MPF plus an LLU operator’s own voice platform can be used as wholesale inputs to provide retail voice and broadband services.
A4.9 We considered that if the MPF charge made a significantly lower contribution to recovery of common costs than WLR+SMPF, this would create distortions that would reduce efficiency. For example, for LLU operators to choose between MPF and WLR+SMPF on their merits, the difference in charges should be comparable to the differences in incremental costs for Openreach. We considered the potential distortions to competition in the longer term could be significant. Such distortions were, in our opinion, likely to be the most important static efficiency consideration. We considered that charging on the basis of CCA FAC was likely to be broadly consistent with removing these static distortions.
A4.10 In terms of dynamic efficiency, we considered whether it was justifiable to actively promote competition by setting prices specifically to assist entry with the use of MPF rather than WLR+SMPF. We concluded that at this stage in the market’s development differences between charges should move towards reflecting the underlying differences in costs.
A4.11 In addition to considering the potential impact on competition, we considered another important aspect of dynamic efficiency, namely the need to ensure that investment incentives are not distorted by the regulatory process, including how it evolves over time. We considered that this tended to provide support for a CCA FAC basis for determining charges in the longer term, but with any increase being phased in gradually.
Responses to the Second Consultation
A4.12 Openreach and Vodafone argued that CCA FAC was the right cost standard, though they disagreed with the way Ofcom had made its forecasts.
A4.13 Another stakeholder, whose response was confidential, raised a concern that the European Court of Justice in its 24th April Arcor/DT decision on LLU price, noted ‘that a method of cost calculation based exclusively on current costs is also not the most appropriate method of applying the principle that rates of the unbundled access to the local loop are to be set on the basis of cost orientation.’
A4.14 Openreach argued that the price differentials between MPF and WLR+SMPF have produced a distorting arbitrage which is unsustainable. It argued that failure to address this would have serious consequences – there would be “no incentive to invest in either current or new services and product”, and there would be “a significant degradation of customers service”. Openreach also argued that CPs’ reasonable expectation of how the MPF charge would change would not necessarily have involved a phased transition to CCA FAC. We discuss this further in Annex 5.

A new pricing framework for Openreach
61
A4.15 Vodafone considered that setting charges to reach CCA FAC over a four year period represented best practise in price cap regulation. It balances efficient pricing against disruption costs, and also mimics behaviour of a competitive market, where prices above or below cost will adjust over a period of time as competitive conditions respond.
A4.16 Talk Talk’s main response together with its supporting appendices argued that:
Ofcom has not established that there is currently any ‘imbalance’ between MPF and WLR, as Ofcom has not considered the relative incremental costs of the different services. This is what would need to be considered to set charges efficiently. Therefore it seems not possible to make any statement about the degree of imbalance of the existing relative charges.
If anything, there is an imbalance in the other direction and that the MPF charge should be reduced relative to WLR+SMPF in the future. Talk Talk proposed that the differential between MPF and WLR should be increased to £38 (compared to a differential in charges of £19 currently).
There are good reasons for considering that the appropriate contribution to common costs is a mark-up on LRIC rather than a CCA FAC approach.
Even if there were an imbalance currently (and MPF were too low), there are strong economic and other reasons to maintain this imbalance into 2012/13 since consumers will enjoy more efficient and effective competition and innovation. Talk Talk argued that there were dynamic efficiency benefits from maintaining, or even increasing, the current differential between charges, which could be worth up to £42m for the voice layer and £120m for broadband.
In a supporting appendix to Talk Talk’s response, Dr. Chris Doyle argues that our proposals would result in a reduction of up to 1 million fewer households subscribing to broadband services by 2012/13.
Our views on responses to the cost standard
A4.17 The remainder of this Annex sets out our response to the key issues raised in responses to the Second Consultation. It is structured as follows:
European Court of Justice view on CCA;
absolute versus proportionate mark-ups;
relative importance of allocative and productive efficiency;
the differentials between the charges we are considering;
dynamic efficiency considerations;
conclusion on efficiency considerations; and
conclusion on appropriate cost standard.

A new pricing framework for Openreach
European Court of Justice view on CCA
A4.18 We consider that the European Court of Justice decision43 is less clear cut than presented by the stakeholder.
A4.19 Extracts from the judgement below (paragraphs 99, 108) shows that the ECJ did not settle on one cost base.
“99 It must thus be held that a method of calculation based exclusively on current costs is also not the most appropriate method of applying the principle that rates for unbundled access to the local loop are to be set on the basis of cost-orientation. “
“108 It follows that the cost calculation basis which must be taken into account when setting rates for unbundled access to the local loop cannot be based exclusively on historic costs, otherwise the notified operator would suffer, compared with the beneficiary, unjustified disadvantages, which is precisely what Regulation No 2887/2000 seeks to prevent. The aim of that regulation is to enable both beneficiaries and the notified operator to operate on the market so as to establish normal competition in the medium term.”
A4.20 In paragraph 119 the Court concludes as follow:
“119 It follows from all of the above considerations that the answer to Question 3(a) must be that, when applying the principle that rates for unbundled access to the local loop are to be set on the basis of cost-orientation, laid down in Article 3(3) of Regulation No 2887/2000, in order to determine the calculation basis of the costs of the notified operator, the NRAs have to take account of actual costs, namely costs already paid by the notified operator and forward-looking costs, the latter being based, where relevant, on an estimation of the costs of replacing the network or certain parts of it.”
A4.21 Therefore, the conclusion implies a mix of HCA and CCA though it is not clear how this is applied in practice. Our approach through the RAV does acknowledge historic costs but under our principle we have placed greater emphasis on forward looking costs and, hence, CCA. It is this approach that we consider ensure that BT and competing operators are able to operate in a “normal competitive environment”.
Absolute versus proportionate mark-ups
Talk Talk Group’s challenge to the relevance of the absolute mark-up
A4.22 In the Second Consultation, we considered that, if the objective was to ensure that there is no distortion in choosing between MPF and WLR+SMPF, the difference in charges between MPF and WLR+SMPF should be comparable to the absolute differences in LRIC.
A4.23 In Appendix B2 to Talk Talk’s response, Frontier Economics argues that for those costs that are fixed and common costs, static efficiency is achieved when fixed and
43 http://curia.europa.eu/jurisp/cgi-bin/form.pl?lang=EN&Submit=Rechercher$docrequire=alldocs&numaff=C-55/06&datefs=&datefe=&nomusuel=&domaine=&mots=&resmax=100

A new pricing framework for Openreach
63
common costs are recovered by mark-ups to LRIC, where the mark-ups reflect demand characteristics, that is, a Ramsey pricing approach. This would imply that the differential between charges should be greater than the absolute difference in LRIC. Frontier Economics shows that, using the figures in BT’s 2007/08 regulatory financial statements, current charges implied a slightly higher mark up for common cost recovery as a proportion of LRIC for MPF than for WLR+SMPF. Frontier’s view is therefore that the difference in charges is too small.
A4.24 In general, Ramsey prices allow recovery of fixed and common costs in a way that minimises static distortions.44 They do this by recovering proportionately more common costs form services whose demand is relatively inelastic. Frontier argues that retail broadband demand is more elastic than retail demand for voice services and hence that MPF, which is used for broadband, should be priced low relative to WLR, which is primarily used for voice services. The difficulty with Frontier’s approach is that broadband is also supplied using WLR+SMPF and this means that MPF and WLR+SMPF are substitutable at the wholesale level.
A4.25 This can be a problem because, when wholesale products are substitutes for one another, Ramsey pricing may not less feasible because of switching between products. Otherwise, attempts to impose higher mark-ups on one product to recover a greater share of common costs will cause some substitution to the other. This could be inefficient. Also, the prices may become unsustainable because the product with the low mark-up may be used instead of the high mark-up product undermining cost recovery.
A4.26 This can be illustrated by considering an extreme case. Suppose a company produces two intermediate products whose only use is for the same retail market, and suppose there are fixed and common costs between these two products. Suppose one of the intermediate products is closer to the finished product than the other, and hence has higher incremental costs. Buyers of these intermediate products must choose between (a) buying the cheaper product and doing more work themselves, or (b) buying the more expensive product and doing less work themselves. Only when the differential between the prices of the intermediate products is equal to the difference in incremental costs is the ‘make or buy’ decision right and static efficiency achieved. In that case, the only consideration is maximising productive efficiency. Minimising allocative efficiency in the retail market does not influence the recovery of common costs.45
A4.27 For the wholesale products for which we are setting charges, we consider there are two, potentially conflicting, considerations:
allocative efficiency/Ramsey pricing considerations, to the extent that the wholesale products relate to different retail markets, and
productive efficiency considerations, to the extent that the wholesale products are alternatives inputs for the same retail markets.
A4.28 We consider that the first consideration tends to point to mark-ups on LRIC which reflect differences in the elasticities of the different retail products, whereas the second consideration tends to point towards charges which reflect the absolute
44 Technically, the Ramsey pricing equations imply that the ratio (P-MC)/P multiplied by the ‘superelasticity’ should be the same for all products. 45 There are some similarities with the discussion of ‘uneconomic bypass’ in the US.

A new pricing framework for Openreach
differences in LRIC so that, if an operator chooses to use WLR+SMPF instead of MPF, the higher charge it pays reflects the extra costs incurred as a result.
Not all common costs may really be common
A4.29 Frontier Economics makes a rather different point when it argues that many of the costs that are identified as common are not truly fixed and common in the sense that they are entirely invariant with the scale of the business. Rather, Frontier Economics argues that for many of these costs it has not been possible to identify cost drivers due to the complexity of BT’s varied multi-product business. In its opinion, if these costs were allocated in a way similar to the other variable costs, BT’s estimate of the LRIC of the individual products would be expected to increase in proportion to LRIC.
A4.30 It is possible to measure LRIC in a number of different ways depending on the size of the increment used. The extent to which any costs are identified as fixed and common will therefore also depend on the details of how the LRIC estimates are made. For example, LRIC is often used to refer to the long run average incremental costs of a service. This is usually considered to be the costs which are directly caused by the provision of that service in addition to the other services which the firm produces, that is, the increment is all the output of the service in question. Marginal cost, by contrast, is a special case of incremental cost where the increment is one unit of output. BT’s LRIC model, on the other hand, has only three increments: core, access and retail. BT’s Distributed LRIC (or DLRIC) approach means that the fixed and common costs within each of the three increments are allocated to the LRICs for the individual components within that increment on an equi-proportional basis46. The LRIC estimates shown in BT’s financial statements therefore include some (intra-business) common costs and to this extent at least appear to bear some similarity to Frontier’s suggestion.
A4.31 Moreover, it is not obvious that all common costs would be expected to vary with LRIC in the way Frontier suggests. A large share of the costs which are common to BT’s access and core increments relates to ducts that are used by both access and core. A line will make the same use of the duct whether it is used for MPF or WLR+SMPF. In our view, there does not seem to be a good case for WLR+SMPF to make a larger contribution to the recovery of duct costs. For these common costs, which represent a large proportion of the total common costs, we therefore consider that there is not a strong case for allocating common costs in proportion to LRIC.
Relative importance of allocative and productive efficiency
A4.32 In theory, there may be a trade-off between allocative and productive efficiency for the wholesale products we are considering. We consider below the relative sizes of these effects.
46 BT’s LRIC model for the wholesale network identifies three high level increments, namely core, access and other. The LRICs for the individual components within access (such as MPF and WLR) are then calculated. The intra-access fixed and common costs are then distributed to the components within access on a cost category by cost category basis using an equal proportional mark-up. This method attributes the fixed and common costs to the relevant components in proportion to the amounts of the cost category included within the LRICs of each component. Finally, the LRIC of each component is added to the distribution of the intra access fixed and common costs to give the resultant DLRICs.

A new pricing framework for Openreach
65
A4.33 In the following sections we discuss, in particular, the arguments made by Frontier Economics on behalf of Talk Talk. We discuss the original submission by Frontier Economics47 that is referred to in the main Talk Talk Group submission. This argues that there would be static efficiency benefits of £97m per annum from implementing Ramsey pricing. Talk Talk argues that these Ramsey pricing considerations are far larger than any static inefficiency caused by distorting operators’ choice of wholesale product.
A4.34 We also discuss the later updated submission from Frontier Economics48.
Source of inefficiency from distortion to competition
A4.35 For the products we have considered in our review, there are two relevant retail markets, namely fixed broadband and fixed narrowband services (primarily voice services). The wholesale products relate to these as follows:
SMPF is only used for broadband, but a consumer cannot take a service that uses SMPF as an input unless that consumer also takes a service that uses WLR as an input;
WLR can be used for voice only services as well as being an essential requirement for those consumers who take broadband using SMPF; and
MPF is currently used exclusively for voice and broadband, though it may be used for voice only services in the future.
A4.36 Nearly 70 per cent of households who take a fixed line also take broadband.49 For supplying such households, MPF and WLR+SMPF are alternative wholesale inputs, though MPF requires the CP to provide its own voice platform. We consider that for supplying these households, the productive efficiency considerations are likely to be the most important static consideration.
A4.37 A difference in the MPF and WLR+SMPF charges that is not cost based is likely to result in productive inefficiency. This would tend to undermine any attempt at trying to minimise allocative efficiency considerations in the retail markets.
A4.38 Frontier Economics argued that small changes in the differential between charges may not change CPs’ decisions over which wholesale products to take. However, CPs have informed us that the differential does have an impact on their decisions. This is illustrated by some of the public responses that have stressed that the margin between charges is an important factor affecting decisions:
Sky said that “Notwithstanding the operational difficulties […], it is apparent that the viability of such a migration programme [from WLR+SMPF to MPF] is heavily dependent on the differential between WLR/SMPF and MPF charges”;50
47http://www.ofcom.org.uk/consult/condocs/openreachframework/responses/Talk_Talk_Group_Appendix_B2.pdf 48 http://www.ofcom.org.uk/consult/condocs/openreachframework/responses/talktalkb2updated.pdf 49 From Ofcom’s own research. 50 See paragraph 6.2 in Sky’s response to the First Consultation: http://www.ofcom.org.uk/consult/condocs/openreach/responses/Sky.pdf

A new pricing framework for Openreach
Tiscali said “…the effects of changes [in charges] on the market would add up to a serious threat to the viability of MPF, even as transition to it continues throughout the UK”.51
Talk Talk said it halted network expansion due to the uncertainty over MPF prices created by our review charges.52
A4.39 Frontier Economics also questions what costs would be involved if CPs were encouraged to use MPF by charges that are not cost based. Such costs could include:
some CPs may replace their DSLAMs and invest in MSANs (or may do so earlier than they otherwise would) so as to be able to use MPF;
there could be significant switching costs involved as lines were re-jumpered from WLR+SMPF to MSANs; and
more exchanges may be unbundled than is justified by the underlying costs.
A4.40 Moreover, there could be a distortion to competition though the retail market. This means that, even if Frontier Economics were right that small changes in the differential between charges does not change CPs’ decisions over which wholesale products to take, there could still be distortions though the retail market. We consider that such distortions are likely to reduce welfare overall.
A4.41 The potential for these distortions arises because consumers may switch away from CPs using WLR+SMPF to CPs using MPF. This could be inefficient if consumers were only persuaded to switch to a CP because that CP was able to offer a lower price resulting from it using a wholesale input that had an artificially low price relative to wholesale inputs used by other CPs. In theory, CPs using MPF might be able to undercut rivals even though they had higher internal costs or were offering a worse service. This might mean that CPs using WLR+SMPF would be incentivised to switch to using MPF. Alternatively, as not all CPs may be equally well placed to use MPF, distorted wholesale prices could therefore distort competition to favour CPs who are better placed to take advantage of MPF.
Illustration of size of possible distortion
A4.42 In the Second Consultation, we said that for any individual line, the upper bound of the static welfare loss from distortions to competition might be regarded as the entirety of the gap between (a) the differences in the long run incremental costs (LRIC) of MPF compared to WLR+SMPF and (b) the differences in charges. This is because a CP will use the wholesale inputs that minimise the sum of its own costs and the charge. The optimum for society, however, would require the minimisation of the sum of the incremental costs. The CP may not then choose the (societal) optimum if the difference between charges does not reflect the difference in incremental costs. For the total static welfare loss, the upper bound from distortions to competition might be regarded as the entirety of this gap multiplied by the volume of MPF lines used by CPs other than BT.
51 See Tiscali’s response to the Second Consultation: http://www.ofcom.org.uk/consult/condocs/openreachframework/responses/Tiscali.pdf 52 See footnote 61 on page 30 of Talk Talk’s response to the First Consultation: http://www.ofcom.org.uk/consult/condocs/openreach/responses/CarphoneWarehouseplc.pdf

A new pricing framework for Openreach
67
A4.43 We showed the LRIC estimates taken from the (unaudited) LRIC figures in BT’s 2007/08 regulatory accounts. This indicated that based on current charges, the difference in contribution between MPF and WLR+SMPF in 2007/08 was around £6 per user per annum. This was based on the assumption that the difference in LRIC between MPF and WLR+SMPF was £29. We reproduce below the table from the Second Consultation.
Figure A4.1: Differences in contribution based on BT’s 2007/08 regulatory accounts
£ per annum per line MPF WLR Res +
SMPF Difference
Current charge 81.69 116.28 34.59
BT’s estimate of 2007/08 LRIC (unaudited) 65 93 29
Gap between differences in LRIC and differences in charges 6
Source: BT’s 2007/08 regulatory accounts A4.44 We have not reviewed the robustness of the LRIC figures BT produced and do not
necessarily regard them as sufficiently robust for pricing purposes. Later in this Annex we set out our own view of the differential between the LRICs and we consider it is likely to be in the range of £20 to £25, less than £29. But if we use a figure of £29, then the difference in contribution would be £6 per user per annum. Based on the current volume of MPF lines of around 1.5 million, this might currently imply an upper limit of £9m per annum for the possible cost of the distortion. If this difference in contribution were to remain unchanged, and the volume of lines used by other CPs increased to 4 million in 2012/13, then the upper estimate of this cost might be £24m per annum. Assuming the LRIC figures are accurate, we noted that this is likely to significantly overstate the potential scale of this static welfare loss. This is for because, amongst other things, some CPs would have switched to MPF, and some consumers would have switched to a CP using MPF, even if the MPF charge were higher.
A4.45 Frontier Economics argues that this is likely to overstate any distortion by many times. Its reasons for arguing this include:
When Openreach rolls out its 21CN programme it will be using MSANs in local exchanges. Frontier Economics argues that this means there will be no inefficiency from encouraging CPs to use MPF. This is because MSANs are capable of providing both voice and broadband, and hence any SMPF will involve unnecessary duplication of the capacity to provide broadband.
It is not clear where the present inefficiencies come from.
The number of consumers that would be served by CPs using MPF lines rather than SMPF lines specifically because of the current price differential is maintained would be very much lower.
A4.46 On the first point, we accept there will be some duplication in the scenario Frontier Economics describes, and that such duplication is statically inefficient. But provided the charges for WLR+SMPF reflect the additional resource costs involved for Openreach compared to MPF, then if CPs are able to provide services that consumers want with their own (mostly already existing) equipment, we consider that it would be efficient and desirable for them to do so. Each CP is best placed to choose the overall cost minimising solution. We therefore think that setting charges

A new pricing framework for Openreach
consistent with reflecting the difference in resource costs between MPF and WLR+SMPF is likely to lead to an efficient mix of wholesale products being chosen.
A4.47 On the second point, we give examples of how such inefficiencies could come about earlier in this Annex.
A4.48 On the third point, we agree that it would be likely to be much lower. If we assume that the LRIC estimates are correct, we regard our figure as an upper estimate.
A4.49 However, if the difference between the MPF and WLR+SMPF LRICs in the future were less than the £29 assumed in the above calculation, then the size of the potential distortion would be bigger. We set out later in this Annex that we believe the difference between the LRICs is likely to be in the range of £20 to £25, lower than the £29 used in the above calculation. Using the mid-point of this £20-25 range for the differences in LRICs implies an upper limit of around £25m at the end of 2009/10 and around £60m per annum by 2012/13 for the size of the potential distortion based on current charges.
A4.50 This calculation is based on our final forecasts for the number of external MPF lines. However, in the future, the number of lines that may be affected will depend on the size of the gap between charges. The more out of line the differential in charges compared to the differential in LRIC, the greater the likely number of lines that may be distorted.
A4.51 Frontier Economics argues that the actual number of lines that would not have moved to MPF anyway may be as low as 440,000. Assuming £6 a line, this would only imply an inefficiency of £2.4m. We consider this estimate to be too low. It is based on assuming that there can be no inefficiencies for exchanges for which BT has installed MSANs, that all existing lines are necessarily efficient and that the difference is £6 a line. In terms of making an upper estimate, we do not agree with these assumptions for the reasons given above. We consider that the actual distortion could be considerably higher than £3m.
Size of Ramsey benefits
A4.52 In its original submission, which is quoted by Talk Talk, Frontier Economics contrasts its £2.4m estimate of the productive inefficiencies with illustrative calculations that show the net loss in consumer surplus from not applying Ramsey-based prices to be around £97m. We consider this comparison to be completely unsound.
A4.53 The £97m is based on the following set of assumed incremental costs and proposed Ramsey prices. The incremental cost figures are based on making a rough assumption that incremental costs are 70 per cent of FAC costs.
Figure A4.2: Frontier Economics’ original Ramsey prices
£ per annum per line Incremental
costs Allocated costs
(% mark-up) Proposed
Ramsey charges
WLR 80 54 (67%) 134
MPF 73 13 (19%) 86
SMPF 12 5 (43%) 17
Source: Talk Talk Group response to Second Consultation, Appendix B2, Table 10

A new pricing framework for Openreach
69
A4.54 We consider there to be various unrealistic assumptions behind these Ramsey price53 estimates. A key objection is that they ignore cross-elasticities, that is, the fact that WLR+SMPF and MPF are substitutable at the wholesale level. We set out some of these objections in the Second Consultation in response to similar estimates in Talk Talk’s response to the First Consultation.
A4.55 We also observe that the (own price) elasticity estimates were from a number of developed countries, especially the US, rather than relating specifically to the UK. Also, some of the studies related to the early years of broadband development, when conditions may have been very different.
A4.56 In response to the Second Consultation, Frontier Economics drew our attention to a recent UK-only study (Robertson et al, 2007). Frontier Economics said that the results from that study supported the numbers it used in its Ramsey pricing calculations.
A4.57 We note that this study is based on data collected in the second quarter of 2003. The broadband market is very different today compared to 2003. Prices were much higher in 2003 compared to today, and household penetration was around 10 per cent compared to around 60 per cent today. We think that the broadband elasticity is likely to be lower today than it was in 2003, probably very substantially lower. The fact that the broadband elasticity estimate in the Robertson et al study is comparable to that used by Frontier Economics suggests to us that Frontier Economics’ estimate may be too high as an estimate for broadband elasticity over the next couple of years.
A4.58 We observe that in Appendix D of Talk Talk’s response, Dr Chris Doyle assumes a retail elasticity for broadband of -0.4 rather than the -1.4 assumed by Frontier Economics, on the basis that this estimate is “more conservative and realistic”. Such a markedly lower estimate would probably dramatically reduce the proposed benefits of the Ramsey prices proposed by Frontier Economics.
A4.59 Another weakness with this original analysis by Frontier Economics is that it assumed that even though the WLR charge rose significantly with the proposed Ramsey prices, the volume of lines taking SMPF+WLR was constant. We consider this to be unrealistic. Even ignoring potential substitution between wholesale products, we would expect the price rises to tend to lead to reduced volumes.
A4.60 We therefore continue to have serious reservations about the Ramsey prices that Frontier Economics has generated. But we nevertheless consider them to show why we regard this analysis as flawed.
A4.61 The analysis does not recognise the interactions between demand for MPF, WLR and SMPF. The proposed charges would result in a £65 per line difference between the MPF charge and charges for WLR+SMPF. Based on these figures, this might be £46 more than the difference in incremental costs. Based on our own estimate of
53 In this Statement, we use the term Ramsey prices in a narrow sense to refer to the set of prices that aim to minimise allocative inefficiencies by relating the recovery of common costs from a product to the inverse of the elasticity (or strictly the superelasticity) of that product. Other definitions of Ramsey prices are possible. In particular, Ramsey prices can be defined as the set of prices that minimises static distortions. Such an interpretation would by definition lead to optimal prices in the static sense. We consider that for the charges we are considering such optimal prices would focus on the absolute difference in LRICs. For ease of exposition, we do not use the term Ramsey prices in this second sense in this statement.

A new pricing framework for Openreach
the differences in LRICs, we consider that it would be around £40 per line more than is required for productive efficiency.
A4.62 We consider that such a large difference is bound to mean that the substitution from WLR+SMPF to MPF lines is much larger and faster than it would have been had the differential been based on incremental costs. We consider that this would represent a substantial distortion to competition.
A4.63 Moreover, such a large differential may also mean that MPF would be used for voice only lines, instead of WLR, when this is not justified by the underlying differences in cost. The differences between the Ramsey charges proposed by Frontier Economics for MPF and WLR is £48, which we consider is well in excess of the difference in incremental costs.
A4.64 Our central volume forecasts (based on the charges we are setting) envisages 17.5m WLR lines in 2012/13 of which 10.9m have SMPF. We believe that the size of the differentials proposed by Frontier Economics’ Ramsey prices would result in far more WLR lines moving to MPF. This could occur by CPs switching from using WLR and WLR+SMPF to using MPF. Or it could occur through the retail market by consumers moving away from CPs whose retail offering were based on WLR and WLR+SMPF as those CPs ceased to be competitive.
A4.65 This would tend to make the proposed Ramsey prices unsustainable. As the volume of MPF lines increased, and the volume of WLR lines decreased, common cost recovery could be inadequate and Openreach may be unable to recover its costs. This could put at risk its incentive to invest and maintain the network which we think would be against consumers’ interests. The estimated benefits from setting prices in this way of £97m is therefore implausible in our view.
A4.66 Rather, the large differentials would be likely to generate significant productive cost inefficiencies. While it is difficult to estimate the possible scale of these, we consider that they would be likely to be very substantial. The volumes of lines using MPF would be likely to be far higher than if the charge differential was based on costs.
Revised Frontier Economics submission
A4.67 Frontier Economics also submitted a revised version of its assessment of Ramsey prices. The methodology was different to its original calculation. One important difference was that the wholesale prices were constrained such that the contribution to common cost recovery from MPF was equal to that from WLR+SMPF. Frontier Economics says that this therefore ensures there can be no productive inefficiency distortion. Because this is controlled for, the welfare estimates are the net effect of both the allocative and productive efficiency considerations.
A4.68 Frontier Economics have two revised scenarios. The first scenario gives the following prices.
Figure A4.3: First revised Frontier Economics’ Ramsey price scenario
£ per annum per line FAC Ramsey
MPF 103.84 91.42
WLR 114.22 145.80
SMPF + WLR 131.35 118.93
Source: Talk Talk Group response to Second Consultation, Revised Appendix B2, Table 11

A new pricing framework for Openreach
71
A4.69 Frontier Economics estimates that this scenario results in a net increase of £5.2
million in consumer surplus. However, this scenario results in a negative charge for SMPF. We do not think this is practical. Also, it seems to us to be likely to lead to potential productive efficiency distortions between WLR and WLR+SMPF, in the sense that voice only consumers may be able to get a cheaper price by nominally also taking broadband.
A4.70 Frontier Economics also calculates a scenario that has the additional constraint that the SMPF charge must be non-negative.
Figure A4.4: Second revised Frontier Economics’ Ramsey price scenario
£ per annum per line FAC Ramsey
MPF 103.84 98.90
WLR 114.22 126.41
SMPF + WLR 131.35 126.41
Source: Talk Talk Group response to Second Consultation, Revised Appendix B2, Table 12 A4.71 As can be seen from the Figure above, this results in a zero price for SMPF.
Frontier Economics estimates that this scenario results in a net increase of £3.3 million in consumer surplus compared to the FAC prices. We note that this is very significantly less than the original estimate of gross benefit of £97m from Ramsey prices, and hence substantially reduces the proposed benefits of moving to Ramsey prices.
A4.72 Despite the much lower revised figure for consumer gain, we nevertheless consider that it is still too high. This is because:
For the reasons discussed earlier, we think it likely that the elasticity estimate Frontier Economics uses for broadband is too high, probably very substantially too high;
No account has been taken of cross-price elasticity effects in the calculation of the Ramsey prices, even though they will not be zero; and
A zero price for SMPF may result in allocative inefficiencies, as it is clearly below LRIC. Some consumers who are supplied with WLR may choose broadband when they would not want to pay the incremental costs of having it.
A4.73 In summary, we consider that the small positive net gain that Frontier Economics calculates would result from this second revised set of Ramsey prices is still too high. We believe that the net static effect from setting prices in this way could well be negative. We therefore do not think this analysis shows a strong case for moving away from CCA FAC.
The differentials between the charges we are considering
A4.74 In the Second Consultation, we said that we considered the most important static efficiency consideration was the distortion in the choice between MPF and WLR+SMPF under the current charges and that to remove this, the difference between the charges should reflect the difference in the incremental costs of providing the services. We considered that setting charges to move towards CCA
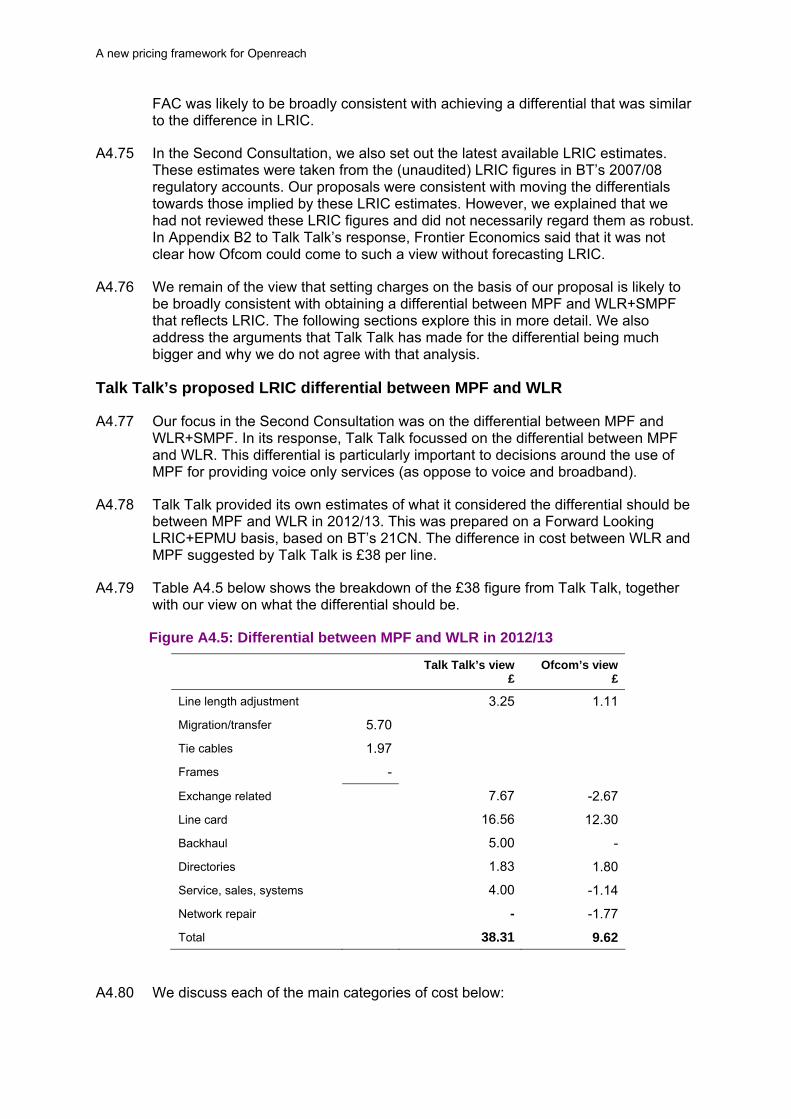
A new pricing framework for Openreach
FAC was likely to be broadly consistent with achieving a differential that was similar to the difference in LRIC.
A4.75 In the Second Consultation, we also set out the latest available LRIC estimates. These estimates were taken from the (unaudited) LRIC figures in BT’s 2007/08 regulatory accounts. Our proposals were consistent with moving the differentials towards those implied by these LRIC estimates. However, we explained that we had not reviewed these LRIC figures and did not necessarily regard them as robust. In Appendix B2 to Talk Talk’s response, Frontier Economics said that it was not clear how Ofcom could come to such a view without forecasting LRIC.
A4.76 We remain of the view that setting charges on the basis of our proposal is likely to be broadly consistent with obtaining a differential between MPF and WLR+SMPF that reflects LRIC. The following sections explore this in more detail. We also address the arguments that Talk Talk has made for the differential being much bigger and why we do not agree with that analysis.
Talk Talk’s proposed LRIC differential between MPF and WLR
A4.77 Our focus in the Second Consultation was on the differential between MPF and WLR+SMPF. In its response, Talk Talk focussed on the differential between MPF and WLR. This differential is particularly important to decisions around the use of MPF for providing voice only services (as oppose to voice and broadband).
A4.78 Talk Talk provided its own estimates of what it considered the differential should be between MPF and WLR in 2012/13. This was prepared on a Forward Looking LRIC+EPMU basis, based on BT’s 21CN. The difference in cost between WLR and MPF suggested by Talk Talk is £38 per line.
A4.79 Table A4.5 below shows the breakdown of the £38 figure from Talk Talk, together with our view on what the differential should be.
Figure A4.5: Differential between MPF and WLR in 2012/13
Talk Talk’s view
£ Ofcom’s view
£
Line length adjustment 3.25 1.11
Migration/transfer 5.70
Tie cables 1.97
Frames -
Exchange related 7.67 -2.67
Line card 16.56 12.30
Backhaul 5.00 -
Directories 1.83 1.80
Service, sales, systems 4.00 -1.14
Network repair - -1.77
Total 38.31 9.62
A4.80 We discuss each of the main categories of cost below:
A new pricing framework for Openreach
73
Talk Talk considered that the line length adjustment should be 6% of d-side copper. We used an adjustment of less than 3%. This was based on a sample of actual lines of the different types by Openreach.
In terms of exchange related costs:
o Talk Talk’s estimates for migration relates to the movement to 21CN. It included an annualised cost of the migration. The justification for moving to 21CN, as there are no forced migrations, is that it will reduce costs overall. This calculation is net of the migration costs. Our initial view is that it is therefore not appropriate to include the migration costs in the WLR annual rental costs, though we will review this as part of the WLR consultation.
o Our cost forecasts are based on BT’s actual expected costs (on a CCA FAC basis), which largely relate to 20CN architecture. Given that the existing tie cables for this are largely depreciated, there is little in our cost stacks for tie cables.
o MPF currently involves more wiring on the MDF than WLR (because of test equipment). We believe this should result in a higher allocation of exchange related costs for MPF than WLR.
In terms of line cards:
o We have set the line card allocation to recover both the legacy PSTN line cards and a contribution to voice related 21CN line card costs, as the new 21CN line card costs are phased in. For the 21CN line cards, we have adopted Openreach’s proposed methodology. This involves costs being recovered on the basis of the number of services provided. So where a 21CN line card is used for both voice services and broadband, it recovers double the cost compared to a card that is only used for voice services.
o We consider this approach to the recovery of the 21CN line card costs to be reasonable. This is partly because it results in a line card cost that is broadly constant in real terms over time. We consider this to be an advantage because voice only consumers receive no benefit from 21CN line cards. 21CN line cards are being introduced primarily for providing services to consumers who use both voice and broadband services, it seems reasonable that the additional costs of the 21CN line cards services (over and above the cost of existing line cards) should ultimately be borne by such consumers.
Talk Talk included £5 for backhaul, but we do not regard backhaul as relevant for either product and have not included any cost for that.
Our estimates of directory costs are similar.
For services, sales and systems, Talk Talk argued that WLR is a more complex service, and that this would imply additional costs in systems, sales and service management. In contrast, we regard MPF as involving more such costs than WLR. This is primarily because MPF is associated with more fault reports than WLR, which drives up the allocation of costs.
Our cost forecasts for MPF also reflect the higher fault rate associated with MPF compared to WLR in terms of driving higher network repair costs.

A new pricing framework for Openreach
A4.81 We therefore consider the differential should be much smaller than proposed by Talk Talk.
Likely LRIC differential between MPF and WLR+SMPF
A4.82 We consider that the differential between MPF and WLR+SMPF is particularly important because:
the majority of fixed lines also take broadband54; and
it is the provision of broadband services that has driven investment in LLU, not the provision of voice services.
A4.83 We begin by exploring in detail the components of the differential in terms of the CCA FAC forecasts. We can then consider how this differential might change if we were to consider a LRIC approach. Figure A4.6 below shows a bridge from our estimate of the CCA FAC for MPF to our estimate for WLR+SMPF (using a weighted average of residential and business lines for WLR). We show this for 2009/10 and 2010/11, the two years for which we are setting charges.
54 Ofcom’s own research suggests that nearly 70% of households that take a fixed line also take broadband, and that this is rising over time. Our volume forecasts suggest that currently, for both business and residential, nearly 60% of total analogue WLR and MPF lines also have broadband (assuming that MPF is used exclusively for voice and broadband), and that this proportion will continue to rise over time.

A new pricing framework for Openreach
75
Figure A4.6: Ofcom Estimate of bridge for FAC for MPF to WLR+SMPF on CCA FAC basis
2009/10
£ 2010/11
£ Reasons for differences in CCA FAC
MPF 87.20 90.41
Network related 1.24 1.06
On average MPF lines are assumed to involve 3 per cent lower copper pair costs then WLR residential lines (see the section on line length adjustment in Annex 6)
Network repair 1.65 1.66
Repair costs are allocated using actual observed fault rates for each service (WLR, MPF, SMPF) separately. This results in higher fault allocation for WLR+SMPF than for MPF
Exchange related (including exchange repair) 3.51 3.60
There are differences in the provision of the two services in exchanges, including that WLR+SMPF required more wiring on the MDF and has higher exchange related faults because it involves more jumpering
Line card 12.10 12.69 MPF does not use line cards
Service, systems and other 3.78 3.85
Mainly the phone book cost allocation associated with WLR and higher allocation of system costs for WLR+SMPF
Return on capital employed 0.81 1.19More assets are employed in the delivery of SMPF+WLR services (as a result of the higher copper pair costs)
WLR+SMPF 110.28 114.46
Difference in FAC charges 23.08 24.04
A4.84 Our longer term forecasts for CCA FAC suggest that this differential remains at
between £24 and £25 in 2012/13.
A4.85 While we have not forecast LRIC, in Figure A4.7 below we consider how each of the components in the above bridge might change if considered on a LRIC basis. In doing this, we assume that ultimately the consumer receives both voice and broadband services.
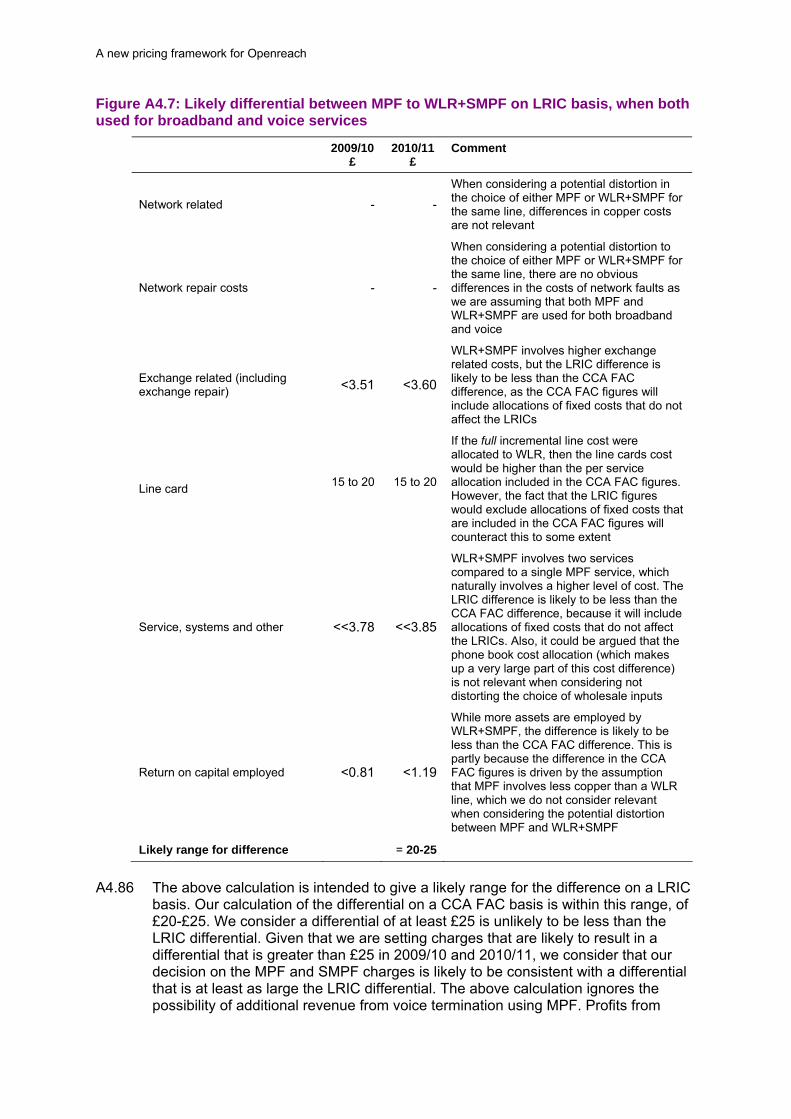
A new pricing framework for Openreach
Figure A4.7: Likely differential between MPF to WLR+SMPF on LRIC basis, when both used for broadband and voice services
2009/10
£ 2010/11
£ Comment
Network related - -
When considering a potential distortion in the choice of either MPF or WLR+SMPF for the same line, differences in copper costs are not relevant
Network repair costs - -
When considering a potential distortion to the choice of either MPF or WLR+SMPF for the same line, there are no obvious differences in the costs of network faults as we are assuming that both MPF and WLR+SMPF are used for both broadband and voice
Exchange related (including exchange repair) <3.51 <3.60
WLR+SMPF involves higher exchange related costs, but the LRIC difference is likely to be less than the CCA FAC difference, as the CCA FAC figures will include allocations of fixed costs that do not affect the LRICs
Line card 15 to 20
15 to 20
If the full incremental line cost were allocated to WLR, then the line cards cost would be higher than the per service allocation included in the CCA FAC figures. However, the fact that the LRIC figures would exclude allocations of fixed costs that are included in the CCA FAC figures will counteract this to some extent
Service, systems and other <<3.78 <<3.85
WLR+SMPF involves two services compared to a single MPF service, which naturally involves a higher level of cost. The LRIC difference is likely to be less than the CCA FAC difference, because it will include allocations of fixed costs that do not affect the LRICs. Also, it could be argued that the phone book cost allocation (which makes up a very large part of this cost difference) is not relevant when considering not distorting the choice of wholesale inputs
Return on capital employed <0.81 <1.19
While more assets are employed by WLR+SMPF, the difference is likely to be less than the CCA FAC difference. This is partly because the difference in the CCA FAC figures is driven by the assumption that MPF involves less copper than a WLR line, which we do not consider relevant when considering the potential distortion between MPF and WLR+SMPF
Likely range for difference = 20-25
A4.86 The above calculation is intended to give a likely range for the difference on a LRIC
basis. Our calculation of the differential on a CCA FAC basis is within this range, of £20-£25. We consider a differential of at least £25 is unlikely to be less than the LRIC differential. Given that we are setting charges that are likely to result in a differential that is greater than £25 in 2009/10 and 2010/11, we consider that our decision on the MPF and SMPF charges is likely to be consistent with a differential that is at least as large the LRIC differential. The above calculation ignores the possibility of additional revenue from voice termination using MPF. Profits from

A new pricing framework for Openreach
77
termination may provide an additional incentive to use MPF, though currently BT’s charges which apply reciprocally are low relative even to incremental cost.
Dynamic efficiency considerations
Increased competition in voice
A4.87 Talk Talk argued that promoting the use of MPF would result in deeper network based competition, which would result in greater innovation and better customer services. Talk Talk estimated that this could result in cost pressure that could be worth up to £42m for consumers.
A4.88 The £42m is calculated on the basis that Talk Talk argues the difference between WLR and MPF should be around £35 per line, and there will be around 24 million lines in 2012/13. On this basis, the access costs of providing voice would be £840m and if it is assumed that increased voice competition were to reduce costs by 5%, this would result in a benefit to consumers of £42m per year.
A4.89 We agree that if deeper competition in voice (based on MPF) were to be effective and sustainable, it is likely to lead to greater consumer benefits than otherwise. However, the extent of any benefits is likely to be limited and far lower than Talk Talk suggests for the following reasons:
As discussed in an earlier section, we consider the £35 per line estimate to be far too high.
In our on-going review of the retail narrowband services market, our provisional finding is that BT does not have SMP in the retail narrowband market. The scope for deeper competition in voice to produce dynamic gains is, therefore, likely to be limited. Any gains would be limited to the additional competition on the difference between the WLR and MPF cost stacks, over and above that already provided by cable and that which would anyway be provided by MPF used for both voice and broadband. The majority of the 24 million lines take both voice and broadband.
There would also be offsetting costs of setting charges in this way.
A4.90 We consider that our approach to setting charges, based on BT’s costs, already strikes an appropriate balance between the desirability of providing incentives for competitive entry (dynamic efficiency) and avoiding wasteful duplication (static inefficiency). It does not therefore seek to prevent the possibility of entry that may, at least in the short term, lead to some increase in costs. If that were the intention, charges could be set using the efficient component pricing rule (ECPR). Under the ECPR, charges would compensate BT for lost profit from calls and broadband services as well as lost revenue from line rental. The ECPR option allows only efficient entry, in the sense that, in order to undercut the incumbent and cover its cost, the entrant would have to have lower costs than the incumbent for the parts of the service it provided itself. The charge for the local loop would equal the incremental cost of the local loop, plus the profit on calls, broadband and line rental. This would probably imply higher charges than we are now setting, particularly for MPF. By contrast, Talk Talk would push the balance further in favour of entrants, increasing the risk that the costs of static inefficiency would not be outweighed by gains from increased competitive pressure.

A new pricing framework for Openreach
A4.91 On balance, we do not consider there is a strong case for setting the MPF charge lower than we would otherwise so as to stimulate deeper competition in voice services.
Increased competition in broadband
A4.92 Talk Talk argued that not increasing the MPF charge would result in reduced broadband prices from increased competitive intensity in the future. An illustrative calculation by Frontier Economics, based on an Ofcom welfare model, suggests benefits with an upper bound of £120m in 2015.
A4.93 This calculation assumes that there are four broadband providers when charges are set to favour the use of MPF, and only three broadband providers otherwise. It takes no account of the fact that long term charges below CCA FAC would not be sustainable unless other charges were raised above CCA FAC. There is no account taken of this off-setting increase in Frontier Economics’ calculation.
A4.94 We do not think it is clear that maintaining a differential between the charges for MPF and those for WLR+SMPF that is above that implied by the costs would increase competitive pressures. Both MPF and SMPF are used to provide broadband services, and setting charges in this way would tend to disadvantage operators using WLR+SMPF. As most operators currently use WLR+SMPF, this could conceivably reduce competitive pressures for broadband services. Setting charges so that the differential between WLR+SMPF and MPF was equal to the cost of providing the different services would represent a neutral approach. Talk Talk’s approach would be less likely to increase the total number of broadband suppliers than to distort the choice about the way suppliers in the market provide broadband service.
A4.95 Frontier Economics argue that there are significant benefits for CPs of moving to using MPF at some point. If this is the case, then we would expect them to move to using MPF when it is most efficient for them to do so. There should be no need to artificially set prices to give them such an incentive. Maintaining an artificially high differential between MPF and WLR+SMPF may encourage operators to make the transition earlier than would be efficient.
A4.96 Also, we note that the welfare model that Frontier Economics adopted was developed by Ofcom to be used in very different circumstances. In particular, it does not take account of fixed costs. In the current context, we consider it inappropriate to ignore fixed costs as LLU involves significant fixed costs.
A4.97 We remain of the view that sustainable and effective competition requires that – in the long term – entrants must be able to compete without special protection. This suggests that prices should be set in the longer term to cover efficiently incurred costs, and that relative prices should not distort the choices among products made by CPs.
A4.98 We do not consider there to be strong arguments for setting charges to provide an increased incentive for entry or promote competition at this stage in the market’s development.
Other dynamic efficiency considerations
A4.99 There are other dynamic efficiency considerations. We consider that it is important to provide investors with a stable regulatory framework. In our view this means we

A new pricing framework for Openreach
79
should give weight to how we have set charges in the past, and to stakeholders’ reasonable expectations for charges in the future. It also argues for avoiding excessive volatility in prices.
A4.100 Given we have set charges based on CCA FAC in the past and have also used CCA FAC to set other current controls, we consider that setting a price path to move charges to CCA FAC over a four year period should give investors confidence in the stability and predictability of the regulatory regime. Adopting a consistent approach also ensures sustainability in the long term, in the sense that if all charges are set on a CCA FAC basis Openreach can be assured of being able to recover its common costs in full.
Conclusion on efficiency considerations
A4.101 In terms of static efficiency, we consider distortions to competition to be an important issue. We consider that setting charge so that the differential between MPF and WLR+SMPF is based on the difference in LRIC would remove these distortions. We consider that setting charges based on CCA FAC is broadly consistent with doing this. We do not consider that the analysis by Frontier Economics supports a strong case for moving away from CCA FAC on static efficiency grounds.
A4.102 In terms of promoting competition, we have considered the arguments that Talk Talk has put forward for setting the MPF rental charge lower than we otherwise would, so as to actively encourage the use of MPF so as to help develop network based competition. Our view remains that at this stage in the market’s development we consider that differences in charges should reflect underlying differences in costs. We considered that this is broadly achieved with CCA FAC.
A4.103 We consider the more important dynamic consideration to be providing a stable regulatory background. We consider that this argues for giving weight to how we have set charges in the past, and to stakeholders’ reasonable expectations for charges in the future. We consider that setting a price path to move charges to CCA FAC over a four year period should give investors confidence in the stability and predictability of the regulatory regime, ensure sustainability and allow overall cost recovery.
A4.104 We therefore consider that setting charges equal to CCA FAC is broadly consistent with achieving both static and dynamic efficiency in this case.
Conclusion on appropriate cost standard
A4.105 We continue to regard CCA FAC as being a reasonable basis for informing the setting of charges. We accept that in general it may not necessarily lead to the theoretically most efficient outcome. But in this Statement, as in the Second Consultation, we have explicitly considered whether there are strong objections to CCA FAC on efficiency grounds for the particular charges we are setting.
A4.106 We have concluded that setting charges equal to CCA FAC is broadly consistent with achieving an efficient outcome in this case. We therefore consider it to be in consumers’ interests.
A4.107 We believe that the current differential between MPF and WLR+SMPF will result in a distortion to competition which could lead to inefficiencies. For example, consumers may switch away from CPs using WLR+SMPF to CPs using MPF

A new pricing framework for Openreach
because the CP using MPF is able to offer a cheaper service. If the CP using MPF would not have been able to offer a cheaper services if the differences in wholesale charges had been based on the underlying costs, this could be inefficient. Also, CPs’ investment decisions may be distorted if the differential between wholesale products does not reflect costs.

A new pricing framework for Openreach
81
Annex 5
5 Implications of cost calculations for prices Introduction
A5.1 This Annex accompanies our conclusions in Section 5 in setting out our consideration of the implications of the cost calculations for prices. In particular, this Annex explains that we consider:
there is a strong case for using a glide path to phase in changes to charges;
there is also a case for a price path that involves a larger increase in the MPF charge in the first year;
our decision to raise charges is in consumers’ interests, even though retail prices may rise somewhat as a result, because of longer term benefits to consumers;
our decision will not have a significant impact on the current trends in broadband penetration; and
our decision will in static terms have a negative impact on LLU investment based on MPF, but that we nevertheless consider that increasing the MPF charge to an efficient level is appropriate.
A5.2 This Annex forms an important part of our impact assessment, as described in Section 2. It should be read in conjunction with our draft impact assessment in the Second Consultation.
Price path
Our views in the Second Consultation
A5.3 In light of our view that CCA FAC is an appropriate cost standard, we considered various approaches to modifying prices to close the gap between existing charges and that cost standard. We focussed on four options:
adjust prices for each service to equal their CCA FAC in 2009/10 (“immediate rebalancing”);
adjust prices for each service over time, so that they equal the CCA FAC by 2012/13 (“full rebalancing over four years”);
adjust prices for each service so that they move towards the CCA FAC such that the gap between price and CCA FAC is reduced by, say, half by 2012/13 (“partial rebalancing over four years”); and
adjust prices across all services at a similar rate such that the relative levels of each price is maintained, while costs overall are recovered (“no rebalancing”).
A5.4 By ‘rebalancing’, we were referring to narrowing the difference between the MPF charge and the charges for WLR+SMPF in order to avoid distortions in the choice of wholesale products.

A new pricing framework for Openreach
A5.5 We considered that an immediate rebalancing, so that prices were set equal to the CCA FAC levels, would be disruptive to competition and could undermine confidence in the regulatory regime.
A5.6 We considered that a full rebalancing over four years would be most in consumers’ interests. Under this option, charges would increase such that they would reach the level of CCA FAC after four years.
A5.7 For the LLU charge controls, we proposed to set a two year charge condition (relating to 2009/10 and 2010/11) but to set this by reference to a full four year period. For WLR, we proposed to reset the charge to what it would be for the first year of a four year period. We considered this approach to be broadly consistent with our normal approach to setting charges.
A5.8 In the simplest form of glide path, prices would increase at a constant real annual rate. However, in theory, the rate of change could change each year and this option does not, for example, rule out relatively higher or lower increases in the opening year of any control.
A5.9 Any proposal for larger than average increases in the early years would have to take account of the benefits of moving prices closer into line with costs sooner rather than later (such as those relating to efficient investment incentives) with the risks associated with rapid price changes (such as the impact on regulatory uncertainty). Smaller increases may risk encouraging entry at inefficient levels.
A5.10 In setting charges by reference to a glide path, we said we would also wish to consider the implications for Openreach’s returns during the period of the glide path.
A5.11 We recognised that any increase in the MPF charge would have an impact on the LLU footprint. However, it would not be appropriate to encourage further roll-out if that roll-out is ultimately inefficient and unsustainable. We said that our intention was to set current charges and signal the likely direction of future price movements such that CPs can make decisions about whether to invest in further LLU. We believed that this was most appropriate in terms of furthering consumers’ interests.
A5.12 We also recognised that this approach potentially would have implications for the value of the investments of CPs using MPF. However, given that we signalled our intention to review these charges at the time they were first set, CPs arguably would have anticipated that changes to the current structure of nominal charges would take place. Also, we explained that we had sought to employ a methodology in determining the charge controls that was consistent with our previous practice. The proposed approach should also give investors confidence in the predictability of the regulatory regime in the future.
A5.13 We also noted that the impact on LLU operators may be mitigated by BT’s recent proposed reductions in BES prices, and by Ofcom’s proposals for the Leased Line Charge Control55 if those proposals were adopted. We discuss in more detail what we said in the Second Consultation on the impact on LLU operators and final consumers later in this Annex.
A5.14 On this basis, we considered that the initial re-alignment of existing charges for the Core Rental Services should be undertaken by reference to a glide path. The glide
55 http://www.ofcom.org.uk/consult/condocs/llcc/leasedlines.pdf

A new pricing framework for Openreach
83
path may give rise to different price changes in each year, but should avoid unduly disruptive levels of one-off adjustment in charges. We consider that the direction of the glide path should be designed such that charges are largely in line with efficiently incurred costs within four years.
Responses to the Second Consultation
A5.15 Openreach argued that:
The current regime has led to substantial under-recovery of costs across a wide range of Openreach’s critical copper-based product set and that this was “particularly extreme” in the case of MPF. Openreach considered that if the level of charges was not addressed there could be serious consequences. It said it would have no incentive to invest and that would lead to a significant degradation of customer service.
Ofcom was no longer proposing a four year framework, as it was only proposing to set charges for one year for WLR and for two years for LLU related services. Openreach considered that to be consistent with this approach, there should be an immediate adjustment of charges.
A move directly to CCA FAC in 2009/10 is not inconsistent with previous regulatory practice. Openreach argued that the most relevant regulatory precedent was the November 2005 Statement56 that set the MPF rental charge. This statement makes clear that a CCA FAC standard was used, but had little explanation of Ofcom’s likely approach in the future. Openreach argued that the regime introduced in 2005 involved a determined price that would be re-determined at some time in the future. There was no discussion as to whether, if a price control were used in the future, there might be reasons not to start any control from CCA FAC.
Charge controls at the higher end of Ofcom’s proposed price ranges or above would not unduly disrupt the market or specific customers. Openreach considered the controls would not have a material negative impact on the margins of existing MPF investments or on the incentive to invest in the future.
A5.16 Talk Talk argued that:
Openreach’s argument on it not having an incentive to invest was incorrect. Talk Talk said that provided all services recover their incremental costs of provision and in total all common costs are recovered, there remains an incentive and ability to invest. Talk Talk said that MPF does fully recover its incremental costs and overall Openreach recovers all common costs, and that Openreach does therefore have an incentive to invest.
Ofcom had not considered the most sensible option for a glide path. Talk Talk considered this to be a glide path that effectively kept prices unchanged until core rental services returns were projected to fall below the cost of capital (which on Ofcom’s numbers it said was somewhere in mid 2010).
Based on the mid case of Ofcom’s own numbers, Openreach would make £71m excess profits (i.e. in terms of returns over and above those required to cover the cost of capital) in 2009/10 even without any price changes. The mid point of the
56 http://www.ofcom.org.uk/consult/condocs/llu/statement/llu_statement.pdf

A new pricing framework for Openreach
price changes Ofcom proposed for 2009/10 would add around £75m to the excessive profits on the core rentals.
Openreach’s claim that the impact on existing MPF investment would be small was incorrect. Based on Ofcom’s high case, Talk Talk said that the proposed MPF increases would reduce the internal rate of return on investment by up to 10 to 20 percentage points.
A5.17 Vodafone disagreed with Ofcom’s proposal to accelerate the rebalancing of the MPF line rental. The high end of the MPF rental range for 1 April 2009 had been set so as to accelerate rebalancing in order to avoid inefficient decisions by CPs. Vodafone argued, however, that this will not be the case since Ofcom is making quite clear the anticipated end-point of the MPF line rental, and CPs will in any event factor this into their plans. Set against this, a step increase in the MPF line rental for 2009/10 (above that given by a smooth glide path) could be unduly disruptive to the cash flow of CPs, and may result in delay to efficient investment. Vodafone proposes, therefore, that Ofcom sets an MPF line rental for 2009/10 consistent with achieving CCA FAC in 2012/13 via a smooth glide path.
A5.18 Tiscali also argued against a rapid rise in the MPF charge. It said that this would significantly affect LLU investment in the UK and that the business plans of competitive providers were already suffering the consequences of the recession and prices paid by consumers. It said that a glide path should be used to adjust charges over time. It said that CPs planning to invest further in MPF would not make inefficient decisions in the absence of immediate adjustments, because future changes will be thoroughly anticipated as a result of Ofcom’s review work and regulatory statements.
A5.19 Cable and Wireless supported increasing the MPF charge towards CCA FAC using a glide path, but was opposed to a rapid or expedited change.
Our views on responses to the price path options
A5.20 We have carefully considered Talk Talk’s argument for setting a price path that involved charges for the Core Rental Services being constant while the projected return on capital employed was above the cost of capital.
A5.21 We recognise that an advantage of the approach Talk Talk proposes is that it may tend to mean lower prices for consumers in the short term than would be the case if the MPF charge rose. But we consider that this effect may be limited as only a relatively small share of consumers are served by services using MPF current and in forecasts for the next two years.
A5.22 But we consider there are significant downsides to the approach proposed by Talk Talk, namely:
the distortions between wholesale charges would remain unchanged for two years; and
it is out of line with our usual regulatory practice of adjusting charges gradually towards our assessment of cost, and risks undermining cost minimisation incentives and confidence in the regulatory regime.

A new pricing framework for Openreach
85
Distortion between wholesale products
A5.23 We consider that maintaining the current distortion between wholesale products to
be a significant drawback. Even though it involves increasing the charge for one of the wholesale inputs, we consider that raising the MPF charge would ultimately be in consumers’ interests because it results in competition between CPs using different wholesale inputs that is not distorted.
A5.24 We understand the argument made by Talk Talk and others that signalling a rise in the MPF charge would be sufficient. For example, we could clearly state now that the differential between the charges should narrow and that the MPF charge will need to rise in the future. We accept that this should give CPs a good signal about future changes and will affect their decision about investment that span that time horizon. But we do not think it would necessarily be as effective as actually raising the MPF charge now. More importantly, it would not address the fact that the potential distortion can occur via the retail market.
General argument for a glide path
A5.25 Setting a price path that did not allow charges to adjust while the projected return
on capital employed was greater than the cost of capital would represent a significant change in the way we regulate. We generally use glide paths because they give greater stability and predictability, and have stronger cost efficiency incentives for the regulated company. They give strong cost efficiency incentives because they mean prices are adjusted to be in line with cost gradually which means regulated company retains more of the benefit from reducing costs and hence has a stronger incentive to reduce costs. Over time, this should result in lower costs and hence lower prices.
A5.26 We agree with Talk Talk that our price path will allow Openreach to earn returns in excess of its cost of capital for the Core Rental Services taken together, both in 2009/10 and 2010/11. It is a common result when we set charges using a glide path for returns to be excessive at the beginning of the glide path period. In general, we consider that it is justified because of the stronger cost minimisation incentives it gives regulated companies. Talk Talk’s proposal could weaken these incentives in the future because it may signal that Ofcom would only allow regulated companies to keep a smaller part of the benefits of any out-performance on costs.
A5.27 As Frontier Economics argues in an appendix to Talk Talk’s submission, there is a trade off. Using glide paths means that consumers will face higher prices in the short term, but the stronger cost minimisation incentives should result in lower prices in the longer term. Frontier Economics argues that we should assess whether this trade off results in a better outcome for consumers.
A5.28 While we consider a glide path approach is likely to be in the interests of consumers of these products, it would be difficult to demonstrate this in a robust way. Any assessment would turn on the assumption about the impact of stronger cost minimisation incentives, which would be very difficult to estimate with any degree of robustness. Moving away from a glide path approach would have a particularly significant effect on the cost minimisation incentives towards the end of a review period. Without some mechanism for allowing companies to retain some benefit from cost efficiencies into the next control period, regulated companies would have

A new pricing framework for Openreach
very weak incentives to reduce costs at the end of a charge control period.57 We consider that the impact of weak cost minimisation incentives towards the end of a charge control period could be significant.
A5.29 And the impacts we would need to consider may be broader than the effect on the future level of the particular charges covered by this review. A move away from a glide path approach in this case could signal a weaker commitment to that approach more generally and hence weaken cost minimisation incentives for other products subject to regulation. This could lead to a loss of consumer welfare from higher charges for other services subject to charge controls.
A5.30 We recognise that the circumstances in which the MPF charge is being set are rather different to those we usually face in setting charge controls. We usually set charge controls for a fixed period of time and when they are reset we use a glide path to the forecast level of costs at the end of the next period. This enables the regulated company to benefit from any out-performance in the previous control period for longer, and signals to the company that it will be able to do so in the future. In contrast, the current MPF charge was set at a fixed level of £81.69 in 2005 until further notice.
A5.31 Despite the rather different circumstances, we nevertheless consider that the most natural expectation would be a four year glide path approach. As such, we consider that adopting our usual glide path approach should give investors’ confidence in the stability and predictability of the regulatory regime. And this approach should also send a strong message that we will adopt such an approach in the future, which should tend to lead to strong cost minimisation incentives and lower prices for consumers in the long term. We therefore consider such a price path to be in consumers’ interests.
A5.32 We therefore attach little weight to the arguments of both Talk Talk and Openreach that the current charge control should be considered very differently to our usual approach to setting charges. We note that using a glide path approach was supported by other responses, including Vodafone and Tiscali.
Conclusion on price path
A5.33 We consider that there is a strong case for setting charges in 2009/10 and 2010/11 based on a glide path approach. In general, we prefer glide paths because they give greater stability and predictability and give stronger cost efficiency incentives. Using a glide path for the MPF charge would also be consistent with our usual practice, and as such should give all parties confidence in the predictability of the regulatory regime. We consider that a four year glide path is appropriate, though we note that for MPF using a two year glide path would result in a fairly similar result given our final CCA FAC estimates.
A5.34 We also consider there is a case for a price path with a larger increase in the MPF charge in the first year. In particular, we consider that the potential distortions to the choice between MPF and WLR+SMPF provides some justification for such an increase.
57 We note that in other regulated industries in the UK, even through glide paths may not be common, there are often ‘rolling incentive mechanisms’. These are another way of avoiding the weakening of the incentive to reduce costs towards the end of a charge control period. They may also result in charge controls being set with allowed returns forecast to be above the cost of capital.

A new pricing framework for Openreach
87
Impact on consumers
Our views in the Second Consultation
A5.35 In the Second Consultation, we set out three high level options:
removal of all or some of the current controls;
continuation of the current charge ceilings (that is, no action); and
restructuring the existing controls and charge ceilings.
A5.36 We said that we considered that high level option 1 (the removal of controls) would be clearly detrimental to consumers’ interests. BT has SMP in the relevant markets. Without charge ceilings, it would have the ability to set excessive charges for the relevant wholesale services.
A5.37 Whilst ex post regulation could in theory be used to control SMP, it would not give CPs the clarity on what charges will be that they need to make decisions about which wholesale products to buy from CPs, including whether or not to make investments in LLU. Without such clarity, CPs may be placed at a significant disadvantage in competing with BT in the wholesale broadband access markets and fixed narrowband wholesale exchange line markets. Ultimately, we believe this would feed through to higher prices and less choice for consumers. Therefore we consider it would be detrimental to their interests. Given Ofcom’s objective to promote the interests of consumers, we therefore consider that the retention of charge ceilings is required.
A5.38 We also noted that the EC Recommendation58 on product and service market susceptible to ex ante regulation (the “EC Recommendation”) includes a similar market as one of the markets susceptible to ex ante regulation (as ‘Market 4’). This is consistent with the view that ex post regulation would be inadequate in that market.
A5.39 In the Second Consultation we also considered that high level option 2 (continuation of the current charge ceilings) would also be detrimental to consumers’ interests. Our review of Openreach’s financial performance and the underlying costs of provision of the regulated services concluded that the financial evidence supported a general case for price increases. Without any increases in charges Openreach may have insufficient incentive to invest in and maintain the network. Without such an incentive, the quality, and even availability, of services that consumers receive would gradually deteriorate.
A5.40 In the Second Consultation, we did not consider that our proposals would be likely to lead to a significant increase in consumers’ total bills. For broadband prices, there has been a strong downward trend to date. If this were to continue, it may mitigate the effect of the wholesale charge increases we are introducing. Nevertheless, some increase in total bills is possible. The extent of this will depend on a number of factors. These include: the extent to which CPs are able to absorb any increase in wholesale costs; the extent of competition from CPs that do not use Openreach’s exchanges, (especially cable); and the outcome of the Leased Line Charge Control review, which may reduce the wholesale backhaul charges paid by
58 http://eur-lex.europa.eu/LexUriServ/LexUriServ.do?uri=OJ:L:2007:344:0065:0069:EN:PDF

A new pricing framework for Openreach
CPs offsetting pressure to increase retail prices (to the extent backhaul is purchased from BT).
A5.41 We considered that raising the charges would be in consumers’ interests even if retail prices were ultimately to rise somewhat as a result. This is because without such increases Openreach may have insufficient incentives to invest in and maintain the network and in the services which support CPs voice and broadband services. Without such incentives, the quality, and even availability, of services that consumers receive would gradually deteriorate.
A5.42 We recognised that any increase in the MPF charge may shrink the LLU footprint compared to what it might have been if prices remained at their current level. However, it would not be appropriate to encourage further roll-out if that roll-out is ultimately inefficient and unsustainable. We considered that it is not appropriate for Ofcom to be the arbiter of what constitutes the most appropriate level of roll-out that is in consumers’ interests. Rather, our intention is to set current charges and signal the likely direction of future price movements such that CPs can make decisions about whether to invest in further LLU. We believed that this is most appropriate in terms of furthering consumers’ interests.
Responses to the Second Consultation
A5.43 Talk Talk argued that it would be “shameful” for Ofcom to allow an increase in wholesale charges. This was because Openreach was already earning returns in excess of its cost of capital for the core rentals services as a whole, and was forecast to continue to do so for 2009/10 and 2010/11. Talk Talk also said that our proposals would lead to increases in customer bills of £30.
A5.44 Other responses also said that the increases would be passed on to consumers.
Conclusion
A5.45 We remain of the view that our decision will not result in a significant increase in consumers’ total bills. We certainly do not consider that they will involve an increase of £30 per annum as suggested by Talk Talk. For services supplied by MPF, the increase in wholesale charges is less than this, and is much less over the two years for which we are setting charges.
A5.46 Even though retail prices may be higher than they would otherwise be as a result of the changes we are making, we nevertheless consider that this is in consumers’ interests:
Raising the MPF charge reduces the differential between MPF and WLR+SMPF charges, a differential which is currently not based on costs and which we consider could distort competition. Reducing this distortion to competition is ultimately likely to result in a more efficient outcome which we believe will be in consumers’ interests.
If charges do not increase, then at some point Openreach will be unable to recover its total costs and will cease to have an incentive to invest and maintain the network. We consider that this would be detrimental to consumers as it would be likely to result in deterioration in quality of services. We consider that increasing charges gradually is more in line with how we have generally set charges previous and as such helps to ensure a stable and predictable regulatory. This should allow all CPs to make informed investment decisions and

A new pricing framework for Openreach
89
should give CPs confidence in the stability of the regulatory regime. We consider that this should help to ensure an efficient provision of services that is likely to be in consumers’ interests.
Phasing in changes also send a strong signal that we will adopt a gradual approach in the future and should lead to stronger cost minimisation incentives on Openreach which should tend to mean lower charges in the long run.
A5.47 We therefore consider that raising prices by means of glide paths, but with a larger initial increase in the MPF charge in the first year, is most in consumers’ interest. We therefore remain of the view that the third high level option above discussed above is preferable to the other two.
Impact on number of households taking broadband
A5.48 A number of responses to the Second Consultation said that as end user prices would increase, our proposals were contrary to the objectives of Digital Britain to increase take up of broadband. In particular, Talk Talk suggests that our proposals will result in a reduction in up to 1 million fewer households subscribing to broadband services by 2012/13.
A5.49 We consider the calculation behind this estimate (set out in Appendix D of Talk Talk’s response) to be unsound:
The calculation is based on assuming the retail price for broadband increases by 12 per cent. The 12 per cent is calculated from the increase in the MPF charge, making assumptions about how much is allocated to broadband and how much to line rental. However, MPF currently accounts for less than 15 per cent of broadband customers, though the share of MPF is expected to grow over time. The charge for the provision of broadband through SMPF will be largely unaltered and Virgin Media’s costs will be unchanged. To assume that all broadband charges increase with the MPF charge seems unlikely.
The 12 per cent increase is calculated assuming that half the MPF increase is allocated to broadband and half to line rental. This may not be realistic, as the fixed (line rental) charges typically represents a much bigger proportion of charges, and the increase may be weighted towards that element.
The MPF charge increases on which the 12 per cent is based have now reduced. If we were to use the same methodology, then retail broadband prices would increase by 5 per cent in 2010/11 (the last year for which we are setting charges) and 9 per cent in 2012/13.59
The 12 per cent (now 5 per cent at 2010/11 and 9 per cent in 2012/13) is a nominal price change. We think that it would be more appropriate to apply the elasticity to real prices changes.
59 We have used the methodology used by Dr Chris Doyle even though we do not accept it as being robust. We have assumed that the MPF charge increases to £97.62 in 2012/13 and that half of the increase is allocated to broadband, resulting in an increase of around 70p per month, which represents 9 per cent if the average charge is £7.50 per month. Similarly in 2010/11, the increase in the broadband price would be around 40p per month, which with the same methodology represents a 5 per cent increase.

A new pricing framework for Openreach
A5.50 Moreover, there are other changes are also happening to the cost of providing broadband that may tend to reduce prices:
There have recently been large reductions in the costs of backhaul from Openreach, and these prices will probably continue to fall in the next few years. Backhaul is a significant component of the cost of providing broadband by MPF and SMPF; and
There has been a trend for retail broadband prices to fall overtime, at a time when the wholesale inputs we are considering have been constant in nominal terms. The factors driving the retail broadband prices down (that are independent of our changes) may continue in the future.
A5.51 We think, therefore, that our decision will not have a significant impact on the current trends in broadband penetration. As is required by the Communications Act, we have had regard to the desirability of encouraging the availability and use of high speed data transfer services throughout the United Kingdom. We consider that setting the charges cover by this review to reflect efficiently incurred costs is consistent with this.
Impact on CPs using MPF
Our view in the Second Consultation
A5.52 We recognised in the Second Consultation that our proposals potentially had implications for the value of the investments of CPs using, or planning to use, MPF. However, given that we signalled our intention to review these charges at the time they were first set, CPs arguably would have anticipated that changes to the current structure of nominal charges would take place. Also, we said that we have sought to employ a methodology in determining the charge controls which is consistent with our previous practice. This approach should also give investors confidence in the predictability of the regulatory regime in the future.
A5.53 In the Second Consultation, we set out the likely impact of the options we considered on existing LLU investment using MPF. We did this by considering the percentage increase in total cost from our proposed charge increases.
A5.54 For the mid point of our proposals in the Second Consultation, we considered that total wholesale MPF costs would increase by around 2.2 per cent for a user of MPF. This is based on a total cost that includes MPF rental and connection charges, commingling charges, backhaul charges and the costs of the CP’s equipment installed in the exchanges, but excluding voice call costs and retailing costs. These are calculated by reference to the change in the PV of total costs. We assumed the investments were made half way through 2006/07, as investment made in that year represent a considerable proportion of total LLU investments. We assumed that a user of MPF supplies between 5 per cent and 10 per cent of the largest 1,100 exchanges are unbundled.
A5.55 We also considered the impact of Openreach’s recent reductions in BES charges. On the assumption that all backhaul is bought from Openreach, this reduces the net impact to around 1.4 per cent. We said that if the proposals in the leased lines charge control consultation were adopted, there would be even greater offsetting reductions. As not all backhaul is bought from Openreach, this will overstate the off setting impact of the BES reductions.

A new pricing framework for Openreach
91
A5.56 We said that while these increases in total cost shown above may look relatively modest, the effect on profitability may be far more significant. We noted that some CPs have stressed that margins on LLU investments are very tight. The impact on the profitability of LLU investment would depend not just on the impact of the cost increases but also on the extent to which revenue rises as a result of cost increases being passed through to the retail level. If WLR charges were also increasing, some increase in revenue may seem likely.
A5.57 We also noted that there are various simplifying assumptions in our analysis, such as the assumption that costs were amortised over 5 years with no terminal value.
Responses to the Second Consultation
A5.58 Openreach said its analysis suggested that charge controls at the higher end of Ofcom’s proposed price ranges or above would not unduly disrupt the market or specific customers, and the controls would not have a material negative impact on the margins of existing MPF investments or on the incentive to invest in the future. Openreach’s analysis indicates that the estimated pay-back period on a typical scale MPF based investment goes from 3 years and 10 months to 4 years and 1 month, an increase of 3 months.
A5.59 Talk Talk said that Openreach’s claim that the impact on existing MPF investment would be small was incorrect. Based on Ofcom’s high case, Talk Talk said that the “proposed MPF increases will reduce the IRR on an investment by up to 10 to 20 percentage points”. Moreover, Talk Talk said that the impact of the Ethernet price reductions would be an improvement in the internal rate of return of less than between one to three percentage points.
A5.60 Tiscali said that a rapid rise in the MPF charge would significantly affect LLU investment in the UK and that the business plans of competitive providers.
Conclusion on the impact on MPF users
A5.61 We have updated our modelling of the impact on total costs for MPF users to take account of our final decision on charges. We consider that the impact on the total costs (when expressed as a percentage of the total present value of costs from when the investment was first made) is likely to be of the order of 0.5 per cent to 2.5 per cent. But the results are sensitive to the particular assumptions made. While these percentages may seem relatively small, the impact on profitability could still be significant if margins are very tight, as some CPs have argued. The impact on profitability will also be greatly affected by the extent to which any increase in wholesale costs results in an increase in retail prices.
A5.62 Talk Talk provided us with the model it used to estimate the impact on its internal rate of return. This has allowed us to gain a greater understanding of the potential impact on the profitability of LLU investments that use MPF. The impact on Talk Talk is of particular interest because it has unbundled more exchanges than other operators and has by far the largest number of MPF lines currently, accounting for the large majority of MPF lines. The financial impact of our decision on Talk Talk will therefore be far larger than on any other LLU operator.
A5.63 Talk Talk’s estimate of a reduction of up to 10 to 20 percentage points on the internal rate of return was based on the high case in the Second Consultation. Our proposals are towards the low end of the range we proposed in the Second Consultation. We estimate that if we hold everything else constant in Talk Talk’s

A new pricing framework for Openreach
calculation, then reflecting our decision reduces the range to a 6 to 11 percentage point deterioration in the internal rate of return.
A5.64 This does not take account of the reduction in the Ethernet charges, which Talk Talk estimates as being worth a 1 to 3 percentage point improvement in the internal rate of return.
A5.65 We are not well placed to take a view on all the assumptions in Talk Talk’s model. But we have reservations about some aspects of the calculation:
The calculation is based over a 10 year period with a terminal value, but over that period there is no provision for any increase in revenue per consumer. In addition to the MPF charge increases we believe some increase in the WLR+SMPF charges is likely over this period. We believe that it may be more realistic to assume some consequential increase in retail revenue. In the results described below, we have assumed a consequential increase in retail revenue equal to some proportion of the increase assumed for WLR+SMPF.
The calculation appears to be based on LLU investment made in 2007/08. However, investments made in 2006/07 represent a considerable proportion of total LLU investments. The impact on internal rate of return for investments made a year earlier would be lower. In the results described below, we assume investments are made in 2006/07.
A5.66 Making adjustments for these factors (some increase in retail revenue and investment made in 2006/07), and including the same reduction in BES as assumed by Talk Talk, we have made our own calculations based on the model from Talk Talk. We estimate that the impact of our decision is most likely to reduce the internal rate of return on LLU investment by between 2 and 6 percentage points, compared to assuming constant nominal charges.
A5.67 This impact on LLU operators is a concern, and has been an input to our consideration of the appropriate price path. But our intention is not to guarantee the returns of LLU operators. Rather, we aim to provide a stable and predictable regulatory framework that allows operators to make informed judgements about investments. We consider that in adopting an approach consistent with our usual approach to setting charges we will best provide such a framework.

A new pricing framework for Openreach
93
Annex 6
6 Review of the financial evidence Introduction
A6.1 The Second Consultation set out our approach to the review of the financial evidence and our view on the costs of providing the regulated access services. Specifically, we set out:
Openreach’s forecast of the costs and revenues for the Core Rental Services;
our forecast of the costs and revenues for the Core Rental Services, prepared under two scenarios;
an explanation of the key differences between our forecasts and the Openreach forecast;
an explanation of our approach to projecting Openreach’s costs and revenues;
our views on the key assumptions to be taken into account in the cost projections; and
the implications of these assumptions on unit costs.
A6.2 We invited stakeholder’s views on our approach to the review of the financial evidence.
A6.3 Informed by the responses to the Second Consultation, this Annex sets out:
Our approach to determining the unit costs of the regulated services and why we are satisfied that this provides a robust basis for determining charges;
Our conclusions on the key assumptions that we have taken into account in our cost calculations; and
Our assessment of the unit costs of providing the regulated services.
A6.4 As set out in the Second Consultation, our assessment of the MPF costs is closely linked to our assessment of WLR costs. To inform stakeholders’ understanding of our financial analysis we, therefore, present our preliminary view on the cost information relating to the WLR services as well as the MPF services. We will be shortly publishing a consultation document setting out our proposals for WLR prices. To a significant extent, this will draw upon the analysis summarised in this Statement.
A6.5 In this Annex, we also consider stakeholders’ comments on the level of transparency provided in this consultation process. As explained below, we are satisfied that the level of disclosure during this consultation process has been adequate.
A new pricing framework for Openreach
Approach to cost calculations
A6.6 As explained in Annex 4, we have used Fully Allocated Current Cost Accounting principles as the most practical, appropriate basis for determining the cost of providing services.
A6.7 As explained in the Second Consultation, we consider that it is appropriate to use a four year period as the basis for the modelling of forward costs. We consider that the four year period allows us to take a medium term view of the impact of changes in costs, volume and efficiency levels.
A6.8 As explained in the Second Consultation, we consider that it was appropriate to use cost estimates provided by Openreach at our request as the starting point for our own financial analysis.
A6.9 In the Second Consultation, we
Set out Openreach’s cost estimates at an aggregate and unit cost level;
Described Openreach’s approach to the estimate of its costs, which includes the calculation of its costs 2007/08 and projected cost estimates to 2012/13;
Set out the key assumptions made by Openreach to project future costs;
Demonstrated that the base year costs are consistent with audited financial data;
Provided Openreach’s explanations for the main movements in its cost estimates between 2008/09 and 2012/13; and
Explained the main differences between Openreach’s cost estimates set out in the First Consultation and its updated estimates.
A6.10 Several respondents challenged this approach.
A6.11 For example, Talk Talk argued that we should not use data derived from a cost model that has not been audited. Specifically, Talk Talk noted that
“This model has not been audited by any external firm. It is worthy of note in this respect that the European Commission recently suggested to AGCOM in Italy that it did not reset LLU charges until it had audited cost data available
We note that in the current leased line consultation, Ofcom engaged consultants to provide an ‘independent review’ of Ofcom’s model and also provide a strong assurance opinion. No such review was undertaken in this consultation”.
A6.12 We explained in the Second Consultation why we considered that Openreach’s cost projections are based on a logically sound approach and provided a sensible basis for the modelling of future costs and have used Openreach’s model to inform our estimate of unit costs. Specifically, we:
Obtained, on a confidential basis, functional versions of these models;
A new pricing framework for Openreach
95
Spent significant time with Openreach and its consultants to ensure that we fully understand the mechanics of the model;
Reviewed model user manuals and obtained thorough explanations of key aspects;
Tested the interaction of volumes, task times, FTE assumptions, average salaries, fault rates and visit ratios to ensure the models produced predictable outputs that could be understood;
Reviewed the allocation basis, to ensure that they are reasonable and are applied as described;
Reconciled the base year forecasts back to audited financial data;
Ensured that all movements in costs during the period could be explained by simple analysis based on an understanding of future changes in demand and cost behaviour;
Prepared our own estimates of future costs on a CCA FAC basis, by rolling forward audited financial data from the 2008 current cost financial statements and ensured that the outputs from Openreach’s model were consistent with these estimates.
A6.13 We do not consider that the circumstances relating to AGCOM are comparable. In the AGCOM example, the Commission invited the regulator to wait until it had audited 2006 data before it set new prices in 2009. As explained in the Second Consultation, our calculations are based on data reconciled back to audited 2008 data.
A6.14 Talk Talk also dispute the value of the reconciliation from the cost model to the regulatory accounts, as follows:
“Ofcom have presented a comparison of the Regulatory Accounts (which are audited) and the Cost Model for 07/08. However, the differences (which are significant) between the Regulatory Accounts and the Cost Model have not been accurately explained by Ofcom, and are not, we believe, properly understood by Ofcom and have in no way been audited by an independent auditor. Thus this comparison cannot infer any form of assurance or audit on the cost model”.
A6.15 We do not accept that the reconciliation does not provide any form of assurance on the cost model. Indeed, we consider that the fact that the cost model can be reconciled to the audited financial data provides a considerable amount of assurance on the model (more, in our opinion, than a third-party review of the functionality of the model). However, for completeness, we have provided a more extensive reconciliation of the cost model to the accounts at the end of this Annex.
A6.16 Talk Talk have also argued that the model does not provide a reasonable basis because it excludes costs and revenues from Northern Ireland.
A6.17 Openreach’s geographic cover, as defined by the undertakings, does not extend to Northern Ireland. Therefore all volumes, revenues, costs and assets provided by Openreach exclude Northern Ireland.
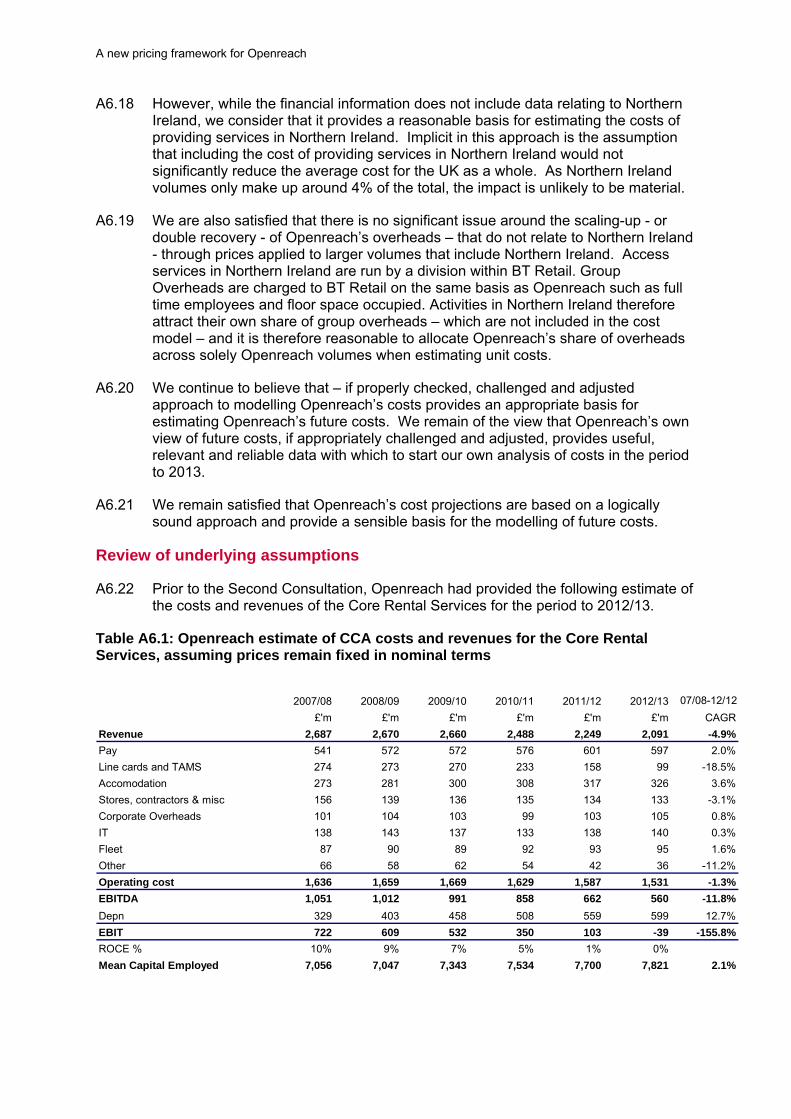
A new pricing framework for Openreach
A6.18 However, while the financial information does not include data relating to Northern Ireland, we consider that it provides a reasonable basis for estimating the costs of providing services in Northern Ireland. Implicit in this approach is the assumption that including the cost of providing services in Northern Ireland would not significantly reduce the average cost for the UK as a whole. As Northern Ireland volumes only make up around 4% of the total, the impact is unlikely to be material.
A6.19 We are also satisfied that there is no significant issue around the scaling-up - or double recovery - of Openreach’s overheads – that do not relate to Northern Ireland - through prices applied to larger volumes that include Northern Ireland. Access services in Northern Ireland are run by a division within BT Retail. Group Overheads are charged to BT Retail on the same basis as Openreach such as full time employees and floor space occupied. Activities in Northern Ireland therefore attract their own share of group overheads – which are not included in the cost model – and it is therefore reasonable to allocate Openreach’s share of overheads across solely Openreach volumes when estimating unit costs.
A6.20 We continue to believe that – if properly checked, challenged and adjusted approach to modelling Openreach’s costs provides an appropriate basis for estimating Openreach’s future costs. We remain of the view that Openreach’s own view of future costs, if appropriately challenged and adjusted, provides useful, relevant and reliable data with which to start our own analysis of costs in the period to 2013.
A6.21 We remain satisfied that Openreach’s cost projections are based on a logically sound approach and provide a sensible basis for the modelling of future costs.
Review of underlying assumptions
A6.22 Prior to the Second Consultation, Openreach had provided the following estimate of the costs and revenues of the Core Rental Services for the period to 2012/13.
Table A6.1: Openreach estimate of CCA costs and revenues for the Core Rental Services, assuming prices remain fixed in nominal terms
2007/08 2008/09 2009/10 2010/11 2011/12 2012/13 07/08-12/12
£'m £'m £'m £'m £'m £'m CAGR
Revenue 2,687 2,670 2,660 2,488 2,249 2,091 -4.9%
Pay 541 572 572 576 601 597 2.0%
Line cards and TAMS 274 273 270 233 158 99 -18.5%
Accomodation 273 281 300 308 317 326 3.6%
Stores, contractors & misc 156 139 136 135 134 133 -3.1%
Corporate Overheads 101 104 103 99 103 105 0.8%
IT 138 143 137 133 138 140 0.3%
Fleet 87 90 89 92 93 95 1.6%
Other 66 58 62 54 42 36 -11.2%
Operating cost 1,636 1,659 1,669 1,629 1,587 1,531 -1.3%
EBITDA 1,051 1,012 991 858 662 560 -11.8%
Depn 329 403 458 508 559 599 12.7%
EBIT 722 609 532 350 103 -39 -155.8%
ROCE % 10% 9% 7% 5% 1% 0%
Mean Capital Employed 7,056 7,047 7,343 7,534 7,700 7,821 2.1%
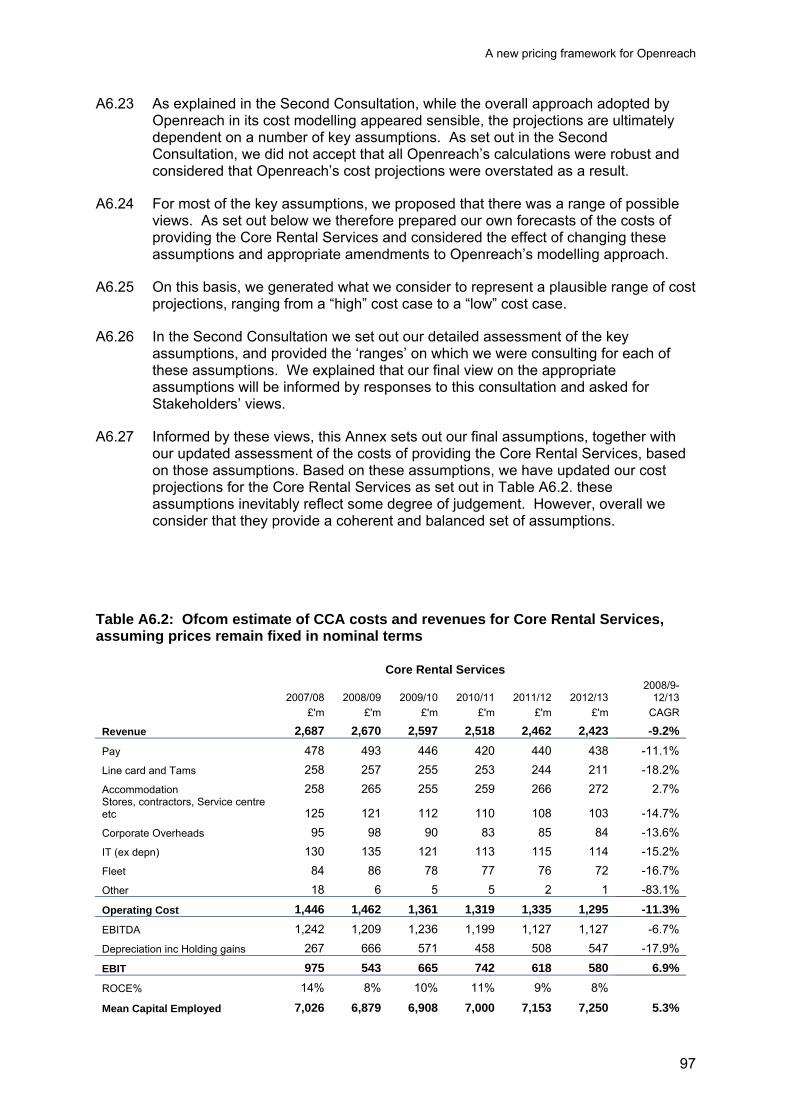
A new pricing framework for Openreach
97
A6.23 As explained in the Second Consultation, while the overall approach adopted by Openreach in its cost modelling appeared sensible, the projections are ultimately dependent on a number of key assumptions. As set out in the Second Consultation, we did not accept that all Openreach’s calculations were robust and considered that Openreach’s cost projections were overstated as a result.
A6.24 For most of the key assumptions, we proposed that there was a range of possible views. As set out below we therefore prepared our own forecasts of the costs of providing the Core Rental Services and considered the effect of changing these assumptions and appropriate amendments to Openreach’s modelling approach.
A6.25 On this basis, we generated what we consider to represent a plausible range of cost projections, ranging from a “high” cost case to a “low” cost case.
A6.26 In the Second Consultation we set out our detailed assessment of the key assumptions, and provided the ‘ranges’ on which we were consulting for each of these assumptions. We explained that our final view on the appropriate assumptions will be informed by responses to this consultation and asked for Stakeholders’ views.
A6.27 Informed by these views, this Annex sets out our final assumptions, together with our updated assessment of the costs of providing the Core Rental Services, based on those assumptions. Based on these assumptions, we have updated our cost projections for the Core Rental Services as set out in Table A6.2. these assumptions inevitably reflect some degree of judgement. However, overall we consider that they provide a coherent and balanced set of assumptions.
Table A6.2: Ofcom estimate of CCA costs and revenues for Core Rental Services, assuming prices remain fixed in nominal terms
Core Rental Services
2007/08 2008/09 2009/10 2010/11 2011/12 2012/13 2008/9-
12/13
£'m £'m £'m £'m £'m £'m CAGR
Revenue 2,687 2,670 2,597 2,518 2,462 2,423 -9.2%
Pay 478 493 446 420 440 438 -11.1%
Line card and Tams 258 257 255 253 244 211 -18.2%
Accommodation 258 265 255 259 266 272 2.7% Stores, contractors, Service centre etc 125 121 112 110 108 103 -14.7%
Corporate Overheads 95 98 90 83 85 84 -13.6%
IT (ex depn) 130 135 121 113 115 114 -15.2%
Fleet 84 86 78 77 76 72 -16.7%
Other 18 6 5 5 2 1 -83.1%
Operating Cost 1,446 1,462 1,361 1,319 1,335 1,295 -11.3%
EBITDA 1,242 1,209 1,236 1,199 1,127 1,127 -6.7%
Depreciation inc Holding gains 267 666 571 458 508 547 -17.9%
EBIT 975 543 665 742 618 580 6.9%
ROCE% 14% 8% 10% 11% 9% 8%
Mean Capital Employed 7,026 6,879 6,908 7,000 7,153 7,250 5.3%
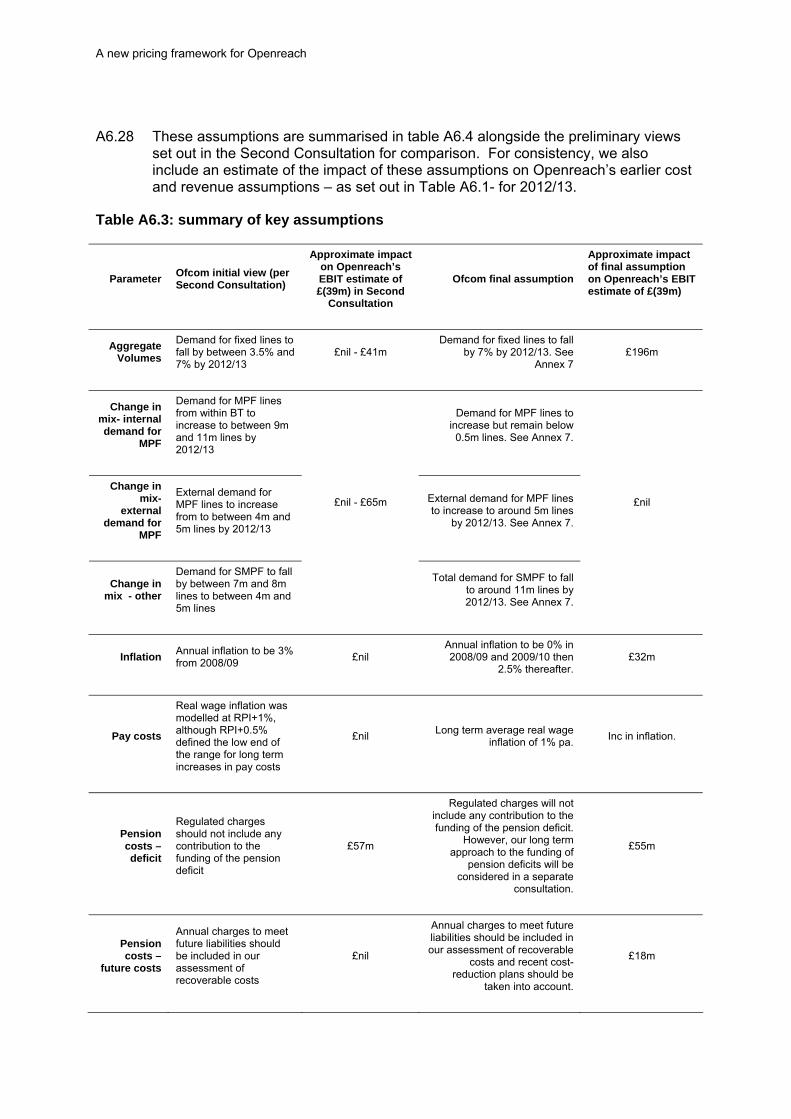
A new pricing framework for Openreach
A6.28 These assumptions are summarised in table A6.4 alongside the preliminary views set out in the Second Consultation for comparison. For consistency, we also include an estimate of the impact of these assumptions on Openreach’s earlier cost and revenue assumptions – as set out in Table A6.1- for 2012/13.
Table A6.3: summary of key assumptions
Parameter Ofcom initial view (per Second Consultation)
Approximate impact on Openreach’s EBIT estimate of £(39m) in Second
Consultation
Ofcom final assumption
Approximate impact of final assumption on Openreach’s EBIT estimate of £(39m)
Aggregate Volumes
Demand for fixed lines to fall by between 3.5% and 7% by 2012/13
£nil - £41m Demand for fixed lines to fall
by 7% by 2012/13. See Annex 7
£196m
Change in mix- internal demand for
MPF
Demand for MPF lines from within BT to increase to between 9m and 11m lines by 2012/13
Demand for MPF lines to increase but remain below
0.5m lines. See Annex 7.
Change in mix-
external demand for
MPF
External demand for MPF lines to increase from to between 4m and 5m lines by 2012/13
External demand for MPF lines to increase to around 5m lines
by 2012/13. See Annex 7.
Change in mix - other
Demand for SMPF to fall by between 7m and 8m lines to between 4m and 5m lines
£nil - £65m
Total demand for SMPF to fall to around 11m lines by 2012/13. See Annex 7.
£nil
Inflation Annual inflation to be 3% from 2008/09
£nil Annual inflation to be 0% in 2008/09 and 2009/10 then
2.5% thereafter. £32m
Pay costs
Real wage inflation was modelled at RPI+1%, although RPI+0.5% defined the low end of the range for long term increases in pay costs
£nil Long term average real wage
inflation of 1% pa. Inc in inflation.
Pension costs –deficit
Regulated charges should not include any contribution to the funding of the pension deficit
£57m
Regulated charges will not include any contribution to the funding of the pension deficit.
However, our long term approach to the funding of
pension deficits will be considered in a separate
consultation.
£55m
Pension costs –
future costs
Annual charges to meet future liabilities should be included in our assessment of recoverable costs
£nil
Annual charges to meet future liabilities should be included in our assessment of recoverable
costs and recent cost-reduction plans should be
taken into account.
£18m

A new pricing framework for Openreach
99
Energy costs
No adjustment proposed but we will revisit the long term assumption in our final assessment
£nil
Recent falls in energy costs must be taken into account,
but we accept that actual costs based on forward looking contracts effected prior to
2009/10 should be recovered.
£3m
Commodity prices
Under a CCA approach to setting prices, assets are valued by reference to the cost of replacing the asset at today’s prices
£nil
Assets are valued by reference to the cost of replacing the
asset at today’s prices. Recent falls in copper prices must be taken into account.
£29m
Scope for efficiency
gains
Annual efficiency gains of between 2% and 4% (excluding fault rates) on compressible costs
£36m -£103m
Efficiency gains of 4% in 2009/10 (excluding fault rates)
on compressible costs and declining thereafter. See
Annex 9.
£65m
Reduction in fault rates
Fault rates to fall by between 4% and 6% each year
£43m - £59m Fault rates to fall by 2% in
2009/10 and declining thereafter. See Annex 9.
£26m
Cost allocation
Some reallocation of costs to unregulated services may be appropriate
£49m - £98m
Costs of £88m should be reallocated away from the
Core Rental Services in 2009/10.
£88m
Group Costs
Other than the specific exceptions noted elsewhere, no adjustment to Group costs is proposed
£nil
Other than the specific exceptions noted elsewhere,
no adjustment to Group costs is necessary
£nil
Line cards Openreach’s estimate of costs per line appears reasonable
£nil Openreach’s estimate of costs
per line appears reasonable £nil
SLG payments
Openreach should recover efficiently incurred costs. Our estimate is lower than Openreach’s.
£4m
Openreach should recover efficiently incurred costs. Our
estimate is lower than Openreach’s.
£4m
Light User Scheme
The cost of the LUS should not be recovered through the regulated services, with the possible exception of the administration costs
£32m-£42m
None of the cost of the LUS should not be recovered
through the regulated services, including administration costs
£40m
Regulatory Asset Value
(“RAV”)
Openreach’s assessment of the RAV adjustment appears reasonable
£nil Openreach’s assessment of
the RAV adjustment appears reasonable
£nil
Dropwire costs
A proportion of capital costs relating to residential dropwires installed between 2000/01 and 2004/05 should be excluded.
£42m - £44m
To be consistent with our previous approach, a
proportion of capital costs relating to residential dropwires installed between 2000/01 and
2004/05 should be excluded.
£44m

A new pricing framework for Openreach
Line length adjustment
Openreach’s approach provides a reasonable basis for determining the line length adjustment. No further adjustment is proposed.
£nil
Openreach’s approach provides a reasonable basis for
determining the line length adjustment. No further
adjustment is proposed.
£nil
Cumulo Rates
£nil Openreach is expected to see its Cumulo rates bill fall as the
volume of copper lines falls. £19m
Cost of Capital
9.25% to 10.75% £nil (see below) 10.1%, assuming inflation of
2.5% £nil
Restated EBIT in 2012/13
£224m - £497m £580m
A6.29 Note that our view on the cost of capital impacts on the recoverable cost but has no impact on the forecast costs and revenues of the business.
A6.30 These assumptions are considered in more detail below
Total demand for fixed lines
Impact on costs
A6.31 The existence of fixed costs means that unit costs will increase if volumes fall,
because fixed costs must be recovered over fewer lines.
What did we say in the Second Consultation? A6.32 In the Second Consultation Document, we explained that the total number of fixed
lines fell in the five years to 2006, followed by a small increase in 2007, due to increased business demand.
A6.33 Demand for residential lines supplied through BT’s network continues to follow a downwards trend. The reduction is due to:
An increase in mobile only households (the current number of households with a fixed line is now between 86-88%);
Increased competition from cable; and
Reduced demand for second lines as a result of broadband take -up.
A6.34 We explained that we expected demand for fixed lines will continue to fall over time. However, the rate of decline will depend on several factors including the extent of mobile substitution, economic conditions (such as the number of new homes and house moves) and the effectiveness of competition from cable in the future.
A6.35 As explained in more detail in Annex 7, we concluded in the Second Consultation that demand for fixed lines would fall by between 3.5% and 7.0% by 2012/13.

A new pricing framework for Openreach
101
Responses to the Second Consultation
A6.36 As set out in more detail in Annex 7 there was considerable variation in the views of
stakeholders as to the likely decline in the future demand for fixed lines. However, as set out in the Annex, recent evidence on demand supports a position at the upper end of the range for the rate of decline.
Conclusion
A6.37 Accordingly, as set out in more detail in Annex 7, we will be using an estimate of a
7% drop in line numbers as the basis of our four year forecast.
Changes to mix of demand
Impact on costs
A6.38 A shift in demand, from WLR (which makes a relatively high per-unit contribution to
fixed costs) to MPF (which makes a lower contribution), puts further pressure on charges if the total contribution to fixed costs is to be maintained. A reduction in demand for SMPF (which makes a positive contribution to fixed overheads) puts additional upward pressure on unit costs of all services, if the total contribution to fixed costs is to be maintained.
What did we say in the Second Consultation?
A6.39 As set out in our Second Consultation, we suggested that estimates for MPF growth
were potentially too high given the uncertainty linked to BT NGN programme and back-loading of growth for other CPs.
Responses to the Second Consultation
A6.40 Several respondents noted that BT had suspended its programme of NGN related
new services which would have used MPF and noting the risks of over-estimating MPF demand. Openreach agreed that their estimate for substantial increases in MPF internal demand was now no longer appropriate but did suggest that external CP demand for MPF was likely to be higher than originally forecast given some other CP commitments to a movement to MPF.
Conclusion
A6.41 As set out in the Annex, we have now removed much of the internal MPF growth in
line with BT’s own forecasts. We accept Openreach’s argument that demand for MPF is now more certain but note that there is little evidence to suggest that overall demand will be at the level they now propose. For the reasons set out in Annex 7, we have assumed that external demand for MPF will increase to 5.0M by the end of the period.
Inflation - general
Impact on costs
A6.42 To forecast costs, it is necessary to take a view on the extent to which input costs
will increase in the future. This is difficult to do with certainty. In its May 2009

A new pricing framework for Openreach
inflation report, the Bank of England noted that the outlook for inflation remains extremely uncertain.
A6.43 As illustrated by Table A6.5, the cost projections set out in the Second Consultation, applied a 3% inflation assumption to around 40% of its operating costs, with 30% of operating costs not being subject to any inflation in Openreach’s model. These were generally cost of sales, IS spend and certain regulatory costs such as SLG payments. The 3% inflation assumption was based on a long term view of changes in the RPI.
Table A6.4: Openreach’s inflation assumptions
Cost Description RPI +1% RPI = 3% 0%
Pay
Current Pay – All √
Agency Pay – All √
Leavers Payments √ Pension Deficit Contribution √
Labour related
Stores and Other Opex costs √
Fleet √
Cost of Sales
Line Cards and BNS √
Electronic and Other √
Accommodation
Rent √
Cumulo rates √
Faculties management √
Corporate Overheads √
IT
IS Support √
IS Development Opex √
Other income and Operating Costs
Repayments and Wayleaves √
Other Operating Income √
LUS and SLG √
Capex
Network Related √ Line test and Other √
What did we say in the Second Consultation? A6.44 We explained that we considered that:
The general rate of inflation of 3% reflected in the cost modelling was below the rates of RPI and CPI inflation (both around 5%) at the time but was above the Bank of England target for CPI inflation;
A new pricing framework for Openreach
103
In the long run, inflation was expected to fall back towards the Bank of England’s target of 2.5%; therefore in the long run 3% did not look unreasonable;
In the short term, RPI forecasts were fairly volatile and we might need to revisit this assumption;
The categories that were not subject to inflationary increases in the cost forecasts appeared reasonable.
Responses to the Second Consultation
A6.45 One respondent suggested that general price inflation is arguably irrelevant given
the position of RPI in the proposed price structure. However, as noted below, this may not hold for the purposes of these charges.
A6.46 Several other respondents argued that the conclusions in the Second Consultation should be revisited. Tiscali noted that “inflation is now close to zero by certain measures with a risk of deflation to come”. Openreach noted that “We are now entering an extraordinary economic period in which the RPI index may become negative”.
A6.47 Talk Talk noted that, in January, the RPI inflation rate was 0.1%. Openreach noted that it has taken
“a more considered view of the appropriate assumption to use over a reasonable period of probably 4 or more years so as to avoid the impacts of market volatility of the current estimates for RPI and the effects of significantly lowering RPI assumptions. Accordingly, for our modelling assumptions, Openreach is using an average RPI of circa 2% per annum”.
A6.48 We have therefore reviewed out inflation assumptions.
A6.49 Historically, we have used RPI as a reasonable basis for forecasting cost inflation. This has the advantage of being reasonably well understood and widely forecast. While there is unlikely to be a perfect correlation between the general rate of inflation – as indicated by RPI – and a company’s actual rate of inflation, it has nevertheless been considered to provide a reasonable proxy. .
A6.50 While the use of RPI as the basis for forecasting cost inflation may remain valid in the longer term, it may be less appropriate in the short term as the cost movements taken into account to determine RPI do not currently provide an appropriate proxy for short term movements in Openreach’s costs. Specifically, the current RPI inflation statistic is depressed by two factors which do not have any direct impact on Openreach’s costs: the significant recent falls in mortgage interest and the VAT reduction in December 2008. Openreach’s input cost inflation will therefore be higher than RPI inflation next year.
A6.51 According to the April 2009 edition of HM Treasury’s Forecasts for the UK Economy (which collates a range of independent forecasts for various economic indicators), recent forecasts for RPI in 2009 range from -3.3% to +1.0%. The average forecasts for RPI, RPI X – which does not include mortgage interest but is affected by indirect taxes – and CPI, as set out in the April forecasts are as follows:
A new pricing framework for Openreach
2009 2010RPI -1.6% 2.4%RPIX 0.5% 1.9%CPI 0.7% 1.6%Source: HM Treasury Forecasts for the UK Economy, April 2009
A6.52 HM Treasury’s February 2009 paper includes longer term projections for RPI. The average of projections for RPI was 3.0% in 2011 and 2012 and 2.8% for 2013.
A6.53 The CBI’s Economic and Business Outlook, published in April, also includes forecasts for inflation for 2009 and 2010,as follows:
2009 2010RPI -0.9% 2.6%RPIX 1.1% 1.9%CPI 1.6% 1.6%
Source: CBI Economic & Business Forecast, April 2009
A6.54 The CBI’s forecasts indicate that inflation will be increasing that report the average forecasts for RPIX inflation were 0.2% in 2009 and 2.0% in 2010. Longer term inflation assumptions project further increases in inflation.
Conclusion
A6.55 Taking these sources into account, for the purposes of our cost modelling we have
assumed that Openreach’s costs will be subject to annual inflation as set out in the table below:
2009/10 2010/11 2011/12 2012/13
Assumed rate of inflation for Openreach 0.0% 2.5% 2.5% 2.5%
A6.56 We note that this assumption is equivalent to an average annual inflation assumption of around 1.8% over the four years and is therefore just below Openreach’s estimate.
A6.57 As explained in Section 7, for the purposes of determining the charge control in 2010/11, we must predict the reported level of RPI for October 2009. The CBI’s April report forecasts RPI of -1.9% for the third quarter of 2009 and -0.3% for the fourth. On this basis, we have assumed that RPI at October 2009 will be approximately -1.5%.
Inflation – pay costs
Impact on costs
A6.58 Pay costs represent around a third of Openreach’s operating costs. Inflation on pay
therefore increases operating costs. Pay inflation also flows into the calculation of holding gains, which – in light of the mix of pay and non-pay costs reflected in the asset base – have been calculated based on the average of pay and non-pay inflation rates. Therefore, inflation on pay also increases holding gains (which in turn reduces unit costs). Holding gains impact on a larger number than pay inflation. In the short term, higher rates of pay inflation therefore reduce unit costs.
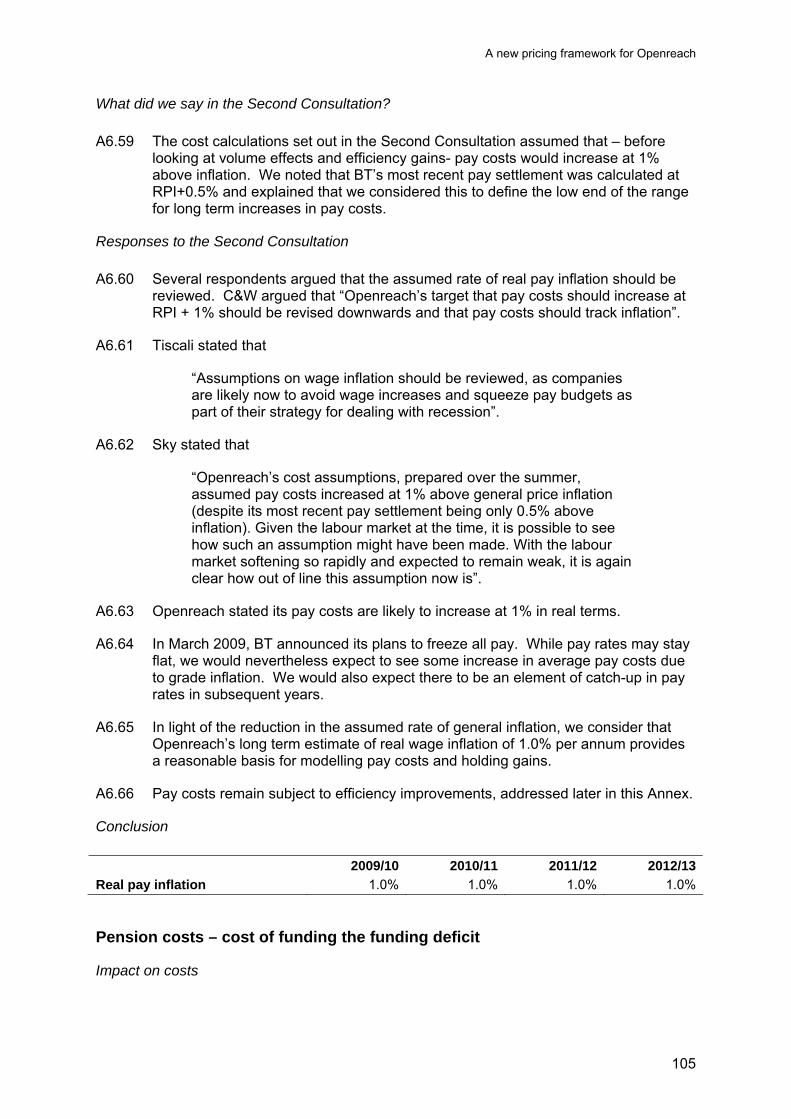
A new pricing framework for Openreach
105
What did we say in the Second Consultation?
A6.59 The cost calculations set out in the Second Consultation assumed that – before
looking at volume effects and efficiency gains- pay costs would increase at 1% above inflation. We noted that BT’s most recent pay settlement was calculated at RPI+0.5% and explained that we considered this to define the low end of the range for long term increases in pay costs.
Responses to the Second Consultation
A6.60 Several respondents argued that the assumed rate of real pay inflation should be
reviewed. C&W argued that “Openreach’s target that pay costs should increase at RPI + 1% should be revised downwards and that pay costs should track inflation”.
A6.61 Tiscali stated that
“Assumptions on wage inflation should be reviewed, as companies are likely now to avoid wage increases and squeeze pay budgets as part of their strategy for dealing with recession”.
A6.62 Sky stated that
“Openreach’s cost assumptions, prepared over the summer, assumed pay costs increased at 1% above general price inflation (despite its most recent pay settlement being only 0.5% above inflation). Given the labour market at the time, it is possible to see how such an assumption might have been made. With the labour market softening so rapidly and expected to remain weak, it is again clear how out of line this assumption now is”.
A6.63 Openreach stated its pay costs are likely to increase at 1% in real terms.
A6.64 In March 2009, BT announced its plans to freeze all pay. While pay rates may stay flat, we would nevertheless expect to see some increase in average pay costs due to grade inflation. We would also expect there to be an element of catch-up in pay rates in subsequent years.
A6.65 In light of the reduction in the assumed rate of general inflation, we consider that Openreach’s long term estimate of real wage inflation of 1.0% per annum provides a reasonable basis for modelling pay costs and holding gains.
A6.66 Pay costs remain subject to efficiency improvements, addressed later in this Annex.
Conclusion
2009/10 2010/11 2011/12 2012/13
Real pay inflation 1.0% 1.0% 1.0% 1.0%
Pension costs – cost of funding the funding deficit
Impact on costs

A new pricing framework for Openreach
A6.67 Openreach’s cost forecast includes BT’s assessment of Openreach’s share (34%) of £280 million of additional annual payments to address a funding shortfall in BT’s pension scheme. Of Openreach’s share of the costs, £57 million was allocated to the Core Rental Services.
What did we say in the Second Consultation? A6.68 In the context of a forward looking price control we believe these costs should be
excluded. Our cost assessment should therefore only include the annual charge to meet future liabilities of members of the defined benefits scheme. We therefore proposed that the costs of £57 million should be excluded from our analysis.
Responses to the Second Consultation
A6.69 Most stakeholders – other than Openreach - argued that payments to cover the
pension funding shortfall should be excluded.
A6.70 Talk Talk, C&W, Vodafone agreed that payments to cover the pension funding shortfall should be excluded as they do not relate to the forward looking provision of Openreach services. Some stakeholders also noted the need for symmetry of approach. Talk Talk and Vodafone both suggested that prices would not be expected to fall during periods of surplus.
A6.71 Openreach argued that
“…the cost of servicing this deficit – which will be likely to increase in the near future- can only be paid out of current and future cash flow and therefore represent current and forward looking costs that Openreach will be required to incur”
A6.72 Openreach also argued that Ofcom is out of step with the practice of other regulators. To support its case, Openreach provided a report prepared by Messrs Decker, Jones and Yarrow. The four main conclusions are set out in Section 6 of the report, as follows:
Ofcom has thus far engaged in only limited public consultation or discussion regarding the treatment of pensions costs…we think it would be useful if, as has occurred in other sectors, Ofcom engaged in more detailed consideration of and consultation on the relevant matters, the better to contribute to progress on a common/shared problem.
Ofcom’s substantive approach to this issue appears, on the face of it, to be at odds with the approach taken by other regulators. This is particularly so in respect of its contention that all risk associated with pension costs should be borne by the company. While this is in itself not necessarily a cause for concern, since circumstances between sectors may differ in ways that call for different approaches, it would at least be comforting to know that there is a reasonable basis for the difference. This too points the desirability of some further investigation, consultation and explanation.
Ofcom’s approach to deriving forward looking pension costs appears to consider only one aspect of the economic costs of defined benefits pension schemes, namely the expected value of those

A new pricing framework for Openreach
107
costs, and it appears to neglect costs associated with risk … it would be helpful for Ofcom to give a fuller account of how forward looking pension funding risk is handled in the costings.
Given the above issues we see significant benefits in Ofcom engaging in some further thinking on this issue and in setting out more clearly its “pensions principles”, to serve as the basis for further consultation and analysis in this area
A6.73 Informed by this report, Openreach concludes that:
“We consider that there is no good reason for Ofcom to depart from the precedents and best practices of other regulators in terms of adequately addressing the pensions deficit costs problem. At a minimum, this suggests that Ofcom ought to have set out more clearly its principles relating to the recovery of pensions deficits costs.”
A6.74 We do not consider that Openreach has provided a positive case for including the costs of funding the deficit. The basis for Openreach’s position appears to be primarily the need for consistency with the decisions made by other regulators, yet Openreach does not explain why these precedents are relevant to the treatment of its own pension costs. Indeed, as noted above, its consultants noted in their report that adopting a different approach from that taken by other regulators is “in itself not necessarily a cause for concern, since circumstances between sectors may differ in ways that call for different approaches”.
A6.75 We consider that consistency – or the reason for apparent inconsistency – with other regulators’ decisions is of interest in a discussion of the treatment of pension deficit costs. However, of more relevance is the approach taken to similar situations in the past by the same regulator. We have not seen any examples of previous decisions taken by Ofcom or Oftel where prices were increased to reflect payments to fund a deficit or decreased when the fund was in surplus and payments were reduced. In this respect, Openreach’s response is silent. We consider that our approach to the cost of funding the deficit is consistent with previous pricing decisions.
A6.76 On this basis, we have concluded that there is no reason at this stage to move away from our proposal to exclude all the costs of funding the pension deficit on the basis that they do not represent forward looking costs.
A6.77 However, while Openreach’s response provides no compelling reason to include the costs of funding the pension deficit, we consider that it illustrates the need for detailed consideration of and consultation on the relevant matters to inform future regulatory decisions. On this basis, we propose consulting on whether this approach is likely to remain the appropriate treatment of pension liabilities in the longer term, later this year.
Conclusion
A6.78 These costs should be excluded. Our cost assessment should therefore only
include the annual charge to meet future liabilities of members of the defined benefits scheme.
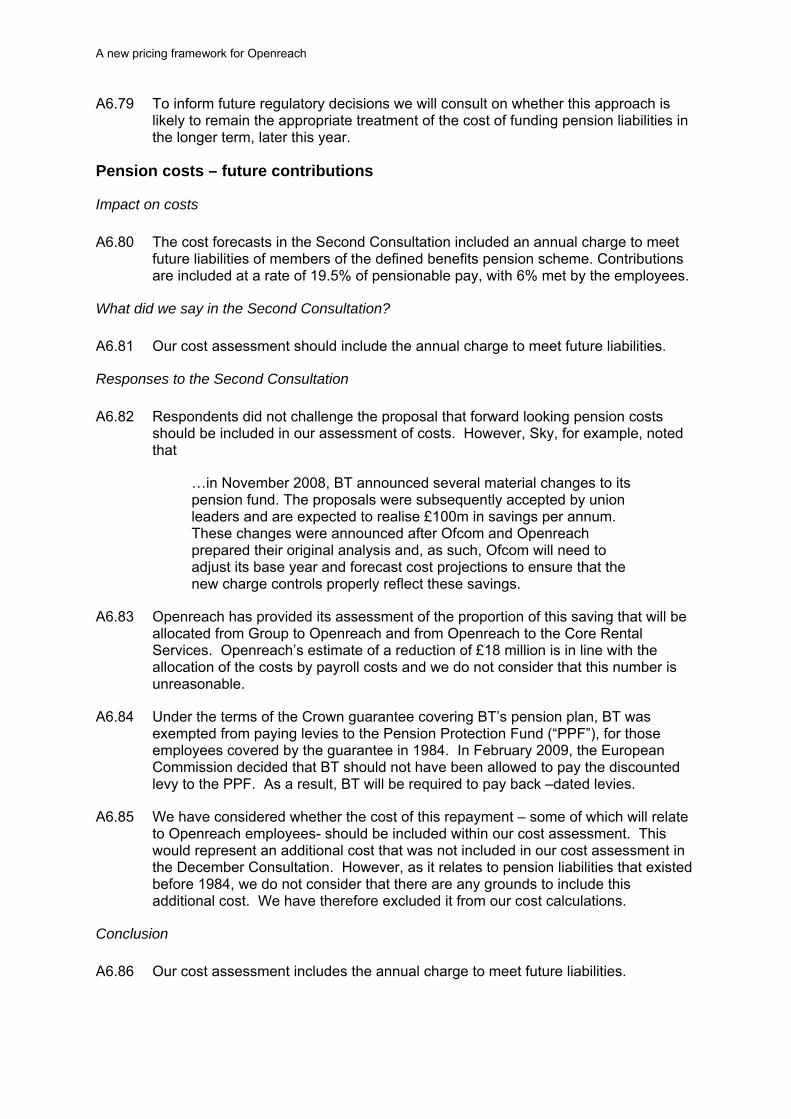
A new pricing framework for Openreach
A6.79 To inform future regulatory decisions we will consult on whether this approach is likely to remain the appropriate treatment of the cost of funding pension liabilities in the longer term, later this year.
Pension costs – future contributions
Impact on costs
A6.80 The cost forecasts in the Second Consultation included an annual charge to meet
future liabilities of members of the defined benefits pension scheme. Contributions are included at a rate of 19.5% of pensionable pay, with 6% met by the employees.
What did we say in the Second Consultation?
A6.81 Our cost assessment should include the annual charge to meet future liabilities.
Responses to the Second Consultation
A6.82 Respondents did not challenge the proposal that forward looking pension costs
should be included in our assessment of costs. However, Sky, for example, noted that
…in November 2008, BT announced several material changes to its pension fund. The proposals were subsequently accepted by union leaders and are expected to realise £100m in savings per annum. These changes were announced after Ofcom and Openreach prepared their original analysis and, as such, Ofcom will need to adjust its base year and forecast cost projections to ensure that the new charge controls properly reflect these savings.
A6.83 Openreach has provided its assessment of the proportion of this saving that will be allocated from Group to Openreach and from Openreach to the Core Rental Services. Openreach’s estimate of a reduction of £18 million is in line with the allocation of the costs by payroll costs and we do not consider that this number is unreasonable.
A6.84 Under the terms of the Crown guarantee covering BT’s pension plan, BT was exempted from paying levies to the Pension Protection Fund (“PPF”), for those employees covered by the guarantee in 1984. In February 2009, the European Commission decided that BT should not have been allowed to pay the discounted levy to the PPF. As a result, BT will be required to pay back –dated levies.
A6.85 We have considered whether the cost of this repayment – some of which will relate to Openreach employees- should be included within our cost assessment. This would represent an additional cost that was not included in our cost assessment in the December Consultation. However, as it relates to pension liabilities that existed before 1984, we do not consider that there are any grounds to include this additional cost. We have therefore excluded it from our cost calculations.
Conclusion
A6.86 Our cost assessment includes the annual charge to meet future liabilities.
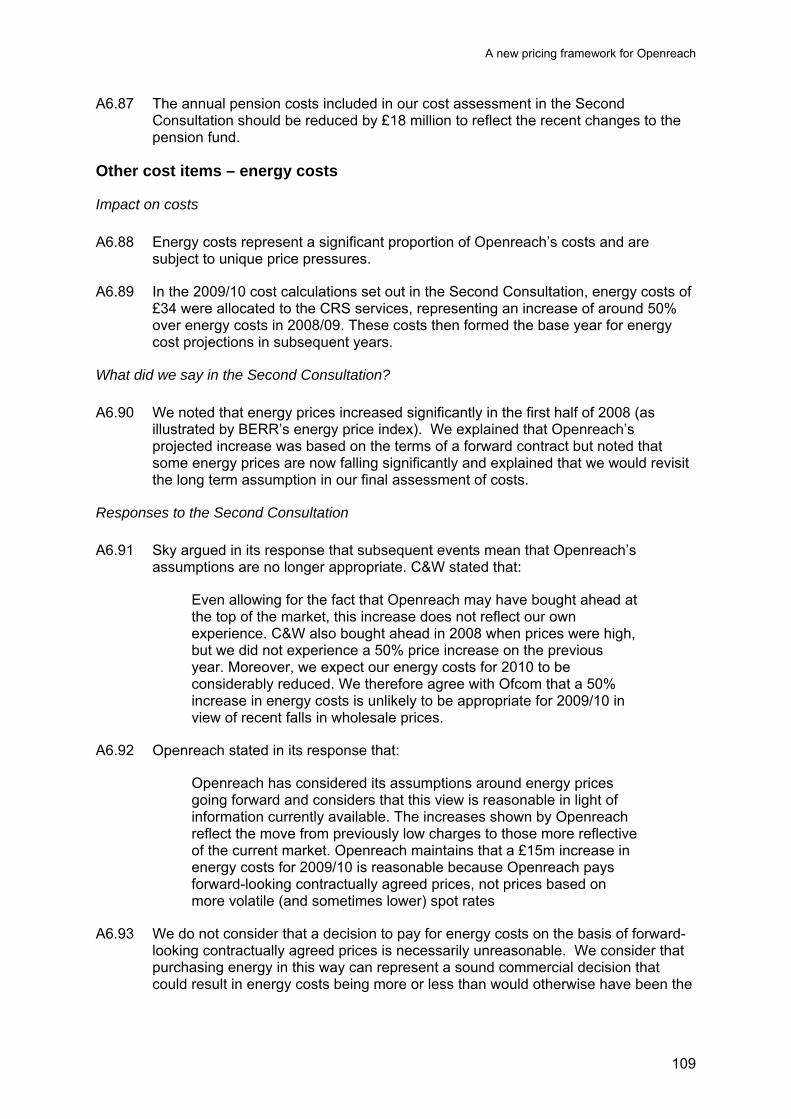
A new pricing framework for Openreach
109
A6.87 The annual pension costs included in our cost assessment in the Second Consultation should be reduced by £18 million to reflect the recent changes to the pension fund.
Other cost items – energy costs
Impact on costs
A6.88 Energy costs represent a significant proportion of Openreach’s costs and are
subject to unique price pressures.
A6.89 In the 2009/10 cost calculations set out in the Second Consultation, energy costs of £34 were allocated to the CRS services, representing an increase of around 50% over energy costs in 2008/09. These costs then formed the base year for energy cost projections in subsequent years.
What did we say in the Second Consultation?
A6.90 We noted that energy prices increased significantly in the first half of 2008 (as
illustrated by BERR’s energy price index). We explained that Openreach’s projected increase was based on the terms of a forward contract but noted that some energy prices are now falling significantly and explained that we would revisit the long term assumption in our final assessment of costs.
Responses to the Second Consultation
A6.91 Sky argued in its response that subsequent events mean that Openreach’s
assumptions are no longer appropriate. C&W stated that:
Even allowing for the fact that Openreach may have bought ahead at the top of the market, this increase does not reflect our own experience. C&W also bought ahead in 2008 when prices were high, but we did not experience a 50% price increase on the previous year. Moreover, we expect our energy costs for 2010 to be considerably reduced. We therefore agree with Ofcom that a 50% increase in energy costs is unlikely to be appropriate for 2009/10 in view of recent falls in wholesale prices.
A6.92 Openreach stated in its response that:
Openreach has considered its assumptions around energy prices going forward and considers that this view is reasonable in light of information currently available. The increases shown by Openreach reflect the move from previously low charges to those more reflective of the current market. Openreach maintains that a £15m increase in energy costs for 2009/10 is reasonable because Openreach pays forward-looking contractually agreed prices, not prices based on more volatile (and sometimes lower) spot rates
A6.93 We do not consider that a decision to pay for energy costs on the basis of forward-looking contractually agreed prices is necessarily unreasonable. We consider that purchasing energy in this way can represent a sound commercial decision that could result in energy costs being more or less than would otherwise have been the
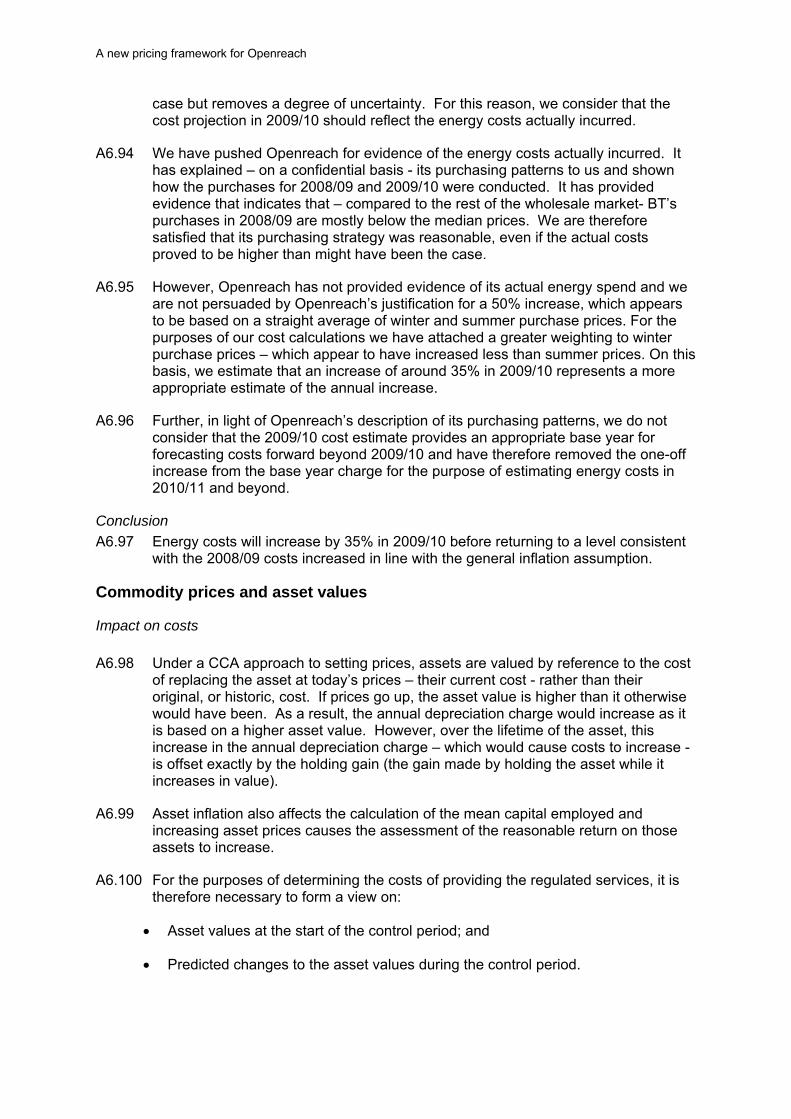
A new pricing framework for Openreach
case but removes a degree of uncertainty. For this reason, we consider that the cost projection in 2009/10 should reflect the energy costs actually incurred.
A6.94 We have pushed Openreach for evidence of the energy costs actually incurred. It has explained – on a confidential basis - its purchasing patterns to us and shown how the purchases for 2008/09 and 2009/10 were conducted. It has provided evidence that indicates that – compared to the rest of the wholesale market- BT’s purchases in 2008/09 are mostly below the median prices. We are therefore satisfied that its purchasing strategy was reasonable, even if the actual costs proved to be higher than might have been the case.
A6.95 However, Openreach has not provided evidence of its actual energy spend and we are not persuaded by Openreach’s justification for a 50% increase, which appears to be based on a straight average of winter and summer purchase prices. For the purposes of our cost calculations we have attached a greater weighting to winter purchase prices – which appear to have increased less than summer prices. On this basis, we estimate that an increase of around 35% in 2009/10 represents a more appropriate estimate of the annual increase.
A6.96 Further, in light of Openreach’s description of its purchasing patterns, we do not consider that the 2009/10 cost estimate provides an appropriate base year for forecasting costs forward beyond 2009/10 and have therefore removed the one-off increase from the base year charge for the purpose of estimating energy costs in 2010/11 and beyond.
Conclusion
A6.97 Energy costs will increase by 35% in 2009/10 before returning to a level consistent with the 2008/09 costs increased in line with the general inflation assumption.
Commodity prices and asset values
Impact on costs
A6.98 Under a CCA approach to setting prices, assets are valued by reference to the cost
of replacing the asset at today’s prices – their current cost - rather than their original, or historic, cost. If prices go up, the asset value is higher than it otherwise would have been. As a result, the annual depreciation charge would increase as it is based on a higher asset value. However, over the lifetime of the asset, this increase in the annual depreciation charge – which would cause costs to increase - is offset exactly by the holding gain (the gain made by holding the asset while it increases in value).
A6.99 Asset inflation also affects the calculation of the mean capital employed and increasing asset prices causes the assessment of the reasonable return on those assets to increase.
A6.100 For the purposes of determining the costs of providing the regulated services, it is therefore necessary to form a view on:
Asset values at the start of the control period; and
Predicted changes to the asset values during the control period.

A new pricing framework for Openreach
111
What did we say in the Second Consultation? A6.101 The opening value of the assets reflected in the cost calculations were based on the
audited asset values in the regulatory financial statements at 31 March 2008, rolled forward on the following bases:
The value of assets, other than those included in the RAV adjustment, was assumed to increase by 3.5% each year (before deducting an extra year’s depreciation);
The value of assets included in the RAV adjustment, was assumed to increase by 3.0% each year (before deducting an extra year’s depreciation).
A6.102 We explained that Openreach had used an assumption of 3.5% holding gains on Network Assets. We noted that Openreach’s non-pay inflation assumption was 3% per annum and suggested that there could be a case for using this figure for asset inflation. However, we also noted that, as capitalised labour costs make up a large proportion of the asset additions (and real wage inflation was assumed to run at 1%) a rate of 3.5% - based on the average of these figures - did not seem unreasonable.
A6.103 The holding gain on the RAV assets was calculated on the basis of the underlying rate of inflation of 3.0% described above.
Responses to the Second Consultation
A6.104 As set out in Section 3, the price of copper has fallen significantly since its peak in
2008. Several respondents argued that this fall should be taken into account in our cost modelling.
A6.105 Sky stated that
The cost of copper itself is a significant factor in a CCA accounting model, such as used by Ofcom…copper commodity prices by December 2008 were around a third of those in June 2008, and a half of those in September 2008… copper futures prices indicate that the market expects no return to the higher prices on which Ofcom’s analysis will have been based
A6.106 Similarly, C&W noted that
Since the document was published, the cost of copper has fallen dramatically and is now close to what it was five or ten years ago. Although this was not discussed in great detail in the consultation document, we would expect this to have a considerable impact on BT’s asset base and cost stacks. This is important given the use of current cost accounting.
A6.107 We consider that the opening asset values should reflect recent information. For the purpose of this cost modelling, we consider that a valuation based on the most recent balance sheet date – in this case 31 March 2009 – provides an appropriate (and least arbitrary) point. Taking account of the change in copper prices (in sterling) and information provided by copper cable suppliers and Openreach, we estimate that the value of the copper element of Openreach’s assets is around 30% lower than the value reflected in the calculations in the Second Consultation (which
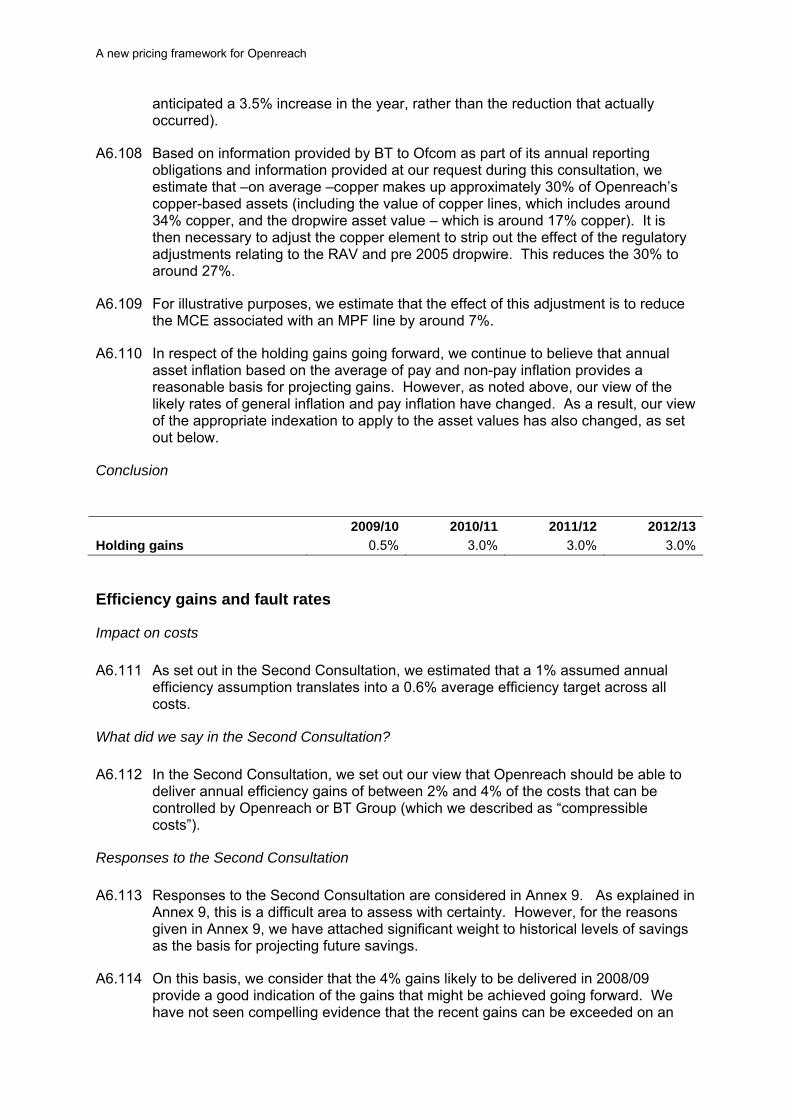
A new pricing framework for Openreach
anticipated a 3.5% increase in the year, rather than the reduction that actually occurred).
A6.108 Based on information provided by BT to Ofcom as part of its annual reporting obligations and information provided at our request during this consultation, we estimate that –on average –copper makes up approximately 30% of Openreach’s copper-based assets (including the value of copper lines, which includes around 34% copper, and the dropwire asset value – which is around 17% copper). It is then necessary to adjust the copper element to strip out the effect of the regulatory adjustments relating to the RAV and pre 2005 dropwire. This reduces the 30% to around 27%.
A6.109 For illustrative purposes, we estimate that the effect of this adjustment is to reduce the MCE associated with an MPF line by around 7%.
A6.110 In respect of the holding gains going forward, we continue to believe that annual asset inflation based on the average of pay and non-pay inflation provides a reasonable basis for projecting gains. However, as noted above, our view of the likely rates of general inflation and pay inflation have changed. As a result, our view of the appropriate indexation to apply to the asset values has also changed, as set out below.
Conclusion
2009/10 2010/11 2011/12 2012/13
Holding gains 0.5% 3.0% 3.0% 3.0%
Efficiency gains and fault rates
Impact on costs
A6.111 As set out in the Second Consultation, we estimated that a 1% assumed annual
efficiency assumption translates into a 0.6% average efficiency target across all costs.
What did we say in the Second Consultation?
A6.112 In the Second Consultation, we set out our view that Openreach should be able to
deliver annual efficiency gains of between 2% and 4% of the costs that can be controlled by Openreach or BT Group (which we described as “compressible costs”).
Responses to the Second Consultation
A6.113 Responses to the Second Consultation are considered in Annex 9. As explained in
Annex 9, this is a difficult area to assess with certainty. However, for the reasons given in Annex 9, we have attached significant weight to historical levels of savings as the basis for projecting future savings.
A6.114 On this basis, we consider that the 4% gains likely to be delivered in 2008/09 provide a good indication of the gains that might be achieved going forward. We have not seen compelling evidence that the recent gains can be exceeded on an

A new pricing framework for Openreach
113
ongoing basis and accept Openreach’s arguments that some of the quick wins achieved in the past may not be replicable; however, we have not been convinced that future gains will tail off as quickly as Openreach suggest.
Conclusion
A6.115 As set out in Annex 9, we have concluded that the following efficiency targets are
reasonable:
2009/10 2010/11 2011/12 2012/13
Efficiency gain 4% 3% 2% 2%
Fault rates
Impact on costs
A6.116 Pay costs - and the allocation of some overheads – are driven by forecast activity
levels. Activity levels vary in line with the number of faults. The forecast number of faults depends on the projected level of faults per line. Lower fault rates therefore mean lower costs.
What did we say in the Second Consultation?
A6.117 In the Second Consultation, we explained that we considered that there was scope
for further reductions in fault rates of between 4% and 6% each year.
Responses to the Second Consultation
A6.118 Responses to the Second Consultation are considered in Annex 9. As explained in
Annex 9, respondents’ views on the potential for further reductions in fault rates ranged from 0% to 10% per year. We therefore asked Openreach to provide further information to improve our understanding of its ability to repeat recent reductions in fault rates. Our review of this information is set out in Annex 9.
A6.119 In light of this information, we consider that Openreach’s ability to reduce fault rates at a time when other factors might be pushing fault rates is less than we had first thought. However, we have not been persuaded that there is no scope for any reduction. On this basis, we conclude that annual reductions of around 2% are more realistic.
Conclusion
A6.120 For the reasons set out in Annex 9, we have concluded that the following efficiency targets are reasonable:
2009/10 2010/11 2011/12 2012/13
Reduction in fault rates
2% 2% 2% 2%

A new pricing framework for Openreach
Transfer charges
Impact on costs
A6.121 Transfer charges represent the costs allocated to Openreach by BT Group in
respect of costs incurred by them on Openreach’s behalf. In 2012/13, Openreach estimate that Group costs will be approximately £1.2 billion, equivalent to around 32% of Group overheads and 35% of Openreach’s operating costs.
What did we say in the Second Consultation? A6.122 In the Second Consultation, we concluded that –overall - transfer charges from
across the BT group to Openreach represented a fair share of Group costs. Specifically, we concluded that costs have been allocated on reasonable bases that were consistent with those in the regulatory accounts and appeared free from bias.
A6.123 We explained that this conclusion was supported by KPMG’s findings in the ‘Review of Openreach Allocation Methodologies’ report which “concluded that the allocation of costs from BT Group to Openreach (are) reasonable”.
A6.124 We noted a few exceptions to this overall conclusion, where we did not consider Openreach’s cost estimates provided the appropriate basis for our cost calculations. These categories were: service level guarantee payments, low user social telephony and some BT design costs. We return to these specific categories later in this annex.
A6.125 These conclusions were informed by a review of the costs summarised in the table below. The table sets the data provided by Openreach in respect of transfer charges relating to Operating costs. These costs are attributed across various cost headings in the Openreach cost projection set out above.
Table A6.5: Transfer charges relating to Operating Costs
Transfer Charge – operating costs
2007/08£m
2008/09£m
2009/10£m
2010/11 £m
2011/12£m
2012/13£m
Cumulo Rates 248 256 263 271 279 288
BT Design 252 253 250 254 259 263
Corporate Overheads 181 180 183 187 191 195
Accommodation 103 105 122 125 129 133
Low User Social Telephony 77 77 77 77 77 77
Managed Service Charge 53 53 53 54 54 55
Phone Book Recovery Cost 46 44 43 35 23 16
Other Charges* 196 198 204 212 212 215
Total 1,157 1,166 1,196 1,216 1,224 1,241
* Other charges include BT fleet, Insurance Charges, Supply Chain and other minor charges

A new pricing framework for Openreach
115
A6.126 Cumulo rates are the business rates paid by BT Group on its network business. These relate to the use of public land for assets such as poles, duct, street cabinets and the equipment in exchange buildings. The cost is determined by government legalisation and is therefore largely out of BT’s control. The cost has been allocated to Openreach in proportion to the net replacement cost of the assets. We concluded this to be an appropriate basis.
A6.127 BT Design is BT Group’s Information Systems department and is responsible for the development, maintenance and support of its computer systems. The charge including Operational Integrity, Business As Usual costs (which includes the development of applications used by Openreach and its customers) and costs connected to the Equivalence of input platform (intended to provide CPs with the same customer experience as BT).
A6.128 As around 80% of the BAU/EMP cash cost is capitalised, the cost impact is through the depreciation charge. This is rising throughout the period as Openreach builds up the asset base from scratch in 2004/5.
A6.129 In terms of forward looking spend; the 08/09 budget was built up on a bottom up basis of planned projects amounting to £185m. From 09/10 a budget of £150m was rolled forward with no inflation. A key consideration for us was whether this simple roll forward of discrete, discretionary project spend was appropriate.
A6.130 On reviewing the Openreach 2008/09 EMP/BAU cash budget, we identified around £75m which related to process improvements and provide software releases.
A6.131 The remaining £110m relates to non repeatable discrete one-off projects. Openreach’s justification is that future, as of yet unidentified software releases, will become increasingly complex, while additional projects will be identified. As a result costs are not projected to fall.
A6.132 In light of the evidence provided by Openreach, we recognise the need to maintain an appropriate level of spend to maintain and improve service levels. We have, therefore, accepted Openreach’s projections.
A6.133 Corporate overheads include BT Group’s allocation of accommodation costs, the cost of empty office, group HQ costs such as tax, treasury, legal etc, Group CTO and overheads from BT Design. These costs are estimated to increase with RPI (3%) offset by efficiencies of 1% per year. Group HQ, Group CTO and BT Design overheads are allocated on a full time employee basis whereas group accommodation and empty office space are allocated on the proportion of space already allocated in accommodation.
A6.134 Accommodation includes property rental costs (including empty exchange space) and outsourced facility management services. Costs have been estimated either on contracted rates or to increase by RPI (3%) with 1% efficiencies. Direct costs are allocated on the basis of usage by Line of business and occupation of empty exchange space is calculated as a percentage of exchange space utilised. KPMG have considered the treatment of vacant space as part of their efficiency review.
A6.135 Within accommodation are energy costs of around £30m in 07/08. These increase by 50% in 09/10 as BT has told us its energy buyers have been unable to obtain prices for the next (18month) forward contract at the previous level due to increases in wholesale energy prices. While this short term rationale was reasonable in

A new pricing framework for Openreach
September when BT supplied updated figures, recent reversals in wholesale energy prices since then indicate in the long run this might not be appropriate.
A6.136 BT Fleet costs relate to the use by Openreach field services and service management staff of BT Fleet vehicles. Costs are estimated based upon volumes of vehicles and forecast man hour requirements. Costs are allocated based upon usage.
A6.137 Light User Scheme (LUS) is a charge from BT Retail for revenue forgone on line rental as a result of the BT social telephony scheme as well as the running costs for the scheme. The costs have been estimated to be constant based upon forecast numbers of eligible customers. This cost is allocated directly to Openreach by BT group and is dealt with in more detail below.
A6.138 Managed Services Charge relates to a range of services performed by BT Wholesale or BT Operate on behalf of Openreach. These costs are allocated directly to Openreach.
A6.139 Phonebook Cost Recovery is the cost of producing and distributing UK telephone directories. Costs are estimated based upon WLR forecasts and allocated directly to Openreach.
A6.140 In respect of the allocation of group costs to Openreach, we considered whether:
a) the allocation bases are logical and free from bias; and,
b) the costs allocated to Openreach appear reasonable.
A6.141 In respect of the allocation bases applied to each type of cost, we explained that it is helpful to consider the costs in 2012/13 within five categories, as follows.
Costs incurred specifically for Openreach and allocated directly to Openreach. These include low user social telephony cost (£77m in 2012/13), Managed Service Charge (£55m), phone book recovery costs (£16m) and service level guarantee costs (£25m) and amount to £173m representing 5% of Openreach’s operating costs;
Costs incurred by BT Group and allocated to Openreach based on actual usage. These include BT fleet and mobile costs, included in other costs in table. This represents 3% of Openreach’s operating costs;
Costs incurred by BT Group and allocated to Openreach on a basis clearly linked to the cause of the cost. These relate to Cumulo rates which amount to £288m. This represents 8% of Openreach’s operating costs;
Costs incurred by BT Group and allocated to Openreach by a combination of direct allocated and indirectly by full time employee headcount. These include BT Design costs (£263m) and supply chain; and
Costs incurred by BT Group and allocated to Openreach on several potential bases. These costs include accommodation (£133m allocated on the basis of floor costs) and corporate overheads (£195m allocated in proportion to previously allocated costs), insurance charges (allocated on the basis of head count) and the remaining other costs amount to £378m and represent 11% of Openreach’s operating costs.
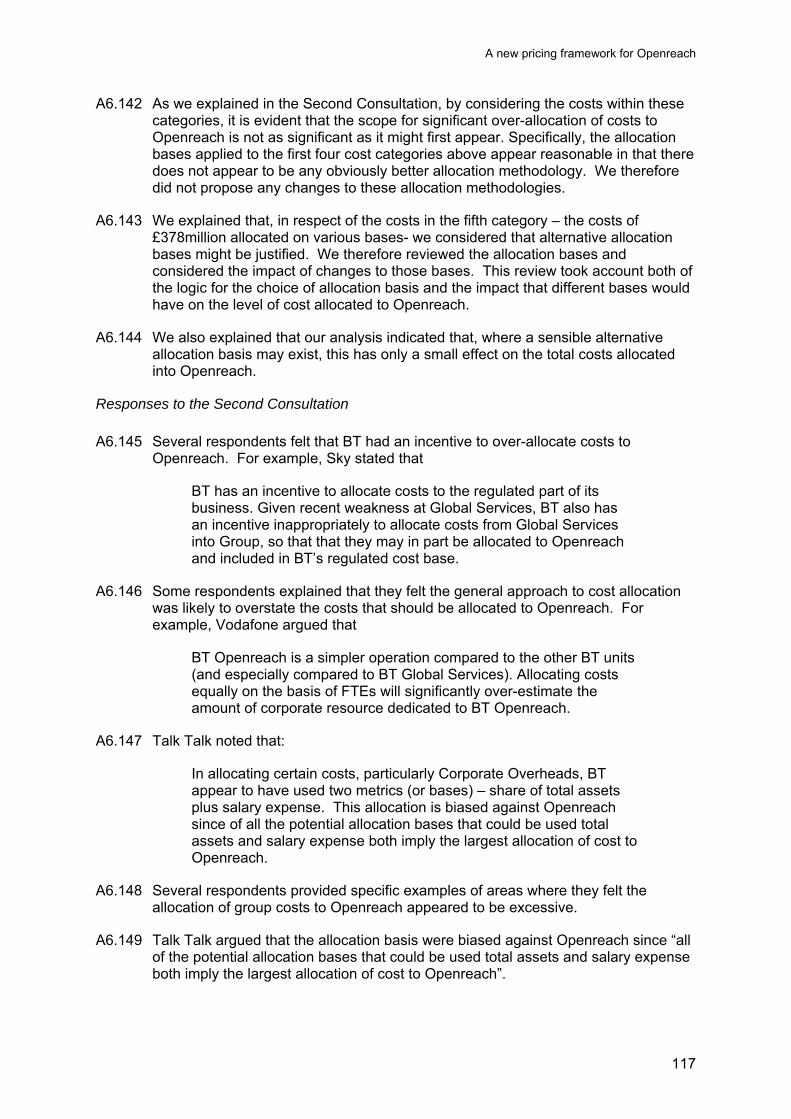
A new pricing framework for Openreach
117
A6.142 As we explained in the Second Consultation, by considering the costs within these categories, it is evident that the scope for significant over-allocation of costs to Openreach is not as significant as it might first appear. Specifically, the allocation bases applied to the first four cost categories above appear reasonable in that there does not appear to be any obviously better allocation methodology. We therefore did not propose any changes to these allocation methodologies.
A6.143 We explained that, in respect of the costs in the fifth category – the costs of £378million allocated on various bases- we considered that alternative allocation bases might be justified. We therefore reviewed the allocation bases and considered the impact of changes to those bases. This review took account both of the logic for the choice of allocation basis and the impact that different bases would have on the level of cost allocated to Openreach.
A6.144 We also explained that our analysis indicated that, where a sensible alternative allocation basis may exist, this has only a small effect on the total costs allocated into Openreach.
Responses to the Second Consultation
A6.145 Several respondents felt that BT had an incentive to over-allocate costs to
Openreach. For example, Sky stated that
BT has an incentive to allocate costs to the regulated part of its business. Given recent weakness at Global Services, BT also has an incentive inappropriately to allocate costs from Global Services into Group, so that that they may in part be allocated to Openreach and included in BT’s regulated cost base.
A6.146 Some respondents explained that they felt the general approach to cost allocation was likely to overstate the costs that should be allocated to Openreach. For example, Vodafone argued that
BT Openreach is a simpler operation compared to the other BT units (and especially compared to BT Global Services). Allocating costs equally on the basis of FTEs will significantly over-estimate the amount of corporate resource dedicated to BT Openreach.
A6.147 Talk Talk noted that:
In allocating certain costs, particularly Corporate Overheads, BT appear to have used two metrics (or bases) – share of total assets plus salary expense. This allocation is biased against Openreach since of all the potential allocation bases that could be used total assets and salary expense both imply the largest allocation of cost to Openreach.
A6.148 Several respondents provided specific examples of areas where they felt the allocation of group costs to Openreach appeared to be excessive.
A6.149 Talk Talk argued that the allocation basis were biased against Openreach since “all of the potential allocation bases that could be used total assets and salary expense both imply the largest allocation of cost to Openreach”.

A new pricing framework for Openreach
A6.150 To support its position, Talk Talk provided a report by its consultants, RGL Forensics( “RGL”). RGL stated that:
“a more reasonable approach to allocating group overheads would be to take account of the management time likely to be associated with all parts of the business – revenues, costs, assets and liabilities”.
A6.151 As explained in the Second Consultation, we recognise that that there will always be alternative methods of allocating costs from BT Group to the lines of business. Inevitably, some of these will result in lower levels of costs being allocated to Openreach, while others would allocate higher costs. We considered a range of potential allocation bases. We concluded that, where sensible alternative allocation bases exist, they would have only a small effect on the total costs allocated to Openreach.
A6.152 Taking this analysis into account - alongside KPMG’s findings in the ‘Review of Openreach Allocation Methodologies’ report which informed our decision and concluded that “the allocation of costs from BT Group to Openreach (are) reasonable” - we do not consider that any alternative methodology for allocating costs to Openreach is obviously superior to the methodology used by BT. Similarly, in the absence of compelling evidence to the contrary, we do not see any strong reasons to depart from the assumption that Openreach will continue to take a constant proportion of BT Group costs – either to increase or decrease the proportion – for the purposes of our modelling of costs in years beyond 2009/10.
A6.153 Also, we do not think that there is any compelling evidence to justify any material reallocation of costs incurred by Openreach to BT Group.
A6.154 However, in respect of Cumulo rates, since the second Consultation, The Department of Communities and Local government announced that the planned 5% increase was to be staggered over several years, whilst BT received a rebate due to the fall in the number of copper lines. Whilst BT is still considering the impacts of the announcement, it provided us with a breakdown of its 2009/10 Cumulo rates adjustment, split between the impact of higher LLU demand (2/3rd) and government rebate (1/3rd). In view of Openreach’s expected fall in copper line volume (which we have accepted) and the move towards MPF we have reduced our cost estimates in line with this adjustment.
Conclusion
A6.155 We have not made any changes to the basis for calculating the transfer charges from BT Group to Openreach.
Cost allocation within Openreach
Impact on costs
A6.156 Costs are allocated from Group to Openreach and within Openreach (to specific
services). The choice of allocation basis therefore can have a significant impact on the costs.

A new pricing framework for Openreach
119
What did we say in the Second Consultation?
A6.157 As set out in the Second Consultation, we considered that, in general, Openreach
has adopted a reasonable approach to the allocation of its costs to its services.
A6.158 However, in Openreach’s cost projections, there are a number of smaller services to which little, or no, cost is allocated, even though they were generating revenues. These products are set out in the table below. For example, Enhanced Rental Care customers get priority treatment in the event of a fault. Openreach projects that it will generate revenues of around £40 million from this service in 2012/13. However, no cost is allocated to this service in Openreach’s projections.
A6.159 As a result, we consider it likely that costs which may reasonably have been allocated to those services have instead been allocated to other services – including the regulated services.
A6.160 Openreach’s EBIT was around 20% of revenues in 2007/08. To obtain a rough estimate of an appropriate share of Openreach’s costs to be allocated to these services, we have assumed that these services should pick up a similar proportion of costs, based on the projected revenues. This assumption effectively reallocates costs from other Openreach products (including regulated and non-regulated services) to the services identified below.
Table A6.6: Estimate of reduction in costs allocated to Core Rental Services, per Second Consultation
Service Revenue (£m)
Relevant margin
Cost to give margin (£m)
Costs already
allocated
Additional allocation
required
Proportion reallocated from CRS
Reduction in CRS
costs (£m)
TRC 100 20% 80 18 62 45% 28
Other 35 20% 28 28 45% 13
135 130 18 90 41
Enhanced Care 40 20% 32 32 45% 14
Redcare 18 20% 14 14 45% 6
Own use 35 20% 28 28 45% 13
228 182 18 164 74
A6.161 As set out in the table above, we estimated that further costs of £164 million should be allocated to the other services. On this basis, we proposed that the costs allocated to the Core Rental Services should be reduced by between £49 million and £98 million, depending on whether it was appropriate to reallocate 30% or 60% of the £164 million. Our mid- case estimate of the necessary was therefore £74 million.
Responses to the Second Consultation
A6.162 Stakeholders - including Openreach - agreed that it is appropriate to reallocate
some costs away from the Core Rental Services.
A6.163 Talk Talk flagged the significance of the choice of allocation basis, stating that,

A new pricing framework for Openreach
“The allocation of costs to WLR and MPF is critical. Not only does it set the absolute level of costs for each product but also the relative level between the products. This drives the margin which is critical to NGNs that effectively use MPF to compete with WLR”.
A6.164 In respect of the approach adopted by Ofcom to estimate the reallocation, Talk Talk argued that
“Firstly, a 20% EBIT figure (used to calculate costs) is probably too high. These services are of low capital intensity so do not require a high EBIT level to recover investment
Ofcom has suggested that the amount the costs allocated to these services that should come from CRS should be between 30% and 60%...Given these services are variants of LLU/WLR this would suggest that much of the cost should come from CRS services – possibly as much as 80%
In making the assumption Ofcom must also consider growth in the revenue of these services and therefore the cost allocation away from CRS since many of these services are likely to grow (or are already growing pointed out by BSkyB in its response)”.
A6.165 Sky noted that
“BT’s approach to common cost allocation and non-regulated services in this instance reinforces our view that Openreach is incentivised to over-allocate common costs to regulated products and, as such, Ofcom needs to be vigilant. It is common accounting practice to allocate common costs consistently to all products, therefore it is alarming that BT has not been applying these principles in these circumstances. The sums involved are material and Ofcom needs comprehensively to review all of Openreach’s non-regulated services … to ensure that common costs are shared fairly by all services”.
A6.166 Openreach noted that
“in principle, some cost reallocation may be appropriate. However, the methodology Ofcom appears to use to reallocate costs seems arbitrary”.
A6.167 In place of Ofcom’s choice of allocation basis, Openreach proposed some amendments to the approach described in the Second Consultation.
A6.168 First it grouped Time Related Charges (“TRC”) and Other charges into a single category – which it termed “Engineering Services”- and included a further service: Special Faults Investigations (“SFI”). It argued that costs of around £82 million have already been allocated to these services and that this amount is broadly representative of the hours spent by engineers performing these activities. On this basis, Openreach argued that no further costs should be allocated to these services.
A6.169 For the remaining services, Openreach argued that:

A new pricing framework for Openreach
121
For Redcare, the EBIT margin should be around 20%, so costs of up to 80% of the revenue base could be allocated, all of which should be reallocated from the Core Rental Services;
For Enhanced Care, an assessment of costs is difficult, but Openreach should be allowed to make a commercial margin. On this basis, costs of up to 50% of the revenue base could be allocated, all of which should reallocated from the Core Rental Services; and
For Own Use, the costs for the lines should be similar to those of a WLR line rental so costs of up to 80% of the revenue base could be allocated, 40% of which should be reallocated from the Core Rental Services.
A6.170 On this basis, Openreach argued that the maximum cost allocation from the Core Rental Services is approximately £46 million. Our understanding of Openreach’s calculation – based on Openreach estimates for 2012/13 - is set out in the table below
Table A6.7: Openreach estimate of appropriate reduction in costs allocated to Core Rental Services
Service Revenue (£m)
Relevant margin
Cost to give margin (£m)
Costs already
allocated
Additional allocation
required
Proportion reallocated from CRS
Reduction in CRS
costs (£m)
TRC 100
Other 35
SFI 39
174 82 82 - -
Enhanced Care 40 50% 20 20 100% 20
Redcare 18 20% 14 14 100% 14
Own use 35 20% 28 28 40% 11
267 144 82 62 46
A6.171 As set out above, Openreach has linked its cost estimates to the projected revenues. However, Openreach has separately argued that – by adopting a similar approach in the Second Consultation- we are seeking to limit its returns on non-regulated services. This is not the case. Our approach seeks to ensure that the non-regulated services take a fair share of Openreach’s costs. As explained in the Second Consultation – and evident in the table above - the costs included for these products in Openreach’s cost projection – where costs were included at all – are not a credible estimate of the relevant costs.
A6.172 During the consultation process, we have sought information from Openreach to inform our assessment of the appropriate level of costs. Openreach has provided estimates of the direct costs of some of these services but has not provided a robust estimate of the appropriate level of fully allocated costs.
A6.173 At our request, Openreach has provided an estimate of the pay costs associated with TRCs. On this basis, it has estimated that the margin – before recovery of associated costs and any overheads is around 69%.
A6.174 Openreach has also explained that pay costs represent around 44% of the overall costs. On this basis, we estimate that total costs would represent around 70% of the revenue, leaving a margin of around 30%. We consider that this provides an

A new pricing framework for Openreach
appropriate basis for estimating the appropriate level of costs to be allocated to TRCs. In the absence of further evidence from Openreach, we consider that a 20% margin – based on the Openreach average- provides an appropriate basis for estimating the appropriate level of costs – on average - across the other services including SFI and Enhanced Care.
A6.175 On this basis, we estimate that a further £139 million of costs should be allocated to the services listed above (including SFI)
A6.176 We consider that the proportion of Openreach costs represented by the Core Rental Services provides a reasonable basis for determining the appropriate proportion of the costs of £139 million that should be allocated from the Core Rental Services. On this basis we estimate that around 45% - in line with our mid-case in the Second Consultation but slightly above Openreach’s suggested 40% - should be reallocated from the Core Rental Services, except where Openreach has indicated that the appropriate proportion should be 100%.
A6.177 On this basis, we have estimated that costs of around £88 million should be reallocated from the Core Rental Services, as illustrated in the table below.
Table A6.8: Ofcom final estimate of appropriate reduction in costs allocated to Core Rental Services
Service Revenue (£m)
Relevant margin
Cost to give margin (£m)
Costs already
allocated
Additional allocation
required
Proportion reallocated from CRS
Reduction in CRS
costs (£m)
TRC 100 30% 70 18 53 45% 23
Other 35 20% 28 28 45% 13
SFI 39 20% 32 48 (16) 45% (7)
174 130 65 65 29
Enhanced Care 40 20% 32 32 100% 32
Redcare 18 20% 14 14 100% 14
Own use 35 20% 28 28 45% 13
267 204 65 139 88
A6.178 Since publication of the Second Consultation, Openreach has explained that it will bill BT Operate in relation to BT Operate's roll out of 21CN. Openreach has explained that most of the revenue relates to 2008/09 or earlier, but about £4m relates to services that will be delivered 2009/10 that have not been included in the cost modelling. We consider that these services should attract a fair share of Openreach’s overheads in 2009/10. However, adopting a similar methodology to that set out above, we estimate that the costs allocated to the Core Rental Services should be reduced –by less than £1 million – to take this into account.
A6.179 Although we have identified cost allocations at the service level that do not appear to be reasonable – and have adjusted them accordingly – we do not consider that this is evidence of a flawed allocation methodology. This view is consistent with the conclusions from the KPMG report.
A6.180 Talk Talk noted that RGL’s review identified a cost category – Telephony Over Passive Optical Network, or “TPON” – which it considers to have been erroneously allocated to MPF, and argues that this apparent error demonstrates the need for the allocation approach to be properly scrutinised. The total value of TPON assets included in the cost model is less than £1m, none of which has been allocated to

A new pricing framework for Openreach
123
MPF. We therefore do not consider that RGL’s findings provide justification for further review.
Conclusion
A6.181 Costs of around £88million should be reallocated from the Core Rental Services in
each year.
Line cards
Impact on costs
A6.182 We have set the line card allocation to recover both the legacy PSTN line cards and
a contribution to voice related 21CN line card costs, as the new 21CN line card costs are phased in. For the 21CN line cards, we have adopted Openreach’s proposed methodology. This involves costs being recovered on the basis of the number of services provided. So where a 21CN line card is used for both voice services and broadband, it recovers double the cost compared to a card that is only used for voice services.
A6.183 We consider this approach to the recovery of the 21CN line card costs to be reasonable. This is partly because it results in a line card cost that is broadly constant in real terms over time. We consider this to be an advantage because voice only consumers receive no benefit from 21CN line cards. 21CN line cards are being introduced primarily for providing services to consumers who use both voice and broadband services, it seems reasonable that the additional costs of the 21CN line cards services (over and above the cost of existing line cards) should ultimately be borne by such consumers.
What did we say in the Second Consultation?
A6.184 In the First Consultation we concluded that the method Openreach proposed to use
for the allocation of line card costs appeared to increase line card costs reflected in the WLR charge. Consumers of WLR would therefore be required to pay more for a similar service due to a change in the means of delivering that service.
A6.185 Ahead of the Second Consultation, Openreach provided updated analysis under the proposed methodology that line card costs should be recovered on the basis of the number of services provided. Openreach’s estimated cost stacks for WLR include what we consider to be a reasonable charge for line cards that includes both legacy PSTN and voice related 21CN costs. Data-related 21CN costs are not included in Openreach’s projections for the Core Rental Services. The projected line card costs for WLR are shown in the table below
Table A6.8: Projected costs for line cards per WLR
£ 07/08
£ 11/12
£ 12/13
Line card unit cost
11.70 12.99 13.32

A new pricing framework for Openreach
Responses to the Second Consultation
A6.186 Talk Talk argued that line card costs should be allocated on a per-line basis, not a
per-service basis.
Conclusion
A6.187 We proposed that the WLR charge be set to recover both the legacy PSTN line
cards and a contribution to voice related 21CN line card costs, as the new 21CN line card costs are phased in. We have adopted Openreach’s proposed methodology for 21CN line cards. This involves costs being recovered on the basis of the number of services provided. So where a 21CN line card is used for both voice services and broadband, it recovers double the cost compared to a card that is only used for voice services.
A6.188 We consider this approach to the recovery of the 21CN line card costs to be reasonable. This is partly because it results in a line charge cost that is broadly constant in real terms over time. We consider this to be an advantage because voice only consumers receive no benefit from 21CN line cards. 21CN line cards are being introduced primarily for providing services to consumers who use both voice and broadband services, it seems reasonable that the additional costs of the 21CN line cards services (over and above the cost of existing line cards) should ultimately be borne by such consumers.
SLG payments
Impact on costs
A6.189 We consider it reasonable for Openreach to be able to recover the costs of meeting
SLG payments to the extent that such costs would be incurred by an efficient operator. In the Second Consultation, we considered that an efficient level of SLG payments in 2012/13 was in the range of £5m to £9m a year for MPF, SMPF and WLR in total.
What did we say in the Second Consultation? A6.190 The range in our Second Consultation was informed by bottom-up modelling of
significant compensation payments. Wherever possible in this modelling we used performance targets that Openreach had already communicated with industry (for example, in its integrated performance plan for 2007/08 and its performance improvement plan for 2008/09). These performance targets were typically concerned with the frequency of failure. To estimate an efficient level of SLG payments, we also needed to make an assumption about the duration of failure. For 2012/13, we assumed 2 days duration for all failures.
A6.191 We noted that Openreach has argued in response to the First Consultation that it was not reasonable to expect service performance to improve to the level implied by our assumptions immediately and that a gradual improvement should be assumed over the period we are considering.
A6.192 Openreach provided its own confidential estimates of what a reasonable duration for each failure might be. These varied by the type of failure and gradually improved over time. For the total amount of SLG payments, using Openreach’s proposals for
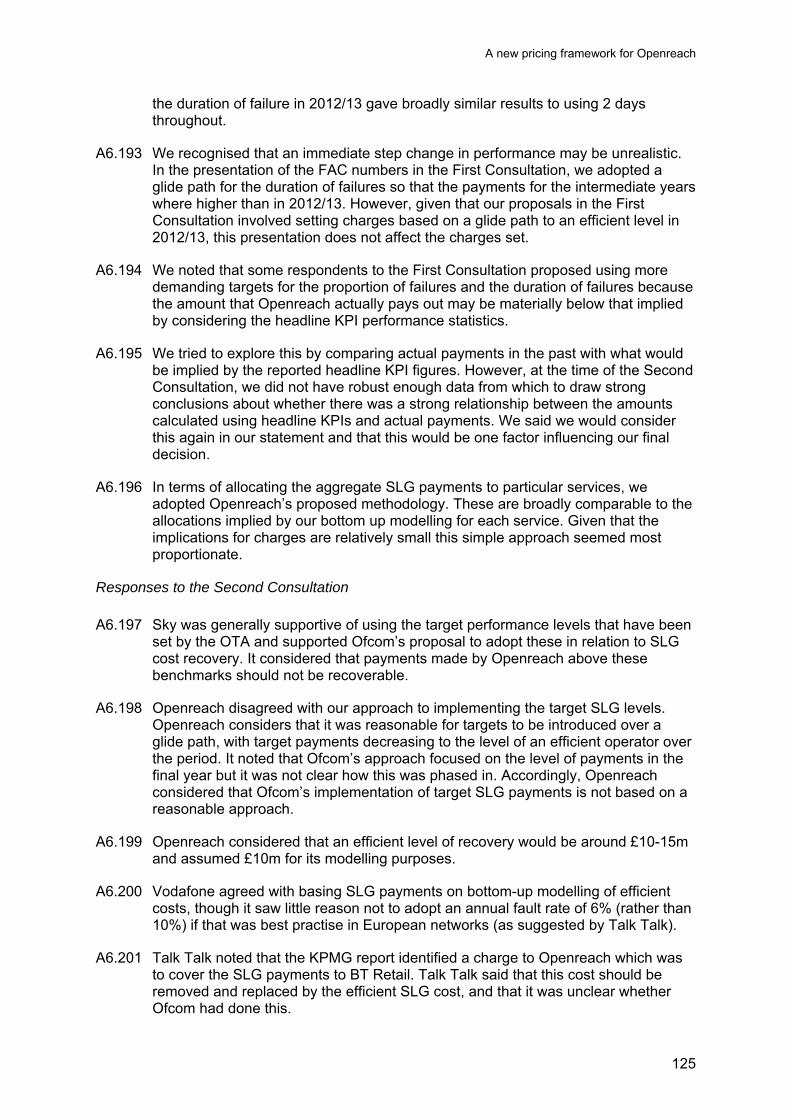
A new pricing framework for Openreach
125
the duration of failure in 2012/13 gave broadly similar results to using 2 days throughout.
A6.193 We recognised that an immediate step change in performance may be unrealistic. In the presentation of the FAC numbers in the First Consultation, we adopted a glide path for the duration of failures so that the payments for the intermediate years where higher than in 2012/13. However, given that our proposals in the First Consultation involved setting charges based on a glide path to an efficient level in 2012/13, this presentation does not affect the charges set.
A6.194 We noted that some respondents to the First Consultation proposed using more demanding targets for the proportion of failures and the duration of failures because the amount that Openreach actually pays out may be materially below that implied by considering the headline KPI performance statistics.
A6.195 We tried to explore this by comparing actual payments in the past with what would be implied by the reported headline KPI figures. However, at the time of the Second Consultation, we did not have robust enough data from which to draw strong conclusions about whether there was a strong relationship between the amounts calculated using headline KPIs and actual payments. We said we would consider this again in our statement and that this would be one factor influencing our final decision.
A6.196 In terms of allocating the aggregate SLG payments to particular services, we adopted Openreach’s proposed methodology. These are broadly comparable to the allocations implied by our bottom up modelling for each service. Given that the implications for charges are relatively small this simple approach seemed most proportionate.
Responses to the Second Consultation
A6.197 Sky was generally supportive of using the target performance levels that have been
set by the OTA and supported Ofcom’s proposal to adopt these in relation to SLG cost recovery. It considered that payments made by Openreach above these benchmarks should not be recoverable.
A6.198 Openreach disagreed with our approach to implementing the target SLG levels. Openreach considers that it was reasonable for targets to be introduced over a glide path, with target payments decreasing to the level of an efficient operator over the period. It noted that Ofcom’s approach focused on the level of payments in the final year but it was not clear how this was phased in. Accordingly, Openreach considered that Ofcom’s implementation of target SLG payments is not based on a reasonable approach.
A6.199 Openreach considered that an efficient level of recovery would be around £10-15m and assumed £10m for its modelling purposes.
A6.200 Vodafone agreed with basing SLG payments on bottom-up modelling of efficient costs, though it saw little reason not to adopt an annual fault rate of 6% (rather than 10%) if that was best practise in European networks (as suggested by Talk Talk).
A6.201 Talk Talk noted that the KPMG report identified a charge to Openreach which was to cover the SLG payments to BT Retail. Talk Talk said that this cost should be removed and replaced by the efficient SLG cost, and that it was unclear whether Ofcom had done this.

A new pricing framework for Openreach
A6.202 A confidential response argued that allowing recovery of these charges would eliminate the incentive on Openreach to improve poor performance.
A6.203 We have considered Openreach’s proposal to phase in improvements. However, in terms of the performance targets, we consider that it is appropriate to use performance targets that have been already been agreed between Openreach, industry and OTA where these are available. We have not phased these in. This approach was supported by some other responses.
A6.204 However, these targets do not cover the duration of failures, and we need to make an assumption on this to calculate of the associated SLG payments. For 2012/13, we previously assumed a duration of 2 days for all failures, and continue to do so. If we were to assume a duration of 2 days for all years, then the bottom up modelling would imply an allowance of £10m in 2009/10 falling to £7m in 2012/13. This reduction over time is caused by assumptions about changes to volumes and the mix of products.
A6.205 We could consider phasing in the reduction in the duration to 2 days. This would tend to raise the SLG allowances in 2009/10 and 2010/11. We recognise that an immediate step change in performance may be unrealistic and have some sympathy with the view that it would be reasonable to phase in a reduction in the duration of failures. However, in allowing for any phasing in of the reduction in the duration of failure, we would want to avoid allowing the recovery of inefficiently incurred costs.
A6.206 We said in the Second Consultation that we would also take into account evidence on whether there was a strong relationship between the amounts calculated using headline KPIs and actual payments. We have considered a sample of performance targets that are associated with significant payments and gathered data on KPIs and actual payments from Openreach. We expected some difference between the amount implied by the headline KPI figure and actual payments. In particular, compensation payments may not be due for all failures included in the headline KPIs.
A6.207 In general, the data suggested that there was a sizeable gap between the two. While the data was highly variable, it suggested overall a materially lower level of compensation would be applicable than suggested by our modelling. However, we have not estimated this gap systematically for all types of service payment and are relying on data for a relatively small number of months, as the current SLG regime was only introduced in June 2008.
A6.208 As in the Second Consultation, we also compared the amount we are allowing with the level of current actual payments. We considered the total level of actual SLG payments between July and December 2008. When considered on a monthly basis, the amounts we are including are substantially less than what Openreach actually paid out for these 6 months. We consider this to be consistent with our approach of allowing an assessment of efficiently incurred SLG payments and not actual payments.
A6.209 In reply to the issue Talk Talk raised, we can confirm that we have removed Openreach’s assumption about SLG payments to BT Retail. Instead, we have used our own estimate of an efficient level of total SLG payments.
Conclusion

A new pricing framework for Openreach
127
A6.210 Taking account of the various factors described above, we have included an allowance of £8m in 2009/10 falling to £5m in 2012/13.
Light User Scheme (“LUS”)
Impact on costs
A6.211 The LUS provides a reduced line rental to lower income customers of BT retail as
mandated by Ofcom and the Universal Service Directive. As explained in the Second Consultation, Openreach’s estimate of LUS costs includes an assessment of the difference in retail prices between LUS rates and basic residential rental prices together with administration costs of the scheme. These amount to £77m a year.
What did we say in the Second Consultation?
A6.212 For the reasons set out in our consultation on BT’s regulatory financial reporting, of
17 April 2008, we did not consider that attributing a cost of the LUS to Openreach’s service was consistent with Ofcom’s conclusion that the net cost to BT of the universal service obligations was relatively small, with most of the benefit accruing at the retail level.
A6.213 In our high case scenario we excluded the £60m relating to the revenue loss suffered by BT retail, leaving £17m for administering the scheme. As these transfer charges are unlikely to be incremental costs, in our low case we also excluded these costs.
Responses to the Second Consultation
A6.214 Vodafone argued that
All costs of the Light User Scheme, both revenue reductions and administration costs, should be excluded from Openreach’s cost base.
A6.215 Orange stated
This is clearly a cost of the USO which should not be borne by alternative providers by this curious, roundabout method.
A6.216 Openreach noted that
Openreach does not consider that it should simply absorb the cost of the LUS going forward, and that this should be shared across UK CPs. Ofcom needs to give due consideration to how and where LUS costs will fairly be recovered, and we would suggest that this should be addressed as part of Ofcom’s upcoming USO review. We acknowledge that Ofcom has disallowed the recovery of LUS from the regulatory cost stacks presented in BT’s 2007/08 regulatory financial statements. Therefore, for our modelling purposes, to be consistent with the RFS, we have excluded the costs of LUS.
A6.217 In light of these responses, we see no reason to move from our proposed position of excluding some or all of the costs. We will shortly be undertaking a review of the

A new pricing framework for Openreach
current USO implementation. We intend to review the existing implementation of the USO and consider whether changes to it are required. It will include an assessment of the extent to which the USO results in a significant net burden upon BT and KCOM, the current universal service providers, and will consider the case for alternative funding and procurement models to ensure that USO provision is both effective and proportionate. Therefore, for the purpose of this cost assessment, however, all costs should be excluded.
Conclusion
A6.218 The revenue loss and administration costs should be excluded from Openreach’s
cost base.
RAV adjustment
Impact on costs
A6.219 BT is allowed to make a defined return on its asset base. Since 2005 we have
determined charges for copper access products on Openreach’s Regulated Asset Value (RAV) which is different from the asset value disclosed in Openreach’s Regulated Financial Statements. The difference relates to Openreach’s Copper and Duct assets. In the RAV, the assets which were purchased before 1997 are valued on a Historical Cost (HCA) basis indexed by inflation. This provides a lower valuation than the Regulatory financial Statements where the same assets are valued on a Current Cost (CCA) basis. The deduction to bring the Regulatory Accounting figure to the RAV figure is the RAV adjustment.
What did we say in the Second Consultation? A6.220 As the pre-1997 indexed HCA assets are retired and replaced by post 1997 CCA
assets the adjustment unwinds – the RAV approaches the CCA valuation, as shown in the graph below. The split of Copper and Duct assets on a CCA basis is currently around 50:50. The movement of the RAV towards the CCA valuation is steeper up to 2012 as Copper assets have a 15 year asset life. From 2012 onwards the gap closes slowly due to the 40 year life of the Duct assets.
Chart A6.9: Comparison of RAV, CCA, and HCA valuations
3000
3500
4000
4500
5000
5500
6000
6500
7000
7500
2005
/6
2006
/7
2007
/08
2008
/09
2009
/10
2010
/11
2011/12
2012
/13
2013
/14
2014
/15
2015
/16
£m
HCA
CCA
RAV
RAV adj.

A new pricing framework for Openreach
129
A6.221 Openreach had built a RAV model based on a methodology consistent with that set out in the “Cost of Copper Statement”. We had reviewed the assumption in the Openreach RAV model and tested the key inputs and calculations and have found no material error. On this basis, our view was that the model provides a reasonable basis for determining the RAV adjustments and did not propose any further adjustment.
Responses to the Second Consultation
A6.222 Only Openreach and Talk Talk offered any views on the RAV adjustment.
A6.223 Openreach provided some additional explanation of the adjustment, as follows:
It represents a decrease in depreciation costs (compared to full CCA) and a decrease in holding gains (since fewer assets are being revalued on this basis). As we move further away from 1997, the mix of pre-1997 assets naturally falls, and therefore the RAV values for MCE and Depreciation move closer to the full CCA value. This results in a faster increase in depreciation charges than one would expect to see.
A6.224 Talk Talk argued that
[Talk Talk were] unable to properly assess Ofcom's assumptions for MCE, fixed assets and depreciation because we have not been provided with details of the RAV model. Ofcom have offered to discuss some more details with us after the closing date for responses. Obviously on the basis of this we may have more comments to make. However, we believe that even after this sharing of information there will continue to be information deficiencies.
A6.225 Since receipt of the responses, we met with Talk Talk to discuss further details of the RAV model. We did not receive any further comments on the RAV calculations from Talk Talk.
Conclusion
A6.226 In light of the above, we see no reason to move away from our proposal to base the
RAV adjustment on the results generated by Openreach’s model and therefore have made no further adjustment.
Dropwires
Impact on costs
A6.227 The Dropwire costs relate to the installation and maintenance of the copper wire
that links the end users premises to the distribution point in the street. The main cost is depreciation of these assets.
What did we say in the Second Consultation? A6.228 BT changed its accounting policy for dropwire in 2001, whereby instead of writing it
off as expensed, it was capitalised and written off over 10 year. Up until 2011 there

A new pricing framework for Openreach
is a build up of the asset base. Thereafter the increased cost represents supplementary depreciation.
A6.229 We considered that a proportion of capital cost relating to residential dropwires installed between 2000/01 and 2004/05 represents an over-recovery of costs. This is because until December 2005, the Retail Price Control had set residential prices that allowed for the full recovery of dropwire operating and capital costs for BT retail residential customers. We therefore proposed an adjustment in line with our previous approach. In calculating dropwire depreciation, Openreach includes all capital relating to residential dropwires installed between 2000/01 and 2004/05. To allow them to recover these costs in WLR and LLU prices would be to allow double recovery.
A6.230 Ahead of the Second Consultation, whilst disagreeing with the disallowance of Dropwire costs, Openreach provided some updated analysis as to the amount of pre 2004/5 Dropwire costs within the capital base. This showed that in 2006/7, some 77% of combined WLR Residential and MPF connections should be excluded. We have reviewed the Openreach calculations and are satisfied with the methodology. This equates to removing £304m from the asset base in 2007/8 which unwinds to £54m in 20012/13. The chart below shows the effect of excluding pre 2005/6 residential dropwires. This reduces the capital base in 2007/8 and the P&L charges accordingly. The adjusted charge will reach the same steady state as the non adjusted charge in 2015/16.
Chart A6.10: Dropwire costs
0
20
40
60
80
100
120
140
160
180
200
1997
1998
1999
2001
2002
2003
2004
2005
2006
2007
2008
2009
2010
2011
2012
2013
P&
L C
har
ge
£'m
BT
Adjusted
Responses to the Second Consultation
A6.231 Openreach noted Ofcom’s adoption of the dropwire adjustment. Vodafone argued
that all dropwire costs should be excluded from the Core Rental Service costs where the cost can reasonably be assumed to have already been recovered through a line connection charge or other retail tariff (whether a regulated charge control or not).
Conclusion

A new pricing framework for Openreach
131
A6.232 We do not consider there to be any grounds to depart from our previous regulatory approach. We have therefore excluded the proportion of capital costs relating to residential dropwires installed between 2000/01 and 2004/05, in line with the calculation described in the Second Consultation.
Line length adjustment
Impact on costs
A6.233 When we originally set the MPF Charge we excluded 16% of D side copper costs
on the basis of data provided by Openreach which showed the average length of a copper loop used to provide a 2Mbit/s broadband service was approximately 19% shorter than the average copper loop. This supported the “technical point” that DSL did not work over long line lengths. We noted that technical advances might mean higher bandwidth services became available over longer lines’.
What did we say in the Second Consultation? A6.234 Openreach have made the case that average MPF line length has increased with
the rollout of Broadband and now form a significant part of the overall total. In addition they point out that the cost of a copper pair is a function of thickness and age as well as length. On this basis they have calculated an ‘average copper pair cost’ usage factor to apportion D and E side copper costs to products in their model. The usage factor is the average capital cost of a copper pair is determined by the 2007/8 Line Length Costing Survey.
A6.235 The result is that that compared to the previous methodology, the average cost of an MPF line is 6% less than an average WLR Residential line. Openreach have also applied the methodology to all the copper based products, the impact on a WLR Business Line is that it costs 8% less than a WLR residential line.
A6.236 As explained in the Second Consultation, we believe that Openreach’s methodology is reasonable and the results consistent with increased broadband penetration. We have accepted Openreach’s methodology.
Capital Expenditure
Impact on costs
A6.237 The capital base of Openreach impacts on costs in three ways. Firstly for each
asset purchased, there is an annual depreciation charge in the year aquiredand in subsequent year over its economic life. Secondly, the prevailing WACC will be applied against the value of that asset. Finally, under current cost accounting, if the value of that asset rises, a holding gain results in an immediate credit to cost. This rise will be offset by lower depreciation in future years. The converse occurs for a holding loss when the asset falls in value.
What did we say in the Second Consultation?
A6.238 Openreach’s copper related capital expenditure projections are summarised in the
table below. The main driver of Capital expenditure is labour activity. The forecast Capital Expenditure for the copper of Openreach is shown below. Approximately 90% is labour related.
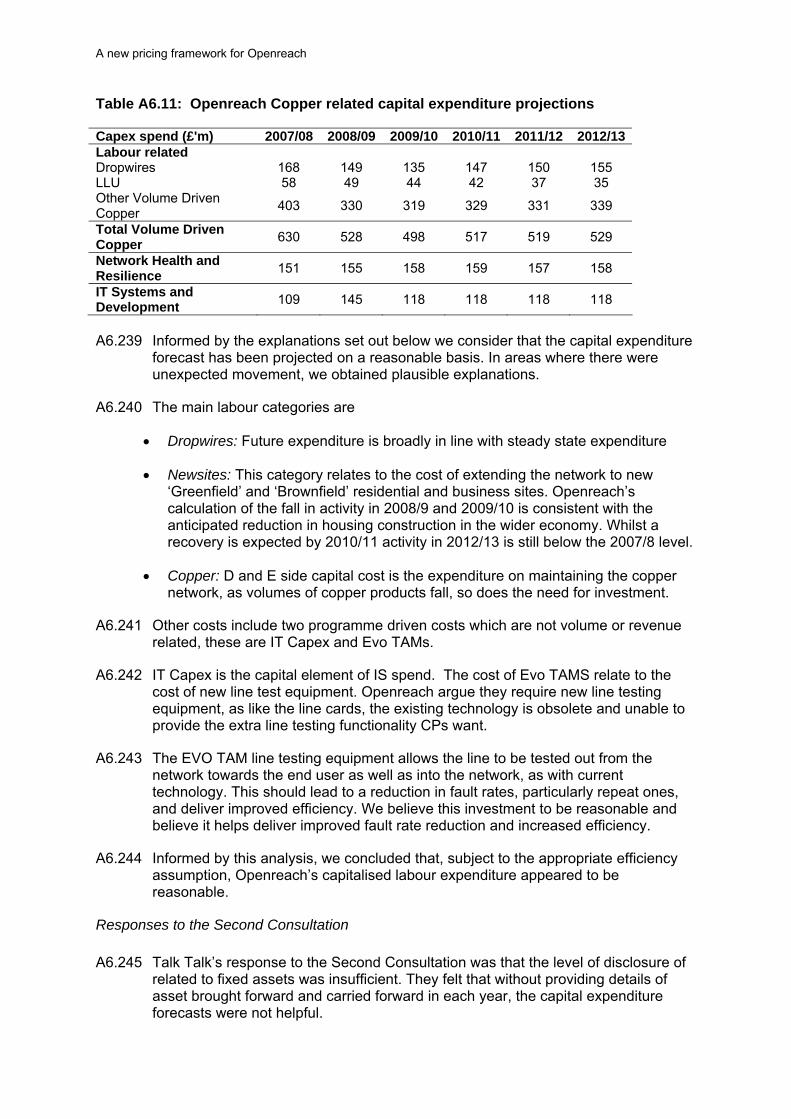
A new pricing framework for Openreach
Table A6.11: Openreach Copper related capital expenditure projections
Capex spend (£'m) 2007/08 2008/09 2009/10 2010/11 2011/12 2012/13 Labour related Dropwires 168 149 135 147 150 155 LLU 58 49 44 42 37 35 Other Volume Driven Copper
403 330 319 329 331 339
Total Volume Driven Copper
630 528 498 517 519 529
Network Health and Resilience
151 155 158 159 157 158
IT Systems and Development
109 145 118 118 118 118
A6.239 Informed by the explanations set out below we consider that the capital expenditure
forecast has been projected on a reasonable basis. In areas where there were unexpected movement, we obtained plausible explanations.
A6.240 The main labour categories are
Dropwires: Future expenditure is broadly in line with steady state expenditure
Newsites: This category relates to the cost of extending the network to new ‘Greenfield’ and ‘Brownfield’ residential and business sites. Openreach’s calculation of the fall in activity in 2008/9 and 2009/10 is consistent with the anticipated reduction in housing construction in the wider economy. Whilst a recovery is expected by 2010/11 activity in 2012/13 is still below the 2007/8 level.
Copper: D and E side capital cost is the expenditure on maintaining the copper network, as volumes of copper products fall, so does the need for investment.
A6.241 Other costs include two programme driven costs which are not volume or revenue related, these are IT Capex and Evo TAMs.
A6.242 IT Capex is the capital element of IS spend. The cost of Evo TAMS relate to the cost of new line test equipment. Openreach argue they require new line testing equipment, as like the line cards, the existing technology is obsolete and unable to provide the extra line testing functionality CPs want.
A6.243 The EVO TAM line testing equipment allows the line to be tested out from the network towards the end user as well as into the network, as with current technology. This should lead to a reduction in fault rates, particularly repeat ones, and deliver improved efficiency. We believe this investment to be reasonable and believe it helps deliver improved fault rate reduction and increased efficiency.
A6.244 Informed by this analysis, we concluded that, subject to the appropriate efficiency assumption, Openreach’s capitalised labour expenditure appeared to be reasonable.
Responses to the Second Consultation
A6.245 Talk Talk’s response to the Second Consultation was that the level of disclosure of
related to fixed assets was insufficient. They felt that without providing details of asset brought forward and carried forward in each year, the capital expenditure forecasts were not helpful.

A new pricing framework for Openreach
133
A6.246 Below we provide extra disclosure on assets, provided by Openreach which
reconcile back to BT’s opening position.
Table A6.12: CRS MCE calculation per Openreach
Opening 2007/08 2008/09 2009/10 2010/11 2011/12 2012/13
Fixed Assets 6,520 6,956 7,242 7,436 7,640 7,777
Net Current Assets 36 -122 -7 -7 -7 -7
Volume mix opening adjustment 25 24 6 -3 -3
TALCL 6,557 6,859 7,258 7,435 7,631 7,766
In Year Movements
Capex 772 685 654 733 724 735
Change in working capital -158 118 0 0 0 0
Depreciation -329 -403 -458 -509 -559 -599
Closing
Fixed Assets 6,956 7,242 7,436 7,640 7,777 7,883
Net Current Assets -122 -7 -7 -7 -7 -7
TALCL 6,834 7,234 7,428 7,633 7,770 7,876
Mean Capital Employed 6,695 7,047 7,343 7,534 7,700 7,821
Table A6.13: CRS MCE by asset type per Openreach
MCE by Asset Type £M 2007/08 2008/09 2009/10 2010/11 2011/12 2012/13
Copper 3,180 3,320 3,410 3,467 3,496 3,504
Duct 2,321 2,459 2,567 2,670 2,769 2,868
Dropwire 964 1,008 1,021 1,013 999 983
Computing 142 187 214 223 226 221
Exchange, Line Testing 121 129 132 164 214 250
Other -33 -58 -1 -2 -4 -4
Total Assets MCE £M 6,695 7,047 7,343 7,534 7,700 7,821
Conclusion
A6.247 Openreach has provided, on a confidential basis, details of its investment programme. We have reviewed and discussed this programme with Openreach and do not consider it unrealistic. We have not adjusted Openreach’s capital expenditure forecasts.
Cost of capital
Impact on costs
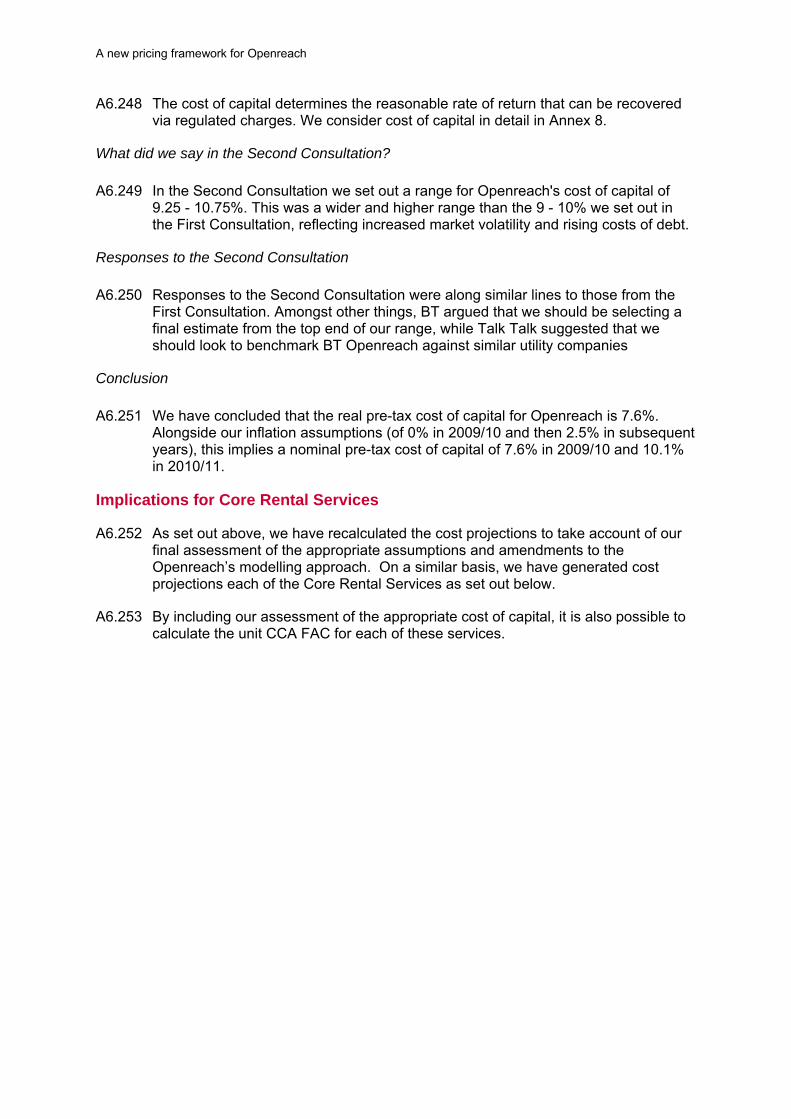
A new pricing framework for Openreach
A6.248 The cost of capital determines the reasonable rate of return that can be recovered via regulated charges. We consider cost of capital in detail in Annex 8.
What did we say in the Second Consultation?
A6.249 In the Second Consultation we set out a range for Openreach's cost of capital of
9.25 - 10.75%. This was a wider and higher range than the 9 - 10% we set out in the First Consultation, reflecting increased market volatility and rising costs of debt.
Responses to the Second Consultation
A6.250 Responses to the Second Consultation were along similar lines to those from the
First Consultation. Amongst other things, BT argued that we should be selecting a final estimate from the top end of our range, while Talk Talk suggested that we should look to benchmark BT Openreach against similar utility companies
Conclusion
A6.251 We have concluded that the real pre-tax cost of capital for Openreach is 7.6%.
Alongside our inflation assumptions (of 0% in 2009/10 and then 2.5% in subsequent years), this implies a nominal pre-tax cost of capital of 7.6% in 2009/10 and 10.1% in 2010/11.
Implications for Core Rental Services
A6.252 As set out above, we have recalculated the cost projections to take account of our final assessment of the appropriate assumptions and amendments to the Openreach’s modelling approach. On a similar basis, we have generated cost projections each of the Core Rental Services as set out below.
A6.253 By including our assessment of the appropriate cost of capital, it is also possible to calculate the unit CCA FAC for each of these services.

A new pricing framework for Openreach
135
Table A6.14: CCA costs and revenues for MPF rentals, assuming prices remain fixed in nominal terms
MPF Line rental
2007/08 2008/09 2009/10 2010/11 2011/12 2012/13
£'m £'m £'m £'m £'m £'m
Revenue 101 159 206 251 355 446
Pay 25 36 46 54 81 101
Line card and Tams 0 0 0 0 0 0
Accommodation 13 19 26 32 48 62
Stores, contractors, Service centre etc 6 9 12 14 20 24
Corporate Overheads 5 7 9 11 16 19
IT (ex depn) 7 10 12 14 21 26
Fleet 4 6 8 10 14 17
Other -1 -3 -3 -4 -6 -7
Operating Cost 58 84 109 130 193 242
EBITDA 42 75 97 120 163 204
Depreciation inc Holding gains 13 47 57 56 89 120
EBIT 30 28 40 64 74 84
ROCE% 8% 6% 6% 7% 6% 5%
Mean Capital Employed 352 498 711 899 1,321 1,692
Volumes 1,260 1,821 2,521 3,067 4,346 5,461
Table A6.15: Unit MPF Operating costs and depreciation
MPF Line rental
2007/08 2008/09 2009/10 2010/11 2011/12 2012/13
£ £ £ £ £ £
Revenue 80.00 87.23 81.69 81.69 81.69 81.69
Pay 19.53 19.77 18.19 17.45 18.53 18.52
Line card and Tams 0.00 0.00 0.00 0.00 0.00 0.00
Accomodation 10.33 10.41 10.22 10.54 10.97 11.28
Stores, contractors, Service centre etc 5.11 4.88 4.62 4.60 4.58 4.41
Corporate Overheads 3.87 3.90 3.65 3.44 3.57 3.56
IT (ex depn) 5.19 5.30 4.84 4.58 4.76 4.74
Fleet 3.41 3.45 3.20 3.23 3.23 3.07
Other -1.07 -1.46 -1.38 -1.33 -1.36 -1.30
Operating Cost 46.37 46.25 43.34 42.51 44.30 44.27
EBITDA 33.63 40.98 38.35 39.18 37.39 37.42
Depreciation inc Holding gains 9.94 25.59 22.43 18.31 20.43 22.06
Operating Cost inc depn 56.31 71.84 65.78 60.82 64.72 66.33
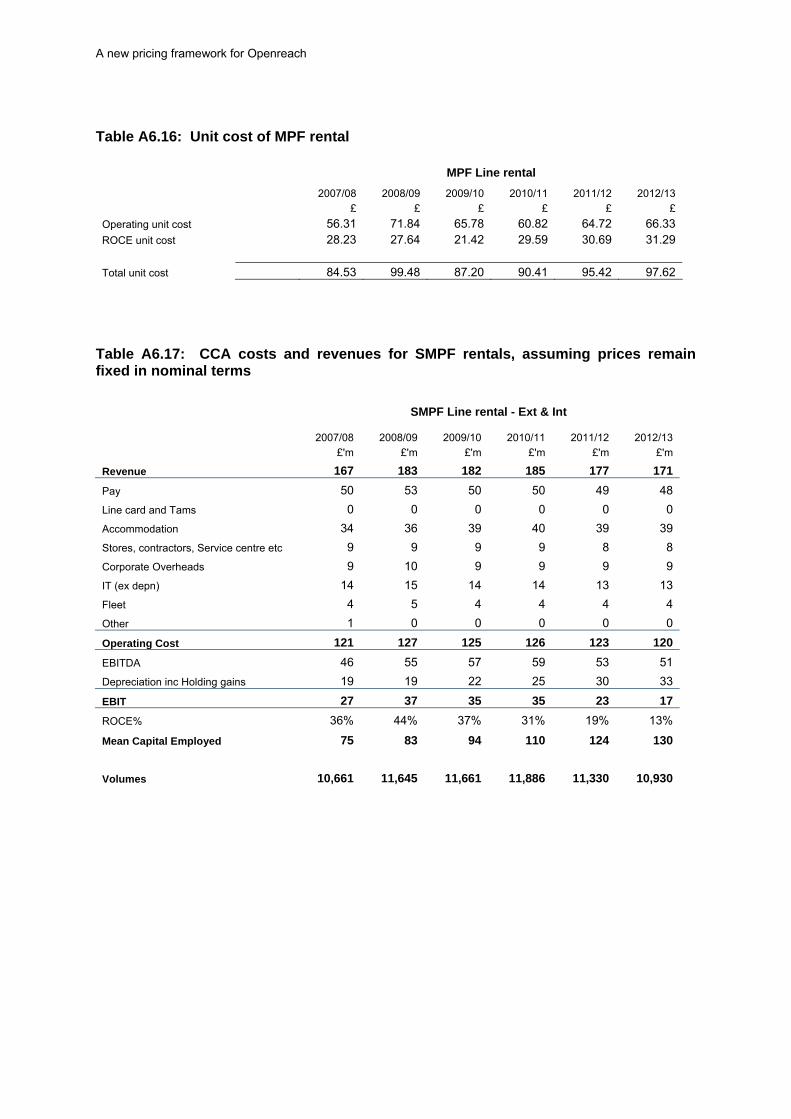
A new pricing framework for Openreach
Table A6.16: Unit cost of MPF rental
MPF Line rental
2007/08 2008/09 2009/10 2010/11 2011/12 2012/13
£ £ £ £ £ £
Operating unit cost 56.31 71.84 65.78 60.82 64.72 66.33 ROCE unit cost 28.23 27.64 21.42 29.59 30.69 31.29
Total unit cost 84.53 99.48 87.20 90.41 95.42 97.62
Table A6.17: CCA costs and revenues for SMPF rentals, assuming prices remain fixed in nominal terms
SMPF Line rental - Ext & Int
2007/08 2008/09 2009/10 2010/11 2011/12 2012/13
£'m £'m £'m £'m £'m £'m
Revenue 167 183 182 185 177 171
Pay 50 53 50 50 49 48
Line card and Tams 0 0 0 0 0 0
Accommodation 34 36 39 40 39 39
Stores, contractors, Service centre etc 9 9 9 9 8 8
Corporate Overheads 9 10 9 9 9 9
IT (ex depn) 14 15 14 14 13 13
Fleet 4 5 4 4 4 4
Other 1 0 0 0 0 0
Operating Cost 121 127 125 126 123 120
EBITDA 46 55 57 59 53 51
Depreciation inc Holding gains 19 19 22 25 30 33
EBIT 27 37 35 35 23 17
ROCE% 36% 44% 37% 31% 19% 13%
Mean Capital Employed 75 83 94 110 124 130
Volumes 10,661 11,645 11,661 11,886 11,330 10,930

A new pricing framework for Openreach
137
Table A6.18: Unit SMPF Operating costs and depreciation
SMPF Line rental - Ext & Int
2007/08 2008/09 2009/10 2010/11 2011/12 2012/13
£ £ £ £ £ £
Revenue 15.62 15.69 15.60 15.60 15.60 15.60
Pay 4.66 4.56 4.28 4.23 4.36 4.37
Line card and Tams 0.00 0.00 0.00 0.00 0.00 0.00
Accomodation 3.21 3.07 3.33 3.37 3.47 3.54
Stores, contractors, Service centre etc 0.83 0.78 0.74 0.74 0.73 0.73
Corporate Overheads 0.87 0.86 0.81 0.78 0.79 0.80
IT (ex depn) 1.32 1.30 1.20 1.17 1.19 1.20
Fleet 0.37 0.39 0.37 0.36 0.36 0.37
Other 0.08 -0.03 -0.03 -0.02 -0.02 -0.04
Operating Cost 11.33 10.93 10.70 10.62 10.89 10.97
EBITDA 4.29 4.76 4.90 4.98 4.71 4.63
Depreciation inc Holding gains 1.77 1.59 1.87 2.07 2.64 3.05
Operating Cost inc depn 13.10 12.52 12.57 12.69 13.53 14.02
Table A6.19: Unit cost of SMPF rental
SMPF Line rental - Ext & Int
2007/08 2008/09 2009/10 2010/11 2011/12 2012/13
£ £ £ £ £ £
Operating unit cost 13.10 12.52 12.57 12.69 13.53 14.02 ROCE unit cost 0.71 0.72 0.62 0.94 1.11 1.20
Total unit cost 13.81 13.24 13.18 13.63 14.64 15.22
A6.254 Below we have set out a current assess of costs for the WLR rental services, although these are subject to further review prior to the forthcoming WLR consultation, in the light of decisions on BT’s 21CN programme and market review implications.

A new pricing framework for Openreach
Table A6.20: CCA costs and revenues for residential WLR rentals, assuming prices remain fixed in nominal terms
WLR Rental - Res
2007/08 2008/09 2009/10 2010/11 2011/12 2012/13
£'m £'m £'m £'m £'m £'m
Revenue 1,774 1,688 1,631 1,599 1,381 1,267
Pay 310 309 271 254 234 214
Line card and Tams 194 192 193 198 179 152
Accommodation 161 159 146 148 134 126
Stores, contractors, Service centre etc 84 78 71 69 59 52
Corporate Overheads 62 61 55 50 45 42
IT (ex depn) 84 84 73 68 61 56
Fleet 58 57 51 50 43 38
Other 14 7 6 7 6 6
Operating Cost 967 948 865 844 761 685
EBITDA 807 740 765 755 620 582
Depreciation inc Holding gains 161 438 363 288 279 277
EBIT 647 302 403 467 341 305
ROCE% 13% 6% 9% 10% 8% 8%
Mean Capital Employed 5,044 4,760 4,670 4,751 4,247 3,969
Volumes 17,596 17,007 16,196 15,880 13,715 12,585
Table A6.21: Unit WLR residential Operating costs and depreciation
WLR Rental - Res
2007/08 2008/09 2009/10 2010/11 2011/12 2012/13
£ £ £ £ £ £
Revenue 100.84 99.26 100.68 100.68 100.68 100.68
Pay 17.64 18.19 16.74 15.98 17.05 17.04
Line card and Tams 11.04 11.31 11.89 12.49 13.06 12.08
Accomodation 9.13 9.36 9.01 9.33 9.74 10.01 Stores, contractors, Service centre etc 4.76 4.59 4.36 4.33 4.32 4.15
Corporate Overheads 3.53 3.61 3.38 3.18 3.31 3.30
IT (ex depn) 4.76 4.94 4.51 4.26 4.44 4.42
Fleet 3.31 3.37 3.12 3.16 3.16 2.98
Other 0.78 0.39 0.40 0.43 0.41 0.47
Operating Cost 54.95 55.77 53.42 53.15 55.48 54.45
EBITDA 45.89 43.49 47.26 47.53 45.20 46.23
Depreciation inc Holding gains 9.14 25.74 22.40 18.12 20.32 22.04
Operating Cost inc depn 64.08 81.51 75.82 71.27 75.79 76.48

A new pricing framework for Openreach
139
Table A6.22: Unit cost of residential WLR rental
WLR Rental - Res
2007/08 2008/09 2009/10 2010/11 2011/12 2012/13
£ £ £ £ £ £
Operating unit cost 64.08 81.51 75.82 71.27 75.79 76.48 ROCE unit cost 28.95 28.27 21.91 30.22 31.28 31.85
Total unit cost 93.04 109.78 97.73 101.49 107.07 108.34
Table A6.23: CCA costs and revenues for business WLR rentals, assuming prices remain fixed in nominal terms
WLR Rental - Bus - Ext & Int
2007/08 2008/09 2009/10 2010/11 2011/12 2012/13
£'m £'m £'m £'m £'m £'m
Revenue 646 641 579 483 549 539
Pay 93 95 79 63 76 75
Line card and Tams 64 65 62 54 65 59
Accommodation 50 51 44 38 45 46
Stores, contractors, Service centre etc 26 25 21 18 20 19
Corporate Overheads 19 19 16 13 15 15
IT (ex depn) 25 26 22 17 20 20
Fleet 18 18 15 13 15 13
Other 5 3 2 2 2 3
Operating Cost 300 302 262 218 259 249
EBITDA 346 339 317 265 291 290
Depreciation inc Holding gains 74 163 130 89 111 116
EBIT 272 176 187 176 180 175
ROCE% 17% 12% 14% 14% 13% 12%
Mean Capital Employed 1,554 1,537 1,433 1,241 1,461 1,459
Volumes 5,853 5,814 5,261 4,391 4,995 4,900

A new pricing framework for Openreach
Table A6.24: Unit WLR business Operating costs and depreciation
WLR Rental - Bus - Ext & Int
2007/08 2008/09 2009/10 2010/11 2011/12 2012/13
£ £ £ £ £ £
Revenue 110.32 110.21 110.00 110.00 110.00 110.00
Pay 15.85 16.32 15.02 14.32 15.30 15.27
Line card and Tams 10.93 11.19 11.77 12.36 12.93 11.95
Accomodation 8.53 8.74 8.42 8.72 9.10 9.35 Stores, contractors, Service centre etc 4.45 4.30 4.08 4.06 4.05 3.88
Corporate Overheads 3.20 3.27 3.07 2.88 3.01 2.99
IT (ex depn) 4.34 4.49 4.11 3.88 4.04 4.02
Fleet 3.06 3.10 2.87 2.91 2.91 2.73
Other 0.81 0.45 0.46 0.48 0.46 0.53
Operating Cost 51.17 51.86 49.79 49.61 51.80 50.73
EBITDA 59.15 58.35 60.21 60.39 58.20 59.27
Depreciation inc Holding gains 12.72 28.12 24.65 20.29 22.24 23.61
Operating Cost inc depn 63.89 79.98 74.45 69.90 74.03 74.34
Table A6.25: Unit cost of business WLR rental
WLR Rental - Bus - Ext & Int
2007/08 2008/09 2009/10 2010/11 2011/12 2012/13
£ £ £ £ £ £
Operating unit cost 63.89 79.98 74.45 69.90 74.03 74.34 ROCE unit cost 26.82 26.71 20.70 28.54 29.54 30.07
Total unit cost 90.71 106.69 95.14 98.44 103.57 104.41
Implications for Ancillary Services
A6.255 We have updated our calculation of the costs and revenues across the Ancillary baskets if prices were to remain at their current levels. Our updated calculations are as follows:
MPF ancillary services total
2008/09 2009/10 2010/11 2011/12 2012/13
£'m £'m £'m £'m £'m
Revenue 39 47 44 63 59 Operating Cost 45 55 40 41 37
EBITDA -6 -8 4 22 22 Depreciation 5 6 5 7 7
EBIT -11 -13 -1 16 15 Mean Capital Employed 46 49 47 51 48

A new pricing framework for Openreach
141
SMPF ancillary services total
2008/09 2009/10 2010/11 2011/12 2012/13
£'m £'m £'m £'m £'m
Revenue 177 130 132 117 115 Operating Cost 213 170 167 145 135
EBITDA -35 -39 -35 -29 -20 Depreciation 10 11 14 18 20
EBIT -45 -50 -50 -47 -40 Mean Capital Employed 45 60 71 72 72
Comingling services total
2008/09 2009/10 2010/11 2011/12 2012/13
£'m £'m £'m £'m £'m
Revenue 112 138 152 144 181 Operating Cost 133 184 183 162 192
EBITDA -21 -46 -31 -18 -10 Depreciation 7 10 11 11 13
EBIT -28 -56 -42 -29 -23 Mean Capital Employed 60 76 77 74 76
A6.256 For the reasons provided in the Second Consultation and set out above, we consider that it the control on each basket should be separate, but the level of permitted annual increases will be the same for each basket, based on the average price changes across all of these baskets necessary to allow prices to rise to meet the projected costs of providing all services across all baskets.
A6.257 On the basis, the aggregate costs and revenues across the Ancillary baskets (if prices were to remain at their current levels), would be as follows:
Total ancillary services
2008/09 2009/10 2010/11 2011/12 2012/13
£'m £'m £'m £'m £'m
Revenue 329 315 328 324 355 Operating Cost 391 408 390 348 363
EBITDA -63 -93 -62 -24 -8 Depreciation 22 26 30 36 41
EBIT -85 -119 -92 -61 -49 Mean Capital Employed 151 184 194 196 196
A6.258 We are then seeking to set basket controls to ensure that the weighted average
returns for Openreach on these baskets allow Openreach to recover their WACC.
A6.259 In setting these controls, we have also to allow for the proposed variation in starting charges and individual sub-caps for MPF new provide, MPF transfer and SMPF connections as set out in Section 6 and Annex 10.
A6.260 Given these factors we reach controlling X’s of 0% and RPI+1.6% respectively for 2009/10 and 2010/11.

A new pricing framework for Openreach
A6.261 While we originally consulted on the basis of an RPI related control for 2009/10, as we are now in a position to confirm inflation for the first year we are setting the controlling interest without reference to RPI for that year.
Transparency of analysis
A6.262 We regard effective consultation as an important opportunity for stakeholders to assist us reaching a decision at the right time and in the right way on the information available. We therefore attached particular importance to the views of some respondents to the First Consultation, who stated that greater disclosure of the data underlying the case for price changes was needed.
A6.263 As a result, we decided to disclose much more detailed information in the Second Consultation, together with the three additional consultants’ reports published on 6 January on our website[1], to ensure that a high level of detailed data was published. We considered that this additional amount of disclosed data provided enough data to enable all stakeholders to make effective and intelligent responses. In so doing, we also worked closely with BT with a view to it consenting to data being disclosed to the greatest possible extent or to find alternative ways in disclosing its commercially sensitive or confidential information.
A6.264 We also presented our proposals to make clear among other things the assumptions and factors we would apply in assessing final charges within each respective range of proposed price ceilings followed by our proposed indexation (see, in particular, as summarised in Section 5 of the Second Consultation).
A6.265 In light of this further disclosure and transparency, several respondents to the Second Consultation commented favourably on the level of disclosure of financial evidence in the Second Consultation. For example, C&W noted that:
“We welcome the fact that this consultation contains a lot of detailed information on BT’s costs”.
A6.266 Other stakeholders acknowledged that the depth of cost data and information provided in the Second Consultation was greater than that provided in similar consultations in the past.
A6.267 However, Talk Talk maintained that the level of disclosure in the Second Consultation was still insufficient, particularly to allow it to properly scrutinise the assumptions. For example, it stated in its response that:
“We have been provided with a paltry level of transparency, which combined with the short timescales has severely limited our ability to properly scrutinise the numbers”
A6.268 Talk Talk also said that Ofcom had failed to ensure that BT’s cost model had been audited by an external firm. It therefore requested access to the cost model that Ofcom has used to derive the cost estimates because Talk Talk considered that its ability to engage fully and effectively in the consultation process could only be met by such access.
[1] http://www.ofcom.org.uk/consult/condocs/openreachframework/reports/

A new pricing framework for Openreach
143
A6.269 Further, Talk Talk invited alternatively Ofcom to establish a confidentiality ring through which further data could, in its opinion, be shared with its representatives and professional advisors.
A6.270 We have carefully considered these responses, especially Talk Talk’s calls for further disclosure, access to the model and the establishment of a confidentiality ring. We have particularly done so to ensure that we have consulted fairly, in addition to our own regulatory principle that attaches importance to effective consultations. We also recognise that stakeholders will generally prefer greater disclosure rather than less. We also believe that the disclosure considered helpful by one party will be different from that wanted by another.
A6.271 We have, however, reached the conclusion that the information already disclosed in the Second Consultation, together with the three additional consultants’ reports, contain a high level of detailed data that would provide enough data to enable all stakeholders to make effective and intelligent responses. In our opinion, this level of disclosure of our financial analysis, coupled with our access to - and presentation of - Openreach’s own view of its future costs has ensured that stakeholders were sufficiently well-informed to respond effectively to our proposals.
A6.272 Stakeholders have also had the opportunity to provide their views on, in particular, the key determinants constituting the most basic features of our proposals having a material impact on our final choice of price changes. From that information, we also believe that stakeholders have had the ability to consider the impact of our proposals on their businesses. Indeed, the detailed nature of the responses we have received is consistent with this view as they show that our proposals have been rigorously tested by respondents.
A6.273 We disagree with Talk Talk that it has been unable to engage fully and effectively in the consultation process by not having access to the model. The BT cost model consists, in fact, of three separate models (as explained at paragraph A7.7 of the first consultation document), namely:
The activity based costing (ABC) model. This cost forecast model is used to forecast the labour related requirement based forecast volumes (connections, rentals) etc. The most important assumptions are product volumes, labour task times (for example how long to provide a new copper wire connection), labour activity ratios (for example how many visits per network repair) and FTE labour rates. The model also contains Openreach’s efficiency and inflation assumptions. The output of the model is the aggregate labour related costs which are linked into the Oak cost allocation model. The assumption and data sheets contain confidential information relating to labour rates and task times headings, a number of which are outside the scope of this review. Within the cost forecast model, there are several ‘mini models’, such as one that calculates the cost of line cards.
The Oak allocation model (The Oak model). The output from the cost forecast model is dynamically linked into this model. The Oak model also includes several overlays of static cost information. The two main ones are Transfer Charges and Fixed Assets. The Transfer charges are determined in a Transfer charges paper and the outputs entered into the Oak model. The fixed assets are calculated in a separate RAV model. The Oak model calculates non labour related efficiencies and has several overlays for adjustments, principally regulatory adjustments. The total costs are allocated by three separate methods to nine activities, consisting of nearly 90 sub

A new pricing framework for Openreach
activities. These activities are then allocated by around 30 different methods to the various products.
The RAV model. This model values all BT’s copper and duct asset base on a CCA and HCA basis and contains all asset registration values going back as far as 1937 It separates the pre 1997 RAV assets which need to calculated on an indexed HCA basis and the post 1997 assets which are calculated on a CCA basis. It forecasts additions and disposals and forecasts the RAV adjustment – the difference between the indexed HCA valuation and the CCA valuation for the RAV assets. These are statically included in the Oak allocation model.
A6.274 As is clear from above descriptions, the modelling is both a highly complex interlinked structure and one that draws extensively on confidential processes within BT. Our consultation has presented the key information derived from the model. As set out above, the key determinants of the proposed charge levels have also been presented to stakeholders for consultation.
A6.275 As regards confidentiality, Talk Talk considers that little of the data it wishes to be disclosed will truly be confidential and, even where there is a legitimate confidentiality concern, a confidentiality ring would overcome this concern. Whilst we have considered Talk Talk’s suggested use of a confidentiality ring, we do not consider it an appropriate way of proceeding in the present case. In this regard, we have had particular regard to section 393(1) of the Communications Act 2003 that imposes a general restriction on disclosure by Ofcom of information with respect to BT’s business unless BT consents.
A6.276 That restriction (which is not confined to confidential information) does not apply to any disclosure of information which is made for the purpose of facilitating the carrying out by Ofcom of any of its functions (i.e. the gateway for disclosure in section 393(2)(a)), such as our function to consult on our proposals. But the criminal sanction that attaches to the general prohibition appears to provide a clear direction to Ofcom that, so far as practicable, we should have regard to the need to preserve commercial confidentiality. As we consider that all relevant facts, evidence and the economic context have been made available for consultation, we could not rely on that gateway for disclosure.
A6.277 Finally, the consultation period was also extended by two weeks to ensure that stakeholders had sufficient time to consider the proposals. Overall, stakeholders have had at least 13 weeks in which to respond to the Second Consultation (in addition to the 10 weeks allowed for responses to the First Consultation). By way of comparison, our published consultation principles state that we will consult for up to 10 weeks depending on the potential impact of our proposals. We are satisfied that our consultation period has provided adequate time for stakeholders to review and respond to our proposals.
Reconciliation
A6.278 As noted earlier in this Section, one of Talk talk’s particular concerns was that the Second Consultation did not provide it with sufficient confidence in the cost modelling. Specifically, it argues that the differences between the regulatory accounts and the cost modelling have not been adequately explained. We therefore requested that Openreach provided a detailed reconciliation between the regulatory accounts and its assessment of costs that formed the basis of our cost modelling. The reconciliation is set out below.

A new pricing framework for Openreach
145
Reconciliation of the returns shown in the Regulatory Statements for 2007/8 to Openreach base case model.
Core Rental Services
Connections and other Total Market60
£m £m £m
Wholesale Residential Line Services 363 11 374
Wholesale Residential Line Services 195 (18) 177
Wholesale Local Access (LLU) (5) (4) (9)
553 (11) 542
WLR Res WLR Bus MPF SMPF Core
Rental Services
£m £m £m £m £m Returns for core services in regulatory statements 363 195 3 (8) 553 Exclusion of one-off CCA adjustments (principally Dropwires) (note 1)
136 43 7 0 186
RAV adjustments (note 4) 22 7 0 0 29
Pension Deficit (note 8) (34) (10) (3) (5) (52) Light User Scheme (note 9) (27) (8) (2) (4) (40) Internal LLU & SMPF (note 11) (0) 34 33 Line cards (note 12) (9) (3) (12) Other differences in costs and allocations (note 13) 6 8 13 (2) 24 Returns for core services in Openreach base case model
458 232 18 15 722
Note 1. Once off CCA adjustments WLR Res WLR Bus MPF SMPF Core
Rental Services
£m £m £m £m £m
Dropwire Revaluation (note 2) 140 44 7 0 191
Internal Accommodation revaluation (note 3) (4) (1) 0 0 (5)
Exclusion of one-off CCA adjustments (principally Dropwires)
136 43 7 0 186
Note 2. Dropwire revaluation
Supplementary Depreciation
Price Holding
(Gains) / Losses
Other CCA adjustments
Total CCA Adjustment
£m £m £m £m Business Dropwire 17 (19) 79 77
60 P115 of BT’s 2008 regulatory financial Statements

A new pricing framework for Openreach
Residential Dropwire 25 (25) 117 117 42 (44) 196 194 Allocated to non core rental services (5) 191
A6.279 BT reviewed the indices used to value Dropwires in the 2007/8 Regulatory financial statements which led to a one off devaluation of the dropwire asset and one-off 'write down'. BT recognised that this is a one-off adjustment and accordingly has removed it as part of the normalisation process within the Openreach base case model
Note 3. Internal Accommodation
A6.280 BT changed the method used to value the ACPN class of work from CCA basis to a HCA basis in 2007/08 resulting in a one-off gain in asset value and a corresponding credit to the regulatory financial statements. BT recognised that this credit is a one-off adjustment and has accordingly removed it as part of the normalisation process within the Openreach base case model.
Note 4. RAV adjustments
A6.281 The previous reconciliation of (£29m) in the second consultation showed this adjustment with the incorrect sign – the £58m difference included in ‘Other adjustments’ (note 13)
Analysis of Duct RAV adjustment WLR Res WLR Bus MPF SMPF Core Rental
Services £m £m £m £m £m Piper adjustment, not shown in RAV model (note 5) (60) (18) (0) 0 (78) Other Adjustments, not shown in RAV model 0 0 0 0 0 RAV - pure RAV adjustment (note 6) 54 16 0 0 70 Normalisation of RAV price holding gain 7 2 0 0 9 Total RAV and Normalisation on Duct 1 0 0 0 1 Analysis of Copper RAV adjustment WLR Res WLR Bus MPF SMPF Core
Rental Services
£m £m £m £m £m Piper adjustment, not shown in RAV model (note 5) (167) (49) (0) 0 (216) Other Adjustments, not shown in RAV model (note 7) 160 47 0 0 207 RAV - pure RAV adjustment (note 6) 5 1 0 0 6 Normalisation of RAV price holding gain 24 7 0 0 31 Total RAV and Normalisation on Copper 22 6 0 0 28 Total RAV adjustment 22 7 0 0 29
Note 5. Piper. A6.282 The regulatory financial statements included a holding gain and increase in asset
values due to the Piper project, which effectively increased the asset inventory for

A new pricing framework for Openreach
147
access copper cable and duct. Because of the way the mechanics of the RAV valuation model works, all additional assets are considered to be pre-1997. Since the RAV model values pre-1997 assets based on original book value, this increase in asset values does not add to the RAV valuation and therefore this adjustment reverses out all Piper adjustments.
Note 6. RAV adjustment
A6.283 The regulatory financial statements revalue all assets on CCA basis using an Modern Equivalent Asset methodology. However, for the purposes of price control we require BT to use a Regulatory Asset Valuation (RAV) that only revalue’s asset installed since 1997, with pre-97 assets carried forward at conventional historic accounting 'book values' to 2005 and indexed using RPI thereafter. This adjustment moves the costs from full CCA to RAV, and represents an increase in depreciation costs and a decrease in holding gains (since less asset are being revalued).
Note 7. Other adjustments
A6.284 Other CCA adjustments have been made in the 2007/08 Regulatory Statements and reflect capital spend incurred in replacing or renewing existing cable that is already valued within the modern equivalent assets methodology. BT has removed these adjustments as part of the normalisation process.
Note 8. Pension Deficit.
A6.285 BT included costs within their base case relating to Openreach’s contribution to the then identified £280m pension deficit. In the statutory financial statements (on which the Regulatory financial statements are based) BT follows international accounting standards and its treatment of pension costs, assets and liabilities is in accordance with IAS 19. The net pension asset or liability, as calculated under IAS19, is included on the balance sheet, and the cash deficit payment appears as part of the movement between the opening and closing balances of the net pension liability.
Note 9.Light User Scheme.
A6.286 BT originally included of costs relating to the LUS scheme within their base case. This includes the cost of administration of the scheme and forgone revenue. Within BT’s regulatory financial statements these amounts are correctly excluded from the relevant SMP Wholesale markets, as directed by Ofcom.
Note 10. Northern Ireland WLR Res WLR Bus MPF SMPF Core
Rental Services
£m £m £m £m £m Revenue 59 23 0 0 82 Costs 48 16 2 1 67 EBIT 11 7 -2 -1 15
A6.287 Openreach’s geographic cover, as defined by the undertakings, does not extend to
Northern Ireland. Therefore all volumes, revenues, costs and assets included within the Openreach base case model excludes Northern Ireland. The assumption is that

A new pricing framework for Openreach
the cost to provide services in Northern Ireland are similar to that in the rest of UK but as Northern Ireland volumes only make up c 4% of the total then any differences cannot be material. Access services in Northern Ireland are run by a division within BT Retail. Group Overheads are charged to BT Retail on the same basis as Openreach.
Note 11. Internal LLU and SMPF
A6.288 The regulatory accounts includes all internally sold SMPF lines, but for MPF it only includes MPF lines used for SDSL, whereas as the base case model also includes MPF lines used for FeatureNet. Openreach’s base case included 410,000 internal MPF lines, of which 400,000 are used for FeatureNet.
A6.289 The BT base case reflects all internal LLU (MPF and SMPF) consumption, irrespective of what the LLU line is used for.
Note 12. Line cards
A6.290 There are two differences;
(1) Accounting differences (£36m reduction in return): Line cards sit outside of Openreach and therefore are not included on the Openreach balance sheet, but Openreach pays BT Operate a transfer charge that includes all costs and cost of capital. The returns disclosed in the regulatory statements are higher than in the Openreach model because it only includes costs, but the asset values are also higher. Fully Allocated Cost (FAC) is the same both cases.
(2) One-off CCA holding losses (£24m increase in return): The RFS included a write down on Line cards attributable to a correction of net CCA value. BT recognised that this not a 'normal' cost of line cards and so has removed it from the base case model.
Note 13. Other adjustments
A6.291 These items represents residual differences between the base case model and the Regulatory Financial Statement not dealt with individually. This last variance must be caused by differences in cost allocations.

A new pricing framework for Openreach
149
Reconciliation of the MCE shown in the Regulatory Statements for 2007/8 to Openreach base case model.
Core Rental
ServicesConnections and
otherTotal Market61
£m £m £m
Wholesale Residential Line Services 5,858 17 5,875
Wholesale Residential Line Services 1,767 90 1,857
Wholesale Local Access (LLU) 301 174 475
7,926 281 8,207
WLR Bus WLR Res MPF SMPF Core
Rental services
£m £m £m £m £m Regulatory Statements Published MCE 5,858 1,767 258.8 42.3 7,927 Adjustments for RAV and CCA smoothing (note 1) Dropwire revaluation (70) (22) (3) 0 (95) RAV adjustment (Duct) (465) (137) (21) 0 (623) RAV adjustment (Copper) 84 25 4 0 112 MCE adjusted for RAV and CCA smoothing 5,407 1,633 238 42 7,320 Adjustment for Internal LLU (Regulatory Statements definition) (note 2)
3 16 19
Differences in allocations (note 3) (80) 50 101 13 83 Notional Debtors adjustment (note 4) (76) (35) (1) (0) (112) Assets held outside of Openreach: Fleet (53) (16) (3) (1) (73) Land & Buildings (30) (9) (1) (2) (42) BT Operate (principally Line Cards) (357) (112) (1) (0) (470) Northern Ireland (note 5) (139) (41) (6) 1 (185) Other Group Fixed Assets (27) (8) (1) (2) (39) Group Current Assets / Liabilities 139 43 5 7 193 Total Assets held outside of Openreach (467) (144) (7) 3 (615) Openreach base case model (note 6) 4,783 1,503 334 74 6,695
Note 1. One off CCA adjustments A6.292 The regulatory statements include the revaluation of dropwires in the closing
balance asset values but not in the opening balance therefore as part of the
61 P117 of BT’s 2008 regulatory financial Statements
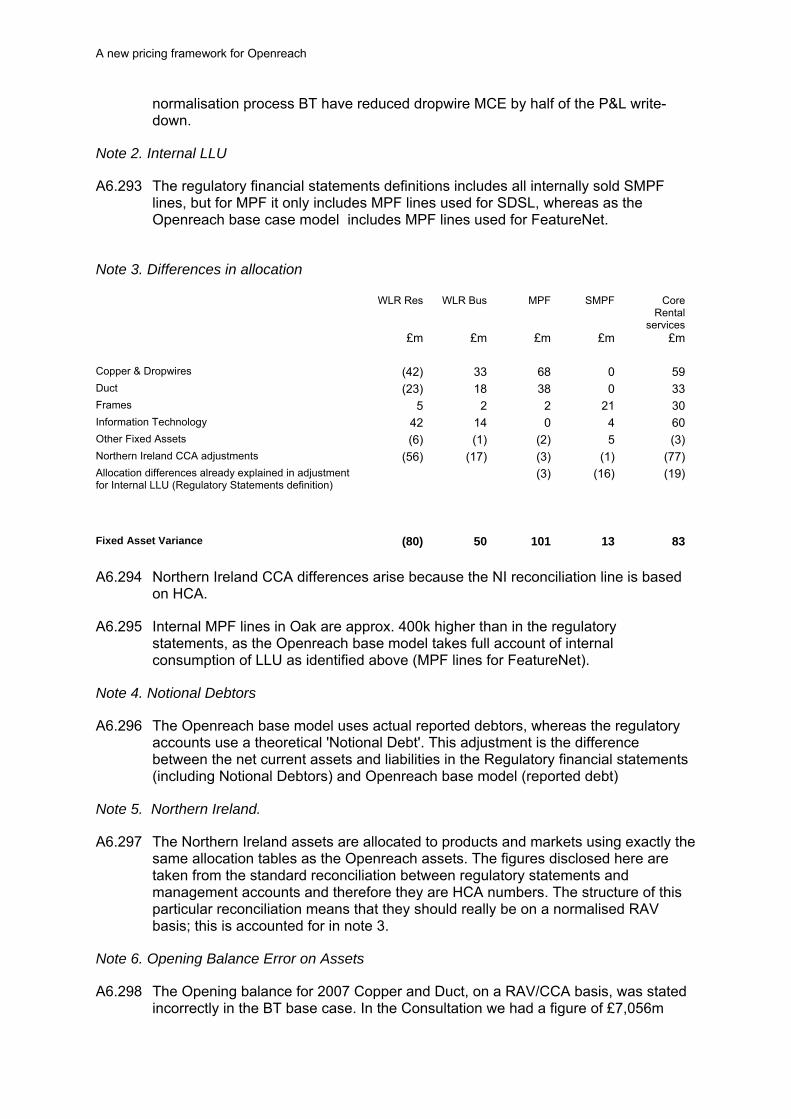
A new pricing framework for Openreach
normalisation process BT have reduced dropwire MCE by half of the P&L write-down.
Note 2. Internal LLU
A6.293 The regulatory financial statements definitions includes all internally sold SMPF lines, but for MPF it only includes MPF lines used for SDSL, whereas as the Openreach base case model includes MPF lines used for FeatureNet.
Note 3. Differences in allocation
WLR Res WLR Bus MPF SMPF Core
Rental services
£m £m £m £m £m Copper & Dropwires (42) 33 68 0 59 Duct (23) 18 38 0 33 Frames 5 2 2 21 30 Information Technology 42 14 0 4 60 Other Fixed Assets (6) (1) (2) 5 (3) Northern Ireland CCA adjustments (56) (17) (3) (1) (77) Allocation differences already explained in adjustment for Internal LLU (Regulatory Statements definition)
(3) (16) (19)
Fixed Asset Variance (80) 50 101 13 83
A6.294 Northern Ireland CCA differences arise because the NI reconciliation line is based
on HCA.
A6.295 Internal MPF lines in Oak are approx. 400k higher than in the regulatory statements, as the Openreach base model takes full account of internal consumption of LLU as identified above (MPF lines for FeatureNet).
Note 4. Notional Debtors
A6.296 The Openreach base model uses actual reported debtors, whereas the regulatory accounts use a theoretical 'Notional Debt'. This adjustment is the difference between the net current assets and liabilities in the Regulatory financial statements (including Notional Debtors) and Openreach base model (reported debt)
Note 5. Northern Ireland.
A6.297 The Northern Ireland assets are allocated to products and markets using exactly the same allocation tables as the Openreach assets. The figures disclosed here are taken from the standard reconciliation between regulatory statements and management accounts and therefore they are HCA numbers. The structure of this particular reconciliation means that they should really be on a normalised RAV basis; this is accounted for in note 3.
Note 6. Opening Balance Error on Assets
A6.298 The Opening balance for 2007 Copper and Duct, on a RAV/CCA basis, was stated incorrectly in the BT base case. In the Consultation we had a figure of £7,056m

A new pricing framework for Openreach
151
.However, the Closing Balance for 2007 Copper and Duct, on a RAV/CCA basis was correct. As a result, there is no flow through impact for any of the years from 2008/09 onwards, which are all based on the correct “starting number” (i.e. the closing balance for 2007).
A new pricing framework for Openreach
Annex 7
7 Volume forecasts Introduction
A7.1 In the Second Consultation, we explained that future demand projections have a significant impact on aggregate and unit costs for the following reasons:
the existence of fixed costs means that unit costs will increase if volumes fall, because the fixed costs must be recovered over fewer lines;
a shift in demand, from WLR (which makes a relatively high per-unit contribution to fixed costs) to MPF (which makes a lower contribution), puts further pressure on charges if the total contribution to fixed costs is to be maintained;
a reduction in demand for SMPF (which makes a positive contribution to fixed overheads) puts additional upward pressure on charges of all services if the total contribution to fixed costs is to be maintained.
A7.2 In the Second Consultation, we set out a demand projection provided by Openreach. We explained that we considered that this projection represented a plausible outcome and provided an alternative volume scenario.
A7.3 We explained that we recognised the difficulties associated with long term forecasts of this nature – our modelling period is out to 2012/13. We, therefore, stated that we were very keen to get stakeholder views on the future level of demand and the likely changes in the mix of demand for the different wholesale access services.
A7.4 As set out below there have been some significant development in the external market and the product development plans of BT which have an impact on our volume expectation. This Annex sets out the volume scenario we have used to model Openreach’s costs which is informed by the stakeholder views set out in the responses to the Second Consultation, and explains why we consider this provides an appropriate basis for our calculations.
The Second Consultation
A7.5 The cost calculations provided by Openreach considered in the Second Consultation was based on a volume scenario that proposed the following trends:
a reduction in the aggregate demand for fixed lines, from 24.7 million lines in 2008/09 to 23.0 million in 2012/13;
a substantial shift in demand from WLR to MPF, driven by increases in internal and external demand for MPF; and
a reduction in demand for SMPF, from 10.7 million lines in 2008/09 to 3.5 million in 2012/13.
A7.6 We stated in the Second Consultation that we considered that the volume scenario presented by Openreach represents a plausible outcome without necessarily being the most likely outcome. Specifically, as set out below, we suggested that:

A new pricing framework for Openreach
153
Openreach’s projected reduction in the aggregate demand for fixed lines, may be overstated; the decline in demand for fixed lines is likely to continue but Openreach’s projected decline appears to sit at the high end of a plausible range; and
Openreach’s projections may overstate the rate of migration from WLR to MPF and may overstate the likely reduction in demand for SMPF as a result; the rate of migration to MPF reflected in Openreach’s volume scenario probably sits at the high end of a reasonable range.
o External MPF demand appeared was discounted given the risk of individual CP double counting of demand;
o Internal MPF was discounted due to the risk linked to NGN roll out delays.
A7.7 We proposed, therefore, the following ranges of outcomes for total line numbers and MPF:
A reduction in total lines over the period of between 3.5% and 7%.
External (non BT CPs) MPF growth of between 3.9 million - 4.8 million.
Internal (BT use) MPF growth of between 9 million – 10.9 million.
A7.8 However, we recognised the difficulties associated with long term forecasts of this nature and sought stakeholder views on the future level of demand and the likely changes in the mix of demand for the different wholesale access services.
Responses to the Second Consultation
A7.9 There was a detailed level of response on the volumes issue by Openreach and other stakeholders, though a large number of the specific responses were confidential.
Total line numbers
A7.10 With respect to total volumes, most respondents aside from Openreach suggested that a trend decline near the lower end of line loss would be appropriate. One confidential response noted data from the UK Department of Communities and Local Government suggested that the absolute number of households in the UK was likely to increase an annual increase of 223,000 households annually between now and 2029. This estimate was driven by data from the Office of National Statistics about population growth but it also reflects lifestyle choices and a tendency for lower average numbers of people per household. They suggested that over the four year lifetime of the model, this average increase would generate an extra 1 million lines.
A7.11 Vodafone suggested that that Ofcom was over-estimating line reductions and that the total number should be kept constant for the following reasons:
the emergence of mobile-only households has stabilised at around 10% (with 90% of households retaining fixed lines for data services at least), and will be replaced by the underlying demographic trend of rising household numbers at the rate of 0.7% pa.;

A new pricing framework for Openreach
the ability of BT to compete against cable TV services has increased, especially with the development of the NGN and the availability of more wholesale content;
demand for second lines has now largely unwound as broadband penetration amongst households previously requiring second lines is now complete, and so this factor will not further reduce the number of BT lines.
A7.12 Openreach, on the other hand, presented a detailed analysis of why their estimate for total line loss had not materially change. In fact, they argued, the combination of lower new connections, mobile substitution and a generally weaker economy, meant that Openreach’s latest view of future demand for Core Rental Services was broadly the same in 2012/13 as their earlier projections, but slightly lower in the immediate years for 2009/10 and 2010/11. This was set out in detail in their response.
A7.13 We have reviewed the responses of stakeholders and also the evidence of actual line numbers changes from the recent quarter (over 400,000 reduction). In additional, we confirmed the volume estimates provided by BT though examination of the internal projections used in their planning obtained under formal powers (which did not expose a material difference).
A7.14 It is clear that there is a significant threat of a substantial decrease in line numbers over the next four years and particularly over the next two years. The decline in new household development, the reduction in business lines and the continuing (though levelling) trend to mobile only households suggests that BT’s estimate for total volume decline is not unreasonable.
A7.15 While we accept that the long term trends noted by other stakeholders do offer a suggestion of future increased demand in some areas, there are clearly stronger factors impacting on demand in the next four years and in particular the next two years.
A7.16 We will need to continue to monitor total demand and a substantial deviation from the estimate included at this time would be a factor in re-assessing the LLU charges at the end of the 2 year control. However, we propose to accept BT estimate of 7% as set out in their response as the basis for the charge determination as this is consistent with recent evidence of more rapid declines in line numbers.
Internal MPF demand
A7.17 New internal BT demand for MPF was based on an assumed use of MPF as the upstream component of the new 21CN network services for wholesale broadband and voice.
A7.18 A number of stakeholders noted, that following the Second Consultation, BT suspended its development of these services.
A7.19 Openreach’s response confirmed that there were no current plans to develop services for 21CN using MPF.
A7.20 Given this position, we have removed all additional (ie above current use) internal MPF demand from the model, with a redistribution of the MPF to WLR only and WLR plus SMPF in accordance with existing trends.
External MPF demand

A new pricing framework for Openreach
155
A7.21 Non-BT responses on external demand, also in most cases confidential, noted the circularity in projections between the level of demand for MPF and the ultimate regulated price. They, therefore, cautioned against taking too much account of individual company projections of future growth which may be made in the absence of a final charge determination. For example Vodafone notes that ‘Ofcom is correct to be cautious over the extent of migration. Relative rental prices will be a key determining factor, and higher MPF prices will slow this migration by making it less economic for CPs to migrate customers to MPF. There is a danger of assuming a rate of migration that results in MPF prices that ensure that the migration will not happen. We are not aware that BT Openreach has taken account of this factor in determining its own migration assumptions’.
A7.22 Openreach challenged our concerns over double-counting of demand and suggested that they did not consider that the MPF charge would have a material impact on the level of demand. They went further to suggest that recent announcement by other Communications Providers, particularly Sky, of an intention to migrate to full LLU would suggest a higher level of external MPF than was proposed in their original estimates of between 5.6 million and 6.0 million lines.
A7.23 We have reviewed the evidence presented by stakeholders, the recent level of MPF growth and reports from CPs and again confirmed BT estimates through examination of the internal estimates used within BT obtained by formal powers.
A7.24 The evidence provided by the above suggests that the current growth path for MPF is close to the projection provided by Openreach prior to the Second Consultation, that is the top of our previous range. However, the arguments provided by Openreach for a increase in MPF substantially above that provided last year are not compelling – while there is clear intention by some operators to increase MPF use significantly the projections provided by Openreach appear relatively optimistic in the current market where there may be some industry consolidation.
A7.25 Accordingly, we are proposing to use as our volume assumption for internal MPF, a volume projections just above the top of our range in the Second Consultation at 5.0 million lines.
Conclusion
A7.26 Below are the volumes for core rental services and total line numbers we are using in our modelling.

A new pricing framework for Openreach
Table A7.1: Volumes for core rental services and total line numbers
Product Description Unit 2008/09 2009/10 2010/11 2011/12 2012/13
WLR Rental - Res - BT # '000s 14,803 13,357 12,068 11,264 10,025
WLR Rental - Bus - BT # '000s 4,636 4,608 3,416 3,245 3,115
SMPF Line rental - BT # '000s 8,011 7,861 7,927 8,080 8,170
MPF Line rental BT # '000s 384 376 432 446 461
WLR Rental - Res – Non-BT # '000s 2,204 2,839 3,812 2,451 2,560
WLR Rental - Bus – Non-BT # '000s 1,178 653 975 1,750 1,785
SMPF Line rental – Non-BT # '000s 3,634 3,800 3,959 3,250 2,760
MPF Line rental – Non-BT # '000s 1,437 2,145 2,635 3,900 5,000
WLR Rental - Res - Total # '000s 17,007 16,196 15,880 13,715 12,585
WLR Rental - Bus - Total # '000s 5,814 5,261 4,391 4,995 4,900
SMPF Line rental - Total # '000s 11,645 11,661 11,886 11,330 10,930
MPF Line rental - Total # '000s 1,821 2,521 3,067 4,346 5,461
Total Lines (ie excluding SMPF) 24,642 23,978 23,338 23,056 22,946

A new pricing framework for Openreach
157
Annex 8
8 Cost of Capital Summary
A8.1 In the First and Second Consultations we set out our views on the proposed approach to estimating Openreach’s cost of capital. In this annex we refine our view with recent estimates, taking into account responses and additional analysis, culminating in final point estimates of the cost of capital for the BT businesses in question.
A8.2 In the Second Consultation, we noted that international capital markets had deteriorated since the First Consultation, with a number of financial institutions failing or receiving substantial state funding, both in the UK and the rest of the world. This process has continued, and has been accompanied by a move towards a global recession.
A8.3 The level of uncertainty in markets, both equity and credit, is no less significant than at the time of the Second Consultation. We noted previously that cost of capital inputs had changed materially between the First and Second Consultations. While inputs have not changed as much in the period since the Second Consultation, this is still a period in which great care needs to be taken in separating short-term and long-term effects.
A8.4 As in the Second Consultation, we also look at the impact of using current spot rates to determine the cost of capital for BT and Openreach. As we note below, these estimates are purely illustrative, as we are not confident that current market rates provide a reliable indicator of composite capital costs over the next few years.
A8.5 In the First Consultation, we proposed an estimated range for Openreach’s pre-tax nominal WACC of 9 – 10% (versus the 2005 figure of 10.0%), and 10 – 11% for the rest of BT (versus the 2005 figure of 11.4%). These ranges were consistent with a BT Group range of 9.5 – 10.5%.
A8.6 In the Second Consultation we took account of changes to the parameters of the WACC estimates and re-calculated our range of estimates for Openreach’s pre-tax nominal WACC to 9.25 – 10.75%. Our proposed range for the pre-tax nominal WACC for the rest of BT was 10.25 – 11.75%. These ranges were consistent with a BT Group range of 9.75 – 11.25%.
A8.7 In the Final Statement we have taken account of all responses, and changes to the parameters of the cost of capital in order to arrive at a final point value of 10.1% for Openreach’s pre-tax nominal WACC. Our final value for the rest of BT is 11.0%. These are consistent with a BT Group WACC of 10.6%.
A8.8 Our calculations are based on the following range of estimates.

A new pricing framework for Openreach
Table A8.1: Openreach, BT Group and Rest of BT Cost of Capital
Openreach BT Group Rest of BT
Equity Risk Premium 5% 5% 5%
Equity Beta 0.76 0.86 0.96
Risk-free rate62 4.5% 4.5% 4.5%
Debt premium 3% 3% 3%
Pre-tax nominal WACC 10.1% 10.6% 11.0%
A8.9 In arriving at these values, we have, amongst other things, had regard to Section 3(4)(d) of the Communications Act 2003; i.e. to have regard to the desirability of encouraging investment and innovation in relevant markets when exercising our duties.
A8.10 Ofcom has a duty to promote efficient investment, and as such should set rates of return at a level that allows a reasonable return on investment and encourages future efficient investment.
A8.11 We would note that these rates of return do not apply in the case of Next Generation Access investment (see Ofcom’s recent paper entitled “Delivering super-fast broadband in the UK”63).
Equity Risk Premium (“ERP”)
Key parameter in CAPM
A8.12 The ERP is a key component of the estimate of a company’s WACC.
A8.13 Under the CAPM the ERP represents the extra return that investors require as a reward for investing in equities rather than a risk-free asset. It is market-specific, not company-specific.
A8.14 Academics and other users of the CAPM have conducted a large number of investigations into the value of the ERP, using quantitative techniques and surveys. These have produced a range of widely differing estimates, which means that we (and other economic regulators) have to choose a value from within the plausible range implied by these studies.
A8.15 Our approach to estimating the ERP is as set out in the 2005 Final Statement.
62 The nominal risk-free rate given here is for years 2 – 4 of the charge control, when we assume inflation of 2.5% p.a. In year 1, our inflation assumption is actually 0%, which would be associated with a nominal risk-free rate of 2.0%, and a pre-tax nominal WACC of 7.6% for Openreach. Note that under a current cost accounting model, the allowed return on capital employed is partially delivered by inflationary holding gains on capital employed; this means that when lower inflation leads to a lower nominal WACC, the reduced return allowed will be delivered by lower holding gains as these are linked to inflation also. So when inflation is assumed to be zero, there will be no holding gains on capital employed, and this will be reflected in the allowed rate of return. 63 http://www.ofcom.org.uk/consult/condocs/nga_future_broadband/statement/

A new pricing framework for Openreach
159
Alternative estimation methods and estimates
A8.16 A number of different methods are used to measure the return that investors will require for investing in equity markets. These may be based on historical investment returns (i.e. an ex-post approach), or on forward-looking considerations (i.e. an ex-ante approach).
A8.17 As set out in the First and Second Consultations, we consider the following estimation methods:
a) Ex-post estimation:
b) Extrapolating observed historical risk premia:
c) Extrapolating adjusted historical risk premia; and
d) Ex-ante estimation: (i) using the dividend growth model, and (ii) using surveys of academic and user expectations.
Ex-post estimation – extrapolating historical risk premia
A8.18 As set in our first two consultations, we are relying on work carried out by the London Business School’s Dimson, Marsh and Staunton (“DMS”)64, which is regarded as being one of the most authoritative sources of historical estimates. DMS measure total returns over a relatively long period, include a large sample of countries and make adjustments for survivorship bias.
A8.19 The estimates from DMS suggest it would be appropriate to give weight to historic premia between 4.0% and 5.5%. These estimates have not changed since the First Consultation.
A8.20 Note that these estimates are calculated using arithmetic means from historic data. Arithmetic means are our preferred measure of the historic premia, and we give more weight to arithmetic means than to geometric means from the same data.
A8.21 DMS themselves have suggested an arithmetic mean premium for the world index of around 4.5 – 5.0%.65 They state that “this is our best estimate of the equity risk premium for use in asset allocation, stock valuation, and corporate capital budgeting applications.” In addition, for the UK, DMS’s estimated premium of equities over bonds (as measured by the arithmetic mean in the period 1900 – 2008) is 5.0%66.
Ex–post estimation – extrapolating adjusted historical risk premia
A8.22 As set out in the First Consultation, using DMS data implies a range for the adjusted ERP over bonds of 3 to 4.5%.
A8.23 We note that the DMS adjustments are fairly subjective, and we would advocate putting only a modest amount of weight on these adjusted returns.
64 Dimson, Marsh and Staunton, 2008, “Global Investment Returns Yearbook 2008”, ABN AMRO, London Business School, and 2009, “Credit Suisse Global Investment Returns Sourcebook 2009”, Credit Suisse 65 DMS 2009, p34 66 DMS 2009, p146

A new pricing framework for Openreach
Ex-ante estimation – estimates not based on historic returns
A8.24 The ERP can be estimated without using historical data.
A8.25 The dividend growth method is based on forecasts of future dividend growth. With this method it is possible to calculate an “implied” ERP using current market values and forecasts for earnings/dividends.
A8.26 In the 2005 Final Statement we presented a range of ERP estimates based on this method of estimation with a midpoint of 3.5 to 4%.
A8.27 In response to our consultation documents that preceded the 2005 Final Statement some stakeholders argued that approaches of this type are seriously flawed since they rely on highly subjective input parameters i.e. analyst expectations and an assumption of constant growth rates.
A8.28 We agree that approaches of this type require the use of highly subjective parameters. As a result, we place relatively little weight on this type of analysis. We believe that the range presented at the time of our 2005 Final Statement is still relevant.
Ex-ante estimation: academic/user surveys
A8.29 It is possible to estimate the ERP by using surveys carried out amongst academics and users of the CAPM. Participants are asked to quantify the returns that they expect from the equity market over a particular time horizon.
A8.30 The first consultation that we published in January 200567 in relation to assessing BT’s cost of capital set out the range of views of academics as being from 3 to 7%, while the views of practitioners ranged from 2 to 4%.
A8.31 A study of US finance academics, carried out by Ivo Welch, suggested that an estimate of the ERP based on academic views might be around 5% on a geometric mean basis, or 6% on an arithmetic mean basis. This is based on a sample of about 400 finance professors’ views on the 30-year geometric equity premium.68
A8.32 A more recent study from 2008 by Pablo Fernandez69 suggests that UK finance professors used ERP estimates with an arithmetic mean of 5.5%.
A8.33 We would afford this analysis relatively little weight since participant surveys do not provide the same quality of evidence as market-based measures.
Regulatory benchmarks
A8.34 The range of ERP estimates adopted by the UK’s economic regulators and competition authorities is in the range of 3% to 5%.
67 http://www.ofcom.org.uk/consult/condocs/cost_capital/cost_capital.pdf 68 http://papers.ssrn.com/sol3/papers.cfm?abstract_id=1084918 69 Fernandez, Pablo:Market Risk Premium Used in 2008 by Professors: A Survey with 1,400 Answers(April 16, 2009). Available at SSRN: http://ssrn.com/abstract=1344209
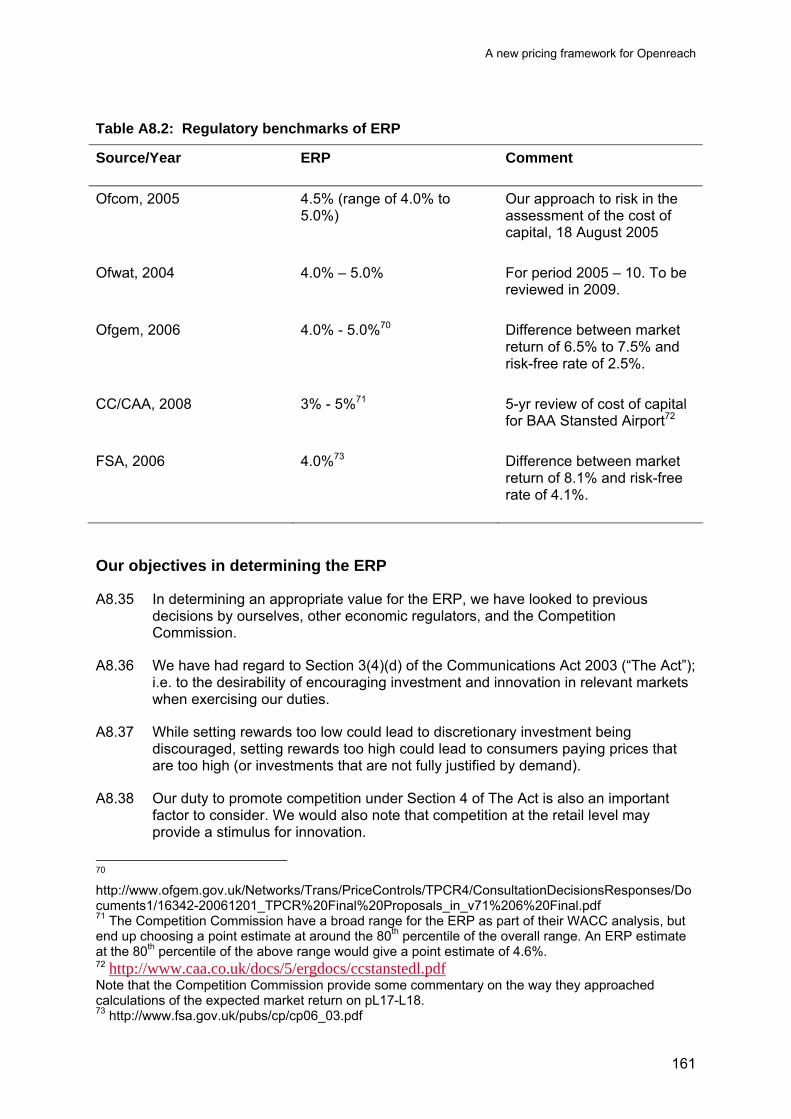
A new pricing framework for Openreach
161
Table A8.2: Regulatory benchmarks of ERP
Source/Year ERP Comment
Ofcom, 2005 4.5% (range of 4.0% to 5.0%)
Our approach to risk in the assessment of the cost of capital, 18 August 2005
Ofwat, 2004 4.0% – 5.0% For period 2005 – 10. To be reviewed in 2009.
Ofgem, 2006 4.0% - 5.0%70 Difference between market return of 6.5% to 7.5% and risk-free rate of 2.5%.
CC/CAA, 2008 3% - 5%71 5-yr review of cost of capital for BAA Stansted Airport72
FSA, 2006 4.0%73 Difference between market return of 8.1% and risk-free rate of 4.1%.
Our objectives in determining the ERP
A8.35 In determining an appropriate value for the ERP, we have looked to previous decisions by ourselves, other economic regulators, and the Competition Commission.
A8.36 We have had regard to Section 3(4)(d) of the Communications Act 2003 (“The Act”); i.e. to the desirability of encouraging investment and innovation in relevant markets when exercising our duties.
A8.37 While setting rewards too low could lead to discretionary investment being discouraged, setting rewards too high could lead to consumers paying prices that are too high (or investments that are not fully justified by demand).
A8.38 Our duty to promote competition under Section 4 of The Act is also an important factor to consider. We would also note that competition at the retail level may provide a stimulus for innovation.
70 http://www.ofgem.gov.uk/Networks/Trans/PriceControls/TPCR4/ConsultationDecisionsResponses/Documents1/16342-20061201_TPCR%20Final%20Proposals_in_v71%206%20Final.pdf 71 The Competition Commission have a broad range for the ERP as part of their WACC analysis, but end up choosing a point estimate at around the 80th percentile of the overall range. An ERP estimate at the 80th percentile of the above range would give a point estimate of 4.6%. 72 http://www.caa.co.uk/docs/5/ergdocs/ccstanstedl.pdf Note that the Competition Commission provide some commentary on the way they approached calculations of the expected market return on pL17-L18. 73 http://www.fsa.gov.uk/pubs/cp/cp06_03.pdf
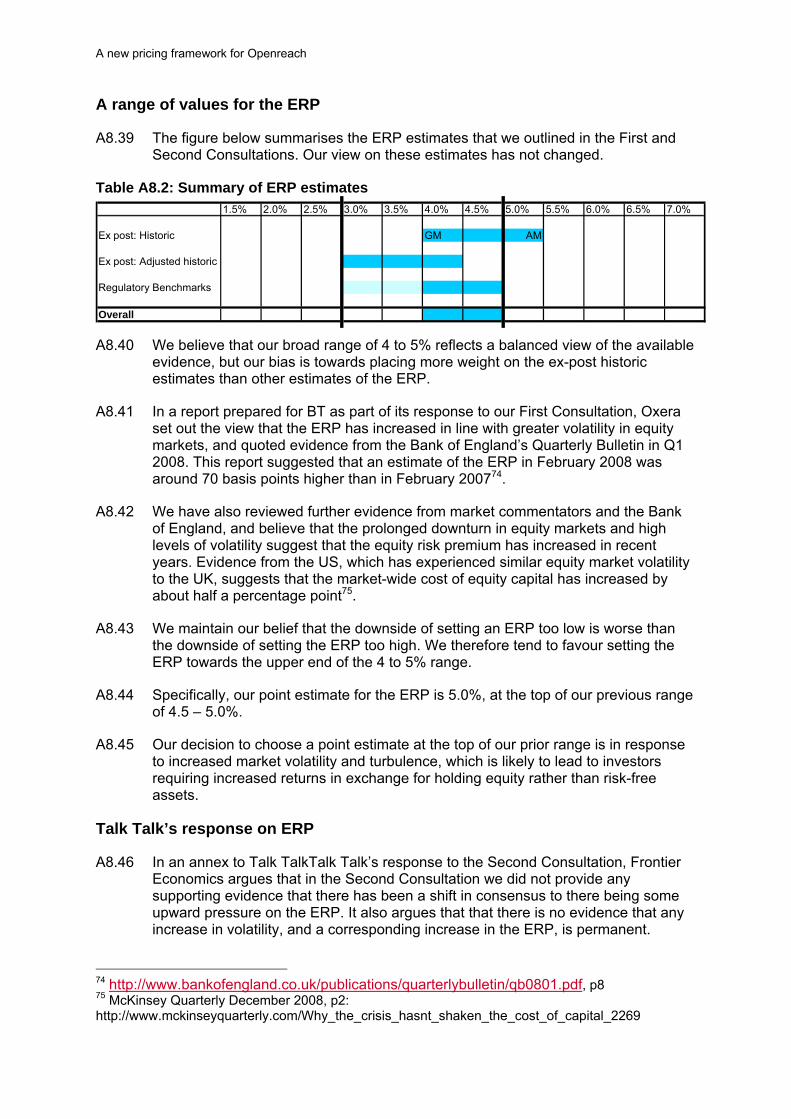
A new pricing framework for Openreach
A range of values for the ERP
A8.39 The figure below summarises the ERP estimates that we outlined in the First and Second Consultations. Our view on these estimates has not changed.
Table A8.2: Summary of ERP estimates 1.5% 2.0% 2.5% 3.0% 3.5% 4.0% 4.5% 5.0% 5.5% 6.0% 6.5% 7.0%
Ex post: Historic GM AM
Ex post: Adjusted historic
Regulatory Benchmarks
Overall
A8.40 We believe that our broad range of 4 to 5% reflects a balanced view of the available evidence, but our bias is towards placing more weight on the ex-post historic estimates than other estimates of the ERP.
A8.41 In a report prepared for BT as part of its response to our First Consultation, Oxera set out the view that the ERP has increased in line with greater volatility in equity markets, and quoted evidence from the Bank of England’s Quarterly Bulletin in Q1 2008. This report suggested that an estimate of the ERP in February 2008 was around 70 basis points higher than in February 200774.
A8.42 We have also reviewed further evidence from market commentators and the Bank of England, and believe that the prolonged downturn in equity markets and high levels of volatility suggest that the equity risk premium has increased in recent years. Evidence from the US, which has experienced similar equity market volatility to the UK, suggests that the market-wide cost of equity capital has increased by about half a percentage point75.
A8.43 We maintain our belief that the downside of setting an ERP too low is worse than the downside of setting the ERP too high. We therefore tend to favour setting the ERP towards the upper end of the 4 to 5% range.
A8.44 Specifically, our point estimate for the ERP is 5.0%, at the top of our previous range of 4.5 – 5.0%.
A8.45 Our decision to choose a point estimate at the top of our prior range is in response to increased market volatility and turbulence, which is likely to lead to investors requiring increased returns in exchange for holding equity rather than risk-free assets.
Talk Talk’s response on ERP
A8.46 In an annex to Talk TalkTalk Talk’s response to the Second Consultation, Frontier Economics argues that in the Second Consultation we did not provide any supporting evidence that there has been a shift in consensus to there being some upward pressure on the ERP. It also argues that that there is no evidence that any increase in volatility, and a corresponding increase in the ERP, is permanent.
74 http://www.bankofengland.co.uk/publications/quarterlybulletin/qb0801.pdf, p8 75 McKinsey Quarterly December 2008, p2: http://www.mckinseyquarterly.com/Why_the_crisis_hasnt_shaken_the_cost_of_capital_2269

A new pricing framework for Openreach
163
A8.47 In addition it argues that other evidence does not support the contention that the best estimate of the ERP has increased. It states that:
“updating information on historical risk premia to include 2008 will significantly reduce ex post estimates of the ERP due to the significant negative returns for UK and World equity indices in 2008.”
A8.48 Frontier concludes that:
“In the absence of any conclusive evidence of a long term increase in the Equity Risk Premium since the previous review we believe the central estimate for the ERP should remain at 4.5%.”
BT’s response on ERP
A8.49 BT believes that, even though we raised the upper end of our range for the ERP in the Second Consultation, our range is still too narrow for the ERP. It argues that Professors Myers and Schaeffer recently proposed upper limits of 6.5% and 6%.
A8.50 BT also provides evidence that Ofcom’s position on the ERP is in the lower part of the range when measured against other telecom NRAs.
Other responses on ERP
A8.51 Virgin Media noted in its response to the Second Consultation that we had increased our range for the ERP since the First Consultation, but urged Ofcom to revisit this figure again in light of the volatile financial circumstances. In addition, Virgin Media urged Ofcom to revisit BT’s equity beta, which it believes has risen since the second consultation.
Ofcom’s Final Position on the ERP
A8.52 In selecting a point estimate of 5.0% for the ERP, we have taken account of many factors, including recent market volatility, the longer term outlook, and the views of market participants such as the Bank of England and other independent commentators.
A8.53 We are mindful of Talk TalkTalk Talk’s view that increased volatility is a temporary effect and should not influence our final point estimate of the forward-looking ERP, but believe that it would be remiss of us not to recognise the effects of market volatility in our final estimate of the ERP.
A8.54 In short, we believe that there is compelling evidence to suggest that investors are recognising the higher perceived risk of equity investments by looking for higher returns, although the quantum of this effect shouldn’t be overestimated. This leads us to select a point estimate for the ERP at the top end of our previous range of 4.5 – 5%.
A8.55 To address Frontier’s specific point about the inclusion of 2008 data to the historical risk premia leading to a lower expected return, we would point to the 2009 DMS Global Investment Returns Sourcebook, which keeps the same range of 4.5 – 5.0% for the ERP as the 2008 Yearbook. We retain a consistent approach to the ERP – we place the greatest weight on the DMS range of historical arithmetic mean premiums, from which we have selected a point estimate.
A new pricing framework for Openreach
BT Group Beta
What does the equity beta represent?
A8.56 The value of a company’s equity beta reflects movements in returns to shareholders (as measured by the sum of dividends and capital appreciation) from its shares relative to movements in the return from the equity market as a whole.
A8.57 We estimated the BT Group equity beta to be 1.1 in our 2005 Final Statement. This was based on a series of data points, with particular reference to the 2-year daily estimate of BT’s beta measured against the FTSE Allshare index.
How has BT’s Group beta moved since 2005?
A8.58 For the First and Second Consultations we commissioned studies from the Brattle Group on how BT Group’s equity beta had moved since the last review and on the range of values that we should now consider. As before, we have asked Brattle to prepare an updated report on the range of equity betas for BT Group76.
A8.59 Brattle concluded that a reasonable range for BT’s equity beta was 0.8 to 1.0. This range was prepared with reference to share price data for the 1, 2 and 5 year periods up to 11th March 2009.
A8.60 Brattle’s analysis shows that BT’s 1, 2 and 5 year daily betas, when measured against the FTSE allshare or the FTSE allworld indices, all lie between a narrow range of 0.8 and 0.9. However, Brattle notes that BT’s gearing was fairly constant until early 2007, but it has subsequently more than doubled. It is possible to take account of the effect of changes in gearing by “re-levering” the beta estimates to a constant gearing level.
A8.61 Brattle’s analysis suggests that at a 38% gearing level (the average gearing rate in the year up to the previous Brattle report), a range of 0.8 to 1.0 is reasonable. We have taken the mid-point of this range for BT Group, giving us a point estimate for the equity beta of BT Group at a gearing rate of 38% of 0.9.
A8.62 However, our approach to gearing is to assume an optimal level of gearing, which we take to be 35% for BT Group. It is possible for us to re-lever this beta to a 35% gearing rate, and calculate what equity beta would be implied at this level of gearing.
A8.63 In order to do this we need to look at asset betas and debt betas in order to determine the de-levered equity beta. We take our lead from the Competition Commission (“CC”) in the estimation of debt beta, where the CC uses a point estimate of 0.1.77 This is consistent with a credit market that is relatively sensitive to general economic and market factors, as well as company specific risk. Given that we assume a debt premium of 3% for BT Group (rather than the range 1.4 – 1.7% that the CC assumed for Stansted), we believe that this would be associated with a
76 See separate Annex entitled “Updated Estimate of BT’s Equity Beta March 2009” 77 See pL35 of the Competition Commission’s annex on the cost of capital prepared for the CAA’s review of Stansted’s charges, which concluded that a debt beta of 0.1 was appropriate with a debt premium of 1.4 – 1.7%. Given that our estimated debt premium for BT Group is 3%, we believe that this would be consistent with a higher debt beta, and have assumed a figure of 0.15 above. Some judgement is required in the estimation of debt betas, mainly because decomposing corporate debt spreads into default risk, liquidity risk and inflation risk is not straightforward. http://www.caa.co.uk/docs/5/ergdocs/ccstanstedl.pdf

A new pricing framework for Openreach
165
higher estimate of the debt beta, and use a figure of 0.15 for the purposes of calculating an asset beta.
A8.64 The asset beta of BT Group should remain constant at different levels of gearing. We can use a simple equation to determine what the asset beta of BT Group is, using a gearing rate of 38%, an equity beta of 0.9 and a debt beta of 0.15.
A8.65 The asset beta of BT Group = [(1 – gearing) * equity beta + (gearing * debt beta)]. Therefore, the Asset beta of BT Group = 0.62*0.9 + 0.38*0.15 = 0.61
A8.66 If the asset beta is 0.60, then at 35% gearing the equity beta can be calculated: Equity beta (BT Group) = [0.60 – (0.35 * 0.15)]/0.65 = 0.86
A8.67 This tells us that, assuming an equity beta of 0.9 at 38% gearing, at an optimal gearing level of 35%, BT Group’s equity beta would be 0.86.
Is it appropriate to reflect project-specific variations in risk in our financial analysis?
A8.68 As we set out in the 2005 Final Statement, it is sometimes appropriate to view some large companies such as BT as being a group that consists of a number of firms, or projects, each with its own unique risk profile, that operate together under common ownership.
A8.69 Since the conclusion of Ofcom’s Strategic Review of Telecommunications in 2005, the creation of Openreach has given greater clarity over the access services part of BT Group’s business.
What does BT’s Group beta imply for the estimate of Openreach’s beta?
A8.70 In the 2005 Final Statement, we estimated an appropriate notional beta for Openreach which was 0.2 lower than BT Group’s. While we recognise that the process of disaggregation of equity betas is not an exact science, we remain of the view that Openreach’s beta is below that of the BT Group78.
A8.71 In order to inform our decision over how much lower we might expect Openreach’s equity beta to be than that of BT Group, we have commissioned the Brattle Group to prepare a comparative analysis of network utilities and their equity betas. This analysis can be found in the Brattle paper published with this statement : “Equity Beta Estimates of Comparators Companies March 2009.”
A8.72 As we have stated in previous consultations, we consider Openreach to have many characteristics of a network utility, and therefore to carry less specific risk than the rest of BT Group. The Brattle paper suggests that comparable UK network utilities (specifically United Utilities and National Grid) would have equity betas in a range of 0.4 – 0.7, at a gearing rate of 35%. This suggests to us that our assumption of a lower equity beta for Openreach than BT Group is sound.
A8.73 As we stated above, we estimate the BT Group beta to be 0.86 at a gearing ratio of 35%. We believe that a reasonable estimate of Openreach’s equity beta, taking into
78 See 2005 Final Statement sections 6 and 7 for a full explanation of the magnitude of our reduction in BT Group’s equity beta for BT’s access services division (i.e. Openreach).

A new pricing framework for Openreach
account that of BT Group and of the comparable UK network utilities, would be 0.1 lower than for BT Group, i.e. 0.76.
A8.74 We also note that Openreach is now a larger proportion of BT Group (as measured by mean capital employed) than it was in 2005, having increased from around 40% in 2004 to around 50% in 2007 and 2008. This has a knock-on effect for the beta of the rest of BT.
What have respondents said about our BT and Openreach equity beta estimates?
A8.75 Both Talk Talk and BT commented at length on our equity beta estimates in the First Consultation and Second Consultations.
A8.76 The papers presented by Frontier Economics on behalf of Talk Talk argued that the gearing assumption we used for Openreach was incorrect. It argued that the optimal level of gearing for Openreach is higher than the 35% used by Ofcom, and a gearing range of 50 – 60% would be more appropriate.
A8.77 At these higher levels of optimal gearing Frontier suggest that a range of equity beta of 0.7 – 1.0 is appropriate.
A8.78 We believe that there is no significantly good reason to alter our assumption of 35% optimal gearing for BT and Openreach, particularly at a time when financial markets are wary of companies with higher levels of debt.
A8.79 BT, in its response to the Second Consultation, agreed that using Brattle’s work is a useful starting point for the level to set for BT’s equity beta, and supports the statistical methodology used by Brattle, but disagrees on aspects of interpretation.
A8.80 Brattle has responded to the specific points raised by BT in its response, which can be found in the Brattle paper published with this statement on BT’s equity beta. We believe that Brattle’s response fully addresses the specific issues raised by BT.
A8.81 In addition, BT argues that there is no compelling evidence to suggest that Openreach should be attributed with a beta significantly different from BT Group. It also provided a study of City analysts which suggests that, while the majority of analysts believe that Openreach is less risky than BT Group, others disagree and some perceive Openreach as more risky than BT Group.
A8.82 Ofcom’s position on this issue remains as it was in the previous consultations and in the previous Review in 2005. We believe that if Openreach was a separate entity, it would be likely to exhibit qualities akin to network utilities, which tend to have lower systematic risk, and hence lower beta than the rest of the BT Group.
A8.83 We have acted on the submissions received from respondents by commissioning analysis of utility comparators’ equity betas, and considering the gearing level of BT Group. We believe that this analysis is supportive of our conclusions, and that our estimates of equity beta for Openreach, BT Group and the rest of BT are robust.

A new pricing framework for Openreach
167
BT and the debt markets
Introduction
A8.84 Our WACC calculations require two further inputs in addition to those already set out, e.g.
a) The risk-free rate; and
b) BT’s debt premium.
A8.85 Since the latter half of 2007 there has been increased uncertainty and volatility in world credit markets, and we have been mindful of this when considering our estimates of debt parameter values.
A8.86 In the First Consultation we noted two recent effects, which are partially offsetting for the purposes of our calculations:
As volatility and uncertainty in credit (and also in property) markets increased, central bank interest rates fell and the risk-free rate also dropped.
The demand for corporate debt diminished and the required spreads on corporate debt issues increased, pushing up BT’s debt premium.
A8.87 Between the First and Second Consultations, the financial crisis worsened and a number of credit institutions were sold, went into liquidation or were fully or partially nationalised.
A8.88 In this period, nominal gilt yields first increased and then fell back more recently, as investors’ desire for low-risk assets, such as government gilts, drove up demand, pushing prices up and yields down. In addition, declines in expected inflation have pushed nominal gilt yields down. As part of the same preference for low-risk assets, spreads on corporate bonds (which are more risky than government gilts) increased, and continue to be at relatively high levels.
A8.89 Since the Second Consultation a number of new factors have become apparent:
Partially as a result of global efforts to tackle the worldwide recession, the UK government’s level of borrowing has increased markedly in the last year, which has resulted in the supply of government gilts being increased. While investor demand for gilts remains strong, the increased supply has reduced prices and increased yields over the last month or so. Given the high level of expected debt issuance by the UK government over the next few years, we expect this effect to continue, and the comparatively low current yields seen today are unlikely to endure.
As part of the Bank of England’s monetary stimulus package, it has embarked on a policy of quantitative easing, which has included the central bank purchasing selected corporate bonds, including those of BT. This effect, while relatively minor, may help to increase prices for the corporate bonds in question, which will in turn reduce yields and spreads over gilts.
A8.90 Given the factors set out above, our expectation is that the current high levels of corporate bond spreads (~4.5% for BT Group), are unlikely to remain at such elevated levels for the period of this charge control.

A new pricing framework for Openreach
The risk-free rate
A8.91 The risk-free rate of interest is an input into both the calculations of the cost of debt and the cost of equity.
A8.92 For a UK company, a proxy for the nominal risk-free rate is the yield to maturity on gilts, or government strips79, while the real risk-free rate can be proxied by the yield on index-linked gilts of appropriate maturity. The difference between the two provides an estimate of forecast inflation.
A8.93 We can track the nominal, real and implied forecast inflation rates over time, using Bank of England data on 5-year duration gilts, as shown by Figure A12.3 below.
A8.94 From the figure we can see that the nominal yield peaked at around 5.8% in July 2007 but in 2009 has been consistently below 3%, primarily due to very sharp falls in inflation expectations. At the same time, real gilt yields peaked at a high of over 4%, but are now closer to 1%.
Figure A8.3: 5 year gilt yields - Nominal, Real & Implied Inflation
Nominal
Real
Implied inflation
-1
0
1
2
3
4
5
6
23/04/2004 23/04/2005 23/04/2006 23/04/2007 23/04/2008 23/04/2009
Rat
e, %
Source: Bank of England data
A8.95 The average nominal yield for 5-year zero coupon gilts has fallen over the last year. While we would generally tend to give more weight to more recent nominal rates than averages over past years, we are mindful that we do not wish to estimate the rate based on a period of unprecedented market turbulence.
A8.96 Given the likelihood of increasing nominal yields, as set out in para A8.88 above, we give more weight to the 1, 2, 3 and 5 year averages than recent very low rates.
79 STRIPS = Separate trading of registered interest and principal securities - fixed-income securities sold at a significant discount to face value which offer no interest payments because they mature at par.

A new pricing framework for Openreach
169
Table A8.4: Historic averages of Nominal, Real and Inflation 5 year rates (23 Apr 09)
Averaging period Nominal Real Implied Inflation
Spot (23 Apr 09) 2.7 1.1 1.6
3 month 2.6 1.2 1.4
6 month 2.9 2.1 0.8
1 year 3.8 1.9 1.9
2 year 4.3 1.9 2.4
3 year 4.5 1.9 2.5
5 year 4.5 1.9 2.6
Source: Bank of England data
A8.97 Using values from the table above, our broad range for the real risk-free rate is 1.9 to 2.1%. This range includes the average yields for the last 6 months, 1 year, 2 year, 3 year and 5 year periods, and can be viewed as a prudent range on which to base our real risk-free rate.
A8.98 The nominal risk-free rate will then be given by the real risk-free rate plus an inflation assumption.
Inflation in our risk-free rate assumption
A8.99 In our previous consultation, we did not specifically set out a forecast range for inflation, since the nominal risk-free rate included an implicit inflation assumption.
A8.100 This was a reasonable position at a time when inflation assumptions were stable, but in the current environment, where the UK inflation rate (as measured by the RPI) has turned negative for the first time since 1960, we think it prudent to be explicit in our inflation assumptions (and hence our real and nominal risk-free rates).
A8.101 In the Second Consultation we set out a central range for the risk-free rate of 4.1 – 4.8%, which was associated with a forward-looking inflation assumption of around 2.5%, implying a real risk-free rate of around 2%.
A8.102 Despite the recent volatility in observed real risk-free rates, we note that the average real gilt yield over the last 6 months, 1 year, 2 years, 3 years and 5 years all lie within a narrow range of 1.9 – 2.1%. We therefore propose to use a forward-looking real risk-free rate of 2%80.
80 This is also consistent with the CC in its Stansted paper (see table 12 on pL27 of http://www.competition-commission.org.uk/rep_pub/reports/2008/fulltext/539al.pdf

A new pricing framework for Openreach
A8.103 In line with recent market expectations of inflation, we now propose to use an inflation assumption of 0 (zero) % for the first year of our charge control (April 2009 – March 2010), and then 2.5% each year for subsequent years of the control81.
A8.104 Bringing together our inflation assumptions, where we assume zero inflation in year 1 and then 2.5% for remaining years, with a real risk-free rate assumption of 2.0%, gives us a nominal risk-free rate of 2.0% in year 1, then 4.5% in all subsequent years. We note that the year 1 rate sits outside of our range of 3.8 – 4.5% set out above, but an average of the 4 years of the charge control period would be within the lower end of this range, at around 3.9%.
A8.105 Table 1 below shows how these risk-free rate assumptions come together.
Table A8.5: Inflation and risk-free rate assumptions
% Yr 1 Yrs 2 - 4 Average
Inflation 0 2.5 1.9
Real risk-free rate 2.0 2.0 2.0
Nominal risk-free rate82
2.0 4.5 3.9
What have respondents said about our risk-free rate assumptions?
A8.106 BT made very little comment on our risk-free rate assumptions, other than to note that it “broadly concurs with most of what Ofcom has written”, although it did argue that our approach of associating the lower end of the risk-free rate range with the high end of the debt premium range was not valid, and that we had not presented any evidence in favour of such an approach.
A8.107 Talk TalkTalk Talk made the point that inflation is likely to vary considerably over the forecast period in question, and the error ranges attached to inflation forecasts have widened recently.
A8.108 Talk TalkTalk Talk suggests that the best approach is to base the cost of capital on an estimate of the real risk free rate, and proposes a range of 2.0% to 2.5%.
A8.109 Ofcom’s position remains consistent on the risk-free rate. While we are being more explicit than in the past about setting out our real and nominal risk-free rate assumptions, our basic approach of using observed 5 year zero coupon nominal and real gilt yields over a period of time is unchanged. We reserve the right to place more emphasis on spot rate in the future.
A8.110 In previous consultations, where inflation assumptions were very stable, it was not necessary to split out explicitly real and nominal risk-free rates. However, as
81 See Annex 6 for a further discussion of our inflation assumptions. 82 Note that the nominal rate is given by the equation: (1 + nominal rate) = (1 + inflation rate)*(1 + real rate).

A new pricing framework for Openreach
171
suggested by Talk TalkTalk Talk, we have set out our inflation assumptions, real risk-free rates and nominal risk-free rates.
A8.111 In response to BT’s specific point about using the low end of our risk-free rate range with the high end of the debt premium, we note that this approach is only suitable during the consultation stages of the review, where we proposed ranges for the parameters. In this final statement we select point estimates for each of the parameters (as we have in past charge control reviews), and therefore there are no ranges to use.
BT’s Debt Premium
A8.112 As we noted in the Second Consultation, this is a time of volatility and uncertainty in credit markets, and this uncertainty is reflected in corporate bond yields, which have remained very high over the last year.
A8.113 BT’s current credit rating is Baa2 (Moody’s) and BBB (S&P). It was downgraded from Baa1 and BBB+ at the end of March 2009, on the back of cashflow concerns related to BT Global Services.
A8.114 BT’s most recent debt issue was on 25th June 2008, when it issued €1bn of 7-year bonds at 155 basis points above the mid-swap rate. This is below the 2 – 3% range that we proposed in our First and Second Consultations, but we note that this data point is now nearly a year out of date.
A8.115 More recent Bank of England data suggests that UK investment grade corporate debt spreads have gone up considerably since September 2008 (when Lehman Brothers went into administration), and BT debt is currently trading at 400 - 450 basis points above equivalent gilt yields.
A8.116 The latest Bank of England Quarterly Bulletin83 suggests that in the first quarter of 2009, investment-grade non-financial corporate bond spreads have narrowed slightly from January 2009. However, the Bank notes that:
“it seems unlikely that the compensation required by investors in corporate bonds to cover credit risk…would have fallen recently. Instead, contact reported a pickup in investor demand for exposure to corporate bonds which could have reduced the required liquidity premia embedded in secondary market corporate bond spreads.”
A8.117 The Bank’s reference to embedded liquidity premia in corporate bond spreads hints at one of the problems with interpreting corporate bond spreads in the last year, i.e. trading volumes in corporate bonds have been thinner as investors focus on risk-free assets, such as government gilts.
A8.118 We believe that the observed 450 basis point spread of BT’s bonds over gilts includes at least some element of a liquidity premium. We note that traded debt yields are not necessarily a true estimate of the expected cost of debt to a firm, since the cost of debt needs to take account of the likelihood of reduced (or zero) payments in the event of financial distress or default.
83 http://www.bankofengland.co.uk/publications/quarterlybulletin/qb0901.pdf, p10

A new pricing framework for Openreach
A8.119 In addition we note that the current high levels of corporate debt spreads are unlikely to endure for the period of the charge control, and we are comfortable with an estimated debt premium for BT below this level.
Gearing and the debt premium
A8.120 BT’s gearing level at the time of its most recent issue of debt was around 38%, i.e. closer to our assumed optimal gearing level of 35%. In this respect, BT’s observed debt premium of 155 bps could be considered to be a reasonable indicator of the debt premium at a level of gearing close to the optimal gearing level. However, we note that since the issue of this debt, capital markets deteriorated such that debt spreads increased irrespective of gearing levels, and this is no longer a reliable indicator of BT’s debt premium..
A8.121 As a result, the continued high levels of corporate bond spreads leads us to select a debt premium for BT at the very top of our range, i.e. 3%.
A8.122 We would note that our debt premium for BT in 2005 was just 1%, and this represents the largest change to our CAPM parameters. While we recognise that this is a big change since the previous charge control, we are comfortable that market conditions dictate that our debt premium for BT should be materially higher.
What have respondents said about our debt premium assumptions?
A8.123 BT agrees with Ofcom on the 2 – 3% range for the debt premium, but it has also pointed out that its debt is currently trading at levels far above these rates.
A8.124 Talk Talk argues that we should look at debt premia used by other UK regulators over the last 4 years, rather than the current market. As it did when responding to the First Consultation, Talk Talk proposes a range of 1 – 1.4% for BT’s debt premium.
A8.125 We believe that our estimate of the debt premium should take some account of recent market data, including both evidence from the Bank of England and BT’s own debt issuance. We consider that picking an estimate of the debt premium at the top end of our range of 2 – 3% is prudent at this time.
A8.126 As set out above, we note that traded debt yields are not necessarily a true reflection of the expected cost of debt to the firm.
A8.127 In addition, we consider it likely that current levels of corporate debt yields reflect elements of liquidity risk caused by investors’ ‘flight to quality’. As demand for more risky forms of investment reduces, the demand for corporate debt rather than government debt reduces, and prices of corporate bonds rise. This in turn increases yields on these securities.
Cost of Capital Calculations
Use of spot rate assumptions
A8.128 As stated in previous Consultations, at a time of intense market uncertainty and turbulence, we give greater weight to longer term averages than spot rates, particularly with reference to the risk-free rate and the debt premium.
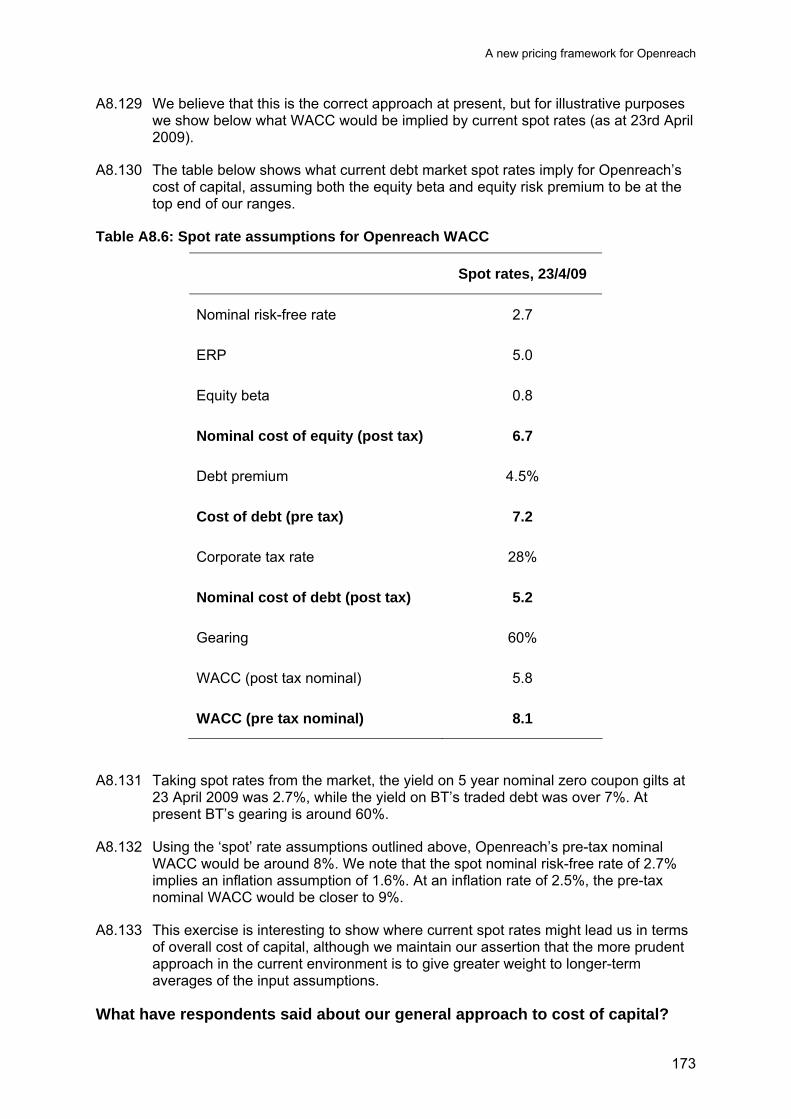
A new pricing framework for Openreach
173
A8.129 We believe that this is the correct approach at present, but for illustrative purposes we show below what WACC would be implied by current spot rates (as at 23rd April 2009).
A8.130 The table below shows what current debt market spot rates imply for Openreach’s cost of capital, assuming both the equity beta and equity risk premium to be at the top end of our ranges.
Table A8.6: Spot rate assumptions for Openreach WACC
Spot rates, 23/4/09
Nominal risk-free rate 2.7
ERP 5.0
Equity beta 0.8
Nominal cost of equity (post tax) 6.7
Debt premium 4.5%
Cost of debt (pre tax) 7.2
Corporate tax rate 28%
Nominal cost of debt (post tax) 5.2
Gearing 60%
WACC (post tax nominal) 5.8
WACC (pre tax nominal) 8.1
A8.131 Taking spot rates from the market, the yield on 5 year nominal zero coupon gilts at 23 April 2009 was 2.7%, while the yield on BT’s traded debt was over 7%. At present BT’s gearing is around 60%.
A8.132 Using the ‘spot’ rate assumptions outlined above, Openreach’s pre-tax nominal WACC would be around 8%. We note that the spot nominal risk-free rate of 2.7% implies an inflation assumption of 1.6%. At an inflation rate of 2.5%, the pre-tax nominal WACC would be closer to 9%.
A8.133 This exercise is interesting to show where current spot rates might lead us in terms of overall cost of capital, although we maintain our assertion that the more prudent approach in the current environment is to give greater weight to longer-term averages of the input assumptions.
What have respondents said about our general approach to cost of capital?
A new pricing framework for Openreach
A8.134 While BT accepts our use of the CAPM methodology in general, it believes that there is an inherent asymmetry of risk associated with setting charges too low versus the risk associated with setting charges too high.
A8.135 As a result, BT argues that we should be setting the final point estimate of Openreach’s cost of capital towards the upper end of our estimated range, which it states would be in line with the approach adopted by the Competition Commission (“the CC”) in its work for the CAA’s charge control reviews.
A8.136 There are a number of complications when comparing the CC’s analysis with our own, such as the use of real versus nominal rates, and the CC’s use of ranges of parameters in the latter stages of setting price controls, while we set specific point estimates for each of the parameters included in the CAPM in our final statements.
A8.137 Our approach has always been to give ranges for parameters through the consultation process, with individual point estimates at the final stage of the process. We select values from our proposed ranges based on the information available at the time of the final statement, and bearing in mind the period of the forward-looking charge control.
A8.138 Therefore, our approach is slightly different from that of the CC, which provides ranges and then selects from the overall range without choosing point estimates for each of the parameters.
A8.139 We would note that, in order to reflect the volatile nature of equity and capital markets, we have selected from the top end of our prior proposed ranges for the ERP (5% versus a range of 4.5 - 5%), and for the debt premium (3% versus a range of 2 – 3%).
A8.140 In relation to the equity beta, this figure is provided by empirical observations and our interpretation of the analysis performed by the Brattle Group, while the risk-free rate assumption is guided by empirical market observations and forward-looking inflation assumptions.
The Competition Commission versus Ofcom
A8.141 We estimate that using a CC-style approach84 to calculating Openreach’ s cost of capital would result in a lower range than our own, but that would be mitigated by the CC’s preference for the use of a point estimate at the top end of the range.
A8.142 We estimate that a CC-style range using the CC’s estimate of the risk-free rate and its range for the ERP with our own estimates of Openreach’s equity beta and debt premium would result in a real WACC range in the region of 6 – 8%. Selecting a point estimate at the 80th percentile of this range would lead to a real pre-tax WACC point estimate of around 7.5%, and a nominal pre-tax WACC (assuming 2.5% inflation) of around 10%.
A8.143 Therefore, we do not believe that our approach leads to materially different results that that of the CC, although some care has to be taken when making comparisons between the two sets of estimates.
84 As per the CC’s report for the CAA on the cost of capital for Stansted Airport: http://www.caa.co.uk/docs/5/ergdocs/ccstanstedl.pdf
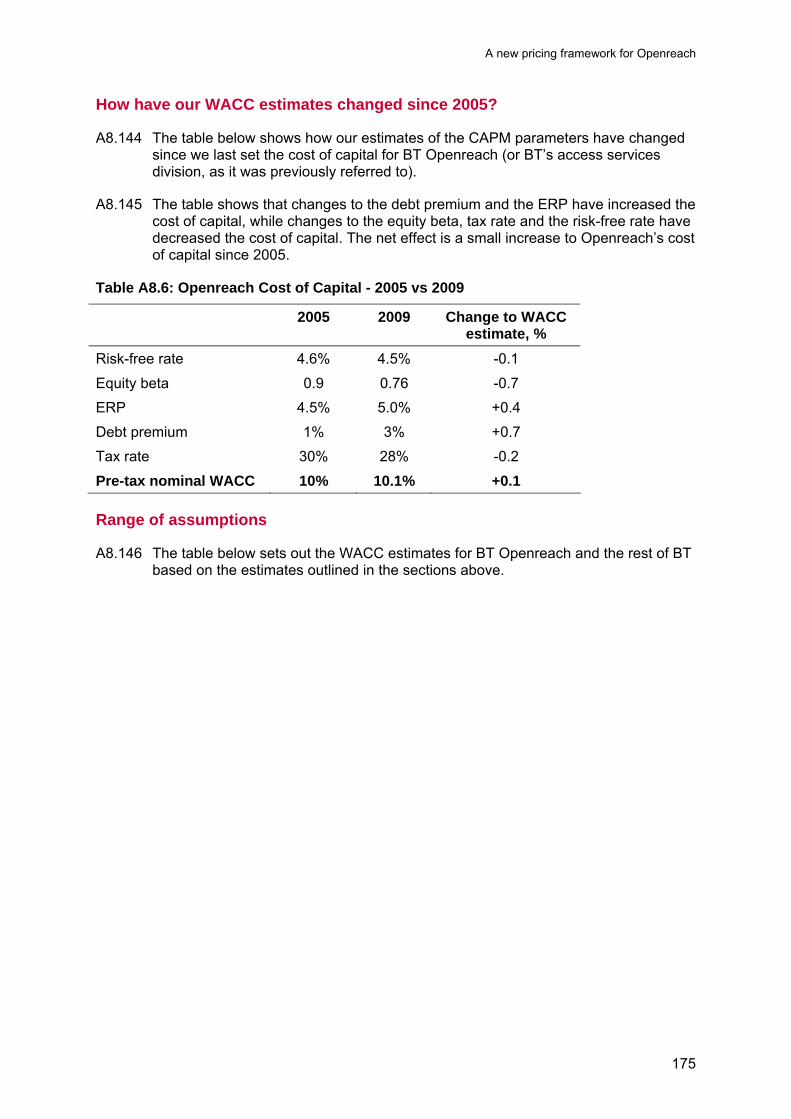
A new pricing framework for Openreach
175
How have our WACC estimates changed since 2005?
A8.144 The table below shows how our estimates of the CAPM parameters have changed since we last set the cost of capital for BT Openreach (or BT’s access services division, as it was previously referred to).
A8.145 The table shows that changes to the debt premium and the ERP have increased the cost of capital, while changes to the equity beta, tax rate and the risk-free rate have decreased the cost of capital. The net effect is a small increase to Openreach’s cost of capital since 2005.
Table A8.6: Openreach Cost of Capital - 2005 vs 2009
2005 2009 Change to WACC estimate, %
Risk-free rate 4.6% 4.5% -0.1
Equity beta 0.9 0.76 -0.7
ERP 4.5% 5.0% +0.4
Debt premium 1% 3% +0.7
Tax rate 30% 28% -0.2
Pre-tax nominal WACC 10% 10.1% +0.1
Range of assumptions
A8.146 The table below sets out the WACC estimates for BT Openreach and the rest of BT based on the estimates outlined in the sections above.

A new pricing framework for Openreach
Table A8.7: Pre-tax nominal WACC for Openreach
WACC Component May 08 Dec 08 May 09
Risk-free rate, % 4.2 – 4.6 4.1 – 4.8 4.5
Equity Risk Premium, % 4.5 – 4.75 4.5 – 5 5
Equity Beta 0.7 – 0.8 0.75 – 0.85 0.76
Cost of equity (post tax) 7.5 – 8.5 7.5 - 9 8.3
Debt premium, % 2 – 3 2 – 3 3
Corporate tax rate, % 28% 28% 28%
Cost of debt (post tax) 4.5 – 5 5 – 5.5 5.4
Gearing, % 35% 35% 35%
WACC (post tax) 6.5 – 7 6.5 – 7.5 7.3
WACC (pre-tax) 9 – 10 9.25 – 10.75 10.1
Table A8.8: Pre-tax nominal WACC for rest of BT
WACC Component May 08 Dec 08 May 09
Risk-free rate, % 4.2 – 4.6 4.1 – 4.8 4.5
Equity Risk Premium, % 4.5 – 4.75 4.5 –5 5
Equity Beta 0.9 – 1.0 0.95 – 1.05 0.96
Cost of equity (post tax) 8.5 – 9.5 8.5 - 10 9.3
Debt premium, % 2 – 3 2 – 3 3
Corporate tax rate 28 28 28
Cost of debt (post tax) 4.5 – 5 5 – 5.5 5.4
Gearing, % 35 35 35
WACC (post tax) 7 – 7.5 7.5 – 8 7.9
WACC (pre-tax) 10 – 11 10.25 – 11.75 11.0

A new pricing framework for Openreach
177
Annex 9
9 Efficiency gains Introduction
A9.1 In the Second Consultation, we set out our view that Openreach should be able to deliver annual efficiency gains of between 2% and 4% of the costs that can be controlled by Openreach or BT Group (which we described as “compressible costs”).
A9.2 We also explained that we considered that there was scope for further reductions in fault rates of between 4% and 6% each year.
A9.3 These views were informed by several sources of evidence, including statistical analysis, a review of historical trends and a third party review of costs.
A9.4 We invited stakeholders to comment on our approach to estimating further efficiency savings and provide evidence to support their views
A9.5 Informed by these comments, this Annex sets out our view on the appropriate level of efficiency improvements and fault rate reductions.
Efficiency gains
A9.6 We set out our approach to our review of Openreach’s efficiency assumptions under the following headings:
The definition of efficiency gains;
The scope for efficiency gains; and
The extent to which efficiency gains can be realised.
Definition of efficiency
The Second Consultation
A9.7 We explain that we considered that efficiency targets should be considered on a “net” basis, after taking account of both efficiency savings and the investment required to deliver those savings.
A9.8 To the extent that there is a cost associated with delivering efficiency savings it is appropriate to take account of that cost in any financial modelling. These costs could include the cost of investment to deliver efficiency savings or, for example, could be related to costs of redundancy associated with the delivery of those savings.
A new pricing framework for Openreach
A9.9 We also explained that we were looking to establish a real (rather than nominal) efficiency rate. This means that costs would only fall in nominal terms if the chosen efficiency rate exceeded the rate of inflation.
Responses to the Second Consultation
A9.10 Respondents seemed to be broadly happy with this definition. For example, C&W noted that
We agree with Ofcom’s approach to the definition of efficiency, i.e. that efficiency targets should be considered on a “net” basis and in real terms, allowing for inflation.
Conclusion
A9.11 As set out in the Second Consultation, efficiency targets should be considered on a “net” basis, after taking account of both efficiency savings and the investment required to deliver those savings.
Scope for efficiency gains
The Second Consultation
A9.12 We explained in the Second Consultation that Openreach’s ability to control some categories of costs is limited. Specifically, we agreed with Openreach that certain costs – which we called “non-compressible” costs - could not be targeted for future efficiency gains.
A9.13 As set out in the Second Consultation, Openreach had argued that the annual efficiency assumption should be applied as follows:
To the 70% of operating costs it considers to be compressible;
To the 80% of cost of sales it considers to be partly compressible, after halving the rate to around 0.5% to take account of the non-compressible element of these costs; and
To the 80% of capital expenditure it considers to be compressible.
A9.14 We agreed that the efficiency assumption should only be applied to the “compressible” costs and therefore calculated the rate of efficiency gains that should be achievable on the costs that can be controlled by Openreach (or BT Group) only. The effective average rate across all of Openreach’s costs will therefore be lower than this rate.
A9.15 In respect of operating costs, Openreach estimates that around 70% of these costs are controllable. Of the remaining opera ting costs, around a half relate to the rates levied by the Government on Openreach’s infrastructure assets (the “cumulo rates”) and accommodation rental charges that are subject to long term contracts. Most of the balance relates to costs that we address separately as part of this review (including pension costs and the costs of the low user telephony scheme). On this basis, we concluded that Openreach’s split of operating costs between compressible and non-compressible to be reasonable.
A new pricing framework for Openreach
179
A9.16 In respect of its cost of sales, Openreach assumes that around 80% of its cost of sales – consisting largely of the cost of electronics - are partly “compressible”. The remaining 20% of the cost of sales relates to the cost of line card rental from BT Wholesale. The line card costs include the depreciation and cost of capital of the underlying asset. In its response to the First Consultation, Openreach asserts that efficiency assumptions should, therefore, not apply to any of these costs. We considered the cost of line cards separately as part of this review. On this basis, we considered Openreach’s split of its cost of sales between compressible and non-compressible to be reasonable.
A9.17 Openreach has also assumed that efficiency savings can be made on around 80% of its capital expenditure. Most of the remaining 20% relates to IT spend. We explained in the Second Consultation that we considered Openreach’s split of capital expenditure between compressible and non-compressible to be reasonable.
Responses to the Second Consultation
A9.18 Openreach agreed with Ofcom’s conclusion that efficiency gains should be applied to compressible costs only. Other stakeholders generally disagreed with this approach.
A9.19 C& W argued that
We do not agree with the principle of excluding non-compressible costs. It is at odds with the way in which all other businesses must operate and the daily cost/ benefit analyses that businesses must make.
A9.20 Vodafone noted that
Vodafone does not believe in “non-compressible” costs. All costs are compressible over a time frame. Examples given in the Consultation Document include accommodation and Cumulo Rates. Both these cost categories are compressible. Accommodation contracts will continually expire on a rolling basis.
A9.21 As explained in the Second Consultation, there were two main categories of cost that fall outside the definition of compressible costs.
A9.22 The first included cost categories that we have addressed, and, in some cases, adjusted separately as part of our review of costs. These costs include cumulo rates, IS spend and line card costs. It would therefore not be appropriate to apply a further efficiency adjustment to these items.
A9.23 The second category included costs that cannot be reduced in the short term. In broad terms, we agree with Vodafone’s assertion that all costs are compressible in the long term. However, in the shorter term, we accept Openreach’s assertion that some costs – such as rent – that cannot be reduced.
Conclusion
A9.24 We continue to believe that some costs cannot be targeted for future efficiency gains within the four year period under review. Further, by ensuring that the efficiency assumption – when applied to the compressible costs – delivers aggregate savings that are consistent with the aggregate savings delivered in the
A new pricing framework for Openreach
past, the potential for error caused by an inappropriate definition of compressible costs is reduced.
The extent to which future efficiency gains can be delivered
A9.25 As set out above, we first established that we are trying to establish a real efficiency rate to be applied to compressible costs only. We then considered what that rate should be.
A9.26 We explained in the First Consultation that we considered annual efficiency gains of between 1 and 4% should be achievable by Openreach. We explained that Openreach argued that a 4% efficiency target would necessitate significant reductions in headcount, which would make it difficult to maintain current service levels. It further argued that measures of historical efficiency savings do not provide a reasonable basis for setting future efficiency targets. We also explained that other respondents to the First Consultation argued that efficiency gains are more likely to be at the higher end of our range, or above.
A9.27 Informed by the responses to the First Consultation, we set out our updated thinking on the potential for efficiency gains in the Second Consultation.
Statistical analysis
A9.28 We explained in the Second Consultation, that we have traditionally considered efficiency gains in two parts: frontier shift (representing how the telecommunications industry as a whole has improved its efficiency) and catch-up efficiency (the additional efficiency required to reach industry best practice). In previous cost reviews, we commissioned econometric analysis to estimate the frontier shift. In simple terms, this analysis involved benchmarking BT’s costs against the US Local Exchange (LECs), adjusted to account for known differences such as topography and accounting policies.
A9.29 We also referred to an econometric study conducted for BT by Deloitte that concluded that BT’s network as a whole is ranked within the top decile of US LECs.
A9.30 After noting the limitations we considered needed to be applied to the conclusions from this study we noted that they appeared to indicate that an annual efficiency target of between 0.8% and 1.8% would need to be applied to Openreach’s compressible costs. However, we also noted that this rate is applicable to Openreach’s reported results and therefore relates to costs that include depreciation (much of which relates to historical expenditure which is not subject to efficiency gains). To deliver this average efficiency gain by way of an efficiency target that applied to capital expenditure rather than depreciation, the range for the efficiency target would have to be greater than 0.8% to 1.8%. We also noted that this range assumes that Openreach is already operating at a fully efficient level, which we did not consider to be the case.
A9.31 Overall, we concluded that statistical analysis had worked reasonably well in the past, direct benchmarking of Openreach against the LECs was problematic. We therefore concluded that it was necessary to look for alternative efficiency measures to encompass both the frontier shift and catch up efficiency. We therefore considered the results from cost reviews and historical trend analysis.
Cost review

A new pricing framework for Openreach
181
A9.32 We explained that, on a confidential basis, Openreach provided us with some external research on comparative efficiency levels. Openreach explained that this research was not commissioned for the purpose of determining Openreach’s efficiency relative to international operators and that there are significant limitations to the inferences that can be drawn from it.
A9.33 We accepted that there are some limitations to the inferences that can be drawn from this analysis but noted that the research did not appear consistent with a view that Openreach is already operating at a fully efficient level. Further, we noted that the analysis appeared to support projected efficiency improvements at the upper end of our range (i.e. around 4%).
The KPMG report
A9.34 To further inform our understanding of the extent to which Openreach is operating efficiently, we engaged KPMG to conduct an efficiency review of Openreach’s operating costs.
A9.35 This review was conducted in two stages. First, KPMG performed an initial review aimed at identifying components of Openreach’s operating costs where there may be potential for improvements in efficiency and improvements in cost performance.
A9.36 This initial study identified a number of areas where they consider scope may exist for efficiency savings based on available benchmark and comparator data.
A9.37 Following the First Consultation, we asked KPMG to extend the benchmarking of operating cost components to estimate the efficiency gains that could be achieved by Openreach.
A9.38 KPMG’s report is available on our website. It concluded that
In percentage terms, Openreach would need to make efficiency gains of between 3.2-3.5% per annum from 2008 until 2013 on its operating cost base for this to be comparable to that of an organisation operating in a competitive environment.
A9.39 The report explains that this is a weighted average of the efficiency gains required for each cost category weighted by their 2007/08 cost as a proportion of the operating cost base. This range applies to a total operating cost base.
A9.40 KPMG’s number represents its view of the average annual efficiency gain that should be achievable across all operating costs (controllable and non-controllable), based upon the extrapolation of cost areas they benchmarked. As explained above, Openreach considers that only 70% of operating costs are controllable in this way (and in arriving at its average rate KPMG’s analysis recognised that some costs could not be reduced through efficiency improvements). We therefore explained that KPMG’s efficiency estimate appeared to be consistent with an assumption of at least 4%.
A9.41 C&W noted that it supported KPMG’s findings. Some respondents felt that the conclusions overstated the potential for efficiency gains, while others suggested the report understated the potential.
A9.42 A confidential response questioned the extent to which the prospective efficiency gains identified by KPMG would be achievable and indeed practical in reality and

A new pricing framework for Openreach
suggested that there comes a point at which the trade off between cost and quality results in the downsides of a ‘least cost’ approach outweighing the benefits.
A9.43 Conversely, Talk Talk argued that the catch-up could be far greater than KPMG assumed. Specifically, Talk Talk stated that
In our analysis above we have very very conservatively assumed an extra 4% to 8% catch-up from these activities over 4 years (i.e. 1% to 2% extra per year)
A9.44 Several respondents suggested that we had placed insufficient emphasis on KPMG’s conclusions in determining our range, while others suggested we should treat the conclusions with caution.
A9.45 Talk Talk stated that
One would have thought that Ofcom would have, at a minimum, properly compare KPMG’s estimate to the one it used – it did not.
A9.46 As explained in the Second Consultation, the KPMG report was only one of several sources of evidence taken into account. Of the various sources of evidence, it suggested the greatest potential for efficiency gains. Our range reflected this. It is not correct to say that we did not compare the KPMG estimate to our own.
A9.47 A change in the conclusions drawn from the KPMG analysis would not necessarily cause our view of the potential level of efficiency gains to change. However, as explained below, we do not consider that the responses indicate that the conclusions are invalid, nor do we consider that the responses identify a more appropriate basis for estimating the potential for efficiency gains.
A9.48 Talk Talk also argued that the KPMG report did not include all forms of efficiency improvements, such as fault rates and task times.
A9.49 This point is clear from the KPMG report. The Second Consultation Document also makes it clear that we considered fault rates separately. While the potential for reduced fault times is reflected in our combined assessment of the potential for efficiency gains and reduced fault rates, the approach adopted by KPMG does not prevent our use of the KPMG as one of several sources of evidence to inform our decision.
A9.50 Other respondents suggested that KPMG’s conclusions overstated the potential for efficiency gains.
A9.51 Openreach stated that:
While the Ofcom commissioned KPMG report may provide for an approximate view of the potential “direction” of Openreach’s operational costs, Openreach is not persuaded by the approach (or methodology) adopted by KPMG. It is not sufficiently robust to support a definitive estimate of prospective efficiency adjustment, or to serve as a basis to reject Openreach’s estimate of prospective efficiency
A9.52 To support this view, Openreach commissioned Ernst & Young to provide a commentary (the “E&Y Report”) on the approach taken by KPMG. A non-

A new pricing framework for Openreach
183
confidential version of the E&Y Report is available on our website. The E&Y Report concluded that
“there exists a risk that the efficiency gains may not be appropriate in the context of charge controls applied to key Openreach services”.
A9.53 E&Y therefore did not conclude that the efficiency gains calculated by KPMG were too high. E&Y’s reasons for its conclusion that the gains calculated by KPMG may not be appropriate can be summarised as follows:
By excluding capital employed, KPMG's analysis does not take into account the inherent trade offs between capital, labour and overhead;
By taking benchmarks from across the economy rather than from a more representative sample, there is a risk that erroneous conclusions are drawn on the scope for efficiency gains;
Adopting a productivity measure that only reflects historic labour productivity gains may not be consistent with the cost base to which it is applied;
By extrapolating costs, there is a risk that inappropriate benchmarks are applied to a significant proportion of Openreach’s cost base; and
Regulatory precedent may suggest that a lower figure for frontier shift would be more appropriate
A9.54 We consider the points made in the E&Y report in more detail below.
A9.55 In respect of the first point, the E&Y report states that:
“KPMG has limited its benchmarking exercise to an assessment of Openreach’s operating costs ... This approach fails to recognise the trade-offs that exist when firms make investment and operating decisions in relation to the relative proportion of capital, labour and other inputs… Further, KPMG’s approach is to compare Openreach costs against a set of benchmarks without considering the productivity of the various operating inputs. For example, KPMG’s assessment of salary costs should be seen in the wider context of labour productivity; Openreach staff may get paid higher salaries than the benchmark but they may also be more productive.””
A9.56 In respect of the benchmarking exercise, other organisations included in this benchmark will also face this trade-off to varying degrees and attempting to incorporate this into the analysis becomes a subjective issue. E&Y did not suggest any alternative way of capturing this given the scope of the analysis. It is possible that Openreach staff may be paid higher or lower salaries than the benchmark but they may also be more or less productive. This argument can work in both directions depending on whether Openreach staff are more or less productive than the benchmark.
A9.57 In respect of the choice of benchmarks, the E&Y report states
“KPMG has used a number of generic or economy wide benchmarks to assess the relative efficiency of Openreach in respect of the individual elements of Openreach’s operating costs.
A new pricing framework for Openreach
Such an approach risks drawing upon a sample which does not take into account the specific characteristics of the telecoms sector, thereby presenting a risk that conclusions drawn from comparisons are erroneous.
A9.58 As set out in the KPMG report, KPMG discussed with Openreach the appropriateness of the benchmarks used, to ensure a fair representation of the job roles. KPMG met with Openreach to discuss the staff benchmarking, and asked for information on the specific characteristics of these roles that may have allowed more appropriate benchmarks to be identified. We understand that Openreach did not provide the information requested by KPMG. We note that the E&Y Report does not identify a more appropriate benchmark but notes that the benchmark used by KPMG could be either too high or too low.
A9.59 The E&Y Report also notes that
Ernst & Young understands that KPMG has used different benchmarks and studies to assess Openreach’s efficiency in respect of individual cost categories, on a case by case basis. There exists a risk in such an approach that Openreach is compared against a level of operating efficiency which is unachievable in the aggregate
A9.60 This point is probably valid but difficult to quantify. In the absence of an obviously better practicable approach (and none has been suggested in the E&Y report), the approach adopted by KPMG appears to be reasonable.
A9.61 In respect of the need for a comparable sample, the E&Y report states that
“KPMG, having identified general benchmarks for Staff costs, IT costs, Fleet costs and Corporate Overheads, does not normalise the benchmarks to ensure that they are comparable with Openreach. For example, Openreach’s status as a functionally separate business might be expected to limit its ability to exploit economies of scale in central functions such as HR or Finance compared with any “integrated” comparators, and therefore to ensure comparability the benchmark data may require adjustment to account for this.”
A9.62 As well as incurring group central function costs, Openreach incurs its own overheads for its own finance team, legal team, regulatory affairs team and HR function. The pay costs are included in the cost line 'Support Function - Current Pay'. As explained elsewhere in this statement, other respondents to the Second Consultation have challenged the amount paid by Openreach for group costs on top of its own overheads. Economies of scale are one of the main justifications for continuing to pay for group central functions and if Openreach was unable to benefit from the economies of scale of the group functions, it would call into question why these BT Group costs are incurred by Openreach.
A9.63 In respect of the use of extrapolation, the E&Y report states that
“KPMG has identified benchmarks for some 35% of Openreach’s operating cost base. KPMG was unable to identify fully comparable benchmarks for a further 56% of operating cost and therefore, applied a process of “extrapolation” such that it applied its available benchmarks to the remainder of the cost base. As a result, KPMG’s

A new pricing framework for Openreach
185
approach gives rise to the risk that inappropriate benchmarks are applied to a significant proportion of Openreach’s cost base.”
A9.64 We understand from KPMG that, had it received the data it had requested from BT, it would have been able to benchmark a further 7% of the operating cost base, increasing the ‘benchmarked’ proportion of operating costs from 35%-42%, reducing the extrapolated proportion from 56% to 52% and the remaining ‘n/a’ category from 9% to 6%.
A9.65 The risk that inappropriate benchmarks are used is, to some extent an unavoidable risk of extrapolation. However, in the absence of alternative approaches (and none was proposed in the E&Y Report), we consider that the approach adopted by KPMG provided a reasonable basis for determining overall levels of efficiency.
A9.66 In respect of the choice of productivity measure, the E&Y Report notes that
“The scope of KPMG’s analysis includes all operating costs, not just labour costs. Therefore, a labour specific productivity measure is not comparable with the cost to which the productivity measure is being applied, and as such it may represent an inappropriate measure of frontier shift for Openreach’s (labour and non-labour) operating costs. The OECD also provides information on annual multi-factor productivity improvements in the UK, which have historically been around 1% per annum. This may represent a more appropriate measure than labour productivity, given that the productivity figure is applied to both pay and non-pay operating costs.”
A9.67 We agree that there may be arguments to choose a different productivity measure. Total factor productivity might be argued to provide the best measure of productivity growth but depends on a number of assumptions. Labour productivity may be more appropriate for applying to periods shorter than a decade (as in this case).
A9.68 In respect of regulatory precedent, the E& Y report states that
“Ernst & Young notes that Ofcom, in the “Review of BT’s Network Charge Controls – Statement 18 August 2005”, stated that: “To the extent that possibilities for cost reductions in access are relatively limited, it might be thought likely to be an underestimate of core network cost reductions.” Openreach is the “access” business of BT and therefore, given that the average frontier shift for BT as a whole is assumed to be 1.5% in the above context, the appropriate measure for Openreach may, in line with Ofcom’s statement, be below this average. Ofcom’s conclusion may be relevant in the context of the charge controls on Openreach, given that the nature, mix, and level of services provided by Openreach have not fundamentally changed since 2005/06 when the statement was made.”
A9.69 The mix and level of services provided by Openreach may not have fundamentally changed since 2005/6 but the state of the economy has. KPMG was asked to undertake independent analysis rather than rely on historical precedent. The recent changes in economic conditions are therefore relevant to this assessment. In this respect, the E&Y report states that
A new pricing framework for Openreach
“We understand that the high end of KPMG’s range for annual productivity improvements (2.3%) is intended to reflect the impact of a recession on productivity gains…For the higher end of KPMG’s productivity range to be valid in the context of charge control(s) on Openreach services, Ofcom would need confidence that the start and end dates of its charge control are at a comparable point in the current economic cycle to that reflected in the historic averages. This is because short term averages are highly sensitive to the choice of starting and ending year.”
A9.70 KPMG have explained that they sought to factor in the current economic situation as far as possible due to the importance and sensitivity of these assumptions. For example, 1987 was a boom year in the UK economy and KPMG did not consider that it would be appropriate to use this as the starting year for comparison purposes. In light of recent events KPMG consider that it was appropriate in October 2008 to compare this to other periods when the economy was about to enter a major recession.
A9.71 As illustrated by the range of the responses summarised above, we recognise that there will always be limitations to any review of a company’s potential to reduce its costs through efficiency gains and such reviews will always be subject to challenge. However we do not consider that the responses indicate that the conclusions are invalid, nor do we consider that the responses identify a more appropriate basis for estimating the potential for efficiency gains.
A9.72 Overall, we remain of the view that the KPMG report provides relevant - but not conclusive - evidence of the scale of potential efficiency gains and should be considered alongside the other evidence set out in this annex in reaching our final decision.
A9.73 KPMG’s conclusions are stated on the basis that that fault rates remain constant. A future reduction in fault rates would therefore reduce costs further. We consider fault rates within our review of historical trends, below. Several respondents also noted that the KPMG report excluded the possibility of reduced task times. This was made clear in the KPMG report. We consider task times later in this section.
Historical trends
A9.74 In the Second Consultation, we also considered historical trends relating to cost savings due both to efficiency improvements and reduced fault faults. Historical trend analysis assumes that long term trends in cost savings are indicative of the level of efficiency savings in the future.
A9.75 In the Second Consultation, we undertook an analysis of Openreach’s costs since 2006/07 to assess the actual real terms efficiency delivery. In doing this, we adopted a historic measurement that is consistent with the way in which efficiency is applied in the Openreach model. We evaluated the effective reduction in costs relative to the level of costs that would be predicted on the basis of inflation and volume measurements alone. We expressed the cost reductions that are delivered relative to this level as a percentage of compressible costs.
A9.76 We explained that
Efficiency gains in the past two years have exceeded 4% per annum. We estimate that gains could have been up to 6% in both of the last two years.

A new pricing framework for Openreach
187
A lower apparent improvement was achieved in 2006/07. However, this number should be treated with caution as it is based on a comparison of pro-forma results for 2005/06 – before Openreach was established.
A9.77 On the basis of this evidence alone, we explained that - if we considered that historical gains could be repeated into the future - the upper level of the range for future efficiency targets should be at least 4%.
A9.78 We explained that Openreach had argued that measures of historical efficiency savings do not provide a reasonable basis for setting future efficiency targets. Specifically, Openreach argued that the cost savings delivered to date and planned for 2008/09 were linked to significant capital expenditure to improve systems and diagnostic capabilities and on reducing costs such as overtime payments. Openreach asserted that these steps have moved Openreach to a more sustainable base line of costs and the scope for further cost savings is limited.
A9.79 We agreed that there are limitations to the relevance of historical cost trends as a basis for future projections. We also recognised that Openreach may have already delivered many of the easier cost savings and that, in future, opportunities for further efficiency gains will become harder to identify. However, subject to the outcome of this consultation, we considered that the high end of our range for potential efficiency savings must be close to the levels delivered in the past. On this basis, we concluded that a range of between 2% and 4% was appropriate. This rate makes no allowance for future reductions in fault rates.
A9.80 In its response to the Second Consultation, Talk Talk stated that
We think historic performance should set a starting presumption for projecting future efficiency gains. We think that looking forward over the next 4 years the efficiency improvements should be able to increase since the recent cost levels were driven in part by establishing Openreach – now the organisation and EMP is more fully up and running the real efficiency gains should start to kick in. Furthermore, the previous price regulation approach did not incentivise efficiency since it was unclear what the future regime would be. This would suggest future efficiency gains should be able to outstrip the 3% to 7% that has been achieved recently.
A9.81 Talk Talk also stated that
It is worth noting in this respect the frequent ‘pleas’ from BT that it has driven efficiency very hard and there is nothing more left that can be achieved. BT in their response to the first consultation said “an assumption of a 1% reduction on the broad “compressible” costs [i.e. 0.6% overall] would be a very challenging target. Anything above this level would be unreasonable” …Time and again in charge setting situations BT have pleaded that they can only achieve around 1% efficiency – yet all the evidence has shown that they then go onto achieve 4% and 5% (or more). For example:
• WLR price setting in 2006: “BT stated that the efficiency target [1.5%] was too challenging”

A new pricing framework for Openreach
• LLU price setting in 2005: “BT considers that an efficiency factor of 1.5% is very challenging and that a lower assumption should be used”
• PPC charge setting in 2004: “BT set out further arguments that a measure [of its inefficiency] of 0% to 1% is more appropriate”
• Network charge control in 2005: “BT is already at the frontier of network efficiency. A target of less than 2% per annum improvement is more appropriate”
A9.82 In its response, Openreach noted that
Openreach has in fact in Q3 2008-9 achieved efficiencies of the order proposed by Ofcom in the Second Consultation (Openreach achieved efficiencies of ~4% in Q3 2008-9 compared with Q3 2007-8). This was achieved as a result of considerable work to bring forward as many potential cost savings as possible with a view to mitigating the impact of the current very difficult economic circumstances. Openreach will continue to set itself challenging targets, and we expect to be in a position to realise further efficiencies for the remainder of the 2008-9 financial year by continuing focussed efforts to bring potential cost savings forward as rapidly as possible. However, these gains are not sustainable or replicable over a sustained period.
A9.83 Since the Second Consultation, we have also obtained – through formal powers – further information on Openreach’s expectations for future cost savings. This information supports Openreach’s statement that it is likely to deliver efficiency gains equal to around 4% of its compressible costs in 2008/09.
A9.84 However, Openreach has also argued that maintaining annual efficiency gains at this level would not be sustainable. Specifically, it argues that an efficiency target of 4% would imply an even higher percentage of reduction in the Openreach workforce and the consequences of such cuts in FTE would be significant and makes the following observations:
Maintaining service levels in the face of such cuts would be extremely difficult if not impossible with the current systems and network;
Openreach has reduced the extent to which engineers work overtime (with a resulting removal of certain costs associated with overtime) and reduced use of agency staff. As a result, the scope for further significant cost reductions in these areas is limited;
Reducing headcount will reduce Openreach’s ability to react to peaks in demand and to meet the service levels contractually required in terms of fault repairs and provisioning and expected by industry;
To operate the business effectively, Openreach needs to maintain sufficient flex in its labour force;
Openreach must ensure its workforce is suitably skilled, experienced and resourced to address all future technological requirements;

A new pricing framework for Openreach
189
Higher reductions in opex will require additional capex; and
The variability of demand for provisioning is linked to the absence of effective incentives for CPs to provide accurate forecasting.
A9.85 In their joint response, CWU and Connect stated that
there are limitations to the relevance of historical cost trends as a basis for future projections. Openreach functions are not new and Openreach’s assumptions as to efficiencies on controllable costs indicates it has already moved down the productivity curve significantly, leaving little potential for significant efficiencies
A9.86 We consider that historical trends continue to represent an important element of the evidence to be taken into account in determining the scope for efficiency savings in the future. We do not accept the suggestion by some respondents that the current regulatory regime would leave Openreach with no incentive to deliver efficiency savings; on the contrary we consider that the combination of fixed nominal prices for the regulated services and the provision of unregulated services would have offered Openreach (and BT group) plenty of incentive to reduce its costs.
A9.87 We accept that there may be an incentive for Openreach to understate the potential to maintain historical levels of efficiency gains in the future (in the same way that it may be in the interest of its customers to offer high estimates of this potential). However, we have seen no compelling evidence to suggest that Openreach will be able to deliver gains in excess of those it has delivered recently on an ongoing basis.
A9.88 To inform our assessment further, we obtained – again, through our formal powers - Openreach’s latest financial forecasts for 2009/10. These include Openreach’s cost and revenue forecasts for 2009/10. The information was provided on a confidential basis.
A9.89 At our request, Openreach also provided a reconciliation between the numbers reflected in its response to our Second Consultation and its latest financial forecasts.
A9.90 Openreach has explained that its 2009/10 unit cost estimates set out in Openreach’s response to the Second Consultation were consistent with its previous financial forecast (ie prior to the latest version). Its latest forecasts project lower operating costs for 2009/10 than it had forecast at the time of its response. To some extent, the reduction in costs reflects reduced volumes. However, given that a significant proportion of Openreach’s operating expenditure is not directly variable with volumes, the estimated savings is greater than the savings that would be achieved through reduced volumes alone.
A9.91 The additional savings also include specific savings that we have picked up directly in our final assessment of Openreach’s costs – such as reduced cumulo rates – or are explicitly excluded from our assessment of costs – such as the light user scheme. However, there remains an element of further savings beyond these specific categories, that is successfully delivered could potentially give rise to efficiency gains in excess of the 4% delivered in 2008/09.
A9.92 BT has explained that the forecast represent aggressive targets that offer no certainty that the savings will be delivered. Further, to the extent that there may be

A new pricing framework for Openreach
scope to deliver savings in excess of those reflected in the earlier forecast (and therefore in Openreach’s March cost estimates), these must be considered in light of the significant execution risk and alongside the cost of delivering the possible savings. Openreach has also provided its estimates of the cost of achieving the additional savings.
A9.93 We accept that the delivery of the forecast savings is not without risk or cost. On this basis, we consider that an efficiency target of 4%– at the top of our range - is appropriate for 2009/10.
A9.94 Openreach has also argued that the higher than expected efficiency gains in 2008/09 and 2009/10 reflect the acceleration of savings that might otherwise have been delivered in subsequent years, rather than evidence of its ability to deliver similar rates in the future.
A9.95 On this basis, it has argued that efficiency target should fall by 1% in each subsequent year. As explained in the Second Consultation, we recognise that, as Openreach may have already identified many of the easier cost savings, future savings may be harder to identify. However, in light of the historical trends, savings projected for 2009/10 and the investment made to deliver those savings, we have not been persuaded that the potential for future savings will reduce as quickly as Openreach suggests.
Other evidence
A9.96 We explained in the Second Consultation that Openreach’s current charges sit somewhere just below the European average. We also explained that, while this evidence does not indicate that Openreach’s charges for MPF are currently excessive, neither does it provide unambiguous evidence to support the need for price rises.
A9.97 In its response, Talk Talk used comparisons with prices in Europe to argue that Openreach’s costs are inefficiently incurred. To support this view, Talk Talk refer to a report from Dr Chris Doyle at Warwick Business School, which stated that
Openreach is delivering services at claimed costs which are too high relative to potential. I conclude that either BT is much less efficient than it should be, or it is exaggerating its costs or it is being allowed to make excess profits by the regulator.
A9.98 The basis for this conclusion is that Openreach sits mid-table in EU wholesale price comparisons when it should be at the top, because, according to Dr Doyle,
The UK introduced competition into telecoms markets before almost every other EU member state;
High population density in the UK (and in particular England, the highest in Europe) favours lower cost network service costs;
The size of the UK population enables Openreach to benefit from considerable scale economies; and
Ofcom’s elaborate regulatory oversight in the form of functional separation.
A new pricing framework for Openreach
191
A9.99 We consider that international price benchmarking is a relevant factor in any assessment of the need for price changes and provides some useful context for a review of costs. However, pricing decisions by other regulators may reflect a range of different assumptions and take account of different national circumstances. Therefore while international benchmarking should be – and has been – taken into account alongside the other evidence, including the historical and statistical analysis, care should be taken before drawing too much inference from the indirect link between charges elsewhere in Europe and future costs in the UK. Indeed, we note that Dr Doyle does not translate his views on international benchmarking into a proposed efficiency assumption.
Conclusion on efficiency gains
A9.100 In the Second Consultation, we concluded that annual efficiency gains – excluding fault rates - of between 2% and 4% should be achievable. Responses to the Second Consultation offered a variety of views ranging from 2.5% on some of Openreach’s costs to 6% on all of its costs.
A9.101 Openreach argued that any application of efficiency over the next 4 years should be approximately 2.5% per annum, derived as follows: starting at 4% from 2009/10, then 3% in 2010/11, 2% in 2011/12, and 1% in 2012/13. This compares with Openreach’s original estimate, as set out in the First Consultation, of 1% per annum.
A9.102 In their joint response, CWU and Connect concluded that
“it appears unrealistic to expect Openreach to achieve anything approaching 4% efficiencies year on year. Furthermore, to assume this level of efficiency when establishing the pricing framework would be to place undue pressure on Openreach and risk a serious erosion of service quality and customer satisfaction”.
A9.103 Another (confidential) response also questioned whether Openreach’s ability to deliver further efficiency gains will be as great as Ofcom estimates.
A9.104 On the other hand, C&W stated that
“we believe that Ofcom’s target should be at least 3.2% pa of total operating costs and potentially as much as 6% pa, rather than their current range of 1.2 – 2.4% of total operating costs”.
A9.105 Talk Talk estimated that, over the next four years Openreach should be able to achieve a 5% to 6% efficiency improvement over all of its costs.
A9.106 As illustrated by the range of views set out in the responses, this is a difficult area to assess with certainty. However, as explained above, we consider that historical gains provide an important element of the evidence available to us.
A9.107 With this in mind, we consider that the 4% gains delivered in 2008/09 provide a good indication of the gains that might be achieved in 2009/10. We have not seen compelling evidence that the recent gains can be exceeded on an ongoing basis and accept Openreach’s arguments that some of the quick wins achieved in the past may not be replicable, however, we have not been convinced that future gains will tail off as quickly as Openreach suggest.

A new pricing framework for Openreach
A9.108 On this basis we have projected annual efficiency targets as set out in the table below. This is in addition to the specific savings identified elsewhere in this Statement and the reduction in fault rates, considered below.
2009/10 2010/11 2011/12 2012/13
Efficiency gain 4% 3% 2% 2%
Fault rates
A9.109 The efficiency assumptions described above make no allowance for future reductions in fault rates.
A9.110 We explained in the Second Consultation that Openreach’s cost projections assume that fault rates will stay flat beyond 2008/09. As part of its support for this assumption, Openreach provided the following chart setting out historical and projected levels of access faults.
Chart A9.1: Historical and projected access fault rates, per Openreach
0
500
1000
1500
2000
2500
3000
3500
4000
4500
Fau
lts (k)
1994 1996 1998 2000 2002 2004 2006 2008 2010 2012
Year
A9.111 We explained that this evidence indicated that fault rates have fallen at a rate of between 4% and 10% depending on the period under review. We accepted many of Openreach’s arguments that some of the larger declines in fault rates are unlikely to be repeatable in future but considered that a projected fault rate of somewhere around 4% to 6% represents a realistic target.
A9.112 Respondent’s views varied. C&W and Vodafone agreed with that the range of 4% to 6% set out in the Second Statement represented a realistic target.
A9.113 Sky also argued that the 4% to 6% fault rate reduction assumed by Ofcom is too conservative. Specifically, it argued that
…as MPF becomes more widely adopted, it seems inconceivable that process industrialisation will not realise considerable gains in

A new pricing framework for Openreach
193
MPF fault rates. More generally, BT places great store in its service improvement and “right-first-time” initiatives to deliver tangible improvements.
A9.114 Talk Talk explained that they believe that a 4% to 6% annual reduction represents a “conservative/low” forecast for what could be achieved and believe that a 5% to 10% annual reduction could be achieved and provided the following reasons to support this view.
Even with a 4% to 6% improvement BT will remain significantly worse than best practice
BT has said to shareholders that it is planning a 10% to 20% decline
There are a number of operating initiatives that suggest the potential for substantial improvement.
A9.115 Openreach has argued that TalkTalk’s proposed fault rate reduction rates are not reasonable. It argues that TalkTalk’s assertion that the best practice fault rate is 0.06 per line per year is based on dated and disparate information and that Talk Talk’s calculation of BT’s fault rate is also incorrect leading to incorrect assumptions.
A9.116 Openreach considers that the appropriate source of benchmarking information is the ETNO survey which provides actual data on the fault levels achieved by incumbent operators on copper lines across Europe. It argues that survey indicates that Openreach is now in the upper quartile for fault rates. It provide this
A9.117 Openreach argued that the 4% to 6% reduction was excessive, explaining that it considered the current level of faults and associated repair to be at a manageable, “efficient” and relatively stable level.
A9.118 On this basis Openreach forecasts that the overall fault rate is more likely to remain relatively flat. This projection reflects Openreach’s view that decline in the base level of faults, and continued improvements in the management of volatility associated with rainfall and network interventions would be offset by the impact of factors which are likely to increase the level of faults reported into Openreach including the following factors
Natural degradation of the ageing network;
Increasing ‘cable fill’;
The recently implemented 6dB rule, as a result of which line loss in excess of 6dB is reported as an Openreach line fault; and
The adoption of the SIN5XX Statement of Requirements which will generate additional faults.
A9.119 In light of the wide range of views on the potential to reduce fault rates, we asked Openreach to provide further information to improve our understanding of its ability to repeat recent reductions in fault rates.
A9.120 Openreach stated that four factors contribute to its view that fault rates will stay flat, as follows:

A new pricing framework for Openreach
the gains made in the past via proactive improvement tapers off after 2009/10 as the opportunity for efficiency investment reduces;
the impact of broadband take up– which tends to increase faults – continues to rise, but to a lesser extent as growth in broadband slows;
the volatility in fault rates has now been taken out and no further improvements are to be made; and
network intervention and repeat faults falls with the overall fault rates.
A9.121 Openreach provided a breakdown of the factors driving reductions in fault volumes in 2008/09. The analysis indicated that a 12% deterioration of external faults – due to the ageing of the network – offset by reductions due to investment in the network. Openreach attributed around a half of the reduction in faults to specific investment programmes –such as investment in test and diagnostic equipment, frame quality, field force training and the targeting of high fault nodes – that were largely complete and could not be expected to deliver similar reductions in future.
A9.122 Openreach also provided data that indicated that investment in weatherproofing had significantly reduced the implications of bad weather on fault rates to the point where – in 2008/09 – the strong correlation between high rainfall and increased faults seen in previous years had been all but removed. On this basis, Openreach argued that additional investment in weatherproofing cannot be expected to deliver fault reductions in line with previous rates.
A9.123 In 2009/10 Openreach has provided projections that predict that the effects of ongoing investment in the network and fewer lines, will offset the increase in fault rates due of network deterioration plus the implications of other factors that are likely to push fault numbers up – notably CP migration plans– but deliver little net reduction in the year. Based on this analysis Openreach estimated that the number of faults per 1000 connections would fall by less than 1% in 2009/10.
Conclusion on fault rates
A9.124 In light of the above, we consider that Openreach’s ability to reduce fault rates, at a time when other factors might be pushing fault rates up, may be less than we had first thought. However, we do not accept that Openreach – that has managed to reduce fault rates consistently over the last twenty years will be unable to find ways to reduce fault rates further in the years ahead. On this basis, we conclude that annual reductions of around 2% should be achievable.
2009/10 2010/11 2011/12 2012/13
Reduction in fault rates
2% 2% 2% 2%

A new pricing framework for Openreach
195
Annex 10
10 Ancillary services treatment and related issues Introduction
A10.1 This Annex sets out our detailed arguments on the proposals for the treatment of Ancillary services including our responses to stakeholder comments
A10.2 The Annex also considers some related issues on the treatment and status of new services and those outside explicit charge controls
A10.3 This Annex supports the position on ancillary services set out in Section 6.
Proposals in the second consultation
A10.4 We proposed in the Second Consultation that the Ancillary Services should be grouped into baskets of services, built around the underlying core service, as follows:
MPF ancillary services, including new provisions and migrations;
SMPF ancillary services, including new provisions and migrations; and
Co-mingling services, including services related to the provision of space at BT premises.
A10.5 We also proposed some basic principles to be adopted when designing these baskets, namely the regulation imposing the charge controls should:
be easy to understand and straightforward to implement;
contribute to efficiency in service provision;
ensure that the controls cannot be manipulated by Openreach in a way that puts other CPs at a disadvantage.
A10.6 Having considered the responses to the First Consultation, we considered that a basket approach had a number of advantages, including:
flexibility: baskets allow flexibility so that individual charges can reflect cost and demand changes;
efficient recovery of common costs: baskets provide incentives to recover common costs efficiently;
practicality: baskets are practical given the large number of charges, thus reducing the administrative costs of setting charges; we noted, in particular, that it would be a very major exercise to set individual controls for over a large number of services (in excess of one hundred in this case) with any confidence that each charge would be set at an appropriate level.

A new pricing framework for Openreach
A10.7 We recognised, however, concerns raised by those responses that dangers existed with allowing too wide baskets, especially the risk of BT distorting competition by structuring charges to favour its own downstream operations. For example, if there are differences in the services that BT tends to buy relative to other CPs, then Openreach may set low charges for those services BT tends to buy and high charges for services that other CPs tend to buy. In particular, as BT has an incumbent position, it may tend to favour high switching costs ie increase charges for connecting new customers in favour of low rental costs, which would be contrary to the interests of new entrants.
A10.8 We therefore proposed that separate controls remain appropriate for the Core Rental Services because these charges represent a very significant component of total costs for CPs and CPs needed to have confidence in the future levels of them. We also considered that the small number of such charges meant that it was practical to set each individually. For the Ancillary Services, we proposed separate broad baskets for each product family, combined with a limit on the extent to which each individual charge in the basket can rise in each year.
A10.9 In light of the above, we proposed in the Second Consultation the following three baskets85 for the LLU charge controls (which excluded the Core Rental Services themselves as we proposed to make them subject to separate controls):
MPF ancillary services, including:
o Provision charges;
o Project managed migration charges;
o Modify, cease, amend, cancel and rejection charges; and
o Assurance charges
SMPF ancillary services, including:
o Provision charges;
o Project managed migration charges;
o Modify, cease, amend, cancel and rejection charges; and
o Assurance charges
Co-mingling services, including:
o Tie cables;
o Accommodation; and
o Power.
A10.10 We noted in the Second Consultation that these proposed baskets were broader than some CPs had proposed in their responses to the First Consultation. For example, we were not proposing to set individual charge controls for connections,
85 The precise meaning of each of these baskets was defined in the statutory notification published under sections 48(2) and 86 of the Act, at Annex 8 to the Second Consultation.
A new pricing framework for Openreach
197
ceases and new provides as some CPs had suggested in response to our initial wide question on design of possible new controls in the First Consultation.
A10.11 We considered, however, there are a number of protections already. All charges within the baskets are subject to cost orientation. Also the sub-caps that we proposed to apply to some individual charges should give some reassurance as Openreach would not be able to increase key charges beyond the overall control levels. Further, we suggested an inertia clause to limit the extent of relative charge movement in a given period. Our view in the Second Consultation was that this approach struck a reasonable balance between providing sufficient protection and predictability to CPs against Openreach taking advantage of the basket structure and allowing some flexibility to Openreach to ensure that individual charges reflect costs and recover common costs in an efficient way.
A10.12 We invited stakeholders’ detailed views on these proposals.
Responses to the Second Consultation
A10.13 There was a wide range of responses on the proposals for baskets both in terms of the scope of the baskets (i.e. the services to be covered) and their effectiveness (i.e. the efficient allocation of resources and the protection of service purchasers). We summarise below the main responses received on these matters. We also summarise responses received on some other specific matters (e.g. sub-caps on migration charges) as part of setting out our conclusions below.
A10.14 Openreach noted that:
Broad pricing baskets provide greater pricing flexibility when not combined with strict cost-orientation obligations. Cost-orientation obligations, where each and every price point is required to be priced on LRIC + common costs+ ROCE are imposed in the WLR and LLU markets. A broad pricing basket would mean that Openreach has the flexibility to price particular component products at levels below LRIC and others higher in response to market demand86. Innovative pricing structures would be completely removed if Ofcom’s proposals on the shape of baskets were coupled with sub-caps and additional constraints on individual products.
Broad pricing baskets would also increase the ability for Openreach to undertake promotional pricing offers. Such initiatives are generally welcomed by our CP customers as it means that we can respond to their needs. It also enables greater levels of competition at the retail level as CPs respond in different ways to the Openreach offers.
Narrow pricing baskets would restrict Openreach’s commercial responsiveness. CPs generally do not buy particular individual components such as connection (or migration) and rentals. Rather, CPs necessarily purchase them together. Therefore, Ofcom should construct broad baskets which reflect the demand rather than arbitrary and inflexible baskets at a component level.
A10.15 This view of the advantages of wider baskets stands in contrast to the views of many other stakeholders who were concerned that the proposed scope of the baskets already offered opportunities for Openreach to structure prices to their disadvantage.
86 We do not consider this to be a correct interpretation of the flexibility in a basket – see below.
A new pricing framework for Openreach
A10.16 For example, Talk Talk argued that “the most obvious forms of abuse result from reducing the price of products used internally and increasing the price of products used externally (whilst staying within the overall cap)”. According to this respondent, ‘BT has done this for years and one of the most blatant examples of this was in the AISBO basket where it priced BES products (which BT did not purchase itself) at 2.5 times FAC’. Though the incidence of this should reduce in time with the advent of more equivalence (and so BT using more and more of the products other operators use), this respondent considers that there will continue to be differences in the mix of products that BT purchases due to their different point in the lifecycle (e.g. market share capture or network transition or stability) or different business model (e.g. SMPF based or MPF based). Talk Talk notes, for example, that BT may reduce the price SMPF services compared to MPF since it uses little MPF today; there is a potential for abuse since BT uses 21CN tie cables and other operators use standard ones.
A10.17 Stakeholders also noted the need to protect key services from excessive prices rises. The FCS noted the need to protect the key migration charges for excess prices. Other stakeholders, while supporting the principle of baskets, argued that insufficient assessment of the implications of the prospective overall control values and the individual component price constraint levels has been undertaken. They argue, should Openreach be afforded too great a degree of freedom in setting migration and cease charges, it could undertake activity that was materially damaging to competition (by, for example, structuring charges to favour its own downstream operations). Talk Talk called for more individual service charges to minimise these risk.
A10.18 There was also a concern expressed by stakeholders that there were a number of services that were not included in the baskets that they believed should be there. Some of these services were introduced since the consultation (for example, Talk Talk and Sky highlighted the network right when tested charge (RWT)).
A10.19 Some stakeholders also argued against the proposal that other services had been excluded on the basis that Ofcom had identified as not being central to the core regulated service provision. One stakeholder noted that the list of “non-regulated services” at Annex 7 to the Second Consultation – which were not identified in the same amount of detail in the First Consultation – appear to include a number of services which fall within the relevant markets and must therefore be subject to cost orientation.
A10.20 Finally, there was a concern, expressed by Talk Talk and other stakeholders, around the controls on the creation of new services. In particular, they say that the definition of a specific basket of services offers an incentive on BT to create ‘new’ services which might partially replace services within the basket but not be bound by it and also the general question on how we should include new services within the framework. They therefore comment that Ofcom has not been clear how new services would be treated.
Design of individual and baskets controls
A10.21 We accept that the use of baskets has inherent limitations as well as advantages. The basket boundary does necessarily limit the ability of Openreach to restructure their pricing. We consider this is an appropriate trade-off in addressing the concerns of other stakeholder about gaming of controls. We note that Openreach considered that a wide basket would allow them the flexibility to price ‘at levels below LRIC’. Clearly LRIC is a first order test of the appropriateness of a price. Our proposed

A new pricing framework for Openreach
199
charge control (FA3(A).1) is “without prejudice to the generality of Condition FA3”. We have clarified this position in the new paragraph FA3.1(X) of Condition FA3 as set out in of Schedule 2 to the notification published in Annex 3.
A10.22 Therefore, we consider that the existing proposed divisions between MPF, SMPF and co-mingling baskets are sound as the opportunity raised, for example, by Talk Talk with respect to the incentive for Openreach to favour SMPF over MPF are minimised.
A10.23 Equally, for reasons set out in the Second Consultation, we consider that it is not appropriate to look to smaller baskets or increased use of individual charges, particularly as such approach would substantially reduce the flexibility of Openreach to restructure charges to reflect changes in demand by its customers.
A10.24 Accordingly, we have decided to give effect, with some minor modifications discussed below, to our proposals in the Second Consultation on the appropriate treatment of the Ancillary Services.
Inertia clause
A10.25 In the Second Consultation, we proposed the inclusion of an inertia clause87 to apply for the baskets, restricting individual relative price movement of charges. The aim was to protect Openreach’s customers from radical restructuring of charges on a year by year basis.
A10.26 In addressing the issue of any too rapid re-adjustment of charges, we considered that, while we would not wish to lose the flexibility that baskets provide in respect of re-balancing charges efficiently, this flexibility should be constrained. We therefore proposed that the relative level of price changes within a basket should be limited so that excessive changes in prices in a given year would not be possible. Specifically, we proposed that in any year no price can change at a rate that is a defined percentage above or below the average rate that is allowed for the basket overall. To this end, our proposal was that the percentage controls should be between 5% and 10% (so, for example, if the basket control allows average increases of RPI + 0, and the inertia control is 5% no individual price can move by a rate that falls outside of the range between RPI +/- 5%.
A10.27 We acknowledge the concerns expressed by the stakeholders on the potential for Openreach to substantially and rapidly change the charges for services to the detriment of their customer. However, we consider that it would be inappropriate to unduly restrict Openreach’s decisions within the baskets (except for the case of migration charges – see below). For that reason, we consider that the controlling percentage for the inertia clause should be set at the upper end of the proposed range, which is 10%.
A10.28 In our view, that level should ensure that in any given year Openreach customers will not experience an unpredictable change in a given charge, while allowing Openreach to substantially change the balance of charge over time in response to demand.
87 The wording of this inertia clause was set out in paragraph FA3(A).6 of Schedule 1 to the notification published at Annex 8 to the Second Consultation.

A new pricing framework for Openreach
Starting charges and sub-caps on migration charges
A10.29 We have reviewed the current individual migration charges proposed for inclusion in the baskets and with three exceptions consider that they are suitable for use as the starting charge. The exceptions, are the starting charge for MPF New Provides, and MPF and SMPF Connection, which are discussed further below.
A10.30 In the Second Consultation, we acknowledged that, as raised by some respondents to the First Consultation, that there is a particular sensitivity to the key migration charges. The charges for these services would have an impact on the cost of obtaining new customers and could act as a barrier to entry. Also, while it may be convenient to consider these services within the overall ancillary baskets, we also noted that they are costs borne primarily by non-BT CPs.
A10.31 We, therefore, proposed in the Second Consultation to apply sub-caps88 on the charges applying to MPF transfer, MPF new provide, MPF cease, SMPF transfer and SMPF cease. We considered that these sub-caps would limit the potential increases in those charges to the overall limit of the basket. They would, however, allow Openreach the flexibility to re-balance all charges within the basket.
A10.32 Having considered the responses to the Second Consultation, we consider that the arguments presented by the stakeholders for the protection of these key services to support on-going competition confirm the need to impose the proposed sub-caps. In our view, these sub-caps will ensure that Openreach is unable to raise the cost of the migration charges in such a manner as to discourage or distort competition for new customers. The sub-caps still allow Openreach to trade-off between lower charges for these services (that is below the sub-cap) and increased charges for un-capped services within the basket. For these reasons, we have concluded to adopt these sub-caps.
A10.33 With respect to the size of the sub-cap, we have seen no evidence that the existing prices are set at an inappropriate level relative to other charges with the exception of the MPF new provide and MPF and SMPF connection charges mentioned earlier. Accordingly, we consider that it is appropriate to set the sub-caps equal to the basket control – that is the increase in the charges for these select services should not be in excess of the weighted average movement in the basket.
A10.34 The starting charge and sub-cap exceptions are the charges for MPF New Provides, MPF transfer and SMPF Connection. Our analysis suggests that these charges are substantially out of alignment with FAC costs. In particular, we need to consider the relationship between this charge on the promotion of new LLU services compared with the WLR new provide charge (which we will shortly be considering in the WLR Charge Control consultation). The MPF charge, currently £99.95, is substantially above FAC costs (which is around £42 in 2012/13) while the MPF tranfer and SMPF connection, current £34.86, is currently below FAC (which is around £50 in 2012/13).
A10.35 Accordingly we are proposing a one off initial adjustment of MPF new provide and for MPF and SMPF connections and distinct sub-caps for the two charges (.
88 These sub-caps were specified in paragraphs FA3(A).1(d) to (h), respectively, of Schedule 1 to the notification published at Annex 8 to the Second Consultation.

A new pricing framework for Openreach
201
Changes to services falling within the baskets
A10.36 In light of responses received to the Second Consultation and the recent revision of the services offered by Openreach since our consultation, we have made smaller changes to the precise products and/or services falling within the baskets. Specifically, the inclusion of a number of services which have emerged since the Second Consultation are summarised89 in Table 8.1 below.
Table 8.1 – New services since last consultation
Service Basket Current charge
SMPF Network RWT (SMPF basket) SMPF basket £70.42
MPF Network RWT (MPF basket) MPF basket £70.42
LLU Internal Tie Cable Cease
Cease of 1-10 Cables Co-mingling £698.73
Cease of 11-20 Cables Co-mingling £786.51
Cease of 21-30 Cables Co-mingling £874.29
Cease of 31-40 Cables Co-mingling £960.90
Cease of 41-50 Cables Co-mingling £1,048.68
Upgrade of existing BBUSS 3 Point Of Presence to B-BUSS 7 (space only)
Co-mingling £1,697.20
Downgrade of existing BBUSS 7 Point Of Presence to B-BUSS 3 (space only)
Co-mingling £628.17
A10.37 For the avoidance of doubt, we do not consider that the introduction of these services, which largely represent charges for costs already present in our models, represent a material change to the baskets. Their inclusion ensures that the additional revenues against existing costs are taken into account in setting the basket controls.
Other Openreach LLU related services
A10.38 At Annex 7 to the Second Consultation, we published a list of LLU services for the purpose of identifying their current prices, including when and if charges were set for them. This list was based on a similar list provided by Openreach, which also included our initial view on whether or not the services were subject to the cost orientation requirement. One respondent to the Second Consultation noted in particular that “this list represents BT’s view – it has not been made the subject of separate consultation – and it is not necessarily endorsed by Ofcom”.
A10.39 Whilst we invited general comments on that list (including about the statements on cost orientation as they had essentially been derived from BT’s own perception of charges that should be subject to cost orientation), we did not propose any changes
89 The Annex to Condition FA3(A), as published in the statutory notification under section 48(1) and 86 of the Act setting the new SMP condition at Annex 3 to this Statement, sets out the full meaning of each respective basket.

A new pricing framework for Openreach
to the existing regulation in this regard, such as by modifying SMP Condition FA3 (Basis of charges) to exclude certain services or products from this cost orientation requirement. In contrast, as discussed above, we proposed simply to modify Condition FA3 by inserting the new paragraph FA3.1(X) to clarify the relationship between that requirement and the proposed new controls.
A10.40 This was because, while our provisional statements on cost orientation in that list supported our proposed baskets, they did not have any material impact on our views as to which services should fall within the baskets. Rather, our proposals on the appropriate baskets were based on treating those services and/or products that form part of core services and therefore essential to their provision, such that a CP cannot purchase LLU services from Openreach without also purchasing one or more of such services and/or products as were captured by our proposed baskets. In contrast, we considered that some services (such as MPF enhanced care) should fall outside the basket in question as it was not essential by a CP in purchasing LLU services. This approach coincided with Openreach’s own view on cost orientation.
A10.41 We have carefully reviewed the responses to our provisional statements on services subject to cost orientation as contained in that list. We note, in particular, that Openreach argue that the distinction between services subject to cost orientation and those not subject to cost orientation is that those not subject to cost orientation are discretionary and not a direct requirement in terms of network access or LLU. Other stakeholders argue that such services are an integral element in the provision of a LLU services and that, in general, they have no alternative source of supply of these services.
A10.42 We consider that it is, nonetheless, important to clarify that the distinction Openreach drew between LLU related services that were or were not subject to cost orientation set out in the list of the Second Consultation may not be accurate. Therefore, we no longer maintain our provisional statements on services subject to cost orientation as contained in that list.
A10.43 To deal with this matter, it is necessary to have regard to the wording of Condition FA3.190, which reads:
“FA3.1 Unless Ofcom directs otherwise from time to time, the Dominant Provider shall secure, and shall be able to demonstrate to the satisfaction of Ofcom, that each and every charge offered, payable or proposed for Network Access covered by Condition FA1 (local access) and/or Condition FA9 (local loop unbundling) is reasonably derived from the costs of provision based on a forward looking long run incremental cost approach and allowing an appropriate mark up for the recovery of common costs including an appropriate return on capital employed.”
A10.44 It is clear that Condition FA3.1 applies91 to the market for wholesale local access
services within the UK but not including the Hull Area and to the provision of Co-Location, in which BT has been found to have SMP. The key question is therefore whether the product or service in question falls within that market and, as such,
90 See Schedule 1 to the statutory notification published under sections 48(1) and 79(4) of the Act at Annex 1 to the Statement entitled ‘Review of the wholesale local access market’, published by Ofcom on 16 December 2004: http://www.ofcom.org.uk/consult/condocs/rwlam/statement/rwlam161204.pdf 91 See paragraph 1 of Schedule 1, ibid.

A new pricing framework for Openreach
203
subject to BT’s requirement to provide Network Access92 under either Condition FA1 or, more specifically, the specific LLU services subject to Condition FA9. As regards the latter (but not the former) obligation, it is necessary to determine what ancillary services may be reasonably necessary for the use of other services specified in (i) to (vii) of the definition of “Local Loop Unbundling Services”. This is a question of law and fact in applying existing regulation and, as noted above, is unaffected by our proposals in the Second Consultation.
A10.45 As a result, given also that our conclusions on appropriate baskets have been reached by identifying those forming part of core services and, therefore, essential to their provision, we consider that it is unnecessary to apply that test for each and every product or service to determine whether it falls with BT’s cost orientation requirement. But we consider that it might assist if we make a couple of observations on this matter in light of the responses received.
A10.46 First, our views on the approach set out above have not changed. Indeed, we note that BT responded to our consultation of 26 August 2004 setting out our final proposals on the WLA market analysis, including remedies, by stating its view that LRIC+ should not be automatically prescribed to any other future product which may be considered part of the wholesale local access market. We responded to that point in our statement of 16 December 2004 that we considered LRIC+ being an appropriate charging basis for all services within that market.93
A10.47 Secondly, in light of Openreach’s response to the Second Consultation, we note in particular that there is no distinction drawn in Condition FA3.1 (or elsewhere) between discretionary or non-discretionary services, nor is there a boundary proposed around what should be considered a core service.
A10.48 That being said, there remains the question of whether such services (outside the core set required for the provision of the basic service) should be subject to a specific charge control. In the Second Consultation, we suggested that these services should remain outside of a charge control as this would discourage innovation by BT and BT would not have the appropriate incentives to look to introducing new services.
A10.49 Openreach is encouraged to continue to explore opportunities for enhancement and to negotiate with its customers for the development of new services and tariffs which reflect the complexity of the service, the volumes required and the level of care needed.
A10.50 We consider that this argument remains sound and, therefore, our proposals for charge controls remain unchanged. It is critical that Openreach retains an appropriate incentive to offer services of enhanced quality or additional functionality. We consider that an unduly proscriptive approach risks stifling this incentive. Accordingly, we have decided to limit the services within each basket to, as far as possible, those which are core to the provision of the basic service. We will also consider this issue in more detail in the next Wholesale Line Access Market Review.
92 Pursuant to paragraph 3 of Schedule 1, ibid, the term ‘Network Access’ shall have the meaning prescribed in section 151(3) of the Act. 93 See at paragraph 6.81.

A new pricing framework for Openreach
Treatment of any ‘new’ services introduced
A10.51 Finally, we address the issue of treatment of new services as raised by some respondents, particularly should BT create ‘new’ services which might partially replace services within the basket.
A10.52 As a matter of policy, we would not wish Openreach to deliberately or inadvertently revise its service structure in such as way as to reduce the scope of services covered by the baskets and introduce these elements in a less regulated manner. In the Second Consultation, we included a proposed mechanism94 to deal with any material changes (other than to a charge) made by BT to any product or service subject to the charge controls. We proposed that a “material change” would include the introduction of a new product or service wholly or substantially in substitution for that existing product or service. In such a case, our proposal was that the charge controls would have effect subject to such reasonable adjustment to take account of the change as Ofcom may direct to be appropriate in the circumstances. Before giving such a direction, Ofcom would consult on its proposal in accordance with the process set out in section 49 of the Act. On giving such direction, BT would be required to comply with it under Condition FA3(A).14.
A10.53 We, therefore, believe that our proposals were sufficiently clear on how new services would be treated. Having considered the responses, we remain of the view that the above-mentioned mechanism is also appropriate to address the concerns raised by the respondents. We have, however, decided to modify the definition of each basket to supplement that mechanism by ensuring that the baskets remain fully transparent going forwards as to their products and/or services, should any changes be made from time to time. If so, Ofcom would, following consultation, give a direction to amend the list of services covered by the basket in question as set out in Parts 1 to 3 of the Annex to Condition FA3(A) that we have decided to adopt.
A10.54 Leaving those mechanisms aside, we would nonetheless expect Openreach to retain in each basket the full functionality presently contained within the basket defined in the Annex to Condition FA3(A). In any event, we note that such ‘new’ services may fall within the cost orientation requirement in SMP Condition FA3, provided the matters discussed above are satisfied.
94 See paragraph FA3(A).11 of Schedule 1 to the notification published at Annex 8 to the Second Consultation.
A new pricing framework for Openreach
205
Annex 11
11 Responses to this consultation Introduction
A11.1 This annex provides a list of respondents to the First and Second Consultations.
Responses to the First Consultation
A11.2 Responses to the First Consultation were received from the stakeholders identified below. Non-confidential responses are published at http://www.ofcom.org.uk/consult/condocs/openreach/responses/ .
Cable & Wireless
The Talk Talk Group
CWU and Connect
DETI Northern Ireland
Federation of Communications Services
Openreach
Orange
Scottish and Southern Electricity
Sky/ Easynet
Thus
Vodafone
Will Page, Chief Economist, MCPS PRS Alliance
Phil Thompson
Responses to the Second Consultation
A11.3 Responses to the Second Consultation were received from the stakeholders identified below. Non-confidential responses are published at http://www.ofcom.org.uk/consult/condocs/openreachframework/responses/ .
Cable & Wireless
The Talk Talk Group
Confederation of British Industry
CWU and Connect

A new pricing framework for Openreach
Federation of Communications Services
Network Automation
Openreach
Orange
Post Office
Scottish and Southern Electricity
Sky/ Easynet
Tiscali
Virgin
Vodafone