A new on-axis micro-spectrophotometer for combining Raman...
12
research papers J. Synchrotron Rad. (2013). 20, 765–776 doi:10.1107/S0909049513016063 765 Journal of Synchrotron Radiation ISSN 0909-0495 Received 17 January 2013 Accepted 10 June 2013 A new on-axis micro-spectrophotometer for combining Raman, fluorescence and UV/Vis absorption spectroscopy with macromolecular crystallography at the Swiss Light Source Guillaume Pompidor, a ‡ 2 § 4 Florian S. N. Dworkowski, a ‡ Vincent Thominet, a Clemens Schulze-Briese b and Martin R. Fuchs a *} 6 a Paul Scherrer Institut, CH-5232 Villigen, Switzerland, and b DECTRIS Ltd, CH-5400 Baden, Switzerland. E-mail: [email protected] The combination of X-ray diffraction experiments with optical methods such as Raman, UV/Vis absorption and fluorescence spectroscopy greatly enhances and complements the specificity of the obtained information. The upgraded version of the in situ on-axis micro-spectrophotometer, MS2, at the macromolecular crystallography beamline X10SA of the Swiss Light Source is presented. The instrument newly supports Raman and resonance Raman spectroscopy, in addition to the previously available UV/Vis absorption and fluorescence modes. With the recent upgrades of the spectral bandwidth, instrument stability, detection efficiency and control software, the application range of the instrument and its ease of operation were greatly improved. Its on-axis geometry with collinear X-ray and optical axes to ensure optimal control of the overlap of sample volumes probed by each technique is still unique amongst comparable facilities worldwide and the instrument has now been in general user operation for over two years. Keywords: macromolecular crystallography; single-crystal spectroscopy; micro-spectrophotometry; complementary techniques; Raman spectroscopy. 1. Introduction By combining macromolecular crystallography (MX) with optical spectroscopic techniques the structural biologist is provided with a wide array of tools to extend what can be learned from the crystallographic structure alone. By resolving critical ambiguities in the interpretation of the experimentally obtained electron density maps, the scope and capacity of MX can be significantly extended in several fields relevant to structural biology, such as kinetic enzymology or ligand binding studies. For example, the assignments provided by optical spectroscopy are a widely used tool for structural enzymology to characterize freeze-trapped reaction inter- mediates (Schlichting et al., 2000; Weik & Colletier, 2010), and thereby give access to kinetic reaction studies in the crystal. Optical spectroscopy extends the parameters that are experimentally accessible from a protein crystal by providing specific information on sample properties like electronic state, bond strength and coordination. This independent experi- mental observation of additional parameters can be essential in asserting the chemical identity of key sites in a macro- molecule like, for example, a ligand, a co-factor or a func- tionally important amino acid residue. These new opportunities have begun to be seized by the crystallographic community. Since 2008, a dedicated biennial workshop series on ‘Simultaneous combination of spectro- scopies with X-ray absorption, scattering and diffraction’ has been organized. 1 Several synchrotron crystallography endstations supporting the in situ combination of spectroscopy and X-ray diffraction measurements have been constructed so far (Sakai et al., 2002; Carpentier et al., 2007; Pearson et al., 2007; Royant et al., 2007; Ellis et al. , 2008; Davies et al. , 2009; Owen et al., 2009; Stoner- Ma et al., 2011; Allan et al., 2013; Cohen et al., 2013). In addition to the instruments constructed by the beamline work groups, user groups have brought micro-spectrophotometers to beamlines and mounted them temporarily for combined spectroscopy–crystallography experiments (Hadfield & Hajdu, 1993; Beitlich et al., 2007). The first working prototype of a micro-spectrophotometer at the macromolecular crystal- lography beamlines of the Swiss Light Source, the SLS-MS ‡ These authors contributed equally to this work. § Present address: European Molecular Biology Laboratory, 22603 Hamburg, Germany. } Present address: Brookhaven National Laboratory, Upton, NY 11973, USA. 1 The most recent workshop, CSX2012, took place in 2012 at the ETH in Zurich, Switzerland, and the next instance is organized by Brookhaven National Laboratory, USA, in 2014.
Transcript of A new on-axis micro-spectrophotometer for combining Raman...

research papers
J. Synchrotron Rad. (2013). 20, 765–776 doi:10.1107/S0909049513016063 765
Journal of
SynchrotronRadiation
ISSN 0909-0495
Received 17 January 2013
Accepted 10 June 2013
A new on-axis micro-spectrophotometer forcombining Raman, fluorescence and UV/Visabsorption spectroscopy with macromolecularcrystallography at the Swiss Light Source
Guillaume Pompidor,a‡2§4Florian S. N. Dworkowski,a‡ Vincent Thominet,a
Clemens Schulze-Brieseb and Martin R. Fuchsa*}6
aPaul Scherrer Institut, CH-5232 Villigen, Switzerland, and bDECTRIS Ltd, CH-5400 Baden,
Switzerland. E-mail: [email protected]
The combination of X-ray diffraction experiments with optical methods such as
Raman, UV/Vis absorption and fluorescence spectroscopy greatly enhances and
complements the specificity of the obtained information. The upgraded version
of the in situ on-axis micro-spectrophotometer, MS2, at the macromolecular
crystallography beamline X10SA of the Swiss Light Source is presented. The
instrument newly supports Raman and resonance Raman spectroscopy, in
addition to the previously available UV/Vis absorption and fluorescence modes.
With the recent upgrades of the spectral bandwidth, instrument stability,
detection efficiency and control software, the application range of the
instrument and its ease of operation were greatly improved. Its on-axis
geometry with collinear X-ray and optical axes to ensure optimal control of the
overlap of sample volumes probed by each technique is still unique amongst
comparable facilities worldwide and the instrument has now been in general
user operation for over two years.
Keywords: macromolecular crystallography; single-crystal spectroscopy;micro-spectrophotometry; complementary techniques; Raman spectroscopy.
1. Introduction
By combining macromolecular crystallography (MX) with
optical spectroscopic techniques the structural biologist is
provided with a wide array of tools to extend what can be
learned from the crystallographic structure alone. By resolving
critical ambiguities in the interpretation of the experimentally
obtained electron density maps, the scope and capacity of MX
can be significantly extended in several fields relevant to
structural biology, such as kinetic enzymology or ligand
binding studies. For example, the assignments provided by
optical spectroscopy are a widely used tool for structural
enzymology to characterize freeze-trapped reaction inter-
mediates (Schlichting et al., 2000; Weik & Colletier, 2010), and
thereby give access to kinetic reaction studies in the crystal.
Optical spectroscopy extends the parameters that are
experimentally accessible from a protein crystal by providing
specific information on sample properties like electronic state,
bond strength and coordination. This independent experi-
mental observation of additional parameters can be essential
in asserting the chemical identity of key sites in a macro-
molecule like, for example, a ligand, a co-factor or a func-
tionally important amino acid residue.
These new opportunities have begun to be seized by the
crystallographic community. Since 2008, a dedicated biennial
workshop series on ‘Simultaneous combination of spectro-
scopies with X-ray absorption, scattering and diffraction’ has
been organized.1
Several synchrotron crystallography endstations supporting
the in situ combination of spectroscopy and X-ray diffraction
measurements have been constructed so far (Sakai et al., 2002;
Carpentier et al., 2007; Pearson et al., 2007; Royant et al., 2007;
Ellis et al., 2008; Davies et al., 2009; Owen et al., 2009; Stoner-
Ma et al., 2011; Allan et al., 2013; Cohen et al., 2013). In
addition to the instruments constructed by the beamline work
groups, user groups have brought micro-spectrophotometers
to beamlines and mounted them temporarily for combined
spectroscopy–crystallography experiments (Hadfield &
Hajdu, 1993; Beitlich et al., 2007). The first working prototype
of a micro-spectrophotometer at the macromolecular crystal-
lography beamlines of the Swiss Light Source, the SLS-MS
‡ These authors contributed equally to this work.§ Present address: European Molecular Biology Laboratory, 22603 Hamburg,Germany.} Present address: Brookhaven National Laboratory, Upton, NY 11973, USA.
1 The most recent workshop, CSX2012, took place in 2012 at the ETH inZurich, Switzerland, and the next instance is organized by BrookhavenNational Laboratory, USA, in 2014.

(Owen et al., 2009), featured, as a novelty, a so-called on-axis
geometry, with collinear X-ray and optical axes, as well as
reflective coupling objectives.
With the SLS-MS, for the first time on-axis UV/Vis
absorption and fluorescence spectroscopy at an MX beamline
became possible. Further, in proof-of-principle experiments,
the potential for on-axis Raman spectroscopy was demon-
strated on a frozen drop of cyclohexane, i.e. a highly concen-
trated small molecule sample (Owen et al., 2009). The focus
during development of the SLS-micro-spectrophotometer
version 2 (in short, MS2) was set toward enabling resonance
Raman and non-resonance Raman spectroscopy also on
crystalline protein samples, whose scatterer density is several
orders of magnitude lower. This major increase in sensitivity
compared with the previous instrument now allows Raman
spectra acquisition even on difficult-to-measure protein crys-
tals. Also, great care was taken to improve instrument stability
and ease of alignment.
Additionally, with the current version of the micro-spec-
trophotometer at beamline X10SA, the original concept of the
spectroscopic layout was kept, but the actual implementation
redone from ground up, retaining of all optical components
only the reflective Schwarzschild objectives. With these
changes both the excitation and the detection efficiency could
be significantly increased, thereby now also fully enabling
resonance Raman and non-resonance Raman spectroscopy.
Each of the in crystallo spectroscopic methods has specific
strengths. The newly implemented Raman spectroscopy
modes, as vibrational spectroscopy methods, are particularly
suited for the identification of ligands and chemical species,
for example, by assignment of specific vibrational bands via
difference Raman spectroscopy. A typical use case example is
the determination of ligand active-site interactions in soaking
experiments (Katona et al., 2007; Kovaleva & Lipscomb, 2008;
Carey et al., 2011). Resonance Raman spectroscopy addi-
tionally exploits the enhancement of the Raman transition
probability in resonance or near-resonance with an optical
transition. The specificity of the enhancement then directly
supports the assignment of vibrational bands related to
chromophores and their direct environment (Siebert &
Hildebrandt, 2008).
In the context of optical spectroscopies at a synchrotron-
based experiment, an interesting aspect is the dual use of
spectroscopy in both controlling the intended and also in
avoiding the unwanted effects of the X-ray dose received by
the sample. All of the spectroscopic modes can probe the
effect of X-ray-induced photophysics in intended exposures
(Schlichting et al., 2000; Kuhnel et al., 2007; Adam et al., 2009;
Hersleth & Andersson, 2011; He et al., 2012) and also detect
the unwanted effects of the dose accumulated during MX data
collection (radiation damage) (Meents et al., 2007; Carpentier
et al., 2010; Hersleth & Andersson, 2011; Rajendran et al.,
2011). While the study of the photophysical effects lends itself
to specialized studies, the monitoring of radiation damage is
indispensable for a wide range of MX experiments. Provided
the spectroscopic experiment can be sufficiently facilitated to
be conducted by inexperienced users, in particular the radia-
tion damage monitoring can be not only attractive to users but
rather become a quasi-requirement for the validation of X-ray
diffraction results (Hersleth & Andersson, 2011; He et al.,
2012; Merlino et al., 2013). In that regard, the deposition of
spectroscopic results alongside the diffraction data in the
Protein Data Bank (PDB) has been proposed (Garman &
Weik, 2011; Orville et al., 2011).
The specific strengths of the different spectroscopic modes
have been well reviewed for the fields of structural enzy-
mology (Pearson et al., 2004; De la Mora-Rey & Wilmot, 2007;
Pearson & Owen, 2009), temperature-dependent macro-
molecular crystallography (Weik & Colletier, 2010), and the
mapping of radiation damage and X-ray-induced photophysics
(Garman & Weik, 2011).
The general applicability of the different spectroscopic
modes differs strongly. Both UV/Vis absorption and fluores-
cence spectroscopy require the presence of one or more
chromophores in the sample under investigation. Analysis of
the presence of colored chromophores in structures deposited
in the PDB until June 2010 yields approximately 11000
structures containing at least one colored co-factor (Stoner-
Ma et al., 2011), showing the broad applicability for the
described methods. The same criterion also applies to reso-
nance Raman spectroscopy, relying on the strong enhance-
ment of the Raman transition moment upon excitation close
to an optical dipole transition.
Non-resonance Raman spectroscopy, in contrast, does not
require the presence of a chromophore and therefore in
principle opens all non-chromophore-containing samples to
spectroscopic investigation. Owing to the absence of the
chromophore-specific selectivity, in non-resonance Raman
spectroscopy the complete molecule contributes to the spec-
troscopic signal. To selectively detect changes due to, for
example, a chemical reaction therefore imposes a requirement
of high signal-to-noise data in the non-resonance Raman
mode (Carey et al., 2011). Strong reduction of sample-intrinsic
fluorescent background signals is a central motivation for
non-resonance Raman excitation in the near-infrared (NIR)
regime and the Raman capabilities of the MS2 were thus
extended to the NIR.
Several instrumentation upgrades to the infrastructure of
SLS beamline X10SA further increase the instrument’s
versatility. Since January 2010, a Pilatus 6M area detector
(Dectris Ltd, Baden, Switzerland) has been installed at the
beamline, allowing the acquisition of complete diffraction data
sets within sub-minute timescales, i.e. fast enough to obtain
structures of intermediates with lifetimes in the minute range
(Regis Faro et al., 2011). Upon request, a He cryogenic system
can be installed instead of the standard N2 flow system to
reach temperatures down to 10 K.
Last but not least, the online spectroscopy facility is being
complemented by an offline SLSpectroLab facility with a
separate full goniometer and micro-spectrophotometer set-up
for preparatory measurements and measurements not
requiring X-rays.
All developments leading to the MS2 instrument have been
included in the design of a final version, the MS3, which is
research papers
766 Guillaume Pompidor et al. � New on-axis micro-spectrophotometer at SLS J. Synchrotron Rad. (2013). 20, 765–776
currently being commissioned. This new instrument is inte-
grated into the newly designed endstation of beamline X10SA
and remains always online. The main difference between the
MS2 and the MS3 is a greatly improved performance of the
imaging branch owing to custom-designed objectives. A
greater working distance renders the MS3 compatible with the
sample-mounting robot. Lastly, the design was modularized to
support rapid changes between the spectroscopic modes
without requiring unmounting of the sample. The MS2 is
mounted at the offline facility for continuous off-line experi-
ments accessibility.
2. Instrumentation at SLS beamline X10SA
Several key improvements to the design of the first version
of the SLS micro-spectrophotometer, SLS-MS (Owen et al.,
2009), were implemented to achieve the coupling efficiency
required for Raman spectroscopy experiments and thereby
enabled full multi-mode capability. While the basic concept of
the layout has remained the same, all optical components of
the instrument were optimized, with the sole exception of the
high-magnification Schwarzschild objectives (Newport, 15�
magnification, f = 13 mm, back focal length = infinite, NA =
0.4) and the drilled mirror used to deflect the visible light away
from the X-ray axis. The changes led to improvements of the
coupling efficiency of the excitation and detection branches,
to an increase of the spectral bandwidth and to better overall
stability and repeatability of the set-up.
For some of the upgrade iterations of the MS2, relative
efficiency improvements can readily be determined. For
example, by choosing a wavelength-specific dichroic edge filter
instead of a broadband beamsplitter to couple the excitation
and collection branches, an improvement of coupling effi-
ciency by approximately a factor of four was achieved (x2.2.3).
Further improvements were realised by the exchange of
crucial spectrometer components, with similar efficiency gains
for each of the design changes such as the implementation of
reflective coupling optics (x2.2.5), optimized light guides and
filter positioning, or the NIR optimized CCD detector (x2.2.7).
As an alternative to direct instrument figures of merit,
achievable signal-to-noise figures for standard samples under
defined experimental conditions can be determined. With
their commercial availability and published crystallization
protocols, the lysozyme and myoglobin examples in the
experimental section of this article can serve this purpose. To
avoid uncertainties due to the crystal morphology, measure-
ments of frozen solutions in crystallographic loops, i.e. thin
films, are a viable alternative.
In an effort to extend the bandwidth of the instrument into
the UV domain down to below 250 nm, all coupling in the
illumination and detection branches of the MS2 is now
performed with reflective optical elements instead of glass
lenses. As a direct benefit thereof, chromatic aberrations are
avoided without resorting to compound lenses. A remaining
but unavoidable limitation is the protein crystals’ sample
morphology (i.e. surface properties, scatterer density and
shape), causing extensive Rayleigh scattering in the UV
domain, and artifacts (e.g. stray light, back reflections or
distortion by the nitrogen gas stream) introduced by the
suboptimal sample environment (Kessler, 2006). A known
approach to overcome the limited UV performance is the
utilization of backscattering measurement geometry rather
than a transmissive one. Since such a set-up requires an
integrating sphere around the sample, however, it is not
compatible with the crowded beamline environment. For
Raman and fluorescence spectroscopy, the collection effi-
ciency is limited by the numerical aperture of the objectives,
owing to the space limitations of crystallographic endstations.
An approach to significantly increase the collection efficiency
is the inclusion of a spherical mirror opposite the collection
objective (Kamagata et al., 2012). In the presented set-up, such
a mirror could be installed alternative to or alongside the UV/
Vis illumination.
While the SLS-MS required a full 8 h shift for the set-up and
alignment of the instrument at the beamline, the full proce-
dure, including alignment of the Raman mode, can now be
completed in less than 3 h with a build-back time of down
to 1 h.
2.1. On-axis geometry
The chosen on-axis configuration provides extensive control
over the relative arrangement of the irradiated and probed
sample volumes, both their relative size and position, through
the coaxial arrangement of X-ray and optical beams. As laid
out in more detail in x4.1 below, there are clear application
scenarios both for an X-ray beam diameter larger than the
spectroscopic beams and vice versa.
With an off-axis geometry, in contrast to on-axis config-
urations, overlapping the paths of the X-ray beam and the
spectroscopic probes can be difficult or even impossible,
depending on the axes’ relative angles. Optimized off-axis
sampling geometries with both X-ray and spectroscopic axes
perpendicular to the goniometer axis can in principle provide
perfect overlap of the sampling volumes, however, still under
the limiting conditions of serial data collection and inter-
mittent reorientations (Orville et al., 2011; Cohen et al., 2013).
An off-axis set-up including a multi-axis goniometer would
also fulfill this criterion. Any other off-axis geometries require
a careful matching of crystal and beam sizes to achieve a full
overlap, thereby introducing strict requirements on samples
and reducing experimental options (Carpentier et al., 2007).
In general, for quantitative dose estimates, crystals larger
than the X-ray beam pose a problem for all experimental
geometries. During a diffraction data collection on a sample
larger than the X-ray beam, with un-irradiated portions of the
crystal successively brought into the beam by the ! rotation,
different parts of the crystal receive large differences in dose.
In the estimation of the maximal dose for radiation-induced
effects, this is obviously a problem also for on-axis set-ups and
a measurement of a still crystal can then be considered only a
conservative estimate. The RADDOSE team has quantita-
tively modeled the spatial distribution of dose in a crystal
research papers
J. Synchrotron Rad. (2013). 20, 765–776 Guillaume Pompidor et al. � New on-axis micro-spectrophotometer at SLS 767

to treat this effect for some typical
use cases in macromolecular crystal-
lography (Zeldin et al., 2013).
Apart from the assured overlap of
optical probe and X-ray axes, on-axis
spectroscopy brings with it further
advantages. In resonance Raman spec-
troscopy, where sampling depth is often
very restricted by the limited penetra-
tion depth of the excitation laser due
to a high absorption coefficient of
the chromophore, by choosing a back-
scattering geometry it can be assured
that vibrational information is definitely
sampled from an X-ray-irradiated
volume.
On-axis geometry also facilitates the
kinetic study of X-ray-induced reactions
with high time resolution. For example,
kinetic UV/Vis absorption spectroscopy
in a sacrificial measurement is the
perfect tool for precise determination of
the total acceptable dose for obtaining unreduced structures
of metal-center-containing proteins. If some boundary condi-
tions such as a flat-top X-ray illumination and a sufficiently
low absorption are met, the dose becomes deposited evenly in
the sample along the optical path. Kinetic measurements allow
then to measure precisely the dose required for an X-ray-
induced process to occur and to design a diffraction experi-
ment accordingly.
Last but not least, the co-axial imaging provides a direct and
unambiguous observation of the probed crystal morphology.
Taken together, these features demonstrate how on-axis
geometry avoids many systematic errors encountered in
geometries with perpendicular axes arrangements. In an on-
axis set-up, the illumination lamp downstream of the sample
prevents the acquisition of absorption spectra during diffrac-
tion data acquisition. Owing to its strong orientation depen-
dence, the acquisition of a spectrum requires a return to the
reference orientation, however, so this is not a limitation for
practical applications. Other instrumentation difficulties to be
resolved with on-axis set-ups, such as a slightly lower numer-
ical aperture due to the drilled optics to pass the X-ray beam,
are more than compensated for by these principal advantages.
2.2. Micro-spectrophotometer layout
The layout of the MS2, shown in Fig. 1, consists of four main
components: the imaging (IB), collection (CB) and excitation
(EB) branches upstream, and the motorized UV/Vis illumi-
nation (UB) branch downstream of the sample. On the
upstream side, following the drilled collection objective (1),
the light is diverted away from the X-ray axis by a drilled 45�
mirror (2) and then distributed between the three branches.
2.2.1. Imaging branch. To be able to monitor the sample
and align the probing volume on the sample, an on-axis
microscope is integrated into the MS2. The sample is imaged
through the same Schwarzschild objective used for focusing
the spectroscopic branches (1 in Fig. 1b). The light is projected
into the imaging branch by use of either a pellicle beam-
splitter, which allows for continuous sample observation, or
alternatively by a flippable mirror at the same position (3).
The latter is less convenient for the user since the mirror has to
be flipped in and out of the beam path every time the sample is
imaged. For crystalline samples, however, it is not possible to
implement a proper spectroscopic reference arm, since the
reference spectra are typically measured either in air or in the
buffer solution adjacent to the crystal. Absorption spectro-
scopy on small crystals using a fixed pellicle beamsplitter is
therefore sensitive to artifacts due to thin-film interference.
Transmission and reflection factors of pellicle beamsplitters
are wavelength dependent and highly sensitive to the incident
angle of the incoming light. Therefore, with crystals acting as
lenses or prisms, the slight difference in the incidence angles
between the case when the sample is out of the light path
(reference) and in the light path (absorbance) can lead to
artifacts in the resulting absorption spectrum. This is mostly
observed for small crystals, where the incidence angles probed
by the illumination beam are typically steeper than for large
crystals. To both avoid these artifacts and ease the alignment
of the instrument, a custom-made flippable beamsplitter
instead of a mirror will be implemented in the next version of
the MS.
For the alignment of the imaging branch, an adjustable
mirror parallel to the flippable mirror is used (4). By thus
decoupling the components, the alignment of the imaging
branch with respect to the X-ray beam is greatly facilitated.
The sample camera optics itself consists of a video objective
(Obj; 1A1HB, 1:3.9–32, f = 75 mm, TAMRON, Japan) and a
color CCD-camera (CCD; GRAS-14S5C-C, Point Grey,
USA). Overall, the imaging system has a magnification of 5.8,
and a field of view of 1.4 mm � 1.1 mm. For coarse sample
research papers
768 Guillaume Pompidor et al. � New on-axis micro-spectrophotometer at SLS J. Synchrotron Rad. (2013). 20, 765–776
Figure 1(a) The MS2 mounted on beamline X10SA, shown in UV/Vis absorption mode with theillumination Schwarzschild objective moved in for measurement. Red: X-ray beam path; green:illumination light path; blue: laser excitation path; yellow: signal detection light path. (b) Schematicrepresentation of the branches, light path and optical components in the MS2. Naming as discussedin the text: IB, imaging branch; CB, collection branch; EB, excitation branch; UB, UV/Visillumination branch; 1–9, optical elements; OF, light guide fiber coupling; BS, beamsplitter; LF, laserline filter; NF, notch filter.

alignment and as an additional aid for the alignment of the
optical beams, a top-down camera with a larger field of view
and a variable magnification is installed.
2.2.2. Excitation and collection branches. For all spectro-
scopic modes the signal is collected through the Schwarzschild
objective also used for imaging (1). The collected light is then
transmitted past the diverting elements (3; BS) onto an
adjustable 45� mirror (5). This mirror is used primarily for
alignment of the collection branch relative to the other
branches. Optionally, for Raman spectroscopy, the residual
excitation laser line is suppressed here by an edge filter (EF).
In contrast to notch filters, edge filters are available with
steeper edges and higher absorption and are therefore
preferred for Stokes–Raman spectroscopy. For focusing into
the optical fiber to the spectrograph (OF) an off-axis parabolic
mirror is employed (6).
For spectroscopic modes requiring light excitation of the
sample with a laser or a lamp, the light is coupled into the
excitation branch (EB) of the spectrophotometer via a light
guide (OF) using a collimating lens (7). For Raman spectro-
scopy, sidebands to the main laser line are filtered out using a
wavelength-dependent interference laser line filter (LF).
2.2.3. Balance between excitation and collection. The light
is deflected towards the sample by a beamsplitter (BS). By
varying this element it is possible to influence the balance
between the excitation intensity and the transmitted signal in
the Raman and fluorescence modes. If a choice for a single
beamsplitter for all applications and excitation wavelengths
has to be made, in the absence of photo-induced damage to
the sample, the optimal ratio between reflection and trans-
mission (R /T) for the beam-splitter is 1.0, since both the
Raman and the fluorescence signals are proportional to the
excitation intensity. A choice lower than 1.0, favoring trans-
mission of collected light over excitation, could be used to
reduce the light-induced effects on the sample. The overall
coupling from excitation to sample and back to the collection
branch can be greatly increased by the choice of wavelength-
specific dichroic beamsplitters (T > 0.9 for the Raman signal)
instead of a broadband beamsplitter (T ’ 0.5), to obtain both
high reflection at the excitation wavelength and high trans-
mission closely above the excitation wavelength. In the ideal
case this increases the signal by a factor of four.
2.2.4. UV/Vis illumination branch. Since UV/Vis absorp-
tion measurements are performed in transmissive geometry,
an illumination lamp has to be positioned 180� from the
collection objective. In an X-ray crystallographic beamline
environment, the illumination branch (UB) therefore has to
be moved in and out of the X-ray path to avoid interference
with the diffraction experiment. This is achieved by utilization
of three motorized linear stages which are also used for
alignment of the second objective. The branch itself consists of
a second, identical, Schwarzschild objective (8) coupled via
another off-axis parabolic mirror (9) to the incoming light
guide (OF) from the remote light source.
2.2.5. Reflective optics. All glass lenses of the SLS-MS with
the exception of the excitation branch were replaced by
reflective optical elements. The main advantage of reflective
optics compared with transmissive lenses lies in its transmis-
sion efficiency over the whole spectral domain used in spec-
troscopy on biological samples, from UV to NIR. A second
advantage is the absence of chromatic aberrations which occur
in glass or quartz lenses. UV/Vis absorption spectra can now
be collected down to wavelengths of 250 nm (Fig. 2). The
collimating optics used to couple the light guides to the illu-
mination and the collection branch have been implemented
with off-axis parabolic mirrors with a focal length of 34 mm.
Optimal coupling to the optical fibers was achieved by
matching the numerical aperture of the focusing optics to that
of the fibers.
An example demonstrating the full bandwidth of the
current instrument, a typical absorption spectrum of a horse
heart myoglobin crystal, is shown in Fig. 2.
2.2.6. Light sources. The SLSpectroLab facility at the SLS
offers a broad range of illumination sources to cover the
requirements of the different modes and of the different
biologically relevant samples. Two different light sources are
available for UV/Vis absorption experiments: a high-power
Xenon arc lamp (CLX500, Zeiss, Germany) and a combined
deuterium/tungsten lamp (BDS130, BW*Tek, USA) to extend
the usable spectral range in the UV domain from 350 nm to
well below 250 nm.
To verify that the UV performance is not limited by insuf-
ficient illumination, a test measurement with a high UV flux
laser-driven light source (LDLS; EQ-99FC, Energetiq, USA)
was performed (data not shown). This only marginally
improved the UV performance but instead introduced
photochemical artifacts in the sample. Among other effects,
heavy ozone generation was observed, which leads to a high
absorbance peak below 280 nm (Hearn, 1961).
The lasers available for Raman and fluorescence spectro-
scopy are listed in Table 1. The lasers at 405 nm, 473 nm and
785 nm are fiber-coupled and tunable in power. The 532 nm
laser is coupled by a lens into an optical fiber mounted on a
kinematic holder. The coupling loss mostly depends on the
research papers
J. Synchrotron Rad. (2013). 20, 765–776 Guillaume Pompidor et al. � New on-axis micro-spectrophotometer at SLS 769
Figure 2UV/Vis absorption spectrum of a plate-like crystal (50 mm � 20 mm �10 mm) of partially reduced horse heart myoglobin. To minimizemorphological artifacts, the crystal was rotated along ! to yield bestabsorption spectra. Acquisition time was 100 � 2.6 ms with an entranceslit width of 100 mm, using a 300 lines mm�1 grating and a UV-optimizedEMCCD detector. The wavelength range in the UV is accessible down toat least 250 nm.
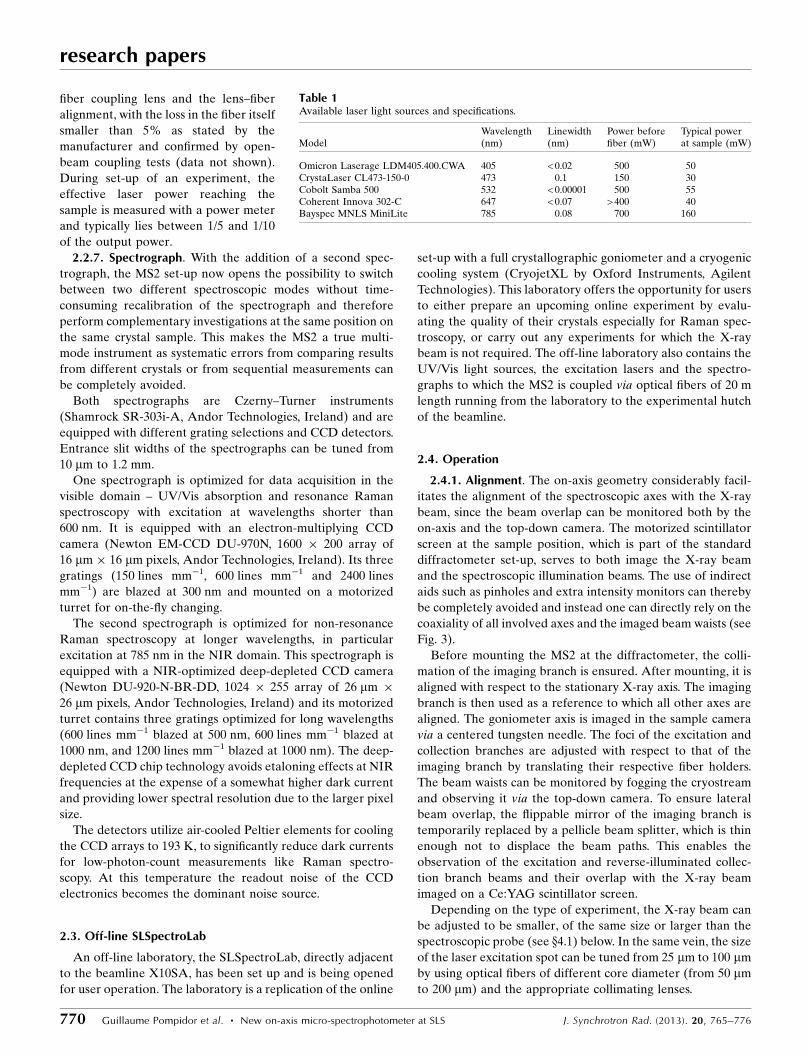
fiber coupling lens and the lens–fiber
alignment, with the loss in the fiber itself
smaller than 5% as stated by the
manufacturer and confirmed by open-
beam coupling tests (data not shown).
During set-up of an experiment, the
effective laser power reaching the
sample is measured with a power meter
and typically lies between 1/5 and 1/10
of the output power.
2.2.7. Spectrograph. With the addition of a second spec-
trograph, the MS2 set-up now opens the possibility to switch
between two different spectroscopic modes without time-
consuming recalibration of the spectrograph and therefore
perform complementary investigations at the same position on
the same crystal sample. This makes the MS2 a true multi-
mode instrument as systematic errors from comparing results
from different crystals or from sequential measurements can
be completely avoided.
Both spectrographs are Czerny–Turner instruments
(Shamrock SR-303i-A, Andor Technologies, Ireland) and are
equipped with different grating selections and CCD detectors.
Entrance slit widths of the spectrographs can be tuned from
10 mm to 1.2 mm.
One spectrograph is optimized for data acquisition in the
visible domain – UV/Vis absorption and resonance Raman
spectroscopy with excitation at wavelengths shorter than
600 nm. It is equipped with an electron-multiplying CCD
camera (Newton EM-CCD DU-970N, 1600 � 200 array of
16 mm � 16 mm pixels, Andor Technologies, Ireland). Its three
gratings (150 lines mm�1, 600 lines mm�1 and 2400 lines
mm�1) are blazed at 300 nm and mounted on a motorized
turret for on-the-fly changing.
The second spectrograph is optimized for non-resonance
Raman spectroscopy at longer wavelengths, in particular
excitation at 785 nm in the NIR domain. This spectrograph is
equipped with a NIR-optimized deep-depleted CCD camera
(Newton DU-920-N-BR-DD, 1024 � 255 array of 26 mm �
26 mm pixels, Andor Technologies, Ireland) and its motorized
turret contains three gratings optimized for long wavelengths
(600 lines mm�1 blazed at 500 nm, 600 lines mm�1 blazed at
1000 nm, and 1200 lines mm�1 blazed at 1000 nm). The deep-
depleted CCD chip technology avoids etaloning effects at NIR
frequencies at the expense of a somewhat higher dark current
and providing lower spectral resolution due to the larger pixel
size.
The detectors utilize air-cooled Peltier elements for cooling
the CCD arrays to 193 K, to significantly reduce dark currents
for low-photon-count measurements like Raman spectro-
scopy. At this temperature the readout noise of the CCD
electronics becomes the dominant noise source.
2.3. Off-line SLSpectroLab
An off-line laboratory, the SLSpectroLab, directly adjacent
to the beamline X10SA, has been set up and is being opened
for user operation. The laboratory is a replication of the online
set-up with a full crystallographic goniometer and a cryogenic
cooling system (CryojetXL by Oxford Instruments, Agilent
Technologies). This laboratory offers the opportunity for users
to either prepare an upcoming online experiment by evalu-
ating the quality of their crystals especially for Raman spec-
troscopy, or carry out any experiments for which the X-ray
beam is not required. The off-line laboratory also contains the
UV/Vis light sources, the excitation lasers and the spectro-
graphs to which the MS2 is coupled via optical fibers of 20 m
length running from the laboratory to the experimental hutch
of the beamline.
2.4. Operation
2.4.1. Alignment. The on-axis geometry considerably facil-
itates the alignment of the spectroscopic axes with the X-ray
beam, since the beam overlap can be monitored both by the
on-axis and the top-down camera. The motorized scintillator
screen at the sample position, which is part of the standard
diffractometer set-up, serves to both image the X-ray beam
and the spectroscopic illumination beams. The use of indirect
aids such as pinholes and extra intensity monitors can thereby
be completely avoided and instead one can directly rely on the
coaxiality of all involved axes and the imaged beam waists (see
Fig. 3).
Before mounting the MS2 at the diffractometer, the colli-
mation of the imaging branch is ensured. After mounting, it is
aligned with respect to the stationary X-ray axis. The imaging
branch is then used as a reference to which all other axes are
aligned. The goniometer axis is imaged in the sample camera
via a centered tungsten needle. The foci of the excitation and
collection branches are adjusted with respect to that of the
imaging branch by translating their respective fiber holders.
The beam waists can be monitored by fogging the cryostream
and observing it via the top-down camera. To ensure lateral
beam overlap, the flippable mirror of the imaging branch is
temporarily replaced by a pellicle beam splitter, which is thin
enough not to displace the beam paths. This enables the
observation of the excitation and reverse-illuminated collec-
tion branch beams and their overlap with the X-ray beam
imaged on a Ce:YAG scintillator screen.
Depending on the type of experiment, the X-ray beam can
be adjusted to be smaller, of the same size or larger than the
spectroscopic probe (see x4.1) below. In the same vein, the size
of the laser excitation spot can be tuned from 25 mm to 100 mm
by using optical fibers of different core diameter (from 50 mm
to 200 mm) and the appropriate collimating lenses.
research papers
770 Guillaume Pompidor et al. � New on-axis micro-spectrophotometer at SLS J. Synchrotron Rad. (2013). 20, 765–776
Table 1Available laser light sources and specifications.
ModelWavelength(nm)
Linewidth(nm)
Power beforefiber (mW)
Typical powerat sample (mW)
Omicron Laserage LDM405.400.CWA 405 < 0.02 500 50CrystaLaser CL473-150-0 473 0.1 150 30Cobolt Samba 500 532 < 0.00001 500 55Coherent Innova 302-C 647 < 0.07 > 400 40Bayspec MNLS MiniLite 785 0.08 700 160

2.4.2. Calibration of the spectrographs. The wavelength
axes of the spectrographs are calibrated using the peaks of an
Hg lamp spectrum. For Raman spectroscopy, a second cross
calibration is performed by collecting the Raman spectrum of
a standard sample like a Si wafer, frozen cyclohexane or 4-
acetamidophenol. The reference values for the line assign-
ments were obtained from McCreery (2000, 2011).
3. Materials and methods
3.1. Crystallization
Horse heart myoglobin and hen egg-white lysozyme
(HEWL) were purchased from Sigma-Aldrich. They were
used without further purification and crystallized by the vapor
diffusion technique using the hanging drop method.
Horse heart myoglobin was crystallized by equilibrating 3 ml
of protein at 10 mg ml�1 with the same volume of the reservoir
solution, consisting of 3.4 M ammonium sulfate and 0.1 M tris
buffer at pH 8.0. Cryoprotection was performed by soaking
the crystals for 10 s in a solution of 2.6 M ammonium sulfate,
0.1 M tris buffer at pH 8.0 and 25% glycerol.
HEWL was crystallized by mixing 2 ml of protein at
30 mg ml�1 with the same volume of reservoir solution
consisting of 0.8 M NaCl and 100 mM acetate buffer at pH 4.5.
Crystals were cryoprotected by soaking them for 10 s in the
mother liquor solution supplemented by 25% glycerol.
Derivative crystals of HEWL were prepared using the
protocol described by Pompidor et al. (2010). The crystals
were back-soaked and cryoprotected with two consecutive
transfers of 15 s in the cryoprotectant solution identical to the
reservoir solution supplemented by 25% glycerol and then
flash-cooled directly in the N2 cold stream.
3.2. Diffraction data collection
The reflective Schwarzschild objective used for both sample
visualization and focusing of spectroscopic beams has a
working distance of 24 mm, compared with the 35 mm of the
normal on-axis microscope of beamline X10SA. Therefore,
the beam-shaping devices, i.e. a variable aperture and Mo tube
scatter guard, are replaced by a shorter Mo tube collimator
(0.5 mm outer diameter, 0.35 mm inner diameter) between the
Schwarzschild objective and the sample to absorb background
X-ray radiation due to air scattering. Air scatter from the open
X-ray beam path inside the reflective objective is suppressed
by inserting a drilled aluminium plate in front of the objective
during X-ray exposure. The next version of the instrument,
the MS3, will use a custom-designed objective featuring an
internal collimator tube and a working distance of 35 mm,
obviating the use of an attenuator cover and enabling the use
of the standard beam-shaping devices.
3.3. Spectroscopic data acquisition and control software
3.3.1. Data collection. The spectrographs and the spectro-
scopic CCD cameras are controlled by the SOLIS control suite
(Andor Technologies, Ireland). Control of the optical
peripherals, for example lamps and laser shutters, is provided
through dedicated Experimental Physics and Industry Control
System MEDM control panels (http://www.aps.anl.gov/epics/).
To ensure user and equipment safety, all motor movements
at the beamline environment are controlled via a dedicated
Experiment State Controller (ESCAPE) and workflow engine
(Ebner, 2012).
3.3.2. Data post-processing. Post-processing of Raman
spectroscopic data is usually unavoidable due to the strong
X-ray-induced fluorescence background masking the typically
one to two orders of magnitude weaker Raman signal. To
eliminate bias as much as possible, we employ automated
baseline reduction routines based on a modified asymmetric
least-squares algorithm (Peng et al., 2010; Liland et al., 2010).
Data post-processing beyond the capabilities of the SOLIS
software is handled by dedicated MATLAB (Mathworks,
USA) scripts and GUIs, comprised in the APE-toolbox
(Advanced file Processing Environment; in-house develop-
ment, to be published).
4. Results and discussion
The measurements in the following section were selected with
a focus on demonstrating the new and upgraded features of
the SLS micro-spectrophotometer. Beginning with an experi-
mental quantification and validation of the optimized on-axis
sampling geometry, the fluorescence mode is demonstrated,
followed by the Raman modes, both under resonant and non-
resonant conditions.
research papers
J. Synchrotron Rad. (2013). 20, 765–776 Guillaume Pompidor et al. � New on-axis micro-spectrophotometer at SLS 771
Figure 3Typical beam sizes for an experiment with the X-ray beam larger thanoptical beams, imaged on a Ce:YAG scintillator screen mounted at thesample position. (a) X-ray beam (100 mm � 100 mm). (b) 785 nm laserexcitation spot (50 mm). (c) Spectroscopic collection area in the focalplane, imaged by reverse illumination through the collection branch(200 mm). (d) Computer-generated overlay of all spots.

4.1. Beam profile mapping: X-ray versus spectroscopic beams
To characterize the overlap between the X-ray beam and
the spectroscopic probe area provided by the MS2’s on-axis
configuration, the optical beam profiles were determined
along the X-ray axis at the sample position. A CCD camera
(EO-1312C, 4.65 mm � 4.65 mm pixel size, 1280 � 1024 pixels,
8-bit resolution, Edmund Optics) mounted on a three-axis
stage was aligned at the sample position perpendicular to the
X-ray beam and then stepped through the collection volume.
Illumination intensity on the individual images was deter-
mined and used to reconstruct the spectroscopic volumes
using the MATLAB software (The Mathworks, USA). Fig. 4
shows the beam profiles of the collection branch and excita-
tion with optical fibers of 100 mm and 400 mm, respectively.
The size of the X-ray beam itself was measured by stepping
a scintillation screen through the beam and measuring the spot
size with the normal on-axis microscope (data not shown).
Consistent with the beamline’s horizontal beam divergence of
0.6 mrad, the size of the X-ray spot over the whole range was
measured to be almost constant for both the focused (50 mm�
15 mm) and a defocused beam (100 mm � 100 mm). Taken
together, these results allow a precise characterization of the
sampling volumes encountered in different modes of the on-
axis configuration. On the one hand, the superimposition of
the waist of the excitation laser with a defocused X-ray beam
of 100 mm � 100 mm (Fig. 4, top) demonstrates that spectro-
scopy strictly probes an irradiated part of the sample over a
distance of 300 mm along the X-ray beam axis. Most of the
crystals match the maximum thickness of 300 mm. In the case
of larger crystals, to achieve full overlap, compared with the
set-up in Fig. 4 one has to increase the X-ray beam size relative
to the laser. Therefore one can choose either a smaller core
diameter for coupling the laser source in the excitation branch
(50 mm) or a wider defocused X-ray beam than 100 mm �
100 mm. On the other hand, by focusing the X-ray beam
(50 mm � 15 mm) and selecting a coupling fiber with a large
core diameter (200–400 mm), X-ray diffraction can probe
strictly an illuminated volume of the crystal.
For example, monitoring X-ray-induced photoreduction
would require an X-ray beam diameter larger than that of the
spectroscopic probe. Spectroscopic information thus obtained
from the core of the X-ray-irradiated area provides informa-
tion only about molecules that contributed to the diffraction
signal. In contrast, the structural characterization of a laser-
excited state would require the opposite beam diameter ratio,
such that the X-ray diffraction probes the illuminated volume.
In general, the beam spot sizes have direct implications for
the accessible sample sizes. The different modes of the micro-
spectrophotometer have different restrictions on sample sizes.
For absorption spectroscopy, minimal crystal sizes of
approximately half the illumination spot size can still be
measured, i.e. 20 mm. The maximal crystal size is given by the
thickness corresponding to an optical density (OD) of around
2, and therefore strongly sample-dependent. For resonance
Raman spectroscopy, the minimal sample size strongly
depends on the resonance enhancement and co-factor
arrangement; in general, in an on-axis configuration larger
crystals give better signals. Crystals around 50 mm in size have
successfully been measured with the MS2, with an excitation
spot size of 50 mm. Under non-resonance conditions, the
sample thickness is crucial; samples smaller than 100 mm in all
dimensions become impractical for reasonable sampling times
under 10 min.
4.2. Luminescence spectroscopy on HEWL derivative crystalsprepared with a europium complex
Luminescence spectroscopy, comprising the detection of
either fluorescence or phosphorescence photons, is a tech-
nique requiring the presence of a fluorophore or a phos-
phorescent center in the protein crystals. Compared with
Raman spectroscopy the method is less challenging in terms of
detection efficiency. The luminescence quantum yields (from
1 down to lower than 10�6) are commonly higher than even
resonance Raman quantum yields [below 10�5 (Siebert &
Hildebrandt, 2008)]. Therefore the main task for a given
luminescence experiment is to provide the proper dedicated
light source and filters.
research papers
772 Guillaume Pompidor et al. � New on-axis micro-spectrophotometer at SLS J. Synchrotron Rad. (2013). 20, 765–776
Figure 4Three-dimensional reconstruction of beam profiles of (a) the excitationbranch of the MS2 (coupling via 100 mm fiber) and (b) the collectionbranch (coupling via 400 mm fiber). Illumination intensities weremeasured on a CCD detector array mounted perpendicular to theX-ray axis. Intensity images were recorded every 50 mm in the range from0.5 mm upstream to 0.5 mm downstream of the sample position, and theillumination volume was reconstructed using MATLAB. The red lineshows the X-ray axis with the green mesh depicting the approximate sizeof the X-ray beam (100 mm); the blue line marks the sample position. Leftis downstream and right upstream. Beam sizes depicted here are identicalto the configuration shown in Fig. 3. From these mappings the samplevolumes with full overlap of X-ray and spectroscopic beams can bedetermined.

As an example we show the luminescence of a HEWL
derivative crystal prepared with a luminescent europium
complex, Na3[Eu(DPA)3].6H2O, where DPA stands for pyri-
dine-2,6-dicarboxylate (dipicolinate). The complex was
demonstrated to be valuable in the preparation of high-
phasing-power derivative crystals. For some derivative crystals
prepared by co-crystallization, the complex, binding at the
interface between protein molecules in the crystal, can act
as a crosslinking agent and improve the diffraction quality
compared with native crystals (Pompidor et al., 2010). Deri-
vative crystals were soaked twice in a cryoprotectant solution
identical to the mother liquor supplemented by 25% glycerol
but without the lanthanide complex.
Owing to their electronic configuration, where 4f electrons
are shielded by 5s ones, lanthanide ions exhibit interesting
luminescence properties with sharp emission bands and large
Stokes shifts.
Luminescence of the europium ion was excited at 532 nm in
the parity-forbidden 7F1 !5D4 transition with an extinction
coefficient estimated to be 0.015 l mol�1 cm�1. The lumines-
cence spectrum (Fig. 5) exhibits all the emission lines of the
Eu(III) (Binnemans et al., 1997). In the derivative crystals, the
europium complex is bound at the interface between mole-
cules. Owing to the back-soaking, the luminescence signal
stems only from the complexes trapped between lysozyme
molecules in the crystal. The control spectrum was collected in
the drop surrounding the crystal, to ensure that the lumines-
cence originated only from the europium complexes bound in
the crystal, corresponding to a concentration of 150 mM. With
two back-soakings, the liquor surrounding the crystal is almost
completely freed from the europium complex which is then
only present in the crystal, as assessed by the luminescence
spectrum of the solution which exhibits only a small peak
corresponding to the most intense emission line of Eu(III) at
615 nm. The luminescence provides an easy and fast method
for detecting the complex binding in the derivative crystals
prepared by co-crystallization. Successful derivatization can
then be quickly checked prior to the more time-consuming
anomalous diffraction data collection and processing.
This experiment demonstrates the capabilities of the MS2 to
perform luminescence spectroscopy on solution samples, with
a typical chromophore concentration found in protein crystals.
With an excitation in a forbidden transition, i.e. with a low
extinction coefficient, the luminescence signal was collected
within less than 30 s, highlighting the high detection sensitivity
of the instrument.
4.3. Resonance Raman spectroscopy on horse heartmyoglobin crystals
Horse heart myoglobin (Mb), like most heme proteins, is
particularly sensitive to photoreduction by photoelectrons
(Beitlich et al., 2007; Meents et al., 2007; Hersleth &
Andersson, 2011). With the strong Soret band absorption in
the blue, it is a prime target for the resonance Raman tech-
nique, to follow its oxidation state marker bands and thereby
quantify the reduction process. As a typical case we show
a kinetic study of the photoreduction of ferric myoglobin
Mb(III) into ferrous Mb(II) by resonance Raman spectro-
scopy.
A rosette-shaped cluster of Mb(III) crystals (50 mm �
50 mm � 50 mm) was cryoprotected and frozen directly in the
N2 gas stream. The crystals were exposed to X-rays at low flux
[80 � 109 photons s�1 at 12.4 keV, corresponding to a dose
rate of 3 kGy s�1 calculated for a 100 mm� 100 mm beam with
RADDOSE (Paithankar et al., 2009)] while resonance Raman
spectra at 405 nm excitation wavelength were collected every
10 s for 10 min (Fig. 6). For the success of the measurement, it
is essential to ensure that the sample is not influenced by the
laser exposure. Therefore a first kinetic experiment was
performed without any X-ray irradiation, to ascertain that the
research papers
J. Synchrotron Rad. (2013). 20, 765–776 Guillaume Pompidor et al. � New on-axis micro-spectrophotometer at SLS 773
Figure 5Luminescence spectra of a HEWL derivative crystal prepared withNa3[Eu(DPA)3] complex (red) and of the mother liquor from thesurrounding crystal (blue) upon illumination with a 532 nm laser with apower density of 26 mW mm�2 and acquisition times of 100 � 0.27 s and20 s, respectively.
Figure 6Resonance Raman kinetic measurement of X-ray-induced photoreduc-tion in a myoglobin crystal. The difference spectrum between theunexposed spectrum (blue) and a spectrum after exposure to 1.5 MGy(red) shows reduction of the heme in the X-ray beam as a peak shift from1371 cm�1 to 1359 cm�1. Owing to the high sensitivity of the instrument,the reaction could also be followed in real time, showing the dose-dependence of the reduction (inset). Power at the sample was 15 mW andacquisition time for each spectrum was 10 s.

laser power did not induce any photoreduction of Mb(III) into
Mb(II), as would be indicated by the shoulder appearing
around 1360 cm�1 [�4 shifts upon reduction (Spiro, 1985)]. No
laser-induced reduction could be observed. Even with the
short acquisition time of 10 s, the quality of the spectra allows
the identification of all the vibrational bands reported in the
literature. The 2400 lines mm�1 gratings blazed at 300 nm
provide an excellent spectral resolution (3 cm�1) and allow
the whole region of interest to be collected in a single spec-
trum (from 600 cm�1 to 2000 cm�1).
After baseline subtraction, the difference Raman spectrum
between the first spectrum (zero dose) and the last one shows
the peak shifts occurring upon photoreduction from a ferric to
ferrous state. The ferric state (zero dose) spectrum exhibits all
the vibrational modes typical of an aquo six-coordinated high-
spin heme (6cHS) [1480 cm�1 (�3), 1513 cm�1 (�38), 1543 cm�1
(�11), 1562 cm�1 (�2) and 1582 cm�1 (�37)] reported in earlier
studies [Table 2 and Liu et al. (1990), Takahashi et al. (1994),
Smulevich et al. (1995), Hu et al. (1996), Lu et al. (2005), De
Sanctis et al. (2007)]. The presence of the intense band at
1618 cm�1 corresponding to the �(C C) vinyl stretching
modes is in agreement with a 6cHS form.
The differences found in Raman peak wavenumbers are all
in the range of our instrument resolution (3 cm�1 for the
chosen slit and grating combination) as well as the 5 cm�1
cited by Takahashi et al. (1994) and De Sanctis et al. (2007).
The deviations from the literature peak positions could be
attributed to the difference between the samples: physical and
chemical parameters as well as the sample state (crystal and
solution). Takahashi and co-authors noticed peak shifts in the
high-frequency domain between Mb(III) at pH 6.5 and at pH
10.5 and attributed these shifts to a partial conversion from
high spin to low spin occurring at high pH. Therefore, with our
initial spectrum being unambiguously the 6cHS form, pH can
be ruled out as the reason for the observed differences.
The main effect of X-ray-induced photoreduction of
Mb(III) into Mb(II) on the Raman spectra is the shift of the
�4 and the �(C C) bands from 1371 cm�1 to 1359 cm�1 and
from 1618 cm�1 to 1615 cm�1, respectively. These results are
in agreement with the study of Takahashi and co-workers who
reduced the Mb from the ferric to the ferrous form using
sodium dithionite. The time courses of the two positions of the
�4 band at 1371 cm�1 and 1359 cm�1 indicate that the cryo-
radiolytic reduction is complete within a dose of 1.5 MGy.
Beitlich and co-workers reported a dose of 2.0 MGy by
studying the same process by UV/Vis absorption (Beitlich et
al., 2007). This difference can be explained by the uncertain-
ties in the determination of the X-ray flux density distribu-
tions.
The demonstrated high sensitivity of the resonance Raman
mode of the MS2 makes this mode a powerful alternative to
UV/Vis absorption spectroscopy in detecting X-ray-induced
photoreduction, particularly in cases where the crystal thick-
ness makes absorption spectra acquisition impossible.
4.4. Non-resonance Raman spectroscopy
In contrast to resonance Raman spectroscopy, non-reso-
nance Raman spectroscopy is potentially applicable to any
crystal of biological macromolecules as it does not require the
presence of a chromophore. However, owing to the lack of any
resonance enhancement, all Raman active vibrational modes
of the macromolecule are observed simultaneously, causing
overlap of the bands and making assignment more difficult.
High spectroscopic detection sensitivity is therefore required
to overcome the lower Raman transition moment and to apply
more advanced methods such as difference spectroscopy. To
minimize the background signal from protein intrinsic fluor-
escence, excitation wavelengths are preferably shifted to the
NIR domain. To demonstrate the performance of the MS2
in non-resonance Raman spectroscopy, Raman spectra have
been collected with excitation at 785 nm on HEWL crystals.
Fig. 7 shows a non-resonance Raman spectrum of a HEWL
crystal with an acquisition time of 180 s. The vibrational modes
reported in the literature (Kudryavtsev et al., 1998) can be
clearly assigned: disulfide bond (510 cm�1 and 525 cm�1),
methionine (725 cm�1), the Trp side-chains (543 cm�1,
759 cm�1, 875 cm�1, 1012 cm�1 and 1361 cm�1), the Tyr side-
chains (834 cm�1, 855 cm�1 and 1208 cm�1), the Phe side-
chain residues (1004 cm�1 and 1196 cm�1) and acidic residues
(940–980 cm�1).
Owing to the high quantum efficiency of the deep depleted
CCD camera in the NIR domain compared with the EMCCD
model, non-resonance Raman spectra of high quality can be
collected with very short acquisition times, typically from 1 to
5 min for a complete spectrum, and a few seconds to detect the
largest peaks to optimize crystal orientation. With gratings
optimized for NIR spectroscopy (1200 lines mm�1, blazed at
1000 nm), Raman signals can be collected from 400 cm�1 to
1100 cm�1 with a spectral resolution of 4.65 cm�1 (100 mm slit
research papers
774 Guillaume Pompidor et al. � New on-axis micro-spectrophotometer at SLS J. Synchrotron Rad. (2013). 20, 765–776
Table 2Raman bands observed for a myoglobin crystal, with assignments fromHu et al. (1996).
Band assignment Mb(III) (cm�1) Mb(II) (cm�1)
�7 673 673�11 �5 717 715�15 755 755�( CbH2)s and �46 925 927�(CaH ) 987 987�45 1003 1006�( CbH2)as 1050 1050�( CbH2)as 1093 1093�5 1123 1122�14 1134 1133�30 1171 1174�13 1215CH2 twist 1223 1224�(CaH ) 1316 1316�4 1371 1359�28 1427 1430�( CbH2) 1448�3 1480 1471�38 1513 1513�11 1543�2 1562 1561�37 1582 1584�(Ca Cb) 1618 1615

size). With these settings, the whole spectral domain of
interest for biological macromolecules, from �400 cm�1 to
2000 cm�1, can be covered in only two acquisitions. Using the
600 lines mm�1 grating blazed at 1000 nm, the Raman spec-
trum even includes the whole domain of interest with a
spectral resolution of 5.2 cm�1 or 11.2 cm�1, using 10 mm or
100 mm slit sizes, respectively. The larger slit width results in an
approximate tenfold increase in photon detection, while only
reducing the spectral resolution by a factor of two, so that this
is the preferred setting unless peaks very close together have
to be resolved (e.g. peaks around 1010 cm�1 in Fig. 7). The
selection of the gratings and the size of the entrance slits of the
spectrograph as well as the tunable intensity of the 785 nm
laser make the non-resonance Raman set-up in the NIR
domain highly versatile. Depending on the experiment, a focus
can be put either on fast data acquisition and signal-to-noise
ratio or on spectral resolution.
Both the on-axis geometry and the high efficiency of the
MS2 in the NIR domain are of great interest for the study of
radiation damage processes. In Fig. 8, non-resonance Raman
spectra collected on the same HEWL crystal with an
increasing X-ray dose are shown. The spectra were baseline
subtracted, but not additionally scaled, since the peak at
759 cm�1 of the Trp did not show significant variation. This
was also suggested in a work on the dose-dependent decay of
the S—S bond stretching Raman band at 510 cm�1 combined
with crystallography (Carpentier et al., 2010). The comparison
of the successive Raman spectra shows the decay of the peaks
at 830–860 cm�1 and 940–980 cm�1 which could be assigned
to further specific radiation damage effects such as the de-
hydroxylation of tyrosine residues and the decarboxylation of
acidic residues, respectively.
This observation of specific radiation damage effects
demonstrates that the performance of the non-resonance
Raman mode of the MS2 in the NIR opens up the possibility
for further investigations such as, for example, reaction
kinetics and ligand binding studies (Carey et al., 2011).
5. Conclusion
With the upgrade to full multi-mode operation, the SLS micro-
spectrophotometer MS2 now also supports Raman and reso-
nance Raman operation. With its increased bandwidth down
to wavelengths of 250 nm, the option to rapidly switch
experimental modes and a set-up time of less than 3 h, the
scope of supported experiments has been considerably
expanded. Its unique on-axis configuration avoids systematic
errors from incomplete overlap of spectroscopic sampling
volume and X-ray-irradiated area and generally facilitates
spectrophotometer alignment. The new micro-spectro-
photometer makes beamline X10SA attractive both for
broader uses like dose determination to avoid specific radia-
tion damage effects and also, in combination with the off-line
SLSpectroLab and the fast Pilatus 6M hybrid pixel detector,
for a specialized field like, for example, kinetic enzymology.
The facility has been open for user operation since 2009, with
successful collaborations with over 15 external user groups
(Antonyuk & Hough, 2011; Hersleth & Andersson, 2011;
Regis Faro et al., 2011; He et al., 2012; Owen et al., 2012;
Merlino et al., 2013). The final upgrade, MS3, which is
currently being commissioned, includes and improves on the
advances of the MS2 instrument presented here and, most
importantly, can remain always online at the beamline
The authors would like to thank Alke Meents (DESY),
Robin Owen (DLS) and Arwen Pearson (University of Leeds)
for inspiration and helpful input and discussions. The
presented work would have been impossible without the
research papers
J. Synchrotron Rad. (2013). 20, 765–776 Guillaume Pompidor et al. � New on-axis micro-spectrophotometer at SLS 775
Figure 8Non-resonance Raman time-series showing the X-ray-induced breakageof disulfide bonds (510 cm�1, red line) in HEWL in quasi real-time (�exc =785 nm). Spectra are ordered with lowest X-ray dose at the bottom, finaldose (18 MGy) at the top. Power at the sample was 160 mW andacquisition time for each spectrum was 180 s.
Figure 7Non-resonance Raman spectra of a HEWL crystal using different gratingand slit settings. Green: 600 lines mm�1 grating, 100 mm slit size with 100 sacquisition time; red: 600 lines mm�1 grating, 10 mm slit size and 240 sacquisition time; blue: 1200 lines mm�1 grating, 100 mm slit size with 180 sacquisition time. Spectra were acquired with excitation at 785 nm. Thelast spectrum was manually stitched together from two separateacquisitions (400–1120 cm�1 and 1040–1760 cm�1) to extend to acomparable spectral range. For this spectrum a basic baseline correctionwas applied. All other spectra show raw data. Power at the sample was160 mW.
support by Jose Gabadinho, Ezequiel Panepucci, Claude
Pradervand, Jorg Schneider, Roman Schneider, Takashi
Tomizaki and the rest of the SLS MX-Group. Funding was
provided by a PSI Forschungskommission grant as well as the
X10SA beamline partners Max Planck Gesellschaft, Novartis
and F. Hoffman-La Roche.
References
Adam, V., Carpentier, P., Violot, S., Lelimousin, M., Darnault, C.,Nienhaus, G. U. & Bourgeois, D. (2009). J. Am. Chem. Soc. 131,18063–18065.
Allan, E. G., Kander, M. C., Carmichael, I. & Garman, E. F. (2013).J. Synchrotron Rad. 20, 23–36.
Antonyuk, S. V. & Hough, M. A. (2011). BBA-Proteins Proteom.1814, 778–784.
Beitlich, T., Kuhnel, K., Schulze-Briese, C., Shoeman, R. L. &Schlichting, I. (2007). J. Synchrotron Rad. 14, 11–23.
Binnemans, K., Van Herck, K. & Gorller-Walrand, C. (1997). Chem.Phys. Lett. 266, 297–302.
Carey, P. R., Chen, Y., Gong, B. & Kalp, M. (2011). BBA-ProteinsProteom. 1814, 742–749.
Carpentier, P., Royant, A., Ohana, J. & Bourgeois, D. (2007). J. Appl.Cryst. 40, 1113–1122.
Carpentier, P., Royant, A., Weik, M. & Bourgeois, D. (2010).Structure, 18, 1410–1419.
Cohen, A. E., Chang, J., Doukov, T., Ehrensberger, P., Hollenbeck,M., McPhillips, S., Song, J. & Soltis, S. M. (2013). In preparation.
Davies, R. J., Burghammer, M. & Riekel, C. (2009). J. SynchrotronRad. 16, 22–29.
De la Mora-Rey, T. & Wilmot, C. M. (2007). Curr. Opin. Struct. Biol.17, 580–586.
De Sanctis, G., Petrella, G., Ciaccio, C., Feis, A., Smulevich, G. &Coletta, M. (2007). Biophys. J. 93, 2135–2142.
Ebner, S. (2012). Experiment State Controller – Escape, http://controls.web.psi.ch/cgi-bin/twiki/view/Main/ExperimentStateController.
Ellis, M. J., Buffey, S. G., Hough, M. A. & Hasnain, S. S. (2008).J. Synchrotron Rad. 15, 433–439.
Faro, A. R., Carpentier, P., Jonasson, G., Pompidor, G., Arcizet, D.,Demachy, I. & Bourgeois, D. (2011). J. Am. Chem. Soc. 133, 16362–16365.
Garman, E. F. & Weik, M. (2011). J. Synchrotron Rad. 18, 313–317.Hadfield, A. & Hajdu, J. (1993). J. Appl. Cryst. 26, 839–842.He, C., Fuchs, M. R., Ogata, H. & Knipp, M. (2012). Angew. Chem.
Int. Ed. 51, 4470–4473.Hearn, A. G. (1961). Proc. Phys. Soc. 78, 932–940.Hersleth, H.-P. & Andersson, K. K. (2011). BBA-Proteins Proteom.
1814, 785–796.Hu, S., Smith, K. M. & Spiro, T. G. (1996). J. Am. Chem. Soc. 118,
12638–12646.Kamagata, K., Kawaguchi, T., Iwahashi, Y., Baba, A., Fujimoto, K.,
Komatsuzaki, T., Sambongi, Y., Goto, Y. & Takahashi, S. (2012).J. Am. Chem. Soc. 134, 11525–11532.
Katona, G., Carpentier, P., Niviere, V., Amara, P., Adam, V., Ohana, J.,Tsanov, N. & Bourgeois, D. (2007). Science, 316, 449–453.
Kessler, R. W. (2006). Prozessanalytik: Strategien und Fallbeispieleaus der Industriellen Praxis. Weinheim: Wiley-VCH.
Kovaleva, E. G. & Lipscomb, J. D. (2008). Biochemistry, 47, 11168–11170.
Kudryavtsev, A. B., Mirov, S. B., DeLucas, L. J., Nicolete, C., van derWoerd, M., Bray, T. L. & Basiev, T. T. (1998). Acta Cryst. D54,1216–1229.
Kuhnel, K., Derat, E., Terner, J., Shaik, S. & Schlichting, I. (2007).Proc. Natl. Acad. Sci. 104, 99–104.
Liland, K. H., Almøy, T. & Mevik, B. H. (2010). Appl. Spectrosc. 64,1007–1016.
Liu, H. H., Lin, S. H. & Yu, N. T. (1990). Biophys. J. 57, 851–856.Lu, S., Wiertz, F. G. M., de Vries, S. & Moenne-Loccoz, P. (2005).
J. Raman Spectrosc. 36, 359–362.McCreery, R. L. (2000). Raman Spectroscopy for Chemical Analysis.
New York: Wiley-Interscience.McCreery, R. L. (2011). Raman standard spectra, http://www.chem.
ualberta.ca/~mccreery/ramanmaterials.html.Meents, A., Owen, R. L., Murgida, D., Hildebrandt, P., Schneider, R.,
Pradervand, C., Bohler, P. & Schulze-Briese, C. (2007). AIP Conf.Proc. 879, 1984–1988.
Merlino, A., Fuchs, M. R., Pica, A., Balsamo, A., Dworkowski,F. S. N., Pompidor, G., Mazzarella, L. & Vergara, A. (2013). ActaCryst. D69, 137–140.
Orville, A. M., Buono, R., Cowan, M., Heroux, A., Shea-McCarthy,G., Schneider, D. K., Skinner, J. M., Skinner, M. J., Stoner-Ma, D. &Sweet, R. M. (2011). J. Synchrotron Rad. 18, 358–366.
Owen, R. L., Pearson, A. R., Meents, A., Boehler, P., Thominet, V. &Schulze-Briese, C. (2009). J. Synchrotron Rad. 16, 173–182.
Owen, R. L., Yorke, B. A. & Pearson, A. R. (2012). Acta Cryst. D68,505–510.
Paithankar, K. S., Owen, R. L. & Garman, E. F. (2009). J. SynchrotronRad. 16, 152–162.
Pearson, A. R., Mozzarelli, A. & Rossi, G. L. (2004). Curr. Opin.Struct. Biol. 14, 656–662.
Pearson, A. R. & Owen, R. L. (2009). Biochem. Soc. Trans. 37, 378–381.
Pearson, A. R., Pahl, R., Kovaleva, E. G., Davidson, V. L. & Wilmot,C. M. (2007). J. Synchrotron Rad. 14, 92–98.
Peng, J., Peng, S., Jiang, A., Wei, J., Li, C. & Tan, J. (2010). Anal. Chim.Acta, 683, 63–68.
Pompidor, G., Maury, O., Vicat, J. & Kahn, R. (2010). Acta Cryst. D66,762–769.
Rajendran, C., Dworkowski, F. S. N., Wang, M. & Schulze-Briese, C.(2011). J. Synchrotron Rad. 18, 318–328.
Royant, A., Carpentier, P., Ohana, J., McGeehan, J., Paetzold, B.,Noirclerc-Savoye, M., Vernede, X., Adam, V. & Bourgeois, D.(2007). J. Appl. Cryst. 40, 1105–1112.
Sakai, K., Matsui, Y., Kouyama, T., Shiro, Y. & Adachi, S. (2002).J. Appl. Cryst. 35, 270–273.
Schlichting, I., Berendzen, J., Chu, K., Stock, A. M., Maves, S. A.,Benson, D. E., Sweet, R. M., Ringe, D., Petsko, G. A. & Sligar, S. G.(2000). Science, 287, 1615–1622.
Siebert, F. & Hildebrandt, P. (2008). Vibrational Spectroscopy in LifeScience. Weinheim: Wiley-VCH Verlag.
Smulevich, G., Mantini, A. R., Paoli, M., Coletta, M. & Geraci, G.(1995). Biochemistry, 34, 7507–7516.
Spiro, T. G. (1985). Adv. Protein Chem. 37, 111–159.Stoner-Ma, D., Skinner, J. M., Schneider, D. K., Cowan, M., Sweet,
R. M. & Orville, A. M. (2011). J. Synchrotron Rad. 18, 37–40.Takahashi, S., Wang, J., Rousseau, D. L., Ishikawa, K., Yoshida, T.,
Takeuchi, N. & Ikeda-Saito, M. (1994). Biochemistry, 33, 5531–5538.
Weik, M. & Colletier, J.-P. (2010). Acta Cryst. D66, 437–446.Zeldin, O. B., Gerstel, M. & Garman, E. F. (2013). J. Synchrotron Rad.
20, 49–57.
research papers
776 Guillaume Pompidor et al. � New on-axis micro-spectrophotometer at SLS J. Synchrotron Rad. (2013). 20, 765–776