A new isopiestic apparatus for the determination of osmotic coefficients
25
A new isopiestic apparatus for the determination of osmotic coefficients Jun Zhou * , Qi-Yuan Chen, Yong Zhou 1 , Zhou-Lan Yin Institute of Physical Chemistry in the College of Chemistry and Chemical Engineering, Central South University, Changsha, Hunan 410083, China Received 15 May 2002; accepted 8 July 2003 Abstract A new isopiestic apparatus has been designed and constructed following several criteria. It consists mainly of several small sample cups for holding small quantities of reference standard solutions, and a big sample cup for a bigger quantity of a test solution. Using this apparatus, experiments on NaOH solutions have been performed. The experimental procedure, the con- sistency among the samples in equilibrium, the equilibration process, and the determined os- motic coefficients of NaOH solutions are discussed. The apparatus is found to ensure a consistent temperature among the samples in equilibrium, meeting the experimental require- ments for samples of molalities less than 0.05 mol kg 1 . Inside the apparatus, the temperature can reach the desired uniform temperature within less than 0.5 d. In the experiments, the equil- ibration process is essentially determined by changes in the reference standard solutions in the small cups. Thus the apparatus is not only reliable and stable, but is also suitable for exper- iments on solutions of viscous, complex and unstable solutes. The equilibration time of the experiments is fast, which is practical for samples of molalities less than 0.05 mol kg 1 . More- over, with the new apparatus it is easy to determine the end point of the equilibration. Ó 2003 Elsevier Ltd. All rights reserved. Keywords: Apparatus; Isopiestic; Osmotic coefficients; Sodium hydroxide J. Chem. Thermodynamics 35 (2003) 1939–1963 www.elsevier.com/locate/jct * Corresponding author. Tel.: +86-731-8877364; fax: 86-731-8879616. E-mail addresses: [email protected], [email protected] (J. Zhou). 1 Present address: Yingfeng Eastern Road 102, Huaihua, Hunan 418000, P.R. China. 0021-9614/$ - see front matter Ó 2003 Elsevier Ltd. All rights reserved. doi:10.1016/j.jct.2003.07.004
Transcript of A new isopiestic apparatus for the determination of osmotic coefficients

J. Chem. Thermodynamics 35 (2003) 1939–1963
www.elsevier.com/locate/jct
A new isopiestic apparatus for thedetermination of osmotic coefficients
Jun Zhou *, Qi-Yuan Chen, Yong Zhou 1, Zhou-Lan Yin
Institute of Physical Chemistry in the College of Chemistry and Chemical Engineering,
Central South University, Changsha, Hunan 410083, China
Received 15 May 2002; accepted 8 July 2003
Abstract
A new isopiestic apparatus has been designed and constructed following several criteria. It
consists mainly of several small sample cups for holding small quantities of reference standard
solutions, and a big sample cup for a bigger quantity of a test solution. Using this apparatus,
experiments on NaOH solutions have been performed. The experimental procedure, the con-
sistency among the samples in equilibrium, the equilibration process, and the determined os-
motic coefficients of NaOH solutions are discussed. The apparatus is found to ensure a
consistent temperature among the samples in equilibrium, meeting the experimental require-
ments for samples of molalities less than 0.05 mol � kg�1. Inside the apparatus, the temperature
can reach the desired uniform temperature within less than 0.5 d. In the experiments, the equil-
ibration process is essentially determined by changes in the reference standard solutions in the
small cups. Thus the apparatus is not only reliable and stable, but is also suitable for exper-
iments on solutions of viscous, complex and unstable solutes. The equilibration time of the
experiments is fast, which is practical for samples of molalities less than 0.05 mol � kg�1. More-
over, with the new apparatus it is easy to determine the end point of the equilibration.
� 2003 Elsevier Ltd. All rights reserved.
Keywords: Apparatus; Isopiestic; Osmotic coefficients; Sodium hydroxide
* Corresponding author. Tel.: +86-731-8877364; fax: 86-731-8879616.
E-mail addresses: [email protected], [email protected] (J. Zhou).1 Present address: Yingfeng Eastern Road 102, Huaihua, Hunan 418000, P.R. China.
0021-9614/$ - see front matter � 2003 Elsevier Ltd. All rights reserved.
doi:10.1016/j.jct.2003.07.004

1940 J. Zhou et al. / J. Chem. Thermodynamics 35 (2003) 1939–1963
1. Introduction
The isopiestic method is an important measurement technique for the determi-
nation of the osmotic and activity coefficients of solutions. It has been discussed
in detail by Platford [1] in 1979, and Rard and Platford [2] in 1991. It was devel-oped by many researchers [3–7]. One typical isopiestic chamber for measurements
near room temperature was described by Rard [8,9]. Another typical apparatus
was described by Mitchell et al. [10]. These two typical instruments have retained
the most striking features of the isopiestic method, i.e. simplicity, flexibility, and
applicability. Moreover, both can be used to determine the osmotic coefficients of
a number of different electrolytes simultaneously. Another type of isopiestic appa-
ratus made of glass was described by Park and Englezos [11], Zafarani-Moattar
and Zasirzade [12], Lin et al. [13] as well as other workers. The only isopiesticapparatus, designed for operating well above T ¼ 373 K, is constructed and op-
erated at Oak Ridge National Laboratory, in which the samples are weighed in
situ [1,2].
Although the isopiestic method is widely used, it still has a few drawbacks. (1) In
contrast to many other methods, the isopiestic method is quite time consuming, es-
pecially at low molalities, where equilibration times of more than several weeks are
required. For viscous aqueous electrolytes equilibration times are longer, for exam-
ple as reported by Rard [14] and Miller and Porter [15]. (2) It is somewhat difficult toapply this method to unstable or complex solutions, for example as reported by
Holmes and Mesmer [16], Lantzke et al. [17], and Robinson et al. [18]. (3) As noted
by Rard and Platford [2], this method is generally unsatisfactory below 0.1 mol � kg�1
under normal circumstances; however, the data at low molalities are important for
the calculation of the activity coefficients of solutes, especially for higher valence
electrolytes.
Our objective is to develop a new isopiestic apparatus with the aim of avoiding the
shortcomings mentioned above.
2. Experimental
The new apparatus is shown in figure 1. It has been designed with the following
criteria in mind:
1. high reliability and stability;
2. fast equilibration time;3. easy and effective determination of the end point of the equilibration.
The small cups (6 in figure 1) are used to contain the reference standard solutions,
NaCl solutions (0.2 to 1.5) g. In general, the height of the solution should not exceed
the middle height of the cup. The glass ball (9 in figure 1) helps to create turbulent
mixing of the solution and to stir the air in the upper part of the small cup to some
extent.
The main function of the sheath (7 in figure 1) is not only to prevent the small cup
from touching the solution in the big cup (5 in figure 1) but also to act as a heat
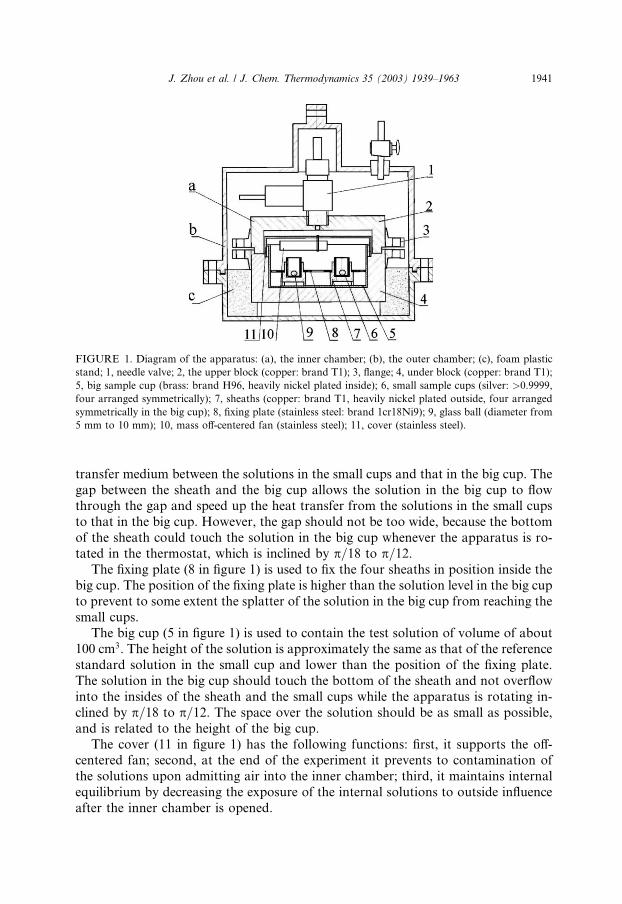
FIGURE 1. Diagram of the apparatus: (a), the inner chamber; (b), the outer chamber; (c), foam plastic
stand; 1, needle valve; 2, the upper block (copper: brand T1); 3, flange; 4, under block (copper: brand T1);
5, big sample cup (brass: brand H96, heavily nickel plated inside); 6, small sample cups (silver: >0.9999,
four arranged symmetrically); 7, sheaths (copper: brand T1, heavily nickel plated outside, four arranged
symmetrically in the big cup); 8, fixing plate (stainless steel: brand 1cr18Ni9); 9, glass ball (diameter from
5 mm to 10 mm); 10, mass off-centered fan (stainless steel); 11, cover (stainless steel).
J. Zhou et al. / J. Chem. Thermodynamics 35 (2003) 1939–1963 1941
transfer medium between the solutions in the small cups and that in the big cup. The
gap between the sheath and the big cup allows the solution in the big cup to flowthrough the gap and speed up the heat transfer from the solutions in the small cups
to that in the big cup. However, the gap should not be too wide, because the bottom
of the sheath could touch the solution in the big cup whenever the apparatus is ro-
tated in the thermostat, which is inclined by p=18 to p=12.The fixing plate (8 in figure 1) is used to fix the four sheaths in position inside the
big cup. The position of the fixing plate is higher than the solution level in the big cup
to prevent to some extent the splatter of the solution in the big cup from reaching the
small cups.The big cup (5 in figure 1) is used to contain the test solution of volume of about
100 cm3. The height of the solution is approximately the same as that of the reference
standard solution in the small cup and lower than the position of the fixing plate.
The solution in the big cup should touch the bottom of the sheath and not overflow
into the insides of the sheath and the small cups while the apparatus is rotating in-
clined by p=18 to p=12. The space over the solution should be as small as possible,
and is related to the height of the big cup.
The cover (11 in figure 1) has the following functions: first, it supports the off-centered fan; second, at the end of the experiment it prevents to contamination of
the solutions upon admitting air into the inner chamber; third, it maintains internal
equilibrium by decreasing the exposure of the internal solutions to outside influence
after the inner chamber is opened.
1942 J. Zhou et al. / J. Chem. Thermodynamics 35 (2003) 1939–1963
The off-centered fan (10 in figure 1) is designed to stir the gas phase effectively.
The friction between the off-centered fan and the shaft is small so that the heat from
continuous friction is negligible.
The thickness of the inner chamber wall (a in figure 1) (2 and 4 in figure 1) serves
to eliminate the influence caused by external temperature fluctuations, to quickly dis-tribute the internal temperature difference caused by enthalpy changes and to simul-
taneously ensure that the internal temperature reaches the average thermostat
temperature as quickly as possible.
The vacuum in the outer chamber (b in figure 1) can be adjusted so as to achieve
two requirements. The first one is to dampen out the temperature variations in the
thermostat; the other is to ensure that the internal-temperature reaches the average
thermostat temperature as quickly as possible.
The apparatus is fitted with a device in the thermostat, which is rotated by a mo-tor placed outside of the thermostat. The thermostat is inclined by p=18 to p=12.
Each experimental datum is followed by its uncertainty. The final uncertainty is
the standard deviation, which is calculated from all individual standard deviations.
Using the law of propagation of errors:
y ¼ yðx1; x2; x3; . . .Þ; ð1Þ
rðyÞ2 ¼ ðoy=ox1Þ2 � rðx1Þ2 þ ðoy=ox2Þ2 � rðx2Þ2 þ � � � ; ð2Þ
where r is the standard deviation.
Sartorius BP190S (precision 6� 0:0001 g) and Sartorius BS2000S (precision
6� 0:01 g) electronic balances were used in the experiments. The balances were cal-ibrated each time before use. Each weighing was usually repeated at least three times
and the average was taken as the result. The masses, except those of the containers,
were corrected for buoyancy if the relative errors arising from the air buoyancy were
above 1/8000. The density of the air was calculated by interpolation from tabulated
values [19] at given pressures and temperatures.
Water was prepared by distillation of tap water. A small amount of KMnO4 and
NaOH were added to the tap water to destroy organic substances and inorganic ac-
ids during the distillation. The temperature of the distilled water was controlled inthe range 348 K to 358 K. The distilled water was stored in a large glass container
connected to a gas-washing bottle (NaOH solution) and an air-drying tower (so-
da-lime) in order to eliminate CO2 and dust in the incoming air. The pH of the dis-
tilled water obtained was about 6.0 at T ¼ 289 K.
A concentrated stock solution of NaCl of about 5.8 mol � kg�1 was prepared by
dissolving reagent grade NaCl (GR grade, GB1266-86). The density of the crystal
NaCl was calculated using Archer�s equation [20] as 2.165 g � cm�3 at T ¼ 298:15K. The density of the stock solution was measured to be (1191.675� 0.022) g � cm�3
at about T ¼ 287:65 K. The NaCl stock solution was analyzed for impurities using
inductive-coupled plasma atomic emission spectroscopy (ICPAES) and was found to
contain: K: 144.84 mg � kg�1, S: 102.65 mg � kg�1, Zn: 12.57 mg � kg�1, and remaining
residue: 610 mg � kg�1. We neglected the presence of these impurities and assumed
the solute to be pure NaCl and took 58.443 g �mol�1 as the effective molar mass

J. Zhou et al. / J. Chem. Thermodynamics 35 (2003) 1939–1963 1943
in the calculation of molalities. The measurement method of the molality of the
NaCl stock solution was similar to the dehydration method used by Rard and Ar-
cher [21] and to that presented in the Handbook of Analytical Chemistry [19]. The
porcelain crucibles were heated to above T ¼ 823 K several times for at least 10 h
and then stored in an H2SO4 desiccator. The Teflon caps were stored in air; forthe experiments had shown that if the Teflon caps were stored in a desiccator, the
total weight of the porcelain crucible and the cap would fluctuate probably due to
the Teflon cap absorbing air moisture. Three samples, each of about 20 cm3 stock
solution, were slowly evaporated at low temperature until dry, followed by further
dehydration at about T ¼ 773 K to T ¼ 823 K for about 1 h. Then they were cooled
in an H2SO4 desiccator for 2 d. The masses of the residues of the three samples gave
a mean mass per cent of NaCl of (25.2146� 0.0049). Another two samples were an-
alyzed by first adding about 15 cm3 to 20 cm3 of ethyl alcohol, and then drying themwith a hair dryer. This measure greatly reduced the splatter of the samples during the
analysis. The masses of the residues gave a mean mass percent of NaCl of
(25.21440� 0.00070). The first determined value (25.2146� 0.0049) per cent, was ac-
cepted as the final result, thus the molality of the stock solution was taken as
m(NaCl)¼ (5.7690� 0.0011) mol � kg�1, and the molarity at T ¼ 287:65 K was calcu-
lated to be c(NaCl)¼ (5.1414� 0.0011) mol � dm�3.
We chose NaOH solution as the test solution. The NaOH is of reagent grade (GR
grade, GB629-81(84)). Its molar mass is taken to be 39.9971 g �mol�1. By referring tothe methods of Simonson et al. [22], of the Handbook of Analytical Chemistry [19],
and of Stokes [23], the NaOH stock solution was prepared as follows. (1) About 2000
cm3 of lye of 50 per cent by weight were prepared and stored in polyethylene bottles.
After capping them tightly, the bottles were placed inside a desiccator containing so-
da-lime and allowed to settle there for about one week. (2) The upper clear solutions
in the polyethylene bottles were siphoned using a polyethylene tube into a 1000 cm3
measuring flask whose weight was accurately known in advance. The solution was
then adjusted to a fixed volume of 1000 cm3 by adding water and mixing thoroughly.After accurate weighing, the prepared solution was transferred into (500 to 800) cm3
polyethylene bottles. (3) Once the bottles were hermetically sealed and weighed, they
were stored in a soda-lime desiccator. The bottles were weighed again before using
the stock solutions, the difference in weight should be less than 0.01 g. The density
of the NaOH stock solution is (1456.6� 1.5) g � dm�3 at T ¼ 291:65 K.
A sample prepared from the stock solution, NaOH (0.88360� 0.00088) mol � kg�1,
was analyzed for impurities using ICPAES and was found to contain: S: 18.01
mg � kg�1, Si: 1.45 mg �kg�1 H2O and the remaining residue 61 mg � kg�1 H2O. Inaddition, we analyzed the Si content in some samples prepared from the NaOH stock
solution by spectrophotometry. These samples were stored in normal glass contain-
ers under various temperatures for various periods of times. We found the Si con-
tents were 111 mg � dm�3 at about T ¼ 393 K for a period from 6 h to 12 h, 32.8
mg � dm�3 at about T ¼ 373 K for a period from 6 h to 12 h, and less than 1
mg � dm�3 at about T ¼ 353 K for 4 h. One of the NaOH sample solutions diluted
from the stock solution, about 3 mol � dm�3, was titrated by 1 mol � dm�3 standard
HCl(aq) for the analysis of the Na2CO3 content according to GB629-81(84) [24].

1944 J. Zhou et al. / J. Chem. Thermodynamics 35 (2003) 1939–1963
This sample was stored for 36 d in the measuring flask with an additional rubber ball
wrapping the top. The analysis showed the presence of 1/2(Na2CO3) equivalent to a
mole fraction of (0.00177� 0.00070) of the total alkali. It is reasonable to suppose
that the 1/2(Na2CO3) mole fraction in the stock solution is not more than
(0.00177� 0.00070). This result is consistent with that of Stokes [23], 1:4 � 10�3,and also with that of Simonson et al. [22], <0.001 to some extent. In Stokes� opinion(1945) [23], the presence of a 0.2 per cent of carbonate is unlikely to affect the isopi-
estic molality ratios of m(H2SO4)/m(NaOH) by more than 5:0 � 10�3 in isopiestic ex-
periments. We have neglected therefore the presence of Na2CO3 and other
impurities. Moreover, the experimental solutions were always prepared just before
the experiments were begun.
The NaOH in the stock solution was analyzed using an improved titration method.
The burette was of A grade (GB12803-12808-91) [24]. The KHC8H4O4 was of pri-mary standard (GB1257-89) [24], and its molar mass is assumed to be 204.229
g �mol�1. Its density is 1.636 g � cm�3 at T ¼ 298:15 K [25]. It was dried at
T ¼ ð383to 393Þ K for 3 d and stored in an H2SO4 desiccator for 20 d. The analysis
includes the following steps. (1) About 0.9 mol � dm�3 NaOH solution was prepared
from the stock solution by mass dilution. (2) About 50 cm3 diluted solution, accu-
rately weighed, was titrated by using 1 mol � dm�3 HCl with phenolphthalein as indi-
cator. (3) About 9.5 g of accurately weighed KHC8H4O4 was added to about 100 cm3
of weighed diluted solution. (4) The solution was titrated by using 1 mol � dm�3 HClwith phenolphthalein as indicator. The same burette was used in the whole titration
process. The analysis accuracy mainly depends on the readability of the burette and
the accuracy of the weighing. The titration gave the results: NaOH: (42.640� 0.037)
per cent, m(NaOH)¼ (18.586� 0.020) mol � kg�1, c(NaOH)¼ (15.528� 0.021) mol �dm�3 at T ¼ 291:65 K.
2.1. The isopiestic apparatus
The isopiestic apparatus described above was placed on a table inside a thermo-
stat. The rotational velocity of the table was 0:5 � p=s. The thermostat was inclined
by about p=18, and the temperature was electrically controlled to �0.1 K with a
maximum drift of about 0.5 K over 24 h. This kind of temperature precision is worse
than that normally required (6�0.01 K). However, the experimental results show
that good data could still be obtained under these conditions.
Silver isopiestic cups have been used by many researchers [3,7,23]. However, other
researchers have reported problems of corrosion of the silver cups in their experi-ments. Therefore it is still not clear whether silver cups are completely inert to all
chloride solutions [2]. We placed a piece of silver in a sample of NaCl stock solution
for 40 d at T ¼ 338 K and 10 d at room temperature. Afterwards, the solution was
analyzed by using atomic absorption spectrometry and was found to contain 45
mg � dm�3 of Ag. In contrast, the Ag content in the original stock solution is
<0.02 mg � dm�3. However, we could not find obvious changes on the silver surface
even after one year. We have also analyzed one sample of NaCl solution which had
undergone an experiment for 5 d at T ¼ 298:15 K by atomic emission spectrometry,

J. Zhou et al. / J. Chem. Thermodynamics 35 (2003) 1939–1963 1945
and found an Ag content of 0.22 mg � dm�3, in contrast, the Ag content in the cor-
responding solution prior to the experiment was less than 0.05 mg � dm�3. Thus, it
can be seen that, there is indeed corrosion of silver by the NaCl solutions which falls
in the range of the expected precision.
We have also investigated the corrosion of the big cup by the NaOH solution. Onesample of 0.4 mol � kg�1 after a 5 d experiment at T ¼ 298:15 K was analyzed by
atomic emission spectrometry, and was found to contain Ni: <0.01 mg � dm�3, Fe:
0.015 mg � dm�3, Cu: 0.05 mg � dm�3 and Zn: <0.01 mg � dm�3. The corresponding
sample prior to the experiment contained Ni: <0.01 mg � dm�3, Fe: 5:0 � 10�3
mg � dm�3, Cu: 1:0 � 10�3 mg � dm�3 and Zn: <0.01 mg � dm�3. Another sample of
about 0.2 mol � kg�1 after 4 d experiment at T ¼ 298:15 K was analyzed using IC-
PAES, and the analysis gave Ni: 0.02 mg � dm�3, Cu: 1.09 mg � dm�3 and Zn: 0.02
mg � dm�3. The results showed that the corrosion of the big cup by the NaOH solu-tion would have little influence on our experiments.
Each small cup, including the small cap and the glass ball, weighs about 10 g to 15
g, and the big cup, including the 4 sheaths and the fixing plate and the big cap,
weighs about 660 g. The total apparatus has been tested for several months. After
decreasing fast at the beginning the period, the weights of the containers gradually
stabilised. The total decrease in weight was about 0.02 g for the small cup and about
0.15 g for the big cup. The exact fitting size of the small cap for the small cup is im-
portant during weighing. If it is too loose, some of the internal water vapour mayleak out, but if it is too tight, the internal gas will be compressed while capping, re-
sulting in a weight decrease. For example, in a trial weighing, we capped the small
cup and weighed it immediately, the total mass was 10.9200 g, after a while it de-
creased to 10.9196 g which was equal to the sum of the mass of the small cup
(9.6496 g) and that of the small cap (1.2700 g). We selected the caps according to
the following rule: after they were placed on the cups, the total mass was equal to
the sum of the individual masses of the parts within 3 min to 5 min, and the total
mass did not change after 10 min and within 24 h when there was a solution inthe cup. After blowing the small cup for 10 min with a hair dryer, its mass decreased
by only 60.0001 g, and returned to the former mass in a short time. We concluded
that absorption of moisture by the small cup would have no effect on our experi-
ments. The small cups and caps were then stored in air. For the big cup and cap, pre-
liminary experiments showed that both the absorption of moisture and the
compression of air during capping were negligible. However, in order to avoid con-
tamination by carbon dioxide, the big cup and cap were stored in a soda-lime desic-
cator. The inner chamber was also stored in the soda-lime desiccator.
2.2. Experimental procedure
The normal procedure adopted in the experiments is as follows:
1. Each cup (1#, 2#, 3#, 4#) was accurately weighed with its lid. The solutions, in-
cluding the NaCl solution of high initial molality, the NaCl solution of low initial
molality, and the test NaOH solution whose molality lies between the initial molal-
ities of the NaCl solutions were prepared by mass dilution from the stock solution.

1946 J. Zhou et al. / J. Chem. Thermodynamics 35 (2003) 1939–1963
Usually the small cups of 1# and 3# are used for the NaCl solutions of high initial
molality, and 2# and 4# for the solutions of low initial molality. Each NaCl reference
standard sample was about 0.2 g to 1.0 g, and four samples were arranged symmet-
rically inside the big cup. The big cup was used for the NaOH solution sample, which
was about 70 cm3 to 100 cm3. After the big cup was placed in the inner chamber, itwas hermetically closed. All operations were performed as quickly as possible in or-
der to reduce the exposure of the samples, especially the NaOH solution to air.
2. The inner chamber was then connected to an evacuation system, which con-
sisted of a 500 cm3 beaker flask filled with 200 cm3 of distilled water and Al(OH)3powder, a vacuum glass stopcock, a 3000 cm3 cushion flask, and a vacuum pump.
During evacuation, the stopcock was rotated so as to maintain a few tiny bubbles
generated in the water of the beaker flask. As evacuation went on, the temperature
of the water in the beaker flask decreased gradually, and the saturation vapour pres-sure of the water gradually reduced and tended to equal that of the samples inside
the inner chamber. Thus, the water vapour generated in the samples was sufficient
to exclude the air from the inner chamber. Evacuation usually lasted 30 min. Exper-
iments showed that, with this technique, the splattering of the samples was avoided
in most cases.
3. After evacuation, the entire inner chamber was placed inside the thermostat
and kept at the desired temperature for 60 min. The outer chamber was also kept
at the same temperature. Subsequently, the inner chamber was removed from theouter chamber. The outer chamber was then evacuated. Vacuum was high for
the low concentration samples and low for the high concentration samples. Later,
the whole apparatus was placed on the table inside the thermostat. The velocity of
rotation of the table was controlled in the range 0:3 � p=s to 0:5 � p=s. The starting
equilibration time was then recorded. In general terms, the water activity of the ini-
tial NaOH solution was easily maintained between those of the NaCl reference stan-
dard solutions of the higher and lower initial molalities because of the great relative
difference in the initial molalities of NaCl solutions. As equilibration progressed, thehigher and lower initial molalities of NaCl solutions approached to each other.
4. At the end of the equilibration, the apparatus was taken out. After dry air was
slowly admitted into the chamber, it was opened immediately. It takes usually less than
30 s to remove the cover and cap the big cup, to take out the small cups and place the
small caps in the sequence of 1#, 2#, 3#, and 4#. The four small capped cups are kept in
air at room temperature for 20 min, then, accurately weighed. The four small cups and
the big cup were then washed, dried, and weighed again, the difference between the
weights of the cups at the beginning and the end of the experiment should be less than� 0.0001 g for the small cups and less than � 0.01 g for the big cup.
3. Results and discussions
The results of the experiments (1 to 10) are presented in tables 1 to 5. Experiment
1 (table 1) is an evacuation experiment. There was no Al(OH)3 powder in the beaker
flask, however, a few tiny bubbles could still be maintained in the water by handling

TABLE 1
Evacuation of air from the inner chamber
Experiment 1 m(aq)/ga m/(mol �kg�1)b Conditions of evacuation
Initial
1#c 0.90152� 0.00014 0.172451� 0.000036 1. No Al(OH)3 Powder in the beaker flask
2# 0.44816� 0.00014 0.231710� 0.000043 2. Tiny bubbles in the distilled water
3# 0.67174� 0.00014 0.172451� 0.000036 3. 40 min
4# 0.47224� 0.00014 0.231710� 0.000043
Large cupd 71.489� 0.014 0.1930
End
1# 0.89291� 0.00014 0.174131� 0.000053
2# 0.44425� 0.00014 0.233777� 0.000113
3# 0.66382� 0.00014 0.174530� 0.000068
4# 0.46793� 0.00014 0.233874� 0.000108
Large cup 70.708� 0.014 0.1952
aMasses of the solutions.bMolality, for sodium aluminate solution (NaAl(OH)4 +NaOH+H2O) it is the molality of the total
alkali, m(TNaOH)¼m(NaOH)+m(NaAl(OH)4), and m(TNaOH):m(NaAl(OH)4)� 3.467.cNumber of NaCl solutions for which the NaCl content is calculated directly by dividing the mass of the
dissolved reagent grade NaCl (GB1266-86, GR grade) by the total mass of NaCl solution, i.e. M(NaCl)/
M(aq).d Solution for determination, i.e. sodium aluminate solution with the composition with unknown
error.
J. Zhou et al. / J. Chem. Thermodynamics 35 (2003) 1939–1963 1947
the stopcock very carefully. The evacuation of air lasted 40 min. The purpose of ex-
periment 1 was to determine how much water was lost from the sample cups during
the removal of air. The experimental solutions were NaCl solutions and sodium alu-
minate solutions. The main purpose of experiment 2 to experiment 4 (tables 2 and 3)
was to investigate the consistency among the small cups under equilibrium, and the
experimental solutions were still NaCl solutions and sodium aluminate solutions.
During the evacuation process in experiment 2 and experiment 3 (tables 2 and 3),
in which no Al(OH)3 powder were added into the beaker flask, small bubbles inthe distilled water were controlled. However, in experiment 4 (table 3), the normal
procedure (see Section 3.4) was employed. The main purpose of experiment 5 to ex-
periment 10 (tables 4 and 5) was to investigate the isopiestic equilibration process,
where the normal procedure (see Section 3.4) was used.
1. The evacuation process. On the basis of experiment 1 to experiment 10 (tables 1 to
5), table 6 is obtained, which illustrates the change in the samples for each exper-
iment. Table 7, which illustrates the changes in molality of the individual samples
during evacuation, is obtained from table 1 (Experiment 1).(a) By comparing experiment 1, experiments (2 and 3), and experiments (4 to
10) in table 6 with each other, it can be seen that we can control the samples�evaporation during evacuation by adjusting the water�s evaporation in the bea-
ker flask, such as controlling the magnitude of bubbles, adding powder to the
water, and other measures. (b) It is reasonable to expect that, after evacuation,
the magnitude of the mass loss of the sample becomes smaller with increase in

TABLE 2
Consistency among the small cups at T ¼ 298:2 K
Experiment 2 m(aq)/ga 100 �Mf (solute)b m/(mol � kg�1)c Conditions
Initial
1#d 0.80528� 0.00014 0.99780� 0.00021 0.172451� 0.000036 1. Evacuation: no powder, small bubbles, 30 min
2# 0.36935� 0.00014 1.33609� 0.00025 0.231710� 0.000043 2. Vacuum in the outer chamber: )80 kPa
3# 0.77404� 0.00014 0.99780� 0.00021 0.172451� 0.000036 3. Equilibration time: 3.8 to 4.0 days
4# 0.52293� 0.00014 1.33609� 0.00025 0.231710� 0.000043
Large cupe 72.077� 0.014 0.723 0.193
End
1# 0.68565� 0.00014 1.17189� 0.00040 0.202897� 0.000069
2# 0.42032� 0.00014 1.17407� 0.00063 0.203278� 0.000109
3# 0.65842� 0.00014 1.17302� 0.00041 0.203093� 0.000071
4# 0.59624� 0.00014 1.17182� 0.00047 0.202883� 0.000082
Large cup 68.425� 0.014 1.175 0.203
aMass of the solution.bMass fraction of the solute in the solution, for the sodium aluminate solution it is the values for the total alkali, which include the free alkali and the alkali
reacting with the aluminum hydroxide.cMolality, for sodium aluminate solution, it is the values for the total alkali, and m(TNaOH)¼m(NaOH)+m(NaAl(OH)4), m(TNaOH):
m(NaAl(OH)4)� 3.467.dNumber of NaCl solutions. The NaCl content is calculated directly by dividing the mass of the dissolved reagent grade NaCl (GB1266-86, GR grade) by
the total mass of NaCl solution, i.e. M(NaCl)/M(aq).e Solution for determination, i.e. sodium aluminate solution of unknown composition.
1948
J.Zhouet
al./J.Chem
.Therm
odynamics
35(2003)1939–1963
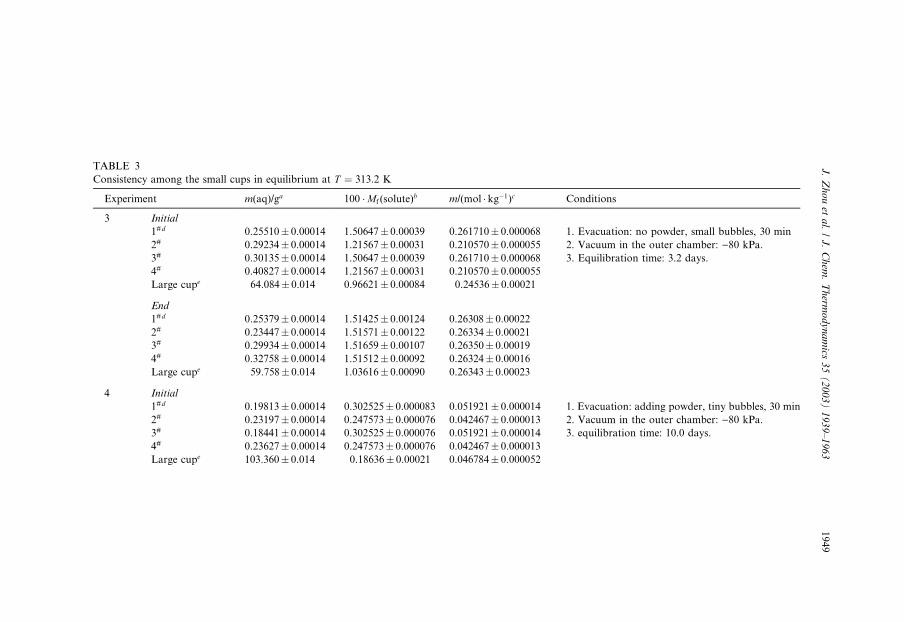
TABLE 3
Consistency among the small cups in equilibrium at T ¼ 313:2 K
Experiment m(aq)/ga 100 �Mf (solute)b m/(mol � kg�1)c Conditions
3 Initial
1#d 0.25510� 0.00014 1.50647� 0.00039 0.261710� 0.000068 1. Evacuation: no powder, small bubbles, 30 min
2# 0.29234� 0.00014 1.21567� 0.00031 0.210570� 0.000055 2. Vacuum in the outer chamber: )80 kPa.
3# 0.30135� 0.00014 1.50647� 0.00039 0.261710� 0.000068 3. Equilibration time: 3.2 days.
4# 0.40827� 0.00014 1.21567� 0.00031 0.210570� 0.000055
Large cupe 64.084� 0.014 0.96621� 0.00084 0.24536� 0.00021
End
1#d 0.25379� 0.00014 1.51425� 0.00124 0.26308� 0.00022
2# 0.23447� 0.00014 1.51571� 0.00122 0.26334� 0.00021
3# 0.29934� 0.00014 1.51659� 0.00107 0.26350� 0.00019
4# 0.32758� 0.00014 1.51512� 0.00092 0.26324� 0.00016
Large cupe 59.758� 0.014 1.03616� 0.00090 0.26343� 0.00023
4 Initial
1#d 0.19813� 0.00014 0.302525� 0.000083 0.051921� 0.000014 1. Evacuation: adding powder, tiny bubbles, 30 min
2# 0.23197� 0.00014 0.247573� 0.000076 0.042467� 0.000013 2. Vacuum in the outer chamber: )80 kPa.
3# 0.18441� 0.00014 0.302525� 0.000076 0.051921� 0.000014 3. equilibration time: 10.0 days.
4# 0.23627� 0.00014 0.247573� 0.000076 0.042467� 0.000013
Large cupe 103.360� 0.014 0.18636� 0.00021 0.046784� 0.000052
J.Zhouet
al./J.Chem
.Therm
odynamics
35(2003)1939–1963
1949

TABLE 3 (continued)
Experiment m(aq)/ga 100 �Mf (solute)b m/(mol �kg�1)c Conditions
End
1#d 0.22121� 0.00014 0.27096� 0.00027 0.046489� 0.00004
2# 0.21185� 0.00014 0.27109� 0.00026 0.046511� 0.00004
3# 0.20584� 0.00014 0.27103� 0.00029 0.046501� 0.00005
4# 0.21615� 0.00014 0.27062� 0.00025 0.046431� 0.00004
Large cupe 102.009� 0.014 0.18883� 0.00022 0.047406� 0.00005
aMass of the solution.bMass fraction of the solute in the solution, for the sodium aluminate solution it is the values fo total alkali, which include the free alkali and the alkali
reacting with the aluminum hydroxide.cMolality for sodium aluminate solution, it is the values of the total alkali, and m(T H)¼m(NaOH)+m(NaAl(OH)4). For experiment 3
m(TNaOH):m(NaAl(OH)4)¼ (3.2500� 0.0028), and for experiment 4, m(TNaOH):m(NaAl(OH)4 1.6481� 0.0018).d Sodium chloride solution.eSodium aluminate solution (NaAl(OH)4 +NaOH+H2O).
1950
J.Zhouet
al./J.Chem
.Therm
odynamics
35(2003)1939–1963
6
5
0
3
5
r the
NaO
)¼ (

TABLE 4
Equilibration experiments at T ¼ 298:2 K
Experiment minitiala mðevac:ÞðendÞ
b mendc me
d Dme;ende Conditions
(mol �kg�1) (mol �kg�1) (mol �kg�1) (mol �kg�1) (mol � kg�1)
5 1# f 0.110615� 0.000036 0.111531 0.101497� 0.000086 0.100658� 0.000843 0.000839 1. Evacuation: adding
powder, tiny bubbles, 30 min
2# f 0.091274� 0.000031 0.092190 0.099819� 0.000072 0.100658� 0.000843 )0.000839 2. Vacuum in the outer
chamber: )61 kPa.
3# f 0.110615� 0.000036 0.111531 0.103918� 0.000050 0.100658� 0.000843 0.003260 3. Equilibration time:
(72� 5) h.
4# f 0.091274� 0.000031 0.092190 0.098502� 0.000046 0.100658� 0.000843 )0.002156
(3#, 4#)g 0.100944� 0.000034 0.101860 0.101210� 0.000048 0.100658� 0.000843 0.000552
Large cuph 0.099056� 0.000124 0.099972 0.099961� 0.000126 0.099961� 0.000126
6 1# 0.110615� 0.000036 0.111295 0.099883� 0.000079 0.0998815� 0.000826 0.0000015 1. Evacuation: adding
powder, tiny bubbles, 30 min
2# 0.091274� 0.000031 0.091954 0.099880� 0.000086 0.0998815� 0.000826 )0.0000015 2. Vacuum in the outer
chamber:)53 kPa.
3# 0.110615� 0.000036 0.111295 0.100439� 0.000048 0.0998815� 0.000826 0.0005575 3. Equilibration time:
(130� 5) h.
4# 0.091274� 0.000031 0.091954 0.099490� 0.000046 0.0998815� 0.000826 )0.0003915
(3#, 4#) 0.100944� 0.000034 0.101624 0.099964� 0.000047 0.0998815� 0.000826 0.000083
Large cup 0.099056� 0.000124 0.099736 0.099739� 0.000125 0.099739� 0.000125
7 1# 1.06779� 0.00033 1.06950 0.97295� 0.00072 0.972435� 0.000885 0.00052 1. Evacuation: adding
powder, tiny bubbles, 30 min
2# 0.86126� 0.00031 0.86297 0.97192� 0.00071 0.972435� 0.000885 )0.00052 2. Vacuum in the outer
chamber: )48 kPa.
3# 1.06779� 0.00033 1.06950 0.97469� 0.00045 0.972435� 0.000885 0.00225 3. Equilibration time:
(38.5� 0.2) h.
4# 0.86126� 0.00031 0.86297 0.97225� 0.00045 0.972435� 0.000885 )0.00019i
(3#, 4#) 0.96452� 0.000 0.9662432 0.97347� 0.00045 0.972435� 0.000885 0.00103
Large cup 0.95991� 0.001 0.9616210 0.96123� 0.000110 0.96123� 0.00110
J.Zhouet
al./J.Chem
.Therm
odynamics
35(2003)1939–1963
1951

TABLE 4 (continued)
Experiment minitiala mðevac:ÞðendÞ
b mendc me
d Dme;ende Conditions
(mol � kg�1) (mol �kg�1) (mol �kg�1) (mol �kg�1) (mol � kg�1)
8 1# 3.42464� 0.00100 3.42691 3.0932� 0.0022 3.0943� 0.0024 )0.0011 1. Evacuation: adding
powder, tiny bubbles, 30 min
2# 2.63744� 0.00085 2.63971 3.0955� 0.0021 3.0943� 0.0024 0.0012 2. Vacuum in the outer
chamber: )35 kPa.
3# 3.42464� 0.00100 3.42691 3.1016� 0.0012 3.0943� 0.0024 0.0073 3. Equilibration time:
(12.2� 0.2) h.
4# 2.63744� 0.0085 2.63971 3.0837� 0.0013 3.0943� 0.0024 )0.0106
(3#, 4#) 3.03104� 0.00092 3.03331 3.0926� 0.0013 3.0943� 0.0024 )0.0017
Large cup 2.9696� 0.0034 2.9719 2.9698� 0.0034 2.9698� 0.0034
a Initial molality of the sample.bMolality of the samples just after evacuation, calculated from the molality before evacuation and adding the corresponding values of Dm in table 6.cMolality of the sample at the end of equilibration.dEquilibrium molality, which is equal to the average values of the end molalities mend of 1# and 2#.eDme;end ¼ mend � me.fNaCl solution, the same for the following experiments.gAverage of samples 3# and 4#, the same for the following experiments.hNaOH solution, the same for the following experiments.iThere is somewhat great error with these data.
1952
J.Zhouet
al./J.Chem
.Therm
odynamics
35(2003)1939–1963

TABLE 5
Equilibration experiments at T ¼ 313:2 K
Experiment minitiala mðevac:ÞðendÞ
b mendc me
d Dme;ende Conditions
(mol � kg�1) (mol �kg�1) (mol � kg�1) (mol �kg�1) (mol �kg�1)
9 1#f 0.110615� 0.000036 0.111729 0.104254� 0.000079 0.103982� 0.000282 0.000272 1. Evacuation: adding
powder, tiny bubbles, 30 min
2#f 0.091274� 0.000031 0.092388 0.103710� 0.000072 0.103982� 0.000282 )0.000272 2. Vacuum in the outer
chamber: )53 kPa.
3#f 0.110615� 0.000036 0.111729 0.104981� 0.000050 0.103982� 0.000282 0.000999 3. Equilibration time:
(65� 5) h.
4#f 0.091274� 0.000031 0.092388 0.102654� 0.000048 0.103982� 0.000282 )0.001328
(3#, 4#)g 0.100944� 0.000034 0.102058 0.103818� 0.000049 0.103982� 0.000282 )0.000164
Large cuph 0.103068� 0.000158 0.104182 0.10416� 0.00016 0.10416� 0.00016
10 1# 3.42464� 0.00100 3.42681 3.06080� 0.000199 3.06029� 0.00205 0.00051 1. Evacuation: adding
powder, tiny bubbles, 30 min
2# 2.63744� 0.0085 2.63961 3.05978� 0.000199 3.06029� 0.00205 )0.00051 2. No Vacuum in the outer
chamber.
3# 3.42464� 0.00100 3.42681 3.08978� 0.000123 3.06029� 0.00205 0.02949 3. Equilibration time:
(5.0� 1) h.
4# 2.63744� 0.00085 2.63961 3.01151� 0.000123 3.06029� 0.00205 )0.04878
(3#, 4#) 3.03104� 0.0092 3.03321 3.05064� 0.000123 3.06029� 0.00205 )0.00965
Large cup 2.9696� 0.0034 2.9718 2.9704� 0.0034 2.9704� 0.0034
a Initial molality of the sample.bMolality of the samples just after evacuation, calculated from the molality before evacuation and adding the corresponding values of Dm in table 6.cMolality of the sample at the end of equilibration.dAverage values of the end molalities, mend, of 1
# and 2#.eDme;end ¼ mend � me.fNaCl solution, the same for the following experiments.gAverage of samples 3# and 4#, the same for the following experiments.hNaOH solution, the same for the following experiments.
J.Zhouet
al./J.Chem
.Therm
odynamics
35(2003)1939–1963
1953

TABLE 6
Change in the samples at each experiment
Experiment maver:a/(mol �kg�1) MTðinitialÞ
b/g MTðendÞc/g 100 � DMTf
d Dme Condition of evacuation
1 0.2003 73.983� 0.014 73.177� 0.014 )1.089� 0.027 0.0022 No powder, tiny bubbles, 40 min
2 0.2003 74.549� 0.014 70.786� 0.014 )5.048� 0.027 0.0102 No powder, small bubbles, 30 min
3 0.23798 65.341� 0.014 60.873� 0.014 )6.838� 0.031 0.01050
4 0.047112 104.211� 0.014 102.864� 0.014 )1.293� 0.019 0.000611 Adding powder, tiny bubbles, 30 min
5 0.100567 104.923� 0.014 103.973� 0.014 )0.905� 0.019 0.000916
6 0.100567 101.807� 0.014 101.231� 0.014 )0.672� 0.020 0.000680
7 0.96360 107.341� 0.014 107.161� 0.014 )0.168� 0.019 0.00171
8 3.0188 117.696� 0.014 117.621� 0.014 )0.064� 0.017 0.0023
9 0.101369 104.426� 0.014 103.286� 0.014 )1.092� 0.019 0.011140
10 3.0188 116.676� 0.014 116.605� 0.014 )0.061� 0.017 0.0022
aAverage of the initial molalities of the five samples.b Initial total mass of the five samples.cEnd total mass of the five samples.dRelative change of the total mass as a fraction of a initial total mass, DMTf ¼ ðMTðendÞ �MTðinitialÞÞ=MTðinitialÞ.eMolality increasing after evacuation, calculated according to DMTf with the assumption that the solution is NaCl solution of molality equal to maver:.
1954
J.Zhouet
al./J.Chem
.Therm
odynamics
35(2003)1939–1963

TABLE 7
Changes in the molality of the individual samples during evacuation
Experiment 1 minitiala/(mol � kg�1) mend
b/(mol �kg�1) Dmc/(mol � kg�1) 100 � Dmfd 100 � DMf
e
Small cup+NaCl solution 1# 0.172451� 0.000036 0.174131� 0.000053 0.001680� 0.000064 0.974� 0.037 )0.955� 0.022
3# 0.172451� 0.000036 0.174530� 0.000063 0.002079� 0.000073 1.206� 0.042 )1.179� 0.030
2# 0.231710� 0.000043 0.233777� 0.000113 0.002067� 0.000121 0.892� 0.052 )0.872� 0.045
4# 0.231710� 0.000043 0.233874� 0.000108 0.002164� 0.000116 0.934� 0.050 )0.913� 0.042
Large cup+ sodium aluminate solution 0.1930 0.1952 0.0022 1.12 )1.092� 0.030
a Initial molality of the solution.bMolality of the solution at the end of the evacuation.cDm ¼ mend � minitial.dDmf ¼ Dm=minitial.e Increasing relative mass of the solution, DMf ¼ ðMend �MinitialÞ=Minitial, where Minitial is the initial mass of the solution, and Mend is the mass of the solution
at the end of the evacuation.
J.Zhouet
al./J.Chem
.Therm
odynamics
35(2003)1939–1963
1955
1956 J. Zhou et al. / J. Chem. Thermodynamics 35 (2003) 1939–1963
the average molality, maver. However, the molality increase after evacuation has
some inherent uncertainty, experiments (5 and 6) in table 6. Experiment 1 in
table 7 suggests that the container and the solution itself maybe have some in-
fluence on the molality increase. Even for the same kind of solution in the same
kind of container (1# and 3# of experiment 1 in table 7), the difference betweenthe molalities at the end of the evacuation relative to the initial molality is
(0.174530) 0.174131)/0.172451¼ 0.00231� 0.00047 when the water loss of
the sample is only about 1 per cent. This indicates that for a given apparatus
it would be difficult to assure a positive equilibrium limit molality difference af-
ter the evacuation process, if the initial equilibrium limit molality difference is
not great enough, or the water loss of the sample in the evacuation is rather
great. The equilibrium limit molality difference is defined as (Dmeðl;hÞ ¼meh � mel), where meh is the molality of the sample of initial higher molalityand mel is the molality of the sample of initial lower molality and the subscript
‘‘e’’ is used to indicate that the molality is used to calculate the ‘‘equilibrium
limit molality difference’’. The initial equilibrium limit molality difference is de-
fined as Dmeðl;hÞðinitialÞ ¼ mehðinitialÞ � melðinitialÞ. However, in our experiments the
relative initial equilibrium limit molality difference, Dmeðl;hÞðinitialÞ=mðaver:ÞðinitialÞ,
is about 25 per cent, and the water loss in the evacuation is less than 1 per cent,
thus it is easy to maintain Dmeðl;hÞðinitialÞ positive and to keep the molality of the
test solution between mehðinitialÞ and melðinitialÞ. Moreover, a small relative waterloss ensures little change in the molalities of the solutions during the removal
of air from the chamber. These features can improve the reliability and stability
of the experimental process. (c) On the other side, the absolute water loss is
large owing to the large quantity of the sample used. For example, though
the relative change of the total mass as a fraction of the initial total mass of
experiment 10 in table 6, DMTf , is only about 0.06 per cent, the absolute change
of the total mass of the solution DMT is )0.072 g which is equivalent to a vol-
ume of 3.140 � 10�3 m3 of saturated water vapor for 0.1 mol � kg�1 NaCl solu-tion at T ¼ 298:15 K, which is about 10 times the volume of gas phase in
the inner chamber. Therefore it is beneficial to exclude air from inner chamber
effectively, and to speed up the rate of equilibration.
2. The consistency among the small cups in equilibrium. On the basis of experiments
(2 to 4) (tables 2 and 3), we can derive the results in table 8, which illustrate the
consistency among the small cups in equilibrium.
(a) In the light of table 8, it is easy to see that, when Dmeðl;hÞ=2 becomes smaller
than the standard deviation (r) adopted as the criterion for equilibrium, thelimit molality difference of the samples, Dml;h=2, which is equal to mh � ml,
i.e., the highest molality minus the lowest molality of the samples is usually
in the range of the standard deviation (r) of the datum. These results show that
there should be a consistent temperature among the samples in equilibrium,
which can ensure for the experiment on the samples of about 0.047 mol � kg�1
a precision of less than� 0.1 per cent when the temperature in the thermostat is
controlled to �0.5 K. Thus, we believe that the temperature fluctuation of
�0.01 K in the thermostat would not have much influence on the precision

TABLE 8
Consistency among the small cups in equilibrium
Experiment maver:a/(mol �kg�1) ðDme;ðl;hÞ=2Þb/(mol �kg�1) (Dmeðl;hÞ=2)
c/(mol � kg�1)
2 1#, 2# 0.203088� 0.000091 0.000190
3#, 4# 0.202988� 0.000077 )0.000105(1#, 3#), (2#, 4#)d 0.203038� 0.000084 0.000042
1#, 3# 0.202995� 0.000070 0.000098
2#, 4# 0.203080� 0.000096 0.000198
(1#, 2#), (3#, 4#)d 0.203038� 0.000084 0.000050
3 1#, 2# 0.263211� 0.000214 )0.0001293#, 4# 0.263366� 0.000173 0.000130
(1#, 3#), (2#, 4#)d 0.263288� 0.000195 0.000000
1#, 3# 0.263288� 0.000201 0.000207
2#, 4# 0.263288� 0.000188 0.000057
(1#, 2#), (3#, 4#)c 0.263288� 0.000195 0.000078
4 1#, 2# 0.046500� 0.000046 )0.0000113#, 4# 0.046466� 0.000047 0.000035
(1#, 3#), (2#, 4#)d 0.046483� 0.000046 0.000012
1#, 3# 0.046495� 0.000048 0.000006
2#, 4# 0.046471� 0.000044 0.000040
(1#, 2#), (3#, 4#)d 0.046483� 0.000047 0.000017
aAverage molality of the both samples or both group samples.bEquilibrium limit molality difference of the samples, Dmeðl;hÞ, equals to the molality of the sample of the
initial higher molality minus the molality of the sample of the initial lower molality, meh � mel.cDml;h is the limit molality difference of the samples equal to mh � ml, i.e. the highest molality minus the
lowest molality of the samples.d (1#, 3#) and (2#, 4#) are the average molalities of samples (1#, 3#), and samples (2#, 4#) respectively.
J. Zhou et al. / J. Chem. Thermodynamics 35 (2003) 1939–1963 1957
of the equilibrium molality of the samples of about 1:0 � 10�3 mol � kg�1 in the
new apparatus. (b) From a rigorous point of view, the study of consistency
among the samples requires the consideration of the sample in the big cup.
However, our experiment showed that NaCl solutions corroded the pure cop-per and tin bronze alloy. To avoid the corrosion of the big cup by NaCl solu-
tions, we have not attempted to carry out such consistency experiments. In
fact, for our apparatus, the state of the gas phase is chiefly determined by
the test solution. Therefore, the equilibration between the gas phase and the
reference standard solution is almost as rapid as that between the reference
standard solution and the test solution. In addition, the whole heat conduction
process is mainly composed of many individual processes between the reference
standard solutions and the test solution. Therefore each solution in a small cupequilibrates directly with the solution in the big cup. It can be deduced that
consistency among the small cups will imply consistency between the small
cups and the big cup to some extent. Furthermore, the good accuracy in the
determined NaOH solution osmotic coefficients, confirms also the consistency
in another aspect.
3. The equilibration process.
(a) From tables 4 and 5, it is easy to see that the molality of the NaOH solution
in the big cup did not change during equilibration. This indicates that the

1958 J. Zhou et al. / J. Chem. Thermodynamics 35 (2003) 1939–1963
whole equilibration process is essentially determined by changes in the NaCl
solutions in the small cups. (b) Experiments (6 to 8) and experiment 10 in tables
4 and 5 show that samples 1# and 2# equilibrated well with each other, even
when samples (3# and 4#) were far from equilibrium, which indicated a signif-
icant temperature difference between samples (3# and 4#). This shows that ourapparatus can effectively prevent the equilibrium molalities from the influence
of the temperature difference existing inside and that the end point of the equil-
ibration can be determined by any couple of reference standard solutions of
high and low initial molalities. (c) The experimental results show that only (5
to 12) h are required to establish the experimental temperature inside the appa-
ratus, for example, the experiments (8 and 10) in tables 4 and 5. In addition,
they also show that the equilibration process is fast in the experiments with
our apparatus. It is practical to perform experiments on solutions below 0.1mol � kg�1, such as experiment 4 in table 3.
4. The determination of the osmotic coefficients of NaOH solutions. On the basis of
experiments (5 to 10) {tables (4 and 5)}, we can calculate the osmotic coefficients
of NaOH solutions and compare them with corresponding literature values as il-
lustrated in tables 9 and 10.
(a) The determined osmotic coefficients of NaOH solutions agree with the lit-
erature values. Even the determined values in experiments (5 and 9), which
have not approached equilibrium well, are still consistent with the correspond-ing literature values. If we compare me(NaCl) with the average end molality of
samples (3# and 4#), which are farther from equilibrium than samples (1# and
2#), in experiments (5 and 9) in tables 4 and 5, we can deduce that the ‘‘true
equilibrium molality’’ of the NaCl solution would be smaller than the experi-
mental value of me(NaCl) in experiment 5 and larger than that of me(NaCl)
in experiment 9, thus the calculated U(NaOH) will agree better with the liter-
ature values. The new apparatus yields accurate results even for unstable solu-
tions such as NaOH solutions whose results are usually less reliable due tocarbon dioxide contamination and other factors. (b) The fact, that accurate re-
sults can be obtained from the mean value of samples 1# and 2# even when
samples 3# and 4# are far from equilibrium, shows that the end point of the
equilibration can be effectively determined according to the equilibrium limit
molality difference of the reference standard solutions in the small cups (here
is Dmeðl;hÞ for samples 1# and 2#). (c) The accurate results obtained imply also
that the samples in our apparatus can reach the experimental temperature, i.e.
the average temperature in the thermostat in less than 0.5 d.Overall the experimental results show that our apparatus has the following fea-
tures:
1. The inside of the apparatus reaches a uniform experimental temperature,
namely the average thermostat temperature within less than 0.5 d and maintains a
consistent equilibrium temperature among the samples, which can meet the require-
ment of the experiments on samples of molalities less than 0.5 mol �kg�1.
The Rotation of the apparatus prevents the influence of the temperature variation
in the thermostat. The relative poor thermal conductivity of the adjustable vaccum in

TABLE 9
Osmotic coefficients of NaOH solution at T ¼ 298:2 K
Experiment 5 6 7 8
NaCl
me/(mol �kg�1)a 0.10066� 0.00084 0.099882� 0.000083 0.97244� 0.00088 3.0943� 0.0024
U Archer [20]b 0.93211� 0.00013 0.93223� 0.00002 0.93607� 0.00004 1.05493� 0.00016
U � mec 0.093824� 0.000773 0.093113� 0.000075 0.91027� 0.00087 3.2643� 0.0030
NaOH
me/(mol �kg�1)d 0.099961� 0.000126 0.099739� 0.000125 0.96123� 0.00110 2.9698� 0.0034
U This worke 0.93861� 0.00782 0.93356� 0.00139 0.94698� 0.00141 1.09916� 0.00162
U Hamer and Wu [26] 0.93138 0.93142 0.95210 1.10214
U Pitzer [27,28] 0.93238 0.93242 0.94499 1.09942
U Pabalan and Pitzer [29,30] 0.93238 0.93413 0.94470 1.09677
U Simonson et al., [22] 0.93460 0.93460 0.94711 1.09244
U Holmes and Mesmer [16] 0.93422 0.93426 0.94622 1.09248
aExperimental molality of NaCl solution.bCalculated osmotic coefficient of NaCl solution according to the reference equation corresponding to the experimental molality of NaCl solution.cDeviation calculated from the greatest and least values of UðNaClÞ � meðNaClÞ corresponding to the value of me(NaCl).dExperimental molality of NaOH solution.eDetermined osmotic coefficient of NaOH solution with NaCl solution as the reference standard solution.fCalculated osmotic coefficient of NaOH solution according the reference equation corresponding to the experimental molality of NaOH solution.
J.Zhouet
al./J.Chem
.Therm
odynamics
35(2003)1939–1963
1959

TABLE 10
Osmotic coefficients of NaOH solution at T ¼ 313:2 K
Experiment 9 10
NaCl
me/(mol �kg�1)a 0.10398� 0.00028 3.0603� 0.0020
U Clarke and Glew [31]b 0.93119� 0.00002 1.06198� 0.00014
U � mec 0.096827� 0.000261 3.2500� 0.0026
NaOH
me/(mol �kg�1H2O)d 0.10416� 0.00016 2.9704� 0.0034
U This worke 0.92960� 0.00288 1.09412� 0.00153
U Pabalan and Pitzer [29,30] 0.93156 1.09905
U Holmes and Mesmer [16] 0.93262 1.08994
aExperimental molality of NaCl solution.bCalculated osmotic coefficient of NaCl solution according to the tabulated values of Clarke and Glew
(1985) [31].cDeviation calculated from the greatest and least values of UðNaClÞ � meðNaClÞ corresponding to the
value of meðNaClÞ.dExperimental molality of NaOH solution.eDetermined osmotic coefficient of NaOH solution with NaCl solution as the reference standard so-
lution.fCalculated osmotic coefficient of NaOH solution according the reference equation corresponding to
the experimental molality of NaOH solution.
1960 J. Zhou et al. / J. Chem. Thermodynamics 35 (2003) 1939–1963
the outer chamber and the good thermal conductivity of the copper block wall of the
inner chamber isolate the inner chamber from the temperature fluctuation in the out-
er chamber without reducing greatly the rate of heat exchange with the outside. Fur-
thermore, the effect of the convective heat transfer caused by the off-centered fanstirring the gas phase and the sheaths stirring the solution during the rotation is more
important than that of heat conduction. Therefore, a highly uniform temperature
soon establishes itself inside the inner chamber. In fact, owing to the rotation, the
four small cups, which are equidistant from the center of the fixing plate, are on av-
erage in equilibrium with the test solution. In addition, the approximately equal
heights of the reference standard solutions and the test solution prevent the possible
temperature gradient between the solutions in the vertical direction. In conclusion,
the equilibrium temperature of each reference standard solution will be equal to eachother and equal to the average temperature of the test solution.
2. Reliability, stability, and applicability of the experimental process.
The cover increases the reliability of the experimental process. The relatively small
volume of the gas phase will hinder the possible splatter of the solution arising with
rapid warming when the apparatus is put into the thermostat. Similarly, in the re-
verse process, it will also reduce the condensation of the vapour into the solution.
The results show that in our experiments it is easy to maintain the equilibrium limit
molality difference (meh � mel) positive and to maintain the molality of the test solu-tion between meh and mel. The water loss in the evacuation is basically less than 1 per
cent owing to the large sample used, thus, the molality of the test solution changes
very little after evacuation. Generally speaking, the reference standard solutions are

J. Zhou et al. / J. Chem. Thermodynamics 35 (2003) 1939–1963 1961
usually stable; therefore, the small quantity used in experiments will not lead to ob-
vious experimental errors. Though the properties of the test solutions differ in many
ways, the use of large samples can decrease and the oxidation or carbonation of sam-
ples by the air desorbed from the inside surface of the apparatus and the surface ten-
sion effect of solutions. Furthermore, the equilibration process is determined mainlyby the reference standard solutions present in small quantity because of the great dis-
parity in quantity between the reference standard solution in the small cup and the
test solution in the big cup, and the state of the test solution is almost unchanged.
The apparatus is highly accurate for performing experiments on viscous and complex
solutions. The Experimental results of the equilibration process and the accurate os-
motic coefficients for NaOH solutions obtained confirm the above views.
3. A fairly fast equilibration, and the experimental results show that the apparatus
is practical for samples of molality less than 0.05 mol � kg�1.The large amount of water vapour generated in the big cup during the evacuation
can adequately sweep out the air inside the apparatus. The off-centered fan can stir
well the gas phase, thus the heat and mass transfer in the gas phase will be speeded
up considerably. The close fit between the cup and the thin heat transfer block (i.e.
the sheath) ensures a good heat conduction between the samples. The internal equil-
ibration of the test solution is also rapid due to the stirring effect of the sheaths. The
small quantity of the reference standard solution helps to shorten the equilibration
time.4. It is easy and effective to decide the end point of equilibration.
Equilibration exists strictly between any two samples simultaneously. For most
instruments, it is hard to determine whether the whole system has reached the equi-
librium state due to complicated factors affecting the equilibration, even when two
samples of high and low initial concentrations have equilibrated with each other.
However, for the apparatus described here, as pointed out above, each solution in
the small cup actually equilibrates directly with the solution in the big cup. There-
fore, when two reference standard solutions of one initially high and another initiallylow molalities have equilibrated with each other, each of them will have also equil-
ibrated with the test solution. The accurate results of the obtained osmotic coeffi-
cients for NaOH solutions confirm this feature.
The experimental results illustrate that our apparatus can overcome the short-
comings associated with traditional isopiestic instruments. Moreover, it allows an
easy and effective determination of the end point of equilibration. This apparatus
has been used to determine osmotic coefficients of sodium aluminates solutions [32].
4. Conclusion
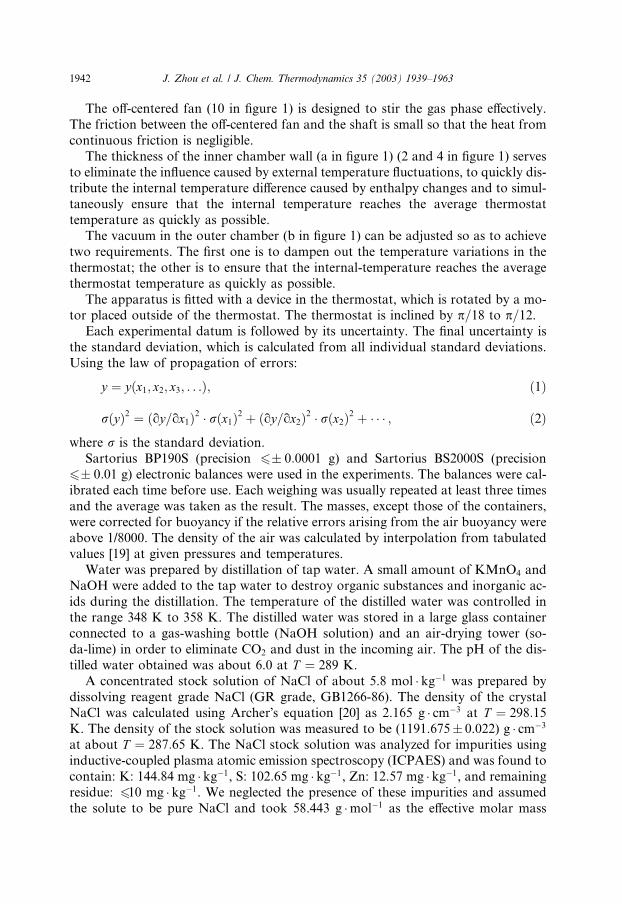
Further improvements can be made to the apparatus. It will be advantageous to
improve the temperature control and to replace the fixing plate by the type described
in figure 2.
During the long period of trial experiments, we found that the silver small cups
underwent a slight decrease in weight with time (0.1 mg �month�1 to 0.3

FIGURE 2. A new type of fixing plate with stands: 1, small cup; 2, sheath; 3, big cup; 4, fixing plate with
stands; 5, stand of the fixing plate.
1962 J. Zhou et al. / J. Chem. Thermodynamics 35 (2003) 1939–1963
mg �month�1), probably due to abrasion as the small cup is repeatedly removed and
returned to the sheaths, rotation in the sheaths during equilibration, or corrosion.
Other materials of higher hardness and higher resistance to corrosion to construct
the small cups, such as tantalum on titanium should be considered.
Acknowledgements
We would like to express our great thanks to Dr. A. Fenghour and the anony-
mous referees for their thorough reviews and useful comments. Their suggestionshave given us a great help in preparing the final version. We would also like to ex-
press our sincere thanks to Xia Zhou and Jinju Chen for their help in the preparation
of the manuscript. This research is supported by the National Priority Development
Project Fundamental Research (Project number: G1999064902).
References
[1] R.F. Platford, in: Ricardo M. Pytkowicz (Ed.), Activity Coefficients in Electrolyte Solutions, first ed.,
CRC Press, Boca Raton, FL, 1979, pp. 65–79.
[2] J.A. Rard, R.F. Platford, in: K.S. Pitzer (Ed.), Activity Coefficients in Electrolyte Solutions, second
ed., CRC Press, Boca Raton, FL, 1991, pp. 209–277.
[3] D.A. Sinclair, J. Phys. Chem. 37 (1933) 495–504.
[4] R.A. Robinson, D.A. Sinclair, J. Am. Chem. Soc. 56 (1934) 1830–1835.
[5] G. Scatchard, W.J. Hamer, S.E. Wood, J. Am. Chem. Soc. 60 (1938) 3061–3070.
[6] A.R. Gordon, J. Am. Chem. Soc. 65 (1943) 221–224.
[7] H.D. Ellerton, G. Reinfelds, D.E. Mulcahy, P.J. Dunlop, J. Phys. Chem. 68 (1964) 398–402.
[8] J.A. Rard, J. Sol. Chem. 14 (1985) 457–471.
[9] J.A. Rard, J. Chem. Thermodyn. 29 (1997) 533–555.
[10] J.P. Mitchell, J.B. Butler, J.G. Albright, J. Sol. Chem. 21 (1992) 1115–1129.
[11] H. Park, P. Englezos, Fluid Phase Equilibria 153 (1998) 87–104.
[12] M.T. Zafarani-Moattar, K. Nasirzade, J. Chem. Eng. Data 43 (1998) 215–219.
[13] D.-Q. Lin, Y.-T. Wu, Z.-Q. Zhu, L.-H. Mei, S.-J. Yan, Fluid Phase Equilibria 162 (1999) 159–170.
[14] J.A. Rard, J. Sol. Chem. 19 (1990) 525–541.
[15] G. Miller, A.S. Porter, Trans. Faraday Soc. 63 (1967) 335–340.
[16] H.F. Holmes, R.E. Mesmer, J. Chem. Thermodyn. 30 (1998) 311–326.
[17] I.R. Lantzke, A.K. Covington, R.A. Robinson, J. Chem. Eng. Data 18 (1973) 421–422.
[18] R.A. Robinson, C.K. Lim, K.P. Ang, J. Am. Chem. Soc. 75 (1953) 5130–5131.
[19] Analysis Chemistry Editor Group in Hangzhou University. Handbook of Analysis Chemistry, second
ed., vol. 1, Chemical Industry Press, 1997 (in Chinese).

J. Zhou et al. / J. Chem. Thermodynamics 35 (2003) 1939–1963 1963
[20] D.G. Archer, J. Phys. Chem. Ref. Data 219 (1992) 793–829.
[21] J.A. Rard, D.G. Archer, J. Chem. Eng. Data 40 (1995) 170–185.
[22] J.M. Simonson, R.E. Mesmer, P.S.Z. Rogers, J. Chem. Thermodyn. 21 (1989) 561–584.
[23] R.H. Stokes, J. Am. Chem. Soc. 67 (1945) 1689–1691.
[24] Quality Monitoring Center for Chemical Reagent of Chinese Chemical Industry Department,
Encyclopedia of the Chemical Reagent Standard, Chemical Industry Press, 1996 (in Chinese).
[25] J.A. Dean, Lange�s Handbook of Chemistry, thirteen ed., Mc Graw-Hill Book Company, 1985.
[26] W.J. Hamer, Y.-C. Wu, J. Phys. Chem. Ref. Data 1 (1972) 1047–1099.
[27] K.S. Pitzer, G. Mayorga, J. Phys. Chem. 77 (1973) 2300–2308;
J. Phys. Chem 78 (1974) 2698.
[28] K.S. Pitzer, in: K.S. Pitzer (Ed.), Activity Coefficients in Electrolyte Solutions, second ed., CRC Press,
Boca Raton, FL, 1991, pp. 75–153, pp. 100.
[29] R.T. Pabalan, K.S. Pitzer, Geochim. Cosmochim. Acta 51 (1987) 829–837.
[30] R.T. Pabalan, K.S. Pitzer, in: K.S. Pitzer (Ed.), Activity Coefficients in Electrolyte Solutions, second
ed., CRC Press, Boca Raton, FL, 1991, pp. 435–490, pp. 484.
[31] E.C.W. Clarke, D.N. Glew, J. Phys. Chem. Ref. Data 14 (1985) 489–610.
[32] J. Zhou, Q.Y. Chen, J. Li, Z.L. Yin, X. Zhou, P.M. Zhang, Isopiestic measurement of the osmotic
and activity coefficients for the NaOH–NaAl(OH)4-H2O system at 313.2 K, Geochim. Cosmochim.
Acta. 67 (2003) 3459–3472.
WA 02/015