
A new hybrid MCDM model combining DANP with VIKOR to ... · A new hybrid MCDM model combining DANP...
14
A new hybrid MCDM model combining DANP with VIKOR to improve e-store business Wan-Yu Chiu a , Gwo-Hshiung Tzeng b,c,⇑ , Han-Lin Li a a Institute of Information Management, National Chiao Tung University, 1001 University Road, Hsinchu 30010, Taiwan b Institute of Management of Technology, National Chiao Tung University, 1001 University Road, Hsinchu 30010, Taiwan c Institute of Project Management, Kainan University, No. 1 Kainan Road, Luchu, Taoyuan 338, Taiwan article info Article history: Received 14 November 2011 Received in revised form 30 June 2012 Accepted 30 June 2012 Available online 11 July 2012 Keywords: e-Store business Internet stores Customers’ needs Marketing strategies Multiple Criteria Decision-Making (MCDM) DEMATEL Analytic Network Process (ANP) DEMATEL-based ANP (DANP) VIKOR abstract Many consumers today buy products and services from e-stores. Because e-store managers are respon- sible for allocating different resources, it is essential that they understand consumers’ shopping behav- iour to provide the best possible value for visitors to their websites. Therefore, the purpose of this article is to focus on assessing and improving strategies to reduce the gaps in customer satisfaction caused by interdependence and feedback problems among dimensions and criteria to achieve the aspira- tion level. We propose a new hybrid Multiple Attribute Decision Making (MADM) model, combining the Decision Making Trial and Evaluation Laboratory (DEMATEL), DEMATEL-based Analytic Network Process (DANP), and VIšekriterijumsko KOmpromisno Rangiranje (VIKOR) methods to solve these problems. Then, three real cases are used to illustrate how the proposed new hybrid Multiple Criteria Decision-Mak- ing (MCDM) model improves e-store business. These results can provide e-store managers with a knowl- edge-based understanding of how to create marketing strategies that reduce the performance gaps of dimensions and criteria to satisfy consumers’ needs and encourage customers to purchase more. Crown Copyright Ó 2012 Published by Elsevier B.V. All rights reserved. 1. Introduction It has become increasingly common for consumers to buy prod- ucts and services from e-stores because these types of stores pro- vide them with a convenient and fast shopping environment and high-quality products and services, saving them time and money. E-stores have become an important retailing channel, and many such stores have been established and are experiencing a continu- ous increase in sales. Therefore, this article focuses on the assess- ment, improvement, and setting of strategies to better meet customer needs. These needs are met by reducing performance gaps introduced by interdependence and feedback problems among dimensions and criteria, allowing the aspiration level to be achieved and promoting customer satisfaction to bring people real happiness. It is essential for e-store managers to know how to manage business and marketing strategies because the success of the store depends on excellent management and accurate mar- keting strategies. Electronic commerce (EC) is defined as the process of buying, selling, or exchanging products, services, advertisements, and information via electronic communication technologies (the Inter- net and www, PDAs (Personal Digital Assistants), smartphones, and tablet computers). Those technologies facilitate the manufac- turing of products and the provision of services to satisfy the wants and needs of consumers [4,51,66]. EC includes e-stores, and be- cause shopping is a complex behaviour composed of rational choices, amusement, and social communication [87,90], under- standing consumers’ wants and needs is critical for the stores’ suc- cessful management and development [27,90]. This understanding particularly applies to e-stores, in which consumers’ shopping behaviour may be different from that in traditional brick-and-mor- tar stores [71,91]. Therefore, e-store management issues are a hot topic because such stores seek to extend their consideration sets and improve consumers’ welfare, and the quality and quantity of individually customised interfaces can facilitate a better, more effi- cient purchase decision-making process [62,88]. Previous EC researchers have focused on the consumers’ moti- vations [30,71], the shopping behaviour [39,81], the intelligent agents [43,86], the satisfaction-loyalty relationship [5,15,63], and the risk [10]. This research has focused on how to manage e-stores and create marketing strategies. Previous relation methods have focused on influence [38], assessment [13], ranking [37,92], 0950-7051/$ - see front matter Crown Copyright Ó 2012 Published by Elsevier B.V. All rights reserved. http://dx.doi.org/10.1016/j.knosys.2012.06.017 ⇑ Corresponding author at: Institute of Management of Technology, National Chiao Tung University, 1001 University Road, Hsinchu 30010, Taiwan. E-mail addresses: [email protected] (W.-Y. Chiu), [email protected]. edu.tw, [email protected] (G.-H. Tzeng). Knowledge-Based Systems 37 (2013) 48–61 Contents lists available at SciVerse ScienceDirect Knowledge-Based Systems journal homepage: www.elsevier.com/locate/knosys
Transcript of A new hybrid MCDM model combining DANP with VIKOR to ... · A new hybrid MCDM model combining DANP...

Knowledge-Based Systems 37 (2013) 48–61
Contents lists available at SciVerse ScienceDirect
Knowledge-Based Systems
journal homepage: www.elsevier .com/locate /knosys
A new hybrid MCDM model combining DANP with VIKOR to improvee-store business
Wan-Yu Chiu a, Gwo-Hshiung Tzeng b,c,⇑, Han-Lin Li a
a Institute of Information Management, National Chiao Tung University, 1001 University Road, Hsinchu 30010, Taiwanb Institute of Management of Technology, National Chiao Tung University, 1001 University Road, Hsinchu 30010, Taiwanc Institute of Project Management, Kainan University, No. 1 Kainan Road, Luchu, Taoyuan 338, Taiwan
a r t i c l e i n f o a b s t r a c t
Article history:Received 14 November 2011Received in revised form 30 June 2012Accepted 30 June 2012Available online 11 July 2012
Keywords:e-Store businessInternet storesCustomers’ needsMarketing strategiesMultiple Criteria Decision-Making (MCDM)DEMATELAnalytic Network Process (ANP)DEMATEL-based ANP (DANP)VIKOR
0950-7051/$ - see front matter Crown Copyright � 2http://dx.doi.org/10.1016/j.knosys.2012.06.017
⇑ Corresponding author at: Institute of ManagemChiao Tung University, 1001 University Road, Hsinch
E-mail addresses: [email protected] (Wedu.tw, [email protected] (G.-H. Tzeng).
Many consumers today buy products and services from e-stores. Because e-store managers are respon-sible for allocating different resources, it is essential that they understand consumers’ shopping behav-iour to provide the best possible value for visitors to their websites. Therefore, the purpose of thisarticle is to focus on assessing and improving strategies to reduce the gaps in customer satisfactioncaused by interdependence and feedback problems among dimensions and criteria to achieve the aspira-tion level. We propose a new hybrid Multiple Attribute Decision Making (MADM) model, combining theDecision Making Trial and Evaluation Laboratory (DEMATEL), DEMATEL-based Analytic Network Process(DANP), and VIšekriterijumsko KOmpromisno Rangiranje (VIKOR) methods to solve these problems.Then, three real cases are used to illustrate how the proposed new hybrid Multiple Criteria Decision-Mak-ing (MCDM) model improves e-store business. These results can provide e-store managers with a knowl-edge-based understanding of how to create marketing strategies that reduce the performance gaps ofdimensions and criteria to satisfy consumers’ needs and encourage customers to purchase more.
Crown Copyright � 2012 Published by Elsevier B.V. All rights reserved.
1. Introduction
It has become increasingly common for consumers to buy prod-ucts and services from e-stores because these types of stores pro-vide them with a convenient and fast shopping environment andhigh-quality products and services, saving them time and money.E-stores have become an important retailing channel, and manysuch stores have been established and are experiencing a continu-ous increase in sales. Therefore, this article focuses on the assess-ment, improvement, and setting of strategies to better meetcustomer needs. These needs are met by reducing performancegaps introduced by interdependence and feedback problemsamong dimensions and criteria, allowing the aspiration level tobe achieved and promoting customer satisfaction to bring peoplereal happiness. It is essential for e-store managers to know howto manage business and marketing strategies because the successof the store depends on excellent management and accurate mar-keting strategies.
012 Published by Elsevier B.V. All
ent of Technology, Nationalu 30010, Taiwan..-Y. Chiu), [email protected].
Electronic commerce (EC) is defined as the process of buying,selling, or exchanging products, services, advertisements, andinformation via electronic communication technologies (the Inter-net and www, PDAs (Personal Digital Assistants), smartphones,and tablet computers). Those technologies facilitate the manufac-turing of products and the provision of services to satisfy the wantsand needs of consumers [4,51,66]. EC includes e-stores, and be-cause shopping is a complex behaviour composed of rationalchoices, amusement, and social communication [87,90], under-standing consumers’ wants and needs is critical for the stores’ suc-cessful management and development [27,90]. This understandingparticularly applies to e-stores, in which consumers’ shoppingbehaviour may be different from that in traditional brick-and-mor-tar stores [71,91]. Therefore, e-store management issues are a hottopic because such stores seek to extend their consideration setsand improve consumers’ welfare, and the quality and quantity ofindividually customised interfaces can facilitate a better, more effi-cient purchase decision-making process [62,88].
Previous EC researchers have focused on the consumers’ moti-vations [30,71], the shopping behaviour [39,81], the intelligentagents [43,86], the satisfaction-loyalty relationship [5,15,63], andthe risk [10]. This research has focused on how to manage e-storesand create marketing strategies. Previous relation methods havefocused on influence [38], assessment [13], ranking [37,92],
rights reserved.
W.-Y. Chiu et al. / Knowledge-Based Systems 37 (2013) 48–61 49
selection [18,36,47,49,60,72], and improvement [14,21,46,48,50,51,59,83,85]. Thus, this study seeks a new hybrid Multiple Attri-bute Decision Making (MADM) model combining the DecisionMaking Trial and Evaluation Laboratory (DEMATEL) technique tobuild an influential relationship among dimensions and criteria,DEMATEL-based ANP (DANP) to find the influential weights, andVIšekriterijumsko KOmpromisno Rangiranje (VIKOR) methods toassess performance, not only in ranking and selection but also inimproving and creating e-store marketing strategies to reduce gapsin each dimension and criterion to promote the e-store environ-ment and satisfy customers’ needs. These processes can not onlyhelp e-store managers to understand customers’ wants and needs,they can also assist them in improving their products and serviceto reduce performance gaps in customer satisfaction by buildingan effective e-store marketing strategy.
An empirical study of three e-stores — Yahoo, PChome, andBooks aims to demonstrate the proposed new hybrid Multiple Cri-teria Decision-Making (MCDM) model for ranking and improve-ment. Because this study focuses on the effects of certaininfluential relationships among dimension and criteria in an e-store business and the creation of marketing strategies for the e-store manager, this study surveyed three e-stores to determinethe best strategies for improving an e-store. From the survey re-sults, we found that prioritising the customers’ needs and givingthem perfect post-purchase service can affect customers’ purchasedecisions, information searches, and evaluation of alternatives.Therefore, initial marketing strategies can include advertisementsand light products to meet the customers’ needs. Then, the e-storecan create high-quality post-sales service programmes, offer fastdelivery of products, provide complete packaging, communicateafter the purchase, offer guarantees, and implement liberal returnspolicies to improve post-purchase service.
The remainder of this paper is organised as follows: Section 2reviews the consumer decision-making process and evaluationframework, including e-store business criteria and performance.Section 3 provides a brief introduction of the DEMATEL technique,the DANP influential weights and the VIKOR method used to estab-lish a new hybrid MCDM model to resolve problems of interdepen-dence and feedback. An empirical study of Yahoo, PChome, andBooks is presented in Section 4 to demonstrate the proposed modeland, finally, conclusions and remarks are presented in Section 5.
2. Review of consumers’ decision-making process andevaluation framework
An e-store markets and sells products or services offered by acompany [54]. E-stores are becoming critically important to onlineretailers, and they have become important parts of retailer strategy[30]. Therefore, knowing the needs of customers and how to meetthose needs is important. E-stores are a highly visible, well-re-ceived, and popular type of e-commerce [20,26] that sells productsand services online [8,67]. E-stores are part of the e-commerce andretail channel, which includes online retailers, online stores, onlineshops, e-shops, and any virtual shopping websites that sell prod-ucts or services from businesses to customers, such as Amazon[35,75,89]. Amazon.com was established in 1994 during an era ofrapid growth for the Internet, which quickly became a key channelfor the sale of products and services [2,40,77,78]. Consequently, e-store management is a key issue for the development of e-commerce.
The number of e-stores has grown quickly because they areconvenient, eliminate sales pressure, and save time. The online re-tail sales of European e-stores increased 18% from 2009 to 2010 [9].Forrester research forecasts that European online sales will have acompound annual growth rate of 12%, from €96.7 bn (£82.0 bn) in
2011 to €171.9 bn (£145.8 bn) in 2016 [22,32]. The UK Office forNational Statistics reports that e-store sales increased by 13.1% inMarch 2011 [56]. Forrester research forecasts UK online sales willhave compound annual growth rate of 11%, from £30.1 bn in 2011to £51.0 bn in 2016, and the UK’s proportion of online shopperswill increase from 75% of the population in 2011 to 85% in 2016.The proportion of online shoppers in Sweden will increase from72% of the population in 2011 to 86% in 2016 [22,32]. In the US,Forrester research forecasts that online retail sales are expectedto grow from US$176.2 bn in 2010 to US$278.9 bn in 2015, whichis an increase of more than 10% [53]. Forrester research forecastsnote that US online shoppers will have a compound annual growthrate of 15%, from 167 million people in 2012 to 192 million peoplein 2016, and it is predicted that each consumer’s spending willgrow by 44%, from US$1207 in 2012 to US$1738 in 2016. Therefore,the total sale value for e-stores will increase by 45%, fromUS$226 bn in 2012 to US$327 bn in 2016 [52,69]. All available re-ports indicate that sales by e-stores are growing rapidly in allareas.
Customer satisfaction has been considered most important is-sues for marketers and customer researchers [42,55,73]. Compa-nies need to develop strategies that help company developsustainable business practices [41]. E-store should to meet cus-tomers’ needs [65] and increase customer satisfaction by creatingcustomer value in consumer marketing [19,64]. Loyal customersthat indulge in repeat purchases are the bedrock of any business[1]. Customer satisfaction is important mostly because of its indi-rect influence on the profitability of companies [3]; satisfied cus-tomers tend to make not only more purchases but also repeatpurchases [7,74,76], and customer satisfaction has become a keyelement of many companies’ business strategies [24]. Therefore,understanding the criteria that influence customer satisfaction isimportant not only to describe the actual situation but also to planimprovements, and actions [79].
Marketing activities should be designed to increase customersatisfaction [33]. Therefore, in this paper, we combined consumerbehaviour and customer satisfaction to create dimensions and cri-teria that show the influence level, weighting, and performanceamong dimensions and criteria.
This study primarily examines consumers’ criteria for the busi-ness-to-consumer electronic commerce (B2C e-commerce) of e-stores, focusing on consumer satisfaction. E-store buyer behaviourrefers to consumer behaviour, and the steps in the consumers’decision-making process can be found in most textbooks and jour-nals, some of which describe these steps as need recognition, infor-mation search, evaluation, purchase, and after-purchase evaluation[23,28,29,34,61,68,89]. Others propose that the steps are need rec-ognition, information search, evaluation, purchase, and post-pur-chase behaviour [44,82]. In fact, according to e-store customers’behaviour, including blog writing, Facebook reviews, and tendencyto repurchase, the main components of this process can be consid-ered to be need recognition, information search, evaluation, pur-chase, and post-purchase behaviour. Based on these criteria,Bizrate.com and Alexa.com conducted surveys asking respondentsto rate retailers on 14 e-store attributes, namely, product availabil-ity, ease of finding, overall look and design, clarity, number of re-views, brand, relative price, selection, variety of shipping options,shipping charges, charge statement, order tracking, on-time deliv-ery, and expectations met [31]. A detailed description of thesecomponents is provided in Table 1. In summary, the intact criteria,which include five influential dimensions and fourteen criteria,need to be considered (see Table 1).
Having surveyed several Taiwan EC websites, Chang and Chen[12] found that, according to users, Yahoo.com, Yahoo auction,PChome.com, and Books.com were the four top online shoppingsites [12]. Another study [80] found that the most popular website

Table 1Reorganisation of the current research. Source: Engel et al., [95], [68,31].
A. Need recognitionProduct availability (a1) Products you want or need to be available
B. Information searchEase of finding (b1) How easily you were able to find information about the productsOverall look/design (b2) How you feel about the overall look and design of the websiteClarity of product information (b3) How clear and understandable the information about the products is
C. Evaluation of alternativesNumber of Reviews (c1) How many reviews are there of other people’s overall rating and
experience of this purchaseBrand (c2) How much consumers trust the website’s brandPrices relative (c3) How the prices compare to other web-sites
D. Choice/PurchaseSelection (d1) Types of products availableVariety of shipping options (d2) The desired shipping options were availableShipping charges (d3) Cost of shipping/deliveryCharges statement (d4) Total purchase amount (including shipping/handling charges, etc.)
displayed before order submissionE. Post-purchase behaviour
Order tracking (e1) Ability to track orders until deliveredOn-time delivery (e2) Products were in stock at time of expected deliveryProduct expectations met (e3) Correct products were delivered and everything
worked as described/depicted
50 W.-Y. Chiu et al. / Knowledge-Based Systems 37 (2013) 48–61
was Yahoo (45.1%), followed by PChome (7.8%), Books.com (6.8%),and Ezfly (5.3%), which accounted for 65% of all responses. An ear-lier study by Chang and Chen [11] found that the ten websites mostoften visited were Yahoo! (30.1%), Unimall (17.4%), PChome (9.9%),Etmall (9.4%), Books (6.7%), Payeasy (5.1%), Hermall (3.8%), Happy-bag (2.9%), Eztravel (2.5%) and era ticket (2.4%) [11]. Therefore, thisstudy chooses the three most popular e-stores (i.e., Yahoo, PChom-e, and Books) to demonstrate the proposed method.
3. Building a new hybrid MCDM model for e-store management
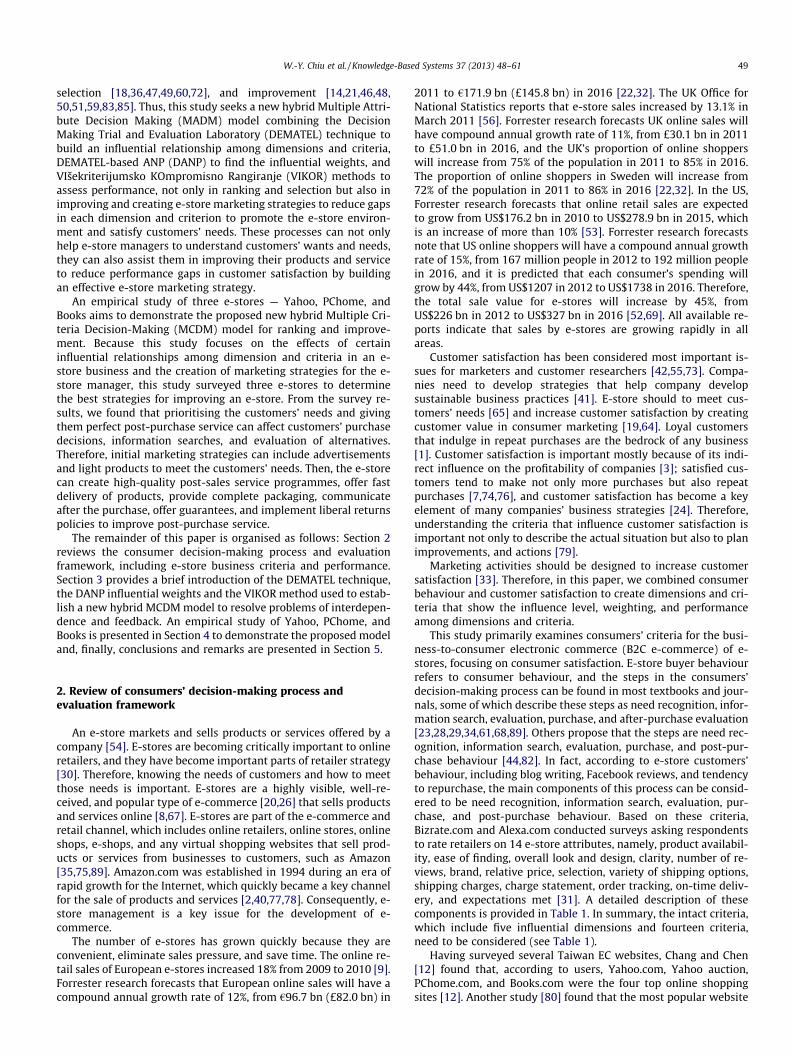
This research uses the DEMATEL technique and combines aDANP with a VIKOR method to establish a new hybrid MCDM mod-el to address the problems of interdependence and feedbackamong certain criteria and reduce the performance gap in eachdimension and criterion. The DEMATEL technique is used to buildan influential network relations map (INRM), and the DEMATEL-based Analytic Network Process (DANP) is expected to obtain theinfluential weights using the basic concept of Analytic NetworkProcess (ANP) [70]. Then, the VIKOR method with influentialweights (DANP) is used to integrate the performance gaps from cri-teria to dimensions and overall. Then, it is possible to determinehow to improve business performance and reduce the gaps toachieve the aspiration level and satisfy the customers’ needs basedon INRM. The research processes are illustrated as Fig. 1.
3.1. DANP (DEMATEL-based ANP)
This study seeks to assess business performance, which usuallyconsists of multiple dimensions and criteria and to determine theinfluential weights of those criteria. In a traditional ANP, normali-sation is set by dividing each criterion in a column by a number ofclusters so that each column achieves exact unity. This process
*cW
Criteria questionnair
DEMATEL
Solve Tand INRM
Tc
TD
Wc
*lim( cϕ→∞W
DA
Fig. 1. Model procedure of
implicitly assumes that each cluster has the same weight. How-ever, it is well-known that the effect of one cluster on the otherclusters may be different in degree. Thus, the traditional ANPassumption that each cluster is of equal weight in obtaining aweighted supermatrix is not reasonable; consequently, the DANPinfluential weights can improve this shortcoming and obtain re-sults based on the basic concept of the ANP from a total-influentialmatrix Tc and TD by using the DEMATEL technique. Therefore, theDEMATEL technique is used to build an INRM for each criterionand dimension and also to improve the normalisation process ofthe traditional ANP. The DANP is an appropriate tool to includeinteraction and interdependence among the dimensions and crite-ria that appear in the cases of real world problems. According tothe concrete characteristics of objective affairs, the methodologycan verify the interdependence of variables and attributes, buildinga relationship that reflects those characteristics with an essentialsystem and evolutionary trend [38,47,51,59,72,83,85,92]. Thistechnique has been successfully applied to many situations, suchas improving marketing, tourism policy, airline partner selection,information security risk control, and environment watershedplans [18,21,47,51,59].
The steps for building an INRM using the DEMATEL technique(steps 1–4) and finding the influential weights of a DANP basedon a total-influential matrix (steps 5–9) are summarised below.
3.1.1. DEMATEL technique for building an INRM
Step 1: Calculate the direct-influence matrix by scores. Anassessment of the relationship between each mutual influ-ence criterion is made according to the opinions of knowl-edge-based experts, using a scale ranging from 0 to 4, withscores represented by natural language: ‘absolutely noinfluence’ (0), ‘low influence’ (1), ‘medium influence’ (2),
)ϕ
NP
Solve DANP influential weights
Solve sort, improveand make strategies
VIKOR
Performance questionnaire
(Ak)
the current research.

W.-Y. Chiu et al. / Knowledge-Based Systems 37 (2013) 48–61 51
‘high influence’ (3), and ‘very high influence’ (4). Theknowledge-based experts are required to indicate thedirect influence by a pairwise comparison, and if theybelieve that criterion i has an effect and influence on crite-
rion j, they should indicate this by gijc . Thus, the matrix
G ¼ gijc
h in�n
of direct relationships can be obtained.
G ¼
g11c � � � g1j
c � � � g1nc
..
. ... ..
.
gi1c � � � gij
c � � � ginc
..
. ... ..
.
gn1c � � � gnj
c � � � gnnc
2666666664
3777777775
ð1Þ
Step 2: Normalise the direct-influence matrix G. The normalisedmatrix X is acquired by using Eq. (2). Its diagonal is zero,and the maximum sum of rows or columns is one.
X ¼ vG ð2Þ
where 8 9
v ¼mini;j1
maxi
Pnj¼1gij
c
;1
maxj
Pni¼1gij
c
><>:
>=>;; i; j 2 f1;2; . . . ;ng
Step 3: Attain a total-influential matrix Tc. When the normaliseddirect-influential matrix X is obtained, the total-influentialmatrix Tc of the INRM can be obtained from Eq. (3), inwhich I denotes the identity matrix,
Tc ¼ X þ X2 þ X3 þ � � � þ X‘
¼ XðI þ X þ X2 þ � � � þ X‘�1ÞðI � XÞðI � XÞ�1
¼ XðI � X‘ÞðI � XÞ�1 ¼ XðI � XÞ�1; when lim‘!1X‘
¼ ½0�n�n ð3Þ
where X ¼ xijc
h in�n
, 0 6 xijc < 1, 0 <
Pnj¼1xij
c 6 1, and
0 <Pn
i¼1xijc 6 1, and at least one row or column of the sum-
mation (but not all) equals one; then, lim‘?1 X‘ = [0]n�n
can be guaranteed.
Step 4: Analyse the results. At this stage, the row sums and thecolumn sums of the matrix components are separately
expressed as vector r ¼Pn
j¼1tijc
h i¼ ðr1; . . . ; ri; . . . ; rnÞ0 and
vector s ¼Pn
i¼1tijc
� �0 ¼ ðs1; . . . ; sj; . . . ; snÞ0 by using Eqs. (4)and (5). Let i = j and i,j 2 {1, 2, . . . , n}; the horizontal axisvector (ri + si) is then defined by adding ri to si, to illustratethe importance of the criterion. Similarly, the vertical axisvector (ri � si) is defined by subtracting ri from si, whichmay divide the criteria into a causal cluster and an affectedcluster. In general, when (ri � si) is positive, the criterion ispart of the causal group; i.e., criterion i affects other crite-ria. By contrast, if (ri � si) is negative, the criterion is part ofthe affected group; i.e., criterion i is influenced by othercriteria. Therefore, a causal graph can be achieved by map-ping the data set of (ri + si, ri � si), the so-called INRM, toprovide a valuable approach to decide how the preferredvalues in each dimension and criterion can be improvedbased on the INRM,
Tc ¼ tijc
� �n�n; i; j 2 f1;2; . . . ; ng
r ¼Xn
j¼1
tijc
" #n�1
¼ tic
� �n�1 ¼ ðr1; . . . ; ri; . . . ; rnÞ0
ð4Þ
s ¼Xn
i¼1
tijc
" #01�n
¼ tjc
� �n�1 ¼ ðs1; . . . ; sj; . . . ; snÞ0 ð5Þ
where vector r and vector s express the sum of the rows and thesum of the columns from the total-influential matrix Tc ¼ tij
c
� �n�n,
respectively, and the superscript 0 denotes the transpose [17]. Twodifferent total influence matrices are then applied. The first one,Tc ¼ tij
c
� �n�n, pertains to n criteria, while the second one,
TD ¼ tijD
h im�m
, is devoted to m dimensions (clusters) from Tc (see
Eq. (7)).
ð6Þ
3.1.2. DANP for finding the influential weights in each criterion
Step 5: Find the normalised total-influential matrix TnorD . The
total-influential matrix TD needs to be normalised bydividing it by the following formula:
tiD ¼
Xm
j¼1
tijD
ð7Þ
Thus, the total-influential matrix can be normalised and pre-sented as Tnor
D . Then, the sum of each row can be defined as
tiD ¼
Pmj¼1tij
D, where i = 1, . . . , m, and TD can be normalised by therows of sums by dividing the elements in each row by the sumof the row to obtain as in Eq. (7). Therefore, a total-influential ma-trix TD can be normalised and represented as Tnor
D .
TnorD ¼ tij
D=tiD
h im�m
, as in Eq. (8). Then, each row of the normalised
TnorD can be summed to equal one, so that
Pmj¼1t
norijD ¼ 1.
TnorD ¼
t11D =t1
D � � � t1jD =t1
D � � � t1mD =t1
D
..
. ... ..
. ... ..
.
ti1D =ti
D � � � tijD=ti
D � � � timD =ti
D
..
. ... ..
. ... ..
.
tm1D =tm
D � � � tmjD =tm
D � � � tmmD =tm
D
2666666664
3777777775¼
tnor11D � � � t
nor1jD � � � tnor1m
D
..
. ... ..
. ... ..
.
tnori1D � � � t
norijD � � � tnorim
D
..
. ... ..
. ... ..
.
tnorm1D � � � t
normjD � � � tnormm
D
2666666664
3777777775ð8Þ
Step 6: Find the normalised matrix Tnorc by dimensions and
clusters. Normalise Tc with the total degrees of effectand influence of the dimensions and clusters to obtainTnor
c , as shown in Eq. (9).

52 W.-Y. Chiu et al. / Knowledge-Based Systems 37 (2013) 48–61
ð9Þ
Step 7: Build an unweighted supermatrix Wc. Then, the total-influential matrix is normalised into a supermatrix accord-ing to the interdependence between the relationships ofthe dimensions and clusters to obtain an unweightedsupermatrix, Wc, as shown in Eq. (10).
ð10Þ
Unweighted supermatrix Wc is the matrix transposed from Tnorc (ba-
sic concept from the ANP by Saaty [70], but different from the tra-ditional ANP). If a blank or 0 is shown in the matrix, this means thatthe dimensions and criteria are independent.
Step 8: Find the influential weights of the DANP. The total-influ-ential matrix Tc needs to be normalised by dividing thedimension and cluster (Eq. (9)), so Tc is normalised bysummarising the row by dimensions and clusters to obtainTnor
c . An unweighted super-matrix Wc can be obtained bytransposing Tnor
c , i.e., Wc ¼ Tnorc
� �0. Using (Eq. (11)), aweighted super-matrix W�
c (improving the traditionalANP by using equal weights to make it appropriate forthe real world) can be obtained by the product of Tnor
D
and Wc, i.e., W�c ¼ Tnor
D Wc (Eq. (11)). This result demon-strates that these influential level values are the basis ofnormalisation to determine a weighted super-matrix.
W�c ¼ Tnor
D Wc ¼
tnor11D �W11
c � � � tnori1D �W i1
c � � � tnorm1D �Wm1
c
..
.� � � ..
.
tnor1jD �W1j
c � � � tnorijD �W ij
c � � � tnormjD �Wmj
c
..
. ... ..
.
tnor1mD �W1m
c � � � tnorimD �W im
c � � � tnormmD �Wmm
c
2666666664
3777777775
ð11Þ
Step 9: Obtain the DANP. Limit the weighted super-matrix byraising it to a sufficiently large power u until it convergesand becomes a long-term stable super-matrix to obtainglobal priority vector, which defines the influentialweights w = (w1, . . . , wj, . . . , wn) from limu!1 W�
c
� �u forthe criteria.
3.2. VIKOR method
The VIKOR method was developed for the multi-criteria optimi-sation of complex systems. It determines the compromise rankinglist and the compromise solution, and the weight stability intervalsfor the preferred stability of the compromise solution can be ob-tained from the initial weights given by the AHP or ANP in the tra-ditional method. This traditional method focuses on ranking andselection from a set of alternatives in cases of conflicting criteria.It introduces a multi-criteria ranking index based on the particularmeasure of ‘‘closeness’’ to the ‘‘ideal’’ solution [45,48,57,58,84].This study focuses on improving this method to the aspiration leveland knowing how to improve and create marketing strategies.
Assuming that each alternative is evaluated according to thefunction of each criterion, a compromise ranking can be obtainedby comparing the measure of closeness to the ideal alternative inthe traditional approach. The multi-criteria measure for compro-mise ranking is developed from the Lp �metric which plays anaggregating role in a compromise programming method [93,94].
The VIKOR was able to distinguish the three e-stores to deter-mine their gaps. In a traditional VIKOR, the positive ideal point isset as the highest performance score among all alternatives (thelarger is the better), i.e.; f �j ¼maxffkjjk ¼ 1;2; . . . ;Kg in this case.Likewise, the negative ideal point is set as the lowest performancescore among all alternatives, when smaller is worst; i.e.,f�j ¼minffkjjk ¼ 1;2; . . . ;Kg in this case. However, in this study, anew technique for improving the VIKOR method is proposed anddescribed as follows. The alternatives are denoted A1, . . . , Ak, -. . . , AK; wj is set as the weight of the j � th criterion, expressingthe relative influential weight of the criterion j by the DANP basedon influential matrix T from the DEMATEL technique to make itapplicable to the real-world situation, where j = 1, 2, . . . , n, and nis the number of criteria. The rating performance scores are norma-lised by the best value and the worst value for example, the scaleperformance scores from 0 (the worst value, f�j ¼ 0) to 10 (the bestvalue, called the aspiration level, f �j ¼ 10), and the scores of the j-thcriterion are denoted by fkj for an alternative Ak as gap ykj. The newVIKOR is more appropriate to the analysis of real-world situations.These models can be used to resolve other real business questions.
The new VIKOR method consists of the following:
Step 1:Finding the normalised gap.
ykj ¼ jf �j � fkjj� �
jf �j � f�j j� �.
ð12Þ
where f �j is the best value (f �j is set as the aspiration level) andf�j is the worst value (f�j is set as the worst value or the so-called tolerable level) of all criterion functions,j = 1, 2, . . . , n.These concepts are different from the traditional approachf �j ¼maxkfkj and f�j ¼minkfkj, in which higher-valued perfor-mance is better because they avoid ‘‘choose the best among

W.-Y. Chiu et al. / Knowledge-Based Systems 37 (2013) 48–61 53
inferior choices, options, or alternatives (i.e., pick the bestapple among a barrel of rotten apples)’’ problems. Thus, thisperformance definition differs from the traditional approach.It is more appropriate for the empirical business analysis ofe-stores in the real world, to ascertain how the normalisedscale of the gap, ykj, can be reduced to zero (0) when the bestvalue is set with no gap, the normalised scale of the gap ykj isset to be one (1), and the worst value is set with the largest gap.
Step 2:Computing the gap for minimal and the maximal gapfor priority improvement.
The general form of Lp-metric can be written as follows:
Lpk ¼
Xn
j¼1
½wj � ykj�p
( )1=p
;1 6 p 61; k ¼ 1;2; . . . ;K: ð13Þ
In addition to applying the above form of Lp �metric, the VI-KOR method also uses Lp¼1
k , which is shown as the averagegap Ek in Eq. (14), and Lp¼1
k , which is shown as the maximalgap Qk, to improve the priority in Eq. (15).
Ek ¼ Lp¼1k ¼
Xn
j¼1
wj � ykj; 8k ð14Þ
Q k ¼ Lp¼1k ¼maxjfykjjj ¼ 1;2; . . . ;ng; 8k ð15Þ
How can the smaller average gap Ek be better? The averagegap (called the group utility) is emphasised in the case ofp = 1. The importance of individual regrets or gaps (maximumregrets or gaps should be improved by their priority in totaland by each p dimension) rises as the value of parameter p in-creases when p =1. The compromise solution minkLp
k will bechosen because its value is closest to the ideal or aspiration le-vel. The usually applied expression E�k ¼minkEk is thereforechanged because the best gap E�k is zero (i.e., E�k ¼ 0), and thecommonly utilised expression E�k ¼maxkEk is changed be-cause the worst value of E�k is one (i.e., E�k ¼ 1). The expressionQ �k ¼minkQk is similarly changed because the best gap Q �k iszero (i.e., Q �k ¼ 0), and the expression Q�k ¼maxkQk is chan-ged because the worst value of Q�k is one (i.e., Q�k ¼ 1).
Step 3:Obtaining the comprehensive indicator Uk
Based on the above concepts, the comprehensive indicator Uk
of the compromise VIKOR can be written as Eq. (16) from thetraditional form
Uk¼aðEk�E�Þ=ðE� �E�Þþð1�aÞðQ k�Q �Þ=ðQ� �Q �Þ ð16Þ
Then, based on the concept above, the best situation, whenE�k ¼ 0 and Q �k ¼ 0, and the worst situation, when E�k ¼ 1and Q�k ¼ 1, can be rewritten as follows:
Uk ¼ aEk þ ð1� aÞQk ð17Þ
This paper seeks to combine the influential weights of the DANPwith the VIKOR method to determine how to minimise the averagegap (or regret) and prioritise improvement in the maximum gapoverall and in each dimension based on the INRM by the DEMATELtechnique. Thus, this study focuses on how to improve and reducethe performance gaps to achieve the aspiration level based on INRM.
4. Empirical case study of real e-stores
Because e-store commerce is growing fast, and the Internet isnot limited by national boundaries, the competitive business envi-ronment makes it essential for e-store managers to know how tomanage their e-stores and attract more consumers to browse, pur-
chase, and repurchase. Previous papers seldom address e-storemanagement and marketing strategy problems.
We used two different questionnaires in this research. The firstquestionnaire for influential relationships among criteria was dis-tributed to eight frequent shoppers who are e-store experts (theeight experts’ group consensus of significant confidence in thequestionnaires, which is 95.11%, is shown in Tables A1 and A2 ofAppendix A). The questionnaires for influential relationshipsamong dimensions and criteria were conducted on the basis of aface-to-face pairwise comparison to evaluate the effect and influ-ence of the criteria, using a five-point scale ranging from four (ex-tremely influential) to zero (completely non-influential).
The second questionnaire was the e-stores’ performance ques-tionnaire, which was distributed to 1,018 consumers who often pur-chase products from the three chosen e-stores (The reliability is93.9%, and the validity is 92.9% (KMO test)). These questionnairesused an eleven-point scale ranging from zero (very poor perfor-mance) to ten (excellent performance), i.e., very dissatisfied or verybad 0, 1, 2, . . . , 9, 10? very satisfied or very good. It is hoped thatthis research can help e-store managers to improve and managetheir stores more effectively to satisfy customers and promote high-er rates of repurchase. The goal is to provide marketing strategies formanagers to build an effective business by reducing or eradicatingthe gaps in e-store service and achieving aspiration levels.
4.1. Description of problem
In the e-era, the Internet has proved to be a particularly power-ful channel for providing information to customers because it re-duces buyers’ costs and the time spent searching for the rightproduct. Because e-stores are able to respond rapidly to changesin the marketplace, many prestigious companies have incorporatedan e-store as a means of attracting customers who find it conve-nient to shop from their homes or places other than physicalbrick-and-mortar stores. Indeed, e-stores provide a diffuse andubiquitous network of points of access. They are open 24 h a dayand seven days a week, so customers can shop anywhere and atany time. In today’s fiercely competitive electronic marketplace,e-stores are more anxious than ever to create a long-lasting rela-tionship with their customers. Although all firms have the abilityto establish and manage their own e-store sales channels, not allof them can successfully operate an e-commerce business. There-fore, e-store managers must know how to turn ‘‘lookers’’ into ‘‘buy-ers’’ and ‘‘purchases’’ into ‘‘repurchases.’’ A well-established brandname particularly helps to build trust with customers, which isessential for online sales [16].
The emergence of the e-store has led many organisations to re-think their business strategies to remain competitive. E-stores pro-vide companies with the opportunity to reach new markets, newcustomers, and new information, improve customer services, dis-tribute products more quickly, communicate more effectively,and increase profitability [2,25]. In other words, they provide com-panies with many competitive advantages. An effective e-storemanager uses the Internet to enhance customer relations manage-ment (CRM) and attract potential customers [6]. This paper seeksto provide recommendations to the managers of three of the mostpopular e-store websites in Taiwan (i.e., Yahoo, PChome, andBooks) that can help to improve their business and marketingstrategy, increase the number of customers, increase the volumeof business, and maximise profits.
4.2. Measuring the relationship among dimensions and criteria tobuild an INRM
The DEMATEL technique is used to model influential relation-ships among dimensions and criteria and to establish an INRM

54 W.-Y. Chiu et al. / Knowledge-Based Systems 37 (2013) 48–61
for those dimensions and criteria using pair-wise comparisons (seeFig. 2). This technique can help to determine the levels of needs toimprove them.
The shopping experts were asked to determine the influence ofthe relationships among the criteria. The average initial direct-rela-tion 14 � 14 matrix G, obtained using pair-wise comparisons interms of influences and directions between criteria, is shown inTable 2.
As matrix G shows, the normalised direct-relation matrix X iscalculated using Eqs. (1) and (2), as shown in Table 3. Then, the to-tal-influential matrix Tc can be derived using Eqs. (3) and (7), asshown in Tables 4 and 5. Furthermore, by using Eqs. (4) and (5),the total-influence given and received according to each dimensionand criterion can be summarised, as shown in Table 6. Thus, theINRM of the DEMATEL technique can be obtained as shown inFig. 2 by using Table 6.
4.3. Influential weights of criteria in e-store management
Having determined the relationship structure of e-store busi-ness criteria, the DANP method was applied to obtain the influen-tial weights of the criteria. Initially, the influence of therelationship among the criteria was compared based on the INRM.An unweighted supermatrix Wc can be obtained by transposing thenormalised matrix Tnor
c , i.e., W c ¼ Tnorc
� �0, as shown in Table 7.The influential weights W �
c of DANP based on Eqs. (8)–(11) areshown in Table 8.
The influential weights of DANP can be obtained by limiting thepower of the weighted super-matrix ðlim/!1 W �
c
� �/Þ until itreaches a steady-state (see Table 9).
4.4. Using the method to evaluate e-store management performanceand gaps
In Taiwan, 1018 customers who use e-stores were asked toevaluate their level of satisfaction with each criterion. The DANPmethod was used to obtain the influential weights of the dimen-sions and criteria to apply to a real case. The global influentialweights and local influential weights of the dimensions and criteriawere obtained based on the DANP technique (see Table 10), which
Fig. 2. Influential network
was followed by combining the DANP with the VIKOR method toobtain the average performance scores (satisfaction) of Yahoo(A1), PChome (A2), and Books (A3), which were 7.538, 7.470, and7.601, respectively (as shown in Table 10).
4.5. Results and discussions
This study has three results. First, in the INRM, it can be easilyunderstood from Fig 2 and Table 6 that five dimensions influenceeach other. For example, dimension A affects dimensions E, D, B,and C (A ? {E D B C}); dimension E affects dimensions D, B, andC (E ? {D B C}); dimension D affects dimensions B and C (D ? {BC}); and dimension B affects dimension C (B ? {C}). Understandingthese influential relationships will enable managers to make deci-sions; for example, they should first improve A (need recognition),followed by E (post-purchase behaviour), D (choice/purchase), B(information search), and C (evaluation of alternatives).
Fig. 2 and Table 6 demonstrate that criterion e1 affects criteria e2
and e3 (e1 ? {e2 e3}), and criterion e2 affects criterion e3 (e2 ? {e3}).In addition, criterion d1 affects criteria d4, d3, and d2
(d1 ? {d4 d3 d2}), criterion d4 affects criteria d3 and d2
(d4 ? {d3 d2}), and criterion d3 affects criterion d2 (d3 ? {d2}). Crite-rion b2 affects criteria b3 and b1 (b2 ? {b3 b1}), and criterion b3 af-fects criterion b1 (b3 ? {b1}). Criterion c2 affects criteria c3 and c1
(c2 ? {c3 c1}), and criterion c3 affects criterion c1 (c3 ? {c1}).These e-stores must improve their business strategies to meet
consumers’ needs, generate more purchases and repurchases, anddevise the best marketing strategies with the most effective andefficient ways to achieve customer satisfaction. The e-store rankingfurther indicates the dimensions that need to be most improved:need recognition � post-purchase behaviour � choice/purchase� information search � evaluation of alternatives. This study dem-onstrates that the impact of need recognition and post-purchase onthe intention to repurchase consists of product availability, ordertracking, on-time delivery, and expectations met, supporting theresults obtained by Gauri et al. [31]. Thus, this study has provedthat DEMATEL can correctly indicate the effect of e-store criteriaand identify those that need to be improved first.
Based on the result above, we can establish marketing strategiesby using advertisements and light products to persuade customers
relations map (INRM).

Table 2Initial influential matrix G.
Dimensions/criteria (G) A. Need recognition B. Information search C. Alternatives evaluation D. Choice/purchase E. Post-purchase behaviour
a1 b1 b2 b3 c1 c2 c3 d1 d2 d3 d4 e1 e 2 e3 Total
A. Need recognition a1 Product availability 0.000 2.125 1.875 3.000 3.375 1.250 3.250 2.125 2.250 2.375 2.000 1.375 1.875 2.875 29.750
B. Information search b1 Ease of finding 1.875 0.000 2.625 2.625 1.875 1.375 1.375 2.500 1.375 1.125 1.500 1.375 1.250 2.000 22.875b2 Overall look/design 2.000 2.750 0.000 3.375 1.875 1.375 1.500 2.875 1.500 1.125 1.500 1.500 1.250 1.625 24.250b3 Clarity 3.125 3.625 3.125 0.000 1.875 1.375 1.750 3.250 2.000 1.500 1.625 1.375 1.250 2.625 28.500
C. Evaluation of alternatives c1 Number of reviews 2.125 1.875 1.625 1.875 0.000 2.750 2.250 1.500 1.125 1.500 1.250 1.250 1.500 2.750 23.375c2 Brand 1.250 1.750 2.125 2.125 2.875 0.000 2.000 1.750 1.750 1.750 2.000 1.750 1.875 2.125 25.125c3 Relative price 3.125 1.250 1.250 2.000 2.500 1.375 0.000 1.500 1.375 2.500 1.250 1.250 1.500 2.625 23.500
D. Choice/ Purchase d1 Selection 2.000 3.000 2.750 3.000 2.000 1.625 1.750 0.000 2.125 1.625 1.750 1.125 1.375 1.625 25.750d2 Variety of shipping 1.750 1.250 1.500 1.625 1.750 1.625 2.000 1.625 0.000 2.750 1.875 1.750 2.250 1.625 23.375d3 Shipping charges 2.000 1.125 1.250 1.625 1.500 2.250 3.000 1.250 2.875 0.000 1.375 1.875 2.125 1.625 23.875d4 Charge statement 1.750 1.375 1.125 1.625 1.250 1.625 1.500 1.500 1.625 1.625 0.000 1.375 1.125 1.375 18.875
E. Post-purchase behaviour e1 Order tracking 1.250 1.125 1.375 1.500 1.625 1.625 1.250 1.250 3.125 2.250 1.250 0.000 3.500 2.125 23.250e2 On-time delivery 1.500 1.250 1.125 1.500 2.250 2.375 1.750 1.375 3.125 2.750 1.000 2.875 0.000 1.875 24.750e3 Met expectations 3.000 2.000 2.000 3.125 3.000 2.500 2.500 1.500 1.375 1.625 0.875 1.500 1.750 0.000 26.750
Total 26.750 24.500 23.750 29.000 27.750 23.125 25.875 24.000 25.625 24.500 19.250 20.375 22.625 26.875 –
Table 3Normalised direct-relation X.
Dimensions/criteria (X) A. Need recognition B. Information search C. Alternatives evaluation D. Choice/purchase E. Post-purchase behaviour
a1 b1 b2 b3 c1 c2 c3 d1 d2 d3 d4 e1 e2 e3
a1 Product availability 0.000 0.071 0.063 0.101 0.113 0.042 0.109 0.071 0.076 0.080 0.067 0.046 0.063 0.097b1 Ease of finding 0.063 0.000 0.088 0.088 0.063 0.046 0.046 0.084 0.046 0.038 0.050 0.046 0.042 0.067b2 Overall look/design 0.067 0.092 0.000 0.113 0.063 0.046 0.050 0.097 0.050 0.038 0.050 0.050 0.042 0.055b3 Clarity 0.105 0.122 0.105 0.000 0.063 0.046 0.059 0.109 0.067 0.050 0.055 0.046 0.042 0.088c1 Number of reviews 0.071 0.063 0.055 0.063 0.000 0.092 0.076 0.050 0.038 0.050 0.042 0.042 0.050 0.092c2 Brand 0.042 0.059 0.071 0.071 0.097 0.000 0.067 0.059 0.059 0.059 0.067 0.059 0.063 0.071c3 Relative price 0.105 0.042 0.042 0.067 0.084 0.046 0.000 0.050 0.046 0.084 0.042 0.042 0.050 0.088d1 Selection 0.067 0.101 0.092 0.101 0.067 0.055 0.059 0.000 0.071 0.055 0.059 0.038 0.046 0.055d2 Variety of shipping 0.059 0.042 0.050 0.055 0.059 0.055 0.067 0.055 0.000 0.092 0.063 0.059 0.076 0.055d3 Shipping charges 0.067 0.038 0.042 0.055 0.050 0.076 0.101 0.042 0.097 0.000 0.046 0.063 0.071 0.055d4 Charge statement 0.059 0.046 0.038 0.055 0.042 0.055 0.050 0.050 0.055 0.055 0.000 0.046 0.038 0.046e1 Order tracking 0.042 0.038 0.046 0.050 0.055 0.055 0.042 0.042 0.105 0.076 0.042 0.000 0.118 0.071e2 On-time delivery 0.050 0.042 0.038 0.050 0.076 0.080 0.059 0.046 0.105 0.092 0.034 0.097 0.000 0.063e3 Met expectations 0.101 0.067 0.067 0.105 0.101 0.084 0.084 0.050 0.046 0.055 0.029 0.050 0.059 0.000
W.-Y.Chiu
etal./K
nowledge-Based
Systems
37(2013)
48–61
55

Table 4Total-influential dimensions matrix TD.
Dimensions A. Need recognition B. Information search C. Evaluation of alternatives D. Choice/purchase E. Post-purchase behaviour ri
A. Need recognition 0.389 0.443 0.448 0.400 0.395 2.075B. Information search 0.406 0.385 0.365 0.343 0.334 1.833C. Alternatives evaluation 0.385 0.360 0.349 0.323 0.330 1.746D. Choice/purchase 0.361 0.345 0.344 0.304 0.311 1.665E. Post-purchase behaviour 0.386 0.365 0.377 0.339 0.330 1.797
si 1.927 1.898 1.884 1.708 1.700 –
Table 5Total-influential criteria matrix Tc.
Table 6Sum of influences given and received on dimensions and criteria.
Dimensions/criteria ri si ri + si ri � si
A. Need recognition 2.075 1.927 4.002 0.148a1 Product availability 0.389 0.389 0.778 0.000
B. Information search 1.833 1.898 3.731 �0.064b1 Ease of finding 1.046 1.127 2.173 �0.081b2 Overall look/design 1.123 1.076 2.199 0.047b3 Clarity 1.294 1.260 2.555 0.034
C. Evaluation of alternatives 1.746 1.884 3.630 �0.138c1 Number of reviews 1.041 1.146 2.187 �0.105c2 Brand 1.082 0.945 2.026 0.137c3 Relative price 1.019 1.051 2.070 �0.031
D. Choice/purchase 1.665 1.708 3.374 � 0.043d1 Selection 1.336 1.222 2.558 0.114d2 Variety of shipping 1.252 1.332 2.584 �0.080d3 Shipping charges 1.255 1.280 2.535 �0.025d4 Charge statement 1.018 1.028 2.047 �0.010
E. Post-purchase behaviour 1.797 1.700 3.497 0.097e1 Order tracking 0.965 0.879 1.844 0.086e2 On-time delivery 0.987 0.983 1.970 0.004e3 Met expectations 1.017 1.107 2.123 �0.090
56 W.-Y. Chiu et al. / Knowledge-Based Systems 37 (2013) 48–61
to buy products to improve the dimension ‘‘need recognition (A)’’.For the dimension ‘‘post-purchase behaviour (E)’’, e-stores can cre-ate high-quality post-sales service programmes and offer fastdelivery of products to improve the ‘‘order tracking (e1)’’ and‘‘on-time delivery (e2)’’ criteria, and they can provide completepackaging, add service speed, give reassuring communication afterthe purchase, offer guarantees, and implement liberal returns pol-icies to improve ‘‘expectations met (e3)’’. To improve the dimensionof ‘‘choice/purchase (D)’’, e-stores can provide an assortment ofmerchandise, an interface that is easy to access and navigate, anda satisfactory number of alternatives to improve network crowd-ing; they can offer various methods of payment and provide a cleanbill of sale to improve ‘‘charge statement (d4)’’; clear shippingprices can improve ‘‘shipping charges (d3)’’; and convenience andeasy transactions can improve the ‘‘variety of shipping (d2)’’. In
the ‘‘information search (B)’’ dimension, e-stores can enhance theappearance and design of their websites, use attractive animatedgraphics, provide the expected value of additional information,and offer a variety of categories to improve the ‘‘overall look anddesign (b2)’’, ‘‘clarity (b3)’’, and ‘‘ease of finding (b1)’’. To facilitate‘‘evaluation of alternatives (C)’’, e-stores can provide former cus-tomers’ experience, namely word-of-mouth (chat rooms and blog)and services offered to improve the image of the ‘‘brand (c2)’’; theycan display other e-store references or relative prices to improve‘‘relative price (c3)’’; and they can correct any unfavourable percep-tion to improve the ‘‘number of reviews (c1)’’ (see Fig. 2).
In addition to the summary above, new e-store managers canrefer to the INRM of the DEMATEL technique to prioritise theimprovement of dimensions and criteria and creating marketingstrategies for their e-store business.
The second results were influential weights. As seen in Table 9,the highest relative weights were ‘‘clarity b3’’ and ‘‘number of re-views c1’’, assessed at 0.084 and 0.080, respectively. This resultshows that an e-store’s ‘‘clarity’’ of information about productsand customer’s rating of the e-store as having a good ‘‘number ofreviews’’ have the greatest relative influence of all criteria. Thus,it is extremely important to deliver clear and careful informationto customers on an e-store website because this parameter cancontribute to positive reviews. The lowest priority was ‘‘chargestatement d4 (0.056)’’. This result shows that an e-store’s clear dis-play of price, quantity, shipping fee, and total fee makes ‘‘chargestatement’’ the least influential criterion. ‘‘Need recognition (A)’’was the most influential dimension within an e-store business.Fig. 2 and Table 9 illustrate the priority of criterion improvementfrom top to bottom, where improvement of the most influentialcriteria would provide the best effect. The priority of dimensionsand criteria for improvement should be considered in entire sys-tems (based on Fig. 2) to reduce gaps and meet customers’ needs.It is possible that improving different criteria will strongly influ-ence the results directly and indirectly.
The third result (see Table 10), which ranked three e-stores’performances, determined that Books surpassed Yahoo, which

Table 7Unweighted supermatrix Wc.
Unweighted a1 b1 b2 b3 c1 c2 c3 d1 d2 d3 d4 e1 e2 e3
A. Need recognition a1 Productavailability
1.000 1.000 1.000 1.000 1.000 1.000 1.000 1.000 1.000 1.000 1.000 1.000 1.000 1.000
B. Information search b1 Ease of finding 0.317 0.271 0.343 0.354 0.324 0.316 0.314 0.325 0.315 0.315 0.321 0.315 0.319 0.314
b2 Overall look/design
0.303 0.339 0.258 0.334 0.309 0.316 0.305 0.310 0.313 0.310 0.304 0.314 0.308 0.305
b3 Clarity 0.380 0.390 0.399 0.312 0.368 0.368 0.381 0.364 0.372 0.376 0.374 0.372 0.373 0.382
C. Evaluation ofalternatives
c1 Number ofreviews
0.372 0.368 0.366 0.364 0.308 0.392 0.394 0.362 0.354 0.335 0.349 0.359 0.358 0.364
c2 Brand 0.277 0.300 0.299 0.297 0.337 0.260 0.307 0.301 0.302 0.307 0.312 0.311 0.315 0.302c3 Relative price 0.351 0.332 0.335 0.340 0.355 0.348 0.299 0.336 0.344 0.358 0.339 0.330 0.327 0.333
D. Choice/purchase d1 Selection 0.258 0.282 0.287 0.283 0.263 0.257 0.254 0.229 0.259 0.254 0.268 0.239 0.240 0.264d2 Variety ofshipping
0.267 0.259 0.259 0.263 0.261 0.265 0.260 0.283 0.229 0.304 0.281 0.295 0.291 0.267
d3 Shipping charges 0.263 0.246 0.243 0.246 0.263 0.258 0.280 0.264 0.289 0.227 0.274 0.268 0.276 0.266d4 Charge statement 0.212 0.213 0.210 0.208 0.212 0.220 0.206 0.224 0.223 0.215 0.178 0.199 0.193 0.204
E. Post-purchasebehaviour
e1 Order tracking 0.281 0.292 0.298 0.287 0.281 0.294 0.281 0.289 0.296 0.299 0.301 0.241 0.338 0.307
e2 On-time delivery 0.318 0.313 0.315 0.309 0.312 0.322 0.314 0.321 0.336 0.331 0.317 0.377 0.276 0.342e3 Met expectations 0.401 0.395 0.387 0.404 0.407 0.384 0.405 0.389 0.368 0.369 0.382 0.382 0.386 0.351
Table 8The weighted supermatrix W�
c , produced by weighting the unweighted supermatrix Wc.
Weighted a1 b1 b2 b3 c1 c2 c3 d1 d2 d3 d4 e1 e2 e3
A. Need recognition a1 Productavailability
0.067 0.081 0.081 0.081 0.080 0.080 0.080 0.079 0.079 0.079 0.079 0.078 0.078 0.078
B. Information search b1 Ease of finding 0.072 0.062 0.079 0.081 0.073 0.071 0.071 0.074 0.071 0.071 0.072 0.070 0.070 0.069b2 Overall look/design
0.069 0.078 0.059 0.077 0.069 0.071 0.069 0.070 0.071 0.070 0.069 0.069 0.068 0.068
b3 Clarity 0.086 0.089 0.091 0.071 0.083 0.083 0.086 0.082 0.084 0.085 0.084 0.082 0.082 0.084
C. Evaluation ofalternatives
c1 Number ofreviews
0.086 0.080 0.080 0.079 0.067 0.086 0.086 0.082 0.080 0.076 0.079 0.082 0.082 0.083
c2 Brand 0.064 0.066 0.065 0.065 0.074 0.057 0.067 0.068 0.068 0.069 0.071 0.071 0.072 0.069c3 Relative price 0.081 0.072 0.073 0.074 0.078 0.076 0.066 0.076 0.078 0.081 0.077 0.075 0.075 0.076
D. Choice/purchase d1 Selection 0.070 0.077 0.078 0.077 0.071 0.069 0.068 0.061 0.069 0.067 0.071 0.065 0.066 0.072d2 Variety ofshipping
0.073 0.071 0.071 0.072 0.070 0.071 0.070 0.075 0.061 0.081 0.074 0.081 0.079 0.073
d3 Shipping charges 0.072 0.067 0.067 0.067 0.071 0.069 0.075 0.070 0.077 0.060 0.073 0.073 0.075 0.073d4 Charge statement 0.058 0.058 0.057 0.057 0.057 0.059 0.055 0.059 0.059 0.057 0.047 0.054 0.053 0.056
E. Post-purchasebehaviour
e1 Order tracking 0.057 0.058 0.059 0.057 0.058 0.061 0.058 0.059 0.060 0.061 0.061 0.048 0.068 0.061
e2 On-time delivery 0.064 0.062 0.063 0.062 0.065 0.067 0.065 0.065 0.069 0.068 0.065 0.075 0.055 0.068e3 Met expectations 0.081 0.079 0.077 0.080 0.084 0.080 0.084 0.080 0.075 0.075 0.078 0.077 0.077 0.070
Table 9Influential weights by stable matrix of DANP when power lim/!1 W�
c
� �u .
W.-Y. Chiu et al. / Knowledge-Based Systems 37 (2013) 48–61 57
surpassed PChome (Books (A3)� Yahoo (A1) � PChome (A2)). Theintegration of the performance index scores of Yahoo in theDANP further demonstrated that the dimension of the ‘‘need rec-ognition’’ gap is 0.279 and the gap for the ‘‘Shipping Charges’’ cri-terion is 0.290 constituting the largest gaps, which the Yahoo e-store should improve as a priority. The integration of the perfor-mance index scores of PChome in the DANP showed that the gapof the ‘‘need recognition’’ dimension is 0.274, and the gap of the‘‘Overall Look/Design’’ criterion is 0.289 constituting the largestgaps, which the PChome e-store should improve as a priority.The integration of the performance index scores of Books in theDANP showed that gap of the ‘‘need recognition’’ dimension is0.296 and the gap of the ‘‘Relative Price’’ criterion is 0.307 consti-
tuting the largest gaps, which the Books e-store should improveas a priority. Thus, the priority for Yahoo, PChome, and Booksis to enhance their product variety to satisfy their customers’needs.
The e-store strategies were defined by using the data in Table 10(shown in Table 11). This process demonstrated that the prioritiesof each e-store’s strategy were dissimilar. The results indicatedthat Yahoo, PChome, and Books needed to enhance their productavailability. Therefore, Yahoo, PChome, and Books should allstrengthen their efforts to develop and comply with their custom-ers’ need for products and goods or extend their products andgoods category to satisfy their customers. Additionally, providingthe best service to customers at the post-purchase stage is an

Table 10Performance values combined with the influential weights of the criteria according to the DANP.
58 W.-Y. Chiu et al. / Knowledge-Based Systems 37 (2013) 48–61
essential dimension because this consideration primarily deter-mines the consumers’ choice of e-store.
According to the DANP based on the basic concept of ANP, thedata in Table 9 were designed and obtained to calculate a weightedand unweighted super-matrix to determine the influential weightsbased on the total-influential normalised matrix. Table 10 showsthe e-store criteria weighted super-matrix indices, as well as theperformance gaps of Books, Yahoo, and PChome. Each row repre-sents the weight of each criterion (Table 9). Therefore, in this pa-per, based on the results previously provided, the influentialweights of the criteria and index were created using the DEMATELtechnique and the DANP in conjunction with VIKOR for perfor-mance evaluation.
The e-store strategy, which emphasises the e-store businessgoal of satisfying customers’ needs, is shown in Table 11. The re-sults of this research indicate that no e-store business strategy isthe same; consequently, managers of e-stores must use this meth-od to determine their customers’ wants and needs to define thegap and improve it to achieve the ideal solution or aspiration level.
Table 11E-stores’ priority strategies for improvement.
e-Store Strategies
Yahoo The priority index for improving the dimensions includes need recognitiochoice/purchaseThe priority index for improving the criteria includes shipping charges, oveease of finding, order tracking, on-time delivery, brand, number of review
PChome The priority index for improving the dimensions includes need recognitionchoice/purchaseThe priority index for improving the criteria includes overall look and desorder tracking, number of reviews, variety of shipping, expectations met,
Books The priority index for improving the dimensions includes need recognitiopurchase behaviourThe priority index for improving the criteria includes relative price, productclarity, variety of shipping, overall look and design, on-time delivery, selec
5. Conclusion and remarks
This study can help e-store managers to reflect on the improve-ment of marketing strategies, service re-engineering, and manage-ment redesign. The influential weight questionnaire from expertsand the performance questionnaires from 1,018 e-store consumersare more relevant than other traditional evaluation techniques inthe real world.
E-stores can offer products and services at a reduced cost at anytime and in any place, making good e-store management essentialin the business field. This research used the DEMATEL technique inconjunction with a DANP to produce an INRM and influentialweights of criteria, and it used a VIKOR to ascertain the gaps inthe three chosen e-stores and discover how to improve them.The traditional e-store approach is to rank the alternatives andonly use the best, whereas this current study not only selects thebest but also analyses which gaps in the dimensions and criteriashould be improved first. An important topic for future researchis how to formulate strategies to improve and reduce the gaps to
n, information search, post-purchase behaviour, evaluation of alternatives, and
rall look and design, product availability, clarity, relative price, expectations met,s, variety of shipping, selection, and charge statement
, information search, the evaluation of alternatives, post-purchase behaviour, and
ign, shipping charges, product availability, relative price, clarity, ease of finding,on-time delivery, brand, selection, and charge statement
n, the evaluation of alternatives, information search, choice/purchase, and post-
availability, shipping charges, ease of finding, number of reviews, order tracking,tion, met expectation, brand, and charge statement
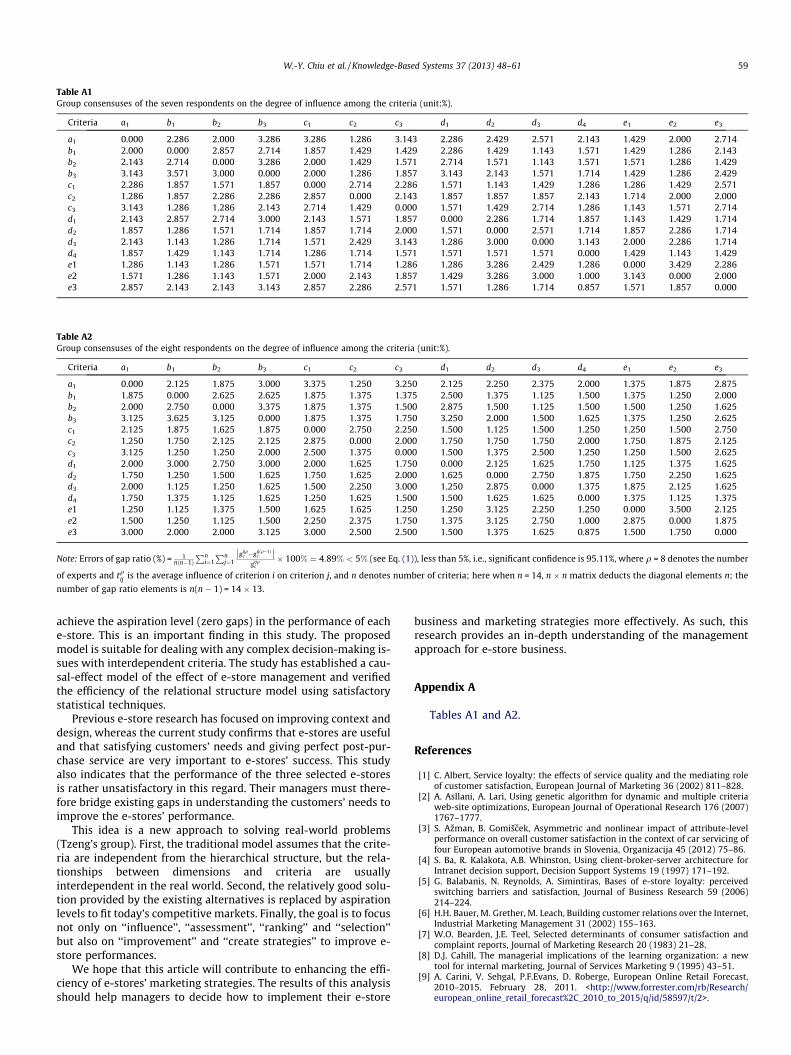
Table A1Group consensuses of the seven respondents on the degree of influence among the criteria (unit:%).
Criteria a1 b1 b2 b3 c1 c2 c3 d1 d2 d3 d4 e1 e2 e3
a1 0.000 2.286 2.000 3.286 3.286 1.286 3.143 2.286 2.429 2.571 2.143 1.429 2.000 2.714b1 2.000 0.000 2.857 2.714 1.857 1.429 1.429 2.286 1.429 1.143 1.571 1.429 1.286 2.143b2 2.143 2.714 0.000 3.286 2.000 1.429 1.571 2.714 1.571 1.143 1.571 1.571 1.286 1.429b3 3.143 3.571 3.000 0.000 2.000 1.286 1.857 3.143 2.143 1.571 1.714 1.429 1.286 2.429c1 2.286 1.857 1.571 1.857 0.000 2.714 2.286 1.571 1.143 1.429 1.286 1.286 1.429 2.571c2 1.286 1.857 2.286 2.286 2.857 0.000 2.143 1.857 1.857 1.857 2.143 1.714 2.000 2.000c3 3.143 1.286 1.286 2.143 2.714 1.429 0.000 1.571 1.429 2.714 1.286 1.143 1.571 2.714d1 2.143 2.857 2.714 3.000 2.143 1.571 1.857 0.000 2.286 1.714 1.857 1.143 1.429 1.714d2 1.857 1.286 1.571 1.714 1.857 1.714 2.000 1.571 0.000 2.571 1.714 1.857 2.286 1.714d3 2.143 1.143 1.286 1.714 1.571 2.429 3.143 1.286 3.000 0.000 1.143 2.000 2.286 1.714d4 1.857 1.429 1.143 1.714 1.286 1.714 1.571 1.571 1.571 1.571 0.000 1.429 1.143 1.429e1 1.286 1.143 1.286 1.571 1.571 1.714 1.286 1.286 3.286 2.429 1.286 0.000 3.429 2.286e2 1.571 1.286 1.143 1.571 2.000 2.143 1.857 1.429 3.286 3.000 1.000 3.143 0.000 2.000e3 2.857 2.143 2.143 3.143 2.857 2.286 2.571 1.571 1.286 1.714 0.857 1.571 1.857 0.000
Table A2Group consensuses of the eight respondents on the degree of influence among the criteria (unit:%).
Criteria a1 b1 b2 b3 c1 c2 c3 d1 d2 d3 d4 e1 e2 e3
a1 0.000 2.125 1.875 3.000 3.375 1.250 3.250 2.125 2.250 2.375 2.000 1.375 1.875 2.875b1 1.875 0.000 2.625 2.625 1.875 1.375 1.375 2.500 1.375 1.125 1.500 1.375 1.250 2.000b2 2.000 2.750 0.000 3.375 1.875 1.375 1.500 2.875 1.500 1.125 1.500 1.500 1.250 1.625b3 3.125 3.625 3.125 0.000 1.875 1.375 1.750 3.250 2.000 1.500 1.625 1.375 1.250 2.625c1 2.125 1.875 1.625 1.875 0.000 2.750 2.250 1.500 1.125 1.500 1.250 1.250 1.500 2.750c2 1.250 1.750 2.125 2.125 2.875 0.000 2.000 1.750 1.750 1.750 2.000 1.750 1.875 2.125c3 3.125 1.250 1.250 2.000 2.500 1.375 0.000 1.500 1.375 2.500 1.250 1.250 1.500 2.625d1 2.000 3.000 2.750 3.000 2.000 1.625 1.750 0.000 2.125 1.625 1.750 1.125 1.375 1.625d2 1.750 1.250 1.500 1.625 1.750 1.625 2.000 1.625 0.000 2.750 1.875 1.750 2.250 1.625d3 2.000 1.125 1.250 1.625 1.500 2.250 3.000 1.250 2.875 0.000 1.375 1.875 2.125 1.625d4 1.750 1.375 1.125 1.625 1.250 1.625 1.500 1.500 1.625 1.625 0.000 1.375 1.125 1.375e1 1.250 1.125 1.375 1.500 1.625 1.625 1.250 1.250 3.125 2.250 1.250 0.000 3.500 2.125e2 1.500 1.250 1.125 1.500 2.250 2.375 1.750 1.375 3.125 2.750 1.000 2.875 0.000 1.875e3 3.000 2.000 2.000 3.125 3.000 2.500 2.500 1.500 1.375 1.625 0.875 1.500 1.750 0.000
Note: Errors of gap ratio (%) = 1nðn�1Þ
Pni¼1Pn
j¼1gijq
c �gijðq�1Þc
�� ��gijq
c� 100% ¼ 4:89% < 5% (see Eq. (1)), less than 5%, i.e., significant confidence is 95.11%, where q = 8 denotes the number
of experts and tqij is the average influence of criterion i on criterion j, and n denotes number of criteria; here when n = 14, n � n matrix deducts the diagonal elements n; the
number of gap ratio elements is n(n � 1) = 14 � 13.
W.-Y. Chiu et al. / Knowledge-Based Systems 37 (2013) 48–61 59
achieve the aspiration level (zero gaps) in the performance of eache-store. This is an important finding in this study. The proposedmodel is suitable for dealing with any complex decision-making is-sues with interdependent criteria. The study has established a cau-sal-effect model of the effect of e-store management and verifiedthe efficiency of the relational structure model using satisfactorystatistical techniques.
Previous e-store research has focused on improving context anddesign, whereas the current study confirms that e-stores are usefuland that satisfying customers’ needs and giving perfect post-pur-chase service are very important to e-stores’ success. This studyalso indicates that the performance of the three selected e-storesis rather unsatisfactory in this regard. Their managers must there-fore bridge existing gaps in understanding the customers’ needs toimprove the e-stores’ performance.
This idea is a new approach to solving real-world problems(Tzeng’s group). First, the traditional model assumes that the crite-ria are independent from the hierarchical structure, but the rela-tionships between dimensions and criteria are usuallyinterdependent in the real world. Second, the relatively good solu-tion provided by the existing alternatives is replaced by aspirationlevels to fit today’s competitive markets. Finally, the goal is to focusnot only on ‘‘influence’’, ‘‘assessment’’, ‘‘ranking’’ and ‘‘selection’’but also on ‘‘improvement’’ and ‘‘create strategies’’ to improve e-store performances.
We hope that this article will contribute to enhancing the effi-ciency of e-stores’ marketing strategies. The results of this analysisshould help managers to decide how to implement their e-store
business and marketing strategies more effectively. As such, thisresearch provides an in-depth understanding of the managementapproach for e-store business.
Appendix A
Tables A1 and A2.
References
[1] C. Albert, Service loyalty: the effects of service quality and the mediating roleof customer satisfaction, European Journal of Marketing 36 (2002) 811–828.
[2] A. Asllani, A. Lari, Using genetic algorithm for dynamic and multiple criteriaweb-site optimizations, European Journal of Operational Research 176 (2007)1767–1777.
[3] S. Azman, B. Gomišcek, Asymmetric and nonlinear impact of attribute-levelperformance on overall customer satisfaction in the context of car servicing offour European automotive brands in Slovenia, Organizacija 45 (2012) 75–86.
[4] S. Ba, R. Kalakota, A.B. Whinston, Using client-broker-server architecture forIntranet decision support, Decision Support Systems 19 (1997) 171–192.
[5] G. Balabanis, N. Reynolds, A. Simintiras, Bases of e-store loyalty: perceivedswitching barriers and satisfaction, Journal of Business Research 59 (2006)214–224.
[6] H.H. Bauer, M. Grether, M. Leach, Building customer relations over the Internet,Industrial Marketing Management 31 (2002) 155–163.
[7] W.O. Bearden, J.E. Teel, Selected determinants of consumer satisfaction andcomplaint reports, Journal of Marketing Research 20 (1983) 21–28.
[8] D.J. Cahill, The managerial implications of the learning organization: a newtool for internal marketing, Journal of Services Marketing 9 (1995) 43–51.
[9] A. Carini, V. Sehgal, P.F.Evans, D. Roberge, European Online Retail Forecast,2010–2015. February 28, 2011. <http://www.forrester.com/rb/Research/european_online_retail_forecast%2C_2010_to_2015/q/id/58597/t/2>.

60 W.-Y. Chiu et al. / Knowledge-Based Systems 37 (2013) 48–61
[10] E.C. Chang, Y.F. Tseng, Research note: e-store image, perceived value andperceived risk. Journal of Business Research, in press, <http://www.sciencedirect.com/science/article/pii/S0148296311001998>.
[11] H.H. Chang, S.W. Chen, The impact of online store environment cues onpurchase intention: trust and perceived risk as a mediator, Online InformationReview 32 (2008) 818–841.
[12] H.H. Chang, S.W. Chen, Consumer perception of interface quality, security, andloyalty in electronic commerce, Information & Management 46 (2009) 411–417.
[13] C.H. Chen, G.H. Tzeng, Creating the aspired intelligent assessment systems forteaching materials, Expert Systems with Applications 38 (2011) 12168–12179.
[14] F.H. Chen, T.S. Hsu, G.H. Tzeng, A balanced scorecard approach to establish aperformance evaluation and relationship model for hot spring hotels based ona hybrid MCDM model combining DEMATEL and ANP, International Journal ofHospitality Management 30 (2011) 908–932.
[15] S.-C. Chen, The customer satisfaction–loyalty relation in an interactive e-service setting: the mediators, Journal of Retailing and Consumer Services 19(2012) 202–210.
[16] S.C. Chen, G.S. Dhillon, Interpreting dimensions of consumer trust in e-commerce, Information Technology and Management 4 (2003) 303–318.
[17] Y.C. Chen, H.P. Lien, G.H. Tzeng, Measures and evaluation for environmentwatershed plans using a novel hybrid MCDM model, Expert Systems withApplications 37 (2010) 926–938.
[18] Y.C. Chen, H.P. Lien, G.H. Tzeng, L.S. Yang, Fuzzy MCDM approach for selecting thebest environment-watershed plan, Applied Soft Computing 11 (2011) 265–275.
[19] Z. Chen, A.J. Dubinsky, A conceptual model of perceived customer value in e-commerce: a preliminary investigation, Psychology and Marketing 20 (2003)323–347.
[20] J.S. Chiou, L.Y. Pan, Antecedents of internet retailing loyalty: differencesbetween heavy versus light shoppers, Journal of Business and Psychology 24(2009) 327–339.
[21] W.Y. Chiu, G.H. Tzeng, H.L. Li, Improving the e-store business model forsatisfying customers’ needs using a hybrid MCDM combined DANP with greyrelational model, in: The Second KES International Symposium IDT 2010,Publishing, Baltimore, USA, pp. 113–121.
[22] Chloe, European online shopping to grow by 12% a year: predictions. February28, 2012 <http://internetretailing.net/2012/02/european-online-shopping-to-grow-by-12-a-year-predictions/>.
[23] K.S. Chon, The role of destination image in tourism: a review and discussion,Tourism Review 45 (1990) 2–9.
[24] A. Ellinger, H. Shin, W.M. Northington, F.G. Adams, D. Hofman, K. O’Marah, Theinfluence of supply chain management competency on customer satisfactionand shareholder value, Supply Chain Management: An International Journal 17(2012) 249–262.
[25] A.E. Ellinger, D.F. Lynch, J.D. Hansen, Firm size, web site content, and financialperformance in the transportation industry, Industrial Marketing Management32 (2003) 177–185.
[26] S. Elliott, Electronic Commerce: B2c Strategies and Models, John Wiley & SonsInc., New York, NY, USA, 2002.
[27] E.C. Fransi, F.M. Viadiu, A study of e-retailing management: analysing theexpectations and perceptions of Spanish consumers, International Journal ofConsumer Studies 31 (2007) 613–622.
[28] C. Gan, M. Clemes, V. Limsombunchai, A. Weng, A logit analysis of electronicbanking in New Zealand, International Journal of Bank Marketing 24 (2006)360–383.
[29] C. Gan, V. Limsombunchai, M. Clemes, A. Weng, Consumer choice prediction:artificial neural networks versus logistic models, 2005 <http://hdl.handle.net/10182/329>.
[30] J. Ganesh, K.E. Reynolds, M. Luckett, N. Pomirleanu, Online shoppermotivations, and e-store attributes: an examination of online patronagebehavior and shopper typologies, Journal of Retailing 86 (2010) 106–115.
[31] D.K. Gauri, A. Bhatnagar, R. Rao, Role of word of mouth in online store loyalty,Communications of the ACM (Association for Computing Machinery) 51(2008) 89–91.
[32] M. Gill, P.F. Evans, V. Sehgal, M.D. Costa, European Online Retail Forecast:2011–2016. February 27, 2012 <http://www.forrester.com/European+Online+Retail+Forecast+2011+To+2016/fulltext/-/E-RES60745?docid=60745&src=RSS_2&cm_mmc=Forrester-_-RSS-_-Document-_-23>.
[33] S. Gounaris, S. Dimitriadis, V. Stathakopoulos, An examination of the effects ofservice quality and satisfaction on customers’ behavioral intentions in e-shopping, Journal of Services Marketing 24 (2010) 142–156.
[34] J. Hanlan, D. Fuller, S. Wilde, Destination decision making: the need for astrategic planning and management approach, Tourism Planning &Development 3 (2006) 209–221.
[35] J. Hillebrand, D. Olszewski, R. Sedefov, Legal highs on the internet, SubstanceUse & Misuse 45 (2010) 330–340.
[36] J.W.R. Ho, C.L. Tsai, G.H. Tzeng, S.K. Fang, Combined DEMATEL technique witha novel MCDM model for exploring portfolio selection based on CAPM, ExpertSystems with Applications 38 (2011) 16–25.
[37] Y.H. Hung, S.C.T. Chou, G.H. Tzeng, Knowledge management adoption andassessment for SMEs by a novel MCDM approach, Decision Support Systems 51(2011) 270–291.
[38] D.J.F. Jeng, G.H. Tzeng, Social influence on the use of clinical decision supportsystems: revisiting the unified theory of acceptance and use of technology bythe fuzzy DEMATEL technique, Computers and Industrial Engineering 62(2012) 819–828.
[39] A. Khare, S. Rakesh, Antecedents of online shopping behavior in india: anexamination, Journal of Internet Commerce 10 (2011) 227–244.
[40] D.J. Kim, Y.I. Song, S.B. Braynov, H.R. Rao, A multidimensional trust formationmodel in B-to-C e-commerce: a conceptual framework and content analyses ofacademia/practitioner perspectives, Decision Support Systems 40 (2005) 143–165.
[41] I.M. Langella, J. Carbo, V. Dao, An examination of the symbiosis betweencorporations and society with lessons for management education and practice,Global Virtue Ethics Review 6 (2012) 51–82.
[42] J.N. Lee, S.M. Pi, R.C. Kwok, M.Q. Huynh, The contribution of commitment valuein internet commerce: an empirical investigation, Journal of the Associationfor Information Systems 4 (2003) 39–64.
[43] W.-Y. Liang, C.-C. Huang, T.-L. Tseng, Y.-C. Lin, J. Tseng, The evaluation ofintelligent agent performance — an example of B2C e-commerce negotiation,Computer Standards & Interfaces 34 (2012) 439–446.
[44] C.C. Lin, H.Y. Wu, Y.F. Chang, The critical factors impact on online customersatisfaction, Procedia Computer Science 3 (2011) 276–281.
[45] C.L. Lin, M.S. Hsieh, G.H. Tzeng, Evaluating vehicle telematics system by using anovel MCDM techniques with dependence and feedback, Expert Systems withApplications 37 (2010) 6723–6736.
[46] J. Liou, G.H. Tzeng, C.C. Hsu, W.C. Yeh, Reply to comment on using a modifiedgrey relation method for improving airline service quality, TourismManagement 33 (2012) 719–720.
[47] J.J.H. Liou, Developing an integrated model for the selection of strategicalliance partners in the airline industry, Knowledge-Based Systems 28 (2012)59–67.
[48] J.J.H. Liou, C.Y. Tsai, R.H. Lin, G.H. Tzeng, A modified VIKOR multiple-criteriadecision method for improving domestic airlines service quality, Journal of AirTransport Management 17 (2010) 57–61.
[49] J.J.H. Liou, G.H. Tzeng, C.Y. Tsai, C.C. Hsu, A hybrid ANP model in fuzzyenvironments for strategic alliance partner selection in the airline industry,Applied Soft Computing 11 (2011) 3515–3524.
[50] C.H. Liu, G.H. Tzeng, M.H. Lee, Strategies for improving cruise product sales inthe travel agency using hybrid MCDM models, The Service Industries Journal(2011) 1–22.
[51] C.H. Liu, G.H. Tzeng, M.H. Lee, Improving tourism policy implementation – theuse of hybrid MCDM models, Tourism Management 33 (2012) 413–426.
[52] S. Mulpuru, V. Sehgal, P.F. Evans, A. Hoar, D. Roberge, US Online Retail Forecast,2011–2016. February 27, 2012, <http://www.forrester.com/US+Online+Retail+Forecast+2011+To+2016/fulltext/-/E-RES60672?docid=60672>.
[53] S. Mulpuru, V. Sehgal, P.F. Evans, D. Roberge, US Online Retail Forecast, 2010–2015. February 28, 2011, <http://www.forrester.com/rb/Research/us_online_retail_forecast%2C_2010_to_2015/q/id/58596/t/2>.
[54] C. Nistor, R. Nistor, M.-C. Muntean, E-commerce: winners’ choice, in:Proceedings of the 10th WSEAS International Conference on AppliedComputer Science, Publishing, Japan, 2010, pp. 298–303.
[55] R.L. Oliver, Satisfaction: A Behavioral Perspective on the Consumer, second ed.,M.E. Sharpe, Inc., New York, 2010.
[56] ONS, Retail sales:mixed picture continues. April 21, 2011, <http://www.statistics.gov.uk/default.asp>.
[57] S. Opricovic, Multicriteria optimization of civil engineering systems, Faculty ofCivil Engineering. Publishing, Belgrade, 1998.
[58] S. Opricovic, G.H. Tzeng, Compromise solution by MCDM methods: acomparative analysis of VIKOR and TOPSIS, European Journal of OperationalResearch 156 (2004) 445–455.
[59] Y.P. OuYang, H.M. Shieh, G.H. Tzeng, A VIKOR technique based on DEMATELand ANP for information security risk control assessment. InformationSciences, in press, <http://www.sciencedirect.com/science/article/pii/S0020025511004695>.
[60] T. Ozaki, M.C. Lo, E. Kinoshita, G.H. Tzeng, Decision-making for the bestselection of suppliers by using minor ANP, Journal of Intelligent Manufacturing(2011) 1–8.
[61] M. Pachauri, Researching online consumer behaviour: current positions andfuture perspectives, Journal of Customer Behaviour 1 (2002) 269–300.
[62] R.R. Peterson, W.V. Grembergen, Integration strategies and tactics forinformation technology governance, Strategies for Information TechnologyGovernance, Idea Group Inc. (IGI), 2003, pp. 37–80.
[63] G.L. Polites, C.K. Williams, E. Karahanna, L. Seligman, A theoretical frameworkfor consumer e-satisfaction and site stickiness: an evaluation in the context ofonline hotel reservations, Journal of Organizational Computing and ElectronicCommerce 22 (2012) 1–37.
[64] M.E. Ponter, Competitive Advantage: Creating and Sustaining SuperiorPerformance, Free Press, New York, 1998.
[65] M.E. Porter, Strategy and the internet, Harvard Business Review 79 (2001) 62–78.[66] J. Reedy, S. Schullo, Electronic Marketing: Integrating Electronic Resources into
the Marketing Process, second ed., Thomson Learning, Ohio, USA, 2004.[67] F.J. Riggins, H.S.S. Rhee, Toward a unified view of electronic commerce,
Communications of the ACM (Association for Computing Machinery) 41(1998) 88–95.
[68] M.O.K. Robert, T. McEachern, Web-based customer decision support systems,Communications of the ACM (Association for Computing Machinery) 41(1998) 71–78.
[69] T. Rueter, E-retail spending to increase 62% by 2016. February 27, 2012,<http://www.internetretailer.com/2012/02/27/e-retail-spending-increase-45-2016>.

W.-Y. Chiu et al. / Knowledge-Based Systems 37 (2013) 48–61 61
[70] T.L. Saaty, Decision Making with Dependence and Feedback: The AnalyticNetwork Process: The Organization and Prioritization of Complexity, RWSPublications, Pittsburgh, PA, 1996. pp. 362–370.
[71] R.A. Shang, Y.C. Chen, L. Shen, Extrinsic versus intrinsic motivations forconsumers to shop on-line, Information & Management 42 (2005) 401–413.
[72] Y.C. Shen, G.T.R. Lin, G.H. Tzeng, Combined DEMATEL techniques with novelMCDM for the organic light emitting diode technology selection, ExpertSystems with Applications 38 (2011) 1468–1481.
[73] J. Sheth, A model of industrial buyer behavior, Journal of Marketing 37 (1973)50–56.
[74] K.O. Siddiqi, Interrelations between service quality attributes, customersatisfaction and customer loyalty in the retail banking sector in Bangladesh,International Journal of Business and Management 6 (2011) 12–36.
[75] M. Singh, E-services and their role in B2C e-commerce, Managing ServiceQuality 12 (2002) 434–446.
[76] D.M. Szymanski, R.T. Hise, e-Satisfaction: an initial examination, Journal ofRetailing 76 (2000) 309–322.
[77] M.T. Tang, G.H. Tzeng, Fuzzy MCDM model for pricing strategies in the internetenvironment, Journal of Commercial Modernization 1 (1998) 19–34.
[78] M.T. Tang, G.H. Tzeng, S.W. Wang, A hierarchy fuzzy MCDM method forstudying electronic marketing strategies in the information service industry,Journal of International Information Management 8 (1999) 1–22.
[79] C. Tarantola, P. Vicard, I. Ntzoufras, Monitoring and improving greek bankingservices using bayesian networks: an analysis of mystery shopping data(2012).
[80] P.L. To, C. Liao, T.H. Lin, Shopping motivations on internet: a study based onutilitarian and hedonic value, Technovation 27 (2007) 774–787.
[81] W.-C. Tsao, Y.-L. Tseng, The impact of electronic-service quality on onlineshopping behaviour, Total Quality Management & Business Excellence 22(2011) 1007–1024.
[82] A.C.B. Tse, F. Yim, Factors affecting the choice of channels – online vs.conventional, Journal of International Consumer Marketing 14 (2002) 137–152.
[83] G.H. Tzeng, C.Y. Huang, Combined DEMATEL technique with hybrid MCDMmethods for creating the aspired intelligent global manufacturing & logisticssystems, Annals of Operations Research (2011) 1–32.
[84] G.H. Tzeng, M.H. Teng, J.J. Chen, S. Opricovic, Multicriteria selection for arestaurant location in Taipei, International Journal of Hospitality Management21 (2002) 171–187.
[85] Y.L. Wang, G.H. Tzeng, Brand marketing for creating brand value based on aMCDM model combining DEMATEL with ANP and VIKOR methods, ExpertSystems with Applications 39 (2012) 5600–5615.
[86] M. Warkentin, V. Sugumaran, R. Sainsbury, The role of intelligent agents anddata mining in electronic partnership management, Expert Systems withApplications, in press, <http://www.sciencedirect.com/science/article/pii/S0957417412007907>.
[87] W. Wei, J. Shen, S. Ji, Introducing mobile channel into electronic supply chain,in: The 3rd International Conference on Grid and Pervasive Computing,Publishing, 2008, pp. 121-126.
[88] R.E. Widing II, W.W. Talarzyk, Electronic information systems for consumers:an evaluation, Journal of Marketing Research 30 (1993) 125–141.
[89] Y.K. Wong, C.J. Hsu, A confidence-based framework for business to consumer(B2C) mobile commerce adoption, Personal and Ubiquitous Computing 12(2008) 77–84.
[90] J.H. Wu, Y.M. Wang, Development of a tool for selecting mobile shopping site:a customer perspective, Electronic Commerce Research and Applications 5(2006) 192–200.
[91] R. Yan, J. Wang, B. Zhou, Channel integration and profit sharing in thedynamics of multi-channel firms, Journal of Retailing and Consumer Services17 (2010) 430–440.
[92] J.L. Yang, G.H. Tzeng, An integrated MCDM technique combined withDEMATEL for a novel cluster-weighted with ANP method, Expert Systemswith Applications 38 (2011) 1417–1424.
[93] T.K. Yu, J.H. Seinfeld, Observability and optimal measurement location in lineardistributed parameter systems, International Journal of Control 18 (1973)785–799.
[94] M. Zeleny, Multiple Criteria Decision Making, McGraw-Hill Companies, 1982.pp. 83–93.
[95] J.F. Engel, R.D. Blackwell, P.W. Miniard, Consumer behavior, sixth ed., DrydenPress, Orlando, Fla., 1990.


![A compromise decision-making model based on VIKOR for ...scientiairanica.sharif.edu/article_3822_b2841f936bf758acedd0268982b8756f.pdf · VIKOR method was extended in 2007 [16-18].](https://static.fdocuments.in/doc/165x107/5e4cc704ccf51b698c5e279c/a-compromise-decision-making-model-based-on-vikor-for-vikor-method-was-extended.jpg)


![Untitled-2 [] · Title: Untitled-2 Author: danp Created Date: 5/11/2012 4:11:08 PM](https://static.fdocuments.in/doc/165x107/602415fd0027e0187b0c7c04/untitled-2-title-untitled-2-author-danp-created-date-5112012-41108-pm.jpg)


