A New Era of Growth and Value Creation - listed company · 2020-02-04 · 2 SNG 200203 IVL Capital...
99
Capital Markets Day Bangkok 4 February, 2020 A New Era of Growth and Value Creation
Transcript of A New Era of Growth and Value Creation - listed company · 2020-02-04 · 2 SNG 200203 IVL Capital...

Capital Markets Day
Bangkok
4 February, 2020
A New Era of Growth
and Value Creation

2200203 IVL Capital Markets Day ...SNG
Disclaimer
This presentation contains “forward-looking statements” of Indorama Ventures Public Company Limited (the “Company”) that relate to future
events, which are, by their nature, subject to significant risks and uncertainties. All statements, other than statements of historical fact contained
herein, including, without limitation, those regarding the future financial position and results of operations, strategy, plans, objectives, goals and
targets, future developments in the markets where the Company participates or is seeking to participate and any statements preceded by,
followed by or that include the words “target”, “believe”, “expect”, “aim”, “intend”, “will”, “may”, “anticipate”, “would”, “plan”, “could”, “should,
“predict”, “project”, “estimate”, “foresee”, “forecast”, “seek” or similar words or expressions are “forward-looking statements”.
Such forward-looking statements involve known and unknown risks, uncertainties and other important factors beyond the Company’s control
that could cause the actual results, performance or achievements of the Company to be materially different from the future results, performance
or achievements expressed or implied by such forward-looking statements. These forward-looking statements are based on numerous
assumptions regarding the Company’s present and future business strategies and the environment in which the Company will operate in the
future and are not a guarantee of future performance.
Such forward-looking statements speak only as at the date of this presentation, and the Company does not undertake any duty or obligation to
supplement, amend, update or revise any such statements. The Company does not make any representation, warranty or prediction that the
results anticipated by such forward-looking statements will be achieved.
The Company makes no representation whatsoever about the opinion or statements of any analyst or other third party. The Company does not
monitor or control the content of third party opinions or statements and does not endorse or accept any responsibility for the content or the use
of any such opinion or statement.
3200203 IVL Capital Markets Day ...SNG
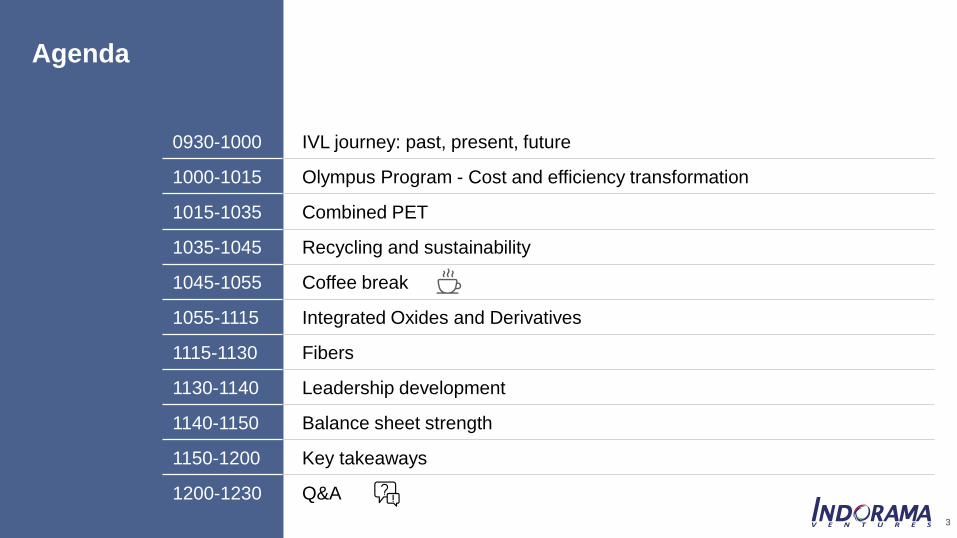
0930-1000 IVL journey: past, present, future
1000-1015 Olympus Program - Cost and efficiency transformation
1015-1035 Combined PET
1035-1045 Recycling and sustainability
1045-1055 Coffee break
1055-1115 Integrated Oxides and Derivatives
1115-1130 Fibers
1130-1140 Leadership development
1140-1150 Balance sheet strength
1150-1200 Key takeaways
1200-1230 Q&A
Agenda

4
Fix the cover slide
Collective team / journey
IVL’S JOURNEY: PAST, PRESENT, FUTURE
Mr. Aloke Lohia
Group Chief Executive Officer

5200203 IVL Capital Markets Day ...SNG
IVL is the world’s leading PET supplier with a diversified asset base and
business portfolio serving attractive customer segments
One of the world’s leading PET
producers with
Presence in
33 countriesConsolidated
revenues of
$13.3B (LTM 3Q19)
119Manufacturing
facilities
24,000+employees
Note: All figures are as of LTM 3Q2019, include the Spindletop business (Huntsman Integrated EO/PO acquisition)
Source: IVL Business Plan
1 in 2premium baby diaper
made from our Fibers
1 in 4airbags made from
our Yarns
1 in 5PET bottles made
from our PET resin
2nd LargestEthylene Oxide producer in
the US (post-Spindletop)

6200203 IVL Capital Markets Day ...SNG
2006 2010 2014 2018 LTM 3Q19 LTM 3Q19
Core EBITDA ($B)
Combined PET* Integrated oxide & derivatives (IOD) Fibers
Over the past decade, IVL has successfully diversified and delivered growth
Note: *Combined PET includes PET, PET HVA, PTA, PX, recycling, packaging, and specialty chemical; COMA stands for contribution margin (revenues less raw materials less variable costs)
Source: IVL Financials
Contribution margin (COMA)$B
0.4
0.6
1.4
0.05
1.6
incl. Spindletop
$1.2B
$2.6B
$3.5B
1.3
$2.8B

7200203 IVL Capital Markets Day ...SNG
We built a vertically integrated and diverse business, centered around PET
PX, PTA, IPA
Lifestyle Hygiene
IOD*26% COMA
contribution***
Nylon
Polyester
PP/PE
Rayon
Packaging
EO/EGEthyleneCracker
Ethane(from Shale
Gas)
PO/OxyfuelLAB/Surfactants/
EthanolaminesMEG
PET
Fibers24% COMA
contribution***
Combined
PET**50% COMA
contribution***
+Spindletop
Note: *IOD = Integrated Oxides and Derivatives; **Combined PET includes PET, PET HVA, PTA, PX, recycling, packaging, and specialty chemical;
***COMA (contribution margin) contribution is calculated using IVL pro forma including Spindletop financials as of LTM 3Q19
Source: IVL Analysis
Recycling
Mobility
Commodity HVALeveraging the scale of commodity business and expand into HVA products
Fiber

8200203 IVL Capital Markets Day ...SNG
PET is the preferred beverage packaging product given its superior
economics and lower carbon footprint
PET is the main non-alcoholic beverage packaging
material, growing at 5% per annum
PET is more cost-effective, with a lower carbon
footprint and is safe for transportation*
Note: *Price and GHG ratio based on Lifecycle Inventory Analysis, which includes total energy, raw material, air and water emissions and total solid waste produced from cradle-to-disposal/recycling of product
Source: Euromonitor; Franklin Associates; Cleanmetrics Corp; Goldman Sachs Global Investment Research
Price ratio (cents per bottle, PET = 1X):
1X 1.6X
PET bottle Aluminum can Glass bottle
GHG ratio (GHG per 100 Koz liquid, PET = 1X):
1.5X 2.2X
PET bottle Aluminum can Glass bottle
1.7X
1X
PET bottles
and jars
Liquid
cartons
Glass
Flexible packaging
Metal
Other rigid plastic
2005 2018
40%
50%
0.8
1.2
Non-alcoholic beverage packaging
by material type (T units)

9200203 IVL Capital Markets Day ...SNG
Common
Uses
Symbol
Recyclable(based on
mechanical
recycling)
Commonly Commonly Almost never Sometimes Sometimes Almost never
Circular
recycling
Fully
circular
Circular(for non-dyed)
Downcycled*(for colored)
n.a.Circular(emerging)
Circular(emerging)
n.a.
Note: *Colored HDPE usually downcycled due to complexities in coloring and appearance of rHDPE flakes; downcycled means of lower quality and functionality than the original material.
Source: Our World in Data (2018); Plastics recycling: challenges and opportunities - Philosophical Transactions of the Royal Society B: Biological Sciences
PET HDPE PSPVC LDPE PP
PET is 100% recyclable and fully circular, unlike other plastics

10200203 IVL Capital Markets Day ...SNG
The Fibers market has grown strongly; IVL is a leader in many high-value,
attractive spaces
Note: *Consumption data excludes inorganic fibers (e.g. carbon fibers, glass fibers and other composite fibers)
Source: Wood Mackenzie, IVL Financials
#1
#1
#1
#2
Polyester fibers have grown at 6%
per annum & substituted cotton
…and has created leadership
positions in several attractive spaces
40%
55%
2005 2018
Global staple & filament fiber consumption* (mt)
Polyester
Cotton
Cellulosic
Nylon
PP
Wool
Acrylic
global supplier premium
baby diapers market
global integrated
supplier of airbag fabrics
global supplier of
premium safety fibers
total solution provider to
global tire industry
IVL has built a HVA business on
the scale commodity platform…
65
100
60
500
20
1,020
2005 2018
IVL’s fiber capacity (kt)
Necessities
HVA
1,520
80

11200203 IVL Capital Markets Day ...SNG
IOD is a cost-advantaged business due to the advantage of US shale and is
emerging as a second core for IVL
US MEG producers have a cost advantage
North
America
Ethane
Global integrated MEG cash cost
$/t, North America Ethane = 1X
20% 40% 60% 80% 100%
Cumulative Capacity (%)
Middle
East
Ethane
Mid
dle
Ea
st N
ap
hth
a
So
uth
Ea
st A
sia
Nap
hth
a
North
East Asia
Naphtha
CT
ME
G
West E
uro
pe
Nap
hth
a
Mixed
Feed
(Rest of
World)
Note: *Average contribution margin 2015-19, with 100% ethylene integration and 20% propylene integration; EG = Ethylene Glycol; EO = Ethylene Oxide; EOA = Ethanolamines; PO = Propylene Oxide
IOD= Integrated oxides and derivatives and include Ethylene, Propylene, EO, EG (MEG and others), Surfactants (including EOA and LAB) and PO, MTBE
Source: IHS Markit, Wood Mackenzie, IVL Analysis
0.8X
1.0X
1.8X
2.1X
~1.7X
0% 20% 40% 60% 80% 100%0% 20% 40% 60% 80% 100%0% 20% 40% 60% 80% 100%
IVL Production Volume (%)
1X
1.5X
2.0X
3.1X
MTBE
Opportunity from 100% Propylene Integration
20% Propylene Integration (current business)
EO PO
EG
EOA
Su
rfa
cta
nts
1.4X
IVL contribution margin (2015-19 average)*
%, EG = 1X
Further opportunity beyond EG and EO to capture
higher margins downstream
Pro
sp
eri
ty S
urf
acta
nts

12200203 IVL Capital Markets Day ...SNG
IVL’s success is predicated on a time-tested recipe to drive efficiency in our
acquisitions (SK and Tuntex case studies)
Note: *Invested capital = total capex made till Sep2019 plus net working capital as of Sep2019;
Financial results and operational metrics are calculated over the period from 2011 to LTM 3Q19 for SK Poland & Indonesia’s and from 2009 to LTM 3Q19 for IPI Rayong
Source: IVL Financials
SK acquisition (Poland & Indonesia)
in 2011
Tuntex Thailand acquisition
(IPI Rayong) in 2008
Diversified the business
by adding PET and
packaging capacity
Transformed portfolio and
expanded high value-add
fibers capacity by 60%
1 2Acquired a distressed company in bankruptcy
Restarted fibers production in 2009
Acquired in 2011; 1st entry into Poland and Indonesia
Produced PET and Fibers
Consolidated fibers
sites in Indonesia
Conducted cost
benchmarking and
debottlenecking
16%ROCE
~2% of IVL’s capital
employed
+15%Capacity
$380MAccumulated
EBITDA with invested
capital of $250M
-24%Lower conversion
cost per ton
+26%Capacity
$280M*Accumulated
EBITDA with invested
capital of $170M
13%ROCE
~2% of IVL’s capital
employed

13200203 IVL Capital Markets Day ...SNG
This recipe enables IVL to sustain returns through the peaks and troughs of
the chemicals cycle
Note: *IVL Combined PET Spread exclude the volumes of PTA and PX; Industry Integrated PET = PET spread + 0.86*PTA spread; PET spread = PET FOB China - (0.86*PTA Spot CFR China + 0.34*MEG ASP);
PTA spread = PTA ICIS Spot, CFR China - 0.67 PX ASP:ACP 50:50; Combined PET include PET, PET HVA, PTA, PX, recycling, packaging, and specialty chemical;
Operating cash flow return on investment = OCF / Net operating capital employed (excluding Spindletop); For assets acquired within the year or LTM, the EBIT is annualized to capture the full year impact
Source: IHS Markit, PCI, Platts, ICIS
Global PET producer with
PTA integration in Asia & Europe
+ PTA integration in NA &
IPA integration
ROCE
Operating Cash Flow Return on
Investment
14%
7% 6%8% 10% 11% 12%
14%
10%11%13%
8%
17% 18%15% 15% 14%
18%
Industry Integrated PET
Spread ($/t)
251
IVL Combined PET*
Spread ($/t)
393
2011 2012 2013 2014 2015 2016 2017 2018 LTM 3Q19

14200203 IVL Capital Markets Day ...SNG
IVL remains well positioned to benefit from key trends affecting the
chemical industry
4
2
3
Industry outlook IVL position
1
Note: IVL America net capital employed % is calculated based on IVL Sep2019 including Spindletop
Source: IVL Financials
Plastics Circularity
Growing pressure on plastics use and disposal
from consumer; Mandates on recycling targets
Chemical cycle downturn
Petrochemicals industry facing a period of
overcapacity, resulting in lower margins
Target to build a leading PET
recycling business, leveraging our #1
position in PET
Low-cost asset base and diversification
allows IVL to outperform peers and remain
resilient amid the slowdown
China self-sufficiency
China heavily investing in domestic capacity of
key petrochemicals across the value chain
Global asset-base outside China
provides strategic hedge against
overcapacity in China
Strong demand in North America
Overall GDP growth and a growing demand for
chemicals
Strong product portfolio in America
with ~60% net capital employed serving
the packaging, lifestyle hygiene and
safety need of consumers

15200203 IVL Capital Markets Day ...SNG
Note: Integrated PET Spread = PET Spread + 0.86 PTA Spread; PET spread = PET ICIS Spot, FOB China – 0.86 PTA ICIS Spot, CFR China – 0.34 MEG ICIS Spot, CFR China;
PTA spread = PTA ICIS Spot, CFR China - 0.67 PX ASP:ACP 50:50; PX spread = PX ASP:ACP 50:50 – Naphtha; MEG spread = MEG ASP - 0.58*Ethylene Cash Cost (Naphtha); PE spread = Asia PE- Naphtha
Source: IHS Markit, PCI, Platts, ICIS
Integrated PET industry spread ($/t) MEG industry spread ($/t)
PX industry spread ($/t)
185
-
100
200
300
400
500
20
09
20
10
20
11
20
12
20
13
20
14
20
15
20
16
20
17
1Q
18
2Q
18
3Q
18
4Q
18
1Q
19
2Q
19
3Q
19
4Q
19
Integrated PET Average
115
-
150
300
450
600
750
20
09
20
10
20
11
20
12
20
13
20
14
20
15
20
16
20
17
1Q
18
2Q
18
3Q
18
4Q
18
1Q
19
2Q
19
3Q
19
4Q
19
MEG Industry Spread Average
259
-
200
400
600
20
09
20
10
20
11
20
12
20
13
20
14
20
15
20
16
20
17
1Q
18
2Q
18
3Q
18
4Q
18
1Q
19
2Q
19
3Q
19
4Q
19
PX Industry Spread Average
Avg. = 252
Avg. = 431
Avg. = 375
What is clear is that we are currently at a low point in the chemical cycle
PE industry spread ($/t)
307
-
200
400
600
800
20
09
20
10
20
11
20
12
20
13
20
14
20
15
20
16
20
17
1Q
18
2Q
18
3Q
18
4Q
18
1Q
19
2Q
19
3Q
19
4Q
19
PE Industry Spread Average
Avg. = 550

16200203 IVL Capital Markets Day ...SNG
We have 5 strategic priorities to steer the business through the cycle
and beyond
Vision
Values
Financial
Aspiration
Differen-
tiators
Strategic
priorities
Metrics
To be a world-class chemical company making great products for society
Double-digit ROCE in each core business
Top decile TSR relative to peers
Lowest cost producer
in core products
Industry-leading
margins
% of high-potential
talent
Share of EBITDA from
adjacency businesses
Leading rPET player
in core markets
ScaleGlobal PET leader
Serial M&A Programmatic, buy
low, capture synergies
Global-local Close to customers in
global core markets
IntegratedValue chain
margin capture
Diversified Through cycle
resilient portfolio
“Our people make
the difference”
“We see change
as an opportunity”
“Diversity is
our strength”
“We are
responsible”
“The customer
is why we exist”
Recycling
LeadershipBuild leading rPET
business; set new bar
for sustainability
Adjacency
GrowthPursue organic and
bolt-on growth in
attractive adjacencies
Leadership
DevelopmentInvest in and develop the
best management team in
the industry
Thrusts – Diversification and Circular Economy EnablerMust do
Cost
TransformationAccelerate performance
through cost optimization
Asset
Full PotentialFocus on commercial
excellence to grow
revenues and margin
2 3 4 5
Strong cashflowacross the cycle
Source: IVL Business Plan
1

17200203 IVL Capital Markets Day ...SNG
Cost & Cash Optimization - IVL launched Olympus, a ~$350M cost
transformation program
ERPEnabling IVL to
manage core
operational
processes
Systems
Corporate-Led Initiatives Business Segment-Led Initiatives
$35-40M
2023 run-rate EBITDA Impact $MNote: *Includes deployment of global business solution across finance, IT and HR, as well as a broader transformation initiative of the finance function; **Combined PET includes PET, PET HVA, PTA, PX, recycling,
packaging, and specialty chemical; **Does not include savings from raw materials discounts (direct procurement) captured by 2023; ***Excludes Project Prosperity (specialty surfactants)
Source: IVL Business Plan
Combined PET**$70-80MOptimizing supply chain management,
sourcing and manpower
IOD (incl. Spindletop)$40-50M***Integration synergies from Spindletop
Improving yield via process improvement
Backward integration of assets
Fibers$130-140MImproving yield via process improvement
Consolidation and integration of assets
Global
Business
Solutions* Improving
business efficiency
and decision
support
$25M
Digital Building and
enabling digital
organization
Trans-formation
$30-35M
1

18200203 IVL Capital Markets Day ...SNG
Asset Full Potential - We are maximizing the growth and margin potential
in each business
Combined PET Integrated Oxides
• Enhance PET product portfolio
including the single-pellet solution
• Expand packaging business
into new geographies and
segments
• Build a leading recycling
business with partnerships
across the value chain (collectors
to customers)
• Increase capacity of EO, PO
and MTBE to underpin volume
growth
• Backward integration into
the cracker to capture
integrated margins
• Expansion into new high value-
added segments e.g. surfactants
Fibers
• Grow capacity and market
share in high growth/high margin
segments
• Strengthen collaborations and
long-term agreements with key
customers
• Invest in R&D and innovation to
maintain competitive advantage
Source: IVL Business Plan
2

19200203 IVL Capital Markets Day ...SNG
Adjacency Growth - We continue to monitor adjacent growth opportunities
Integrated PET PET packaging
Integrated Oxides and Derivatives Fibers
Expand PET resin applications
in food and homecare
packaging1Enter PET beverage
packaging segment
(beyond preforms) 2Create integrated PET
packaging business with
attractive food, homecare,
pharma verticals
3
Build capacity and
capabilities in high
margin specialty
surfactants
4Expand footprint in
emerging markets
with high growth
potential
5Enter industrial and
medical markets for
polyester/nylon fibers 6Develop new
composite materials to
capture attractive profit
pool of carbon fiber
7
Organic growth Innovation & NPD Bolt-on acquisitions
Source: IVL Analysis
3

20200203 IVL Capital Markets Day ...SNG
2010 2018 2030F
Recycling Leadership – Recycling is a priority growth engine, with strong
projected financial returns
Note: *Europe market only considers EU28 countries which are member states of the European Union
Source: IVL Scenario Analysis, IVL Business Plan
Global PET demand (mt)
“To reinvent PET as a trusted and safe material”
750ktof recycling capacity committed to
Ellen MacArthur Foundation
~25%of IVL’s beverage PET portfolio in the West
12-14% ROCE
rPET drives long-term industry growth in PET IVL has put in place a recycling strategy
Vision
2025 Targets for IVL
17
26
42
+1
2010 2018 2030F
vPET rPET
North America & Europe* PET demand (mt)
89
12
+4
rPET volume change
+0.6+2
4

21200203 IVL Capital Markets Day ...SNG
Sustainability – IVL is also setting the standard for sustainability
KEY SUSTAINABILITY
AWARDS & RECOGNITIONS
4
Leading company in 2019 SET Index
ESG Disclosure Scores
ESG Rating: BB
• 2019 DJSI World and DJSI
Emerging Markets Indices
• #2 of global chemical companies
• SET Sustainability Awards 2018
Outstanding
• Thailand Sustainability Investment
2019
A constituent of the 2019 FTSE4Good Index
2019 Climate Change Rating: B
2018 Supply Chain Rating: B-
Overall ESG score: 68
Gold Recognition:
Top 3% of suppliers in all categories
#1 of global chemical companies
Overall ESG score: 4.6

22200203 IVL Capital Markets Day ...SNG
Leadership Development – Continued investment in our leadership team
Suchitra Lohia
Director
Aloke Lohia
GCEO
D K Agarwal
CEO – PET & IODUday Gill
CEO - Fibers
Sanjay Ahuja
CFO
Deepak Parikh
CSO
Roberto Bettini
CHRO
Indorama Management Council (IMC) Indorama Business Council (IBC) – next generation of leaders
5

23200203 IVL Capital Markets Day ...SNG
This focused strategy underpins our ambition to grow and sustain double-
digit ROCE through the peaks and troughs of the chemical cycle
Note: *Include Integrated PET, MEG, EO and IPA spreads; **Only include new recycling projects – growth of existing recycling assets is recorded under organic growth;
***Based on current committed capex plans 2023 and projected new recycling investments; projection includes EBITDA from holding company of $-12M
Source: IVL Business Plan, Industry Expert Interviews, IVL Analysis
• Spindletop with
Project Prosperity,
USA
• Gas Cracker, Lake
Charles, USA
• Corpus Christi, USA
• Recycling**
• Others
• Center-led initiatives
($90-100M)
• Segment-led
initiatives
($240-270M)
On-going
initiatives
15%
13-15%
ROCE%
IVL Core EBITDA ($B)
2018 Industry
spread drop*
IVL premium
and mix
effect
Cost
transformation
Organic
growth
Projects 2023 IVL
Management plan***
2.4-2.6
0.4
0.2
-0.61.4
• Organic volume
growth
• India PET
consolidation

24200203 IVL Capital Markets Day ...SNG
IVL will continue to grow and register healthy cash flow in the next 4 years
Note: *2023 volume excludes Spindletop’s captive production of EO, PO and cracker; **Debt service coverage ratio is ratio of EBITDA to debt servicing for interest and principal payments
Source: IVL Business Plan
1.3
2.3
1.6x
2.0x 1.9x
2.3x
2.7x
LTM 3Q19 2020F 2021F 2022F 2023F
Operating cash flow ($B) Debt service coverage ratio**
Overall financial performance
$1.3B
Ongoing
12 mt
$7.6B
9.8%
$2.4-2.6BEBITDA
~$350M
Net operating
capital
employed
ROCE
~17 mt*Volume
$10-11B
13-15%
Total cost
initiatives
LTM 3Q2019 2023

25200203 IVL Capital Markets Day ...SNG
Global PET producer
with PTA integration in
Asia & Europe
+ PTA integration in NA &
IPA integration
+ Gas cracker in the US,
Integrated EO and PO derivatives
(surfactants, PO/MTBE)
IVL expects to sustain strong cash flow and improve returns up to 2023
Note: *IVL Combined PET Spread excludes the volume of captive raw materials (PTA, PX); Integrated PET = PET spread + 0.86*PTA spread; PET spread = PET FOB China - (0.86*PTA Spot CFR China + 0.34*MEG ASP);
PTA spread = PTA ICIS Spot, CFR China - 0.67 PX ASP:ACP 50:50; Combined PET includes PET, PET HVA, PTA, PX, recycling, packaging, and specialty chemical;
Operating cash flow return on investment = OCF / Net operating capital employed (excluding Spindletop); For assets acquired within the year or LTM, the EBIT is annualized to capture the full year impact
Source: IVL Financials; IHS Markit; PCI; Platts; ICIS;
ROCEOperating Cash Flow Return on Investment
% of combined PET EBITDA
57% 54% 67% 68% 69% 74% 53% 52% 52% 50%
8% 10% 11% 12% 14%10% 9% 11% 13% 15%17% 18% 15% 15% 14%
18% 16% 18% 19% 21%
206 194 188 209
307
251 219 216 224 224
278 270
338
415
471
396
345 361 364 375
100
54 45 55 72 66 65 65 65 65
2014 2015 2016 2017 2018 LTM 3Q19 2020 2021 2022 2023
IVL Combined PET* Spread ($/t)
Integrated PET Industry Spread ($/t)
Crude Oil Price ($/barrel)
IVL Combined PET* Spread ($/t)
278 270
338
415
471
393
345 361 364 375
Integrated PET Industry Spread ($/t)
206 194 188 209
307
251 219 216 224 224
8% 10% 11% 12% 14%10% 9% 11% 13% 15%17% 18% 15% 15% 14% 18% 16% 18% 19% 21%

26200203 IVL Capital Markets Day ...SNG
0.1
0.2
0.4
0.3 0.3
0.3
0.9
1.0
1.4
1.3
1.1
0.8
0.6
2018 2019E Jan 3, 2020* Dec 2020F 2021F 2022F 2023F
• Net D/E ratio to remain
below the financial
covenants of 2.0x and
internal threshold of 1.5X
• IVL will deleverage the
balance sheet down with
D/E projected to be
below 1.0X from 2022
Note: *Jan 2020F CAPEX only includes Spindletop acquisition
Source: IVL Business Plan
Our strategy also enables IVL to deleverage our balance sheet over the next
3 years
Spindletop
acquisition
CAPEX Plan (in $B)
2.4
1.0
2.0
2.9
1.0 0.9
0.6
Fibers Growth CAPEX Maintenance CAPEX
Net Debt/Equity(x)
Combined PET Growth CAPEX IOD Growth CAPEX
Corporate Initiatives

27200203 IVL Capital Markets Day ...SNG
Our financial performance has been strong through the peaks and troughs of the
chemicals cycle, supported by an advantaged cost position and diversified portfolio2
1 IVL’s strong growth is predicated on a strategy of integration along the value chain
while building a scalable, attractive and resilient portfolio
Going forward, IVL will pursue 5 strategic themes: optimize costs, achieve asset full
potential, capture adjacency growth, seek recycling leadership and strengthen our
leadership bench
3
We expect to deliver savings of ~$350M by 2023 through Olympus, a cost
transformation program that we launched this year4
Key messages: IVL Journey
This strategy supports our ambition to produce double-digit ROCE, generate strong
cash flow across the cycle while delivering top decile returns to stakeholders5
28
COST & EFFICIENCY TRANSFORMATION
Dr. Deepak Parikh
Chief Strategy Officer

29200203 IVL Capital Markets Day ...SNG
NetherlandGuangdong
Shinda
Ecomex
Corpus Christi Improving operating rates of the asset
Consolidating procurement (raw materials)
Eliminating duplicate fixed costs
Sharing best-in-class practices across sites
IVL has successfully integrated each business
through several key actions:
IVL has acquired >50 businesses in the last 20 years
a
b
c
Over last 20 years, IVL has acquired and integrated >50 businesses
TIEPET
Aurus Pckg.
d
Combined PET
Fibers
Integrated Oxides and Derivatives
:
Source: IVL Financials
30200203 IVL Capital Markets Day ...SNG
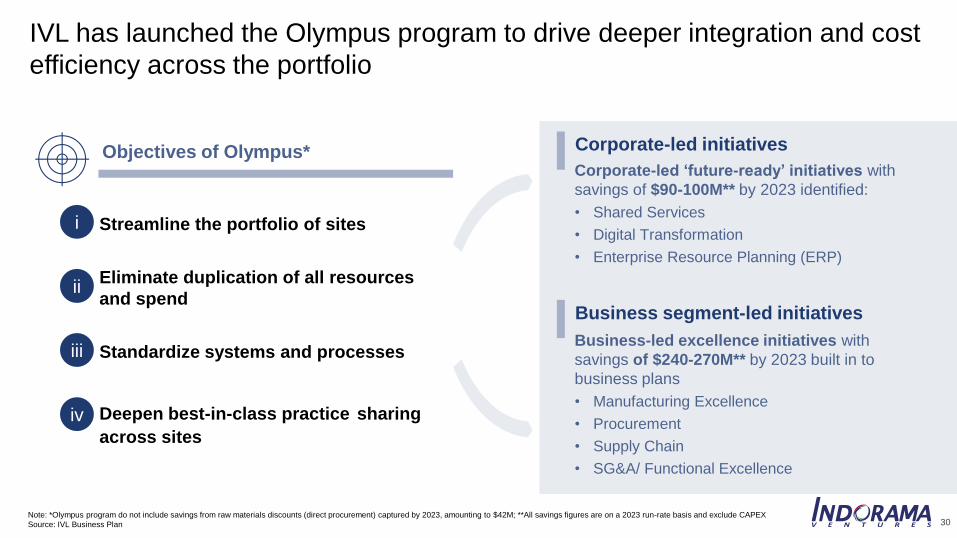
IVL has launched the Olympus program to drive deeper integration and cost
efficiency across the portfolio
• Streamline the portfolio of sites
• Eliminate duplication of all resources
and spend
• Standardize systems and processes
• Deepen best-in-class practice sharing
across sites
i
ii
iii
iv
Objectives of Olympus* Corporate-led initiatives
Corporate-led ‘future-ready’ initiatives with
savings of $90-100M** by 2023 identified:
• Shared Services
• Digital Transformation
• Enterprise Resource Planning (ERP)
Business segment-led initiatives
Business-led excellence initiatives with
savings of $240-270M** by 2023 built in to
business plans
• Manufacturing Excellence
• Procurement
• Supply Chain
• SG&A/ Functional Excellence
Note: *Olympus program do not include savings from raw materials discounts (direct procurement) captured by 2023, amounting to $42M; **All savings figures are on a 2023 run-rate basis and exclude CAPEX
Source: IVL Business Plan

31200203 IVL Capital Markets Day ...SNG
3 corporate-led business transformation programs will unlock ~$90-100M
ERP (SAP
S/4HANA)
Global business
solution (GBS)
Digital
Improve business efficiency by
centralizing finance and
procurement
Relocate repetitive or standard
activities in low cost locations
Drive data-driven decision making
across operations in all sites
Scale-up 9 pilots across
manufacturing, production
planning, inventory and sales
Support core operational business
processes such as procurement,
supply chain and manufacturing
Create single-source of truth for all
information to enable decision-making
$35-40M2023 run-rate EBITDA impact
Note: *Includes deployment of global business solution across finance, IT and HR, as well as a broader transformation initiative of the finance function; All savings figures are on a 2023 run-rate basis and exclude CAPEX
Source: IVL Business Plan
1 2 3
Estimated savings
~$25M*2023 run-rate EBITDA impact
$30-35M2023 run-rate EBITDA impact
Estimated savingsEstimated savings

32200203 IVL Capital Markets Day ...SNG
~$35-40M in savings identified by 2023 from ERP implementation
1
Note: * All savings figures are on a 2023 run-rate basis and exclude CAPEX
Source: IVL Business Plan
$35-40M*
FinanceImproved finance reporting productivity by deploying integrated reporting
capabilities and speeding up closing cycles $5-7M
Operations ~$20MOptimize MRO supplies and reduce unplanned maintenance cost by
standardizing maintenance strategies and processes
Procurement $25-30MReduce indirect procurement spend by consolidating purchases across IVL,
enabled by standardization of materials and vendors
ITApplication cost avoidance by replacing current ERP systems and legacy
IVL applications (potentially replaced by S/4)
HRImproved HR Function Productivity by enabling global talent visibility and
analytics through a single source of truth
Total savings
($15M)OPEX Recurring OPEX from year 4 onwards incl. infrastructure connectivity &
support, application licensing and reduction in IT People Cost

33200203 IVL Capital Markets Day ...SNG
2
IVL is setting up the GBS Will optimize several functions.. …yielding benefits of ~$25M
Global hub
Regional spoke
(options)
China Czech
Republic
Poland
Malaysia Philippines
Quality time for analyticsvs. routine tasks
Savings of $17M by 2023from GBS deployment (run-rate)
Savings of $9M by 2023from other finance transformation initiatives
India
Standardizing and improving
quality of service
Note: *Includes deployment of global business solution across finance, IT and HR, as well as a broader transformation initiative of the finance function; All savings figures are on a 2023 run-rate basis and exclude CAPEX
Source: IVL Business Plan
Finance &
AccountingIT
Procurement HR
Leveraging labor arbitrage
in low cost market
Right-sizing the
organization
Global business solutions will save ~$25M* across several functions
Thailand

34200203 IVL Capital Markets Day ...SNG
Note: *Subject to Auriga's return to normal production & demand context
Source: IVL Business Plan
We have piloted several digital initiatives with tangible results
1 Auriga Fibers
Production planning optimization
30% less transition cost
$300-600K EBITDA impact from transitions
and polymer flow*
2 IVXP
Reduction of PX losses across
isomerization reactor
up to $400K annual impact on IVXP bottom
line
Selected pilot examples… …cumulatively leading to a $6-6.5M run rate impact
$6-6.5MExpected run
rate impact
$1.9-2M..of which can
already be
validated
$800K+..of which has
been realized
100+IVL employees
with hands-on
digital experience
3

35200203 IVL Capital Markets Day ...SNG
We will scale up our digital initiatives with $30-35M EBITDA upside by 2023
Ambition
How?
EBITDA
Impact by
2023
Replicate current
initiatives across sites
Scale from 5 to 100+
production sites
Replicate analytics tools
from pilot across global
sites
Raise reliability through
predictive maintenance
Reduction of unplanned
down-time by 10-30%
Implement predictive
maintenance via
digital twins
$12M run-rate
Optimize global supply
chain efficiency
Achieve median/top-
25% inventory turnover
Leverage analytics to
improve forecasting &
optimize inventories
$11M run-rate
Note: All savings figures are on a 2023 run-rate basis and exclude CAPEX
Source: IVL Business Plan
3
Optimize indirect
procurement spend
Reduce indirect spend
through analytics
Procurement category
optimization drive
accelerated by digital
$9M run-rate
Within manufacturing Beyond manufacturing

36200203 IVL Capital Markets Day ...SNG
3 business segment-led excellence programs will unlock $240-270M in
savings by 2023
Manufacturing
Excellence
• Yield improvement via process
improvements
• Operational efficiency and reliability
enhancements
• Waste reduction in energy and raw
material usage
1
Estimated savings
SG&A/
Functional
Excellence
$90-100M2023 savings
3
Estimated savings
• Manpower optimization via
improved productivity
• Maintenance and
factory overhead cost reduction
Note: All savings figures are on a 2023 run-rate basis and exclude CAPEX; *Does not include savings from raw materials discounts (direct procurement) captured by 2023, amounting to $42M
Source: IVL Business Plan
2 Procurement* &
Supply Chain
Optimization
$130-140M2023 savings
• Consolidation of suppliers and
contracts across assets
• Renegotiation of discounts for
indirect spend
• Logistics optimization
• Freight contracts consolidation and
centralization
$20-30M2023 savings
Estimated savings

37200203 IVL Capital Markets Day ...SNG
In summary, Olympus is expected to yield $350M run-rate savings by 2023
ERPEnabling IVL to
manage core
operational
processes
Systems
Global
Business
Solutions* Improving
business efficiency
and decision
support
Corporate-Wide Initiatives Business Segment-Specific Initiatives
$35-40M $25M
2023 run-rate EBITDA Impact $MNote: *Includes deployment of global business solution across finance, IT and HR, as well as a broader transformation initiative of the finance function; **Combined PET includes PET, PET HVA, PTA, PX, recycling,
packaging, and specialty chemical; **Does not include savings from raw materials discounts (direct procurement) captured by 2023; ***Excludes Project Prosperity (specialty surfactants)
Source: IVL Business Plan
Combined PET**$70-80MOptimizing supply chain management,
sourcing and manpower
IOD (incl. Spindletop)$40-50M***Integration synergies from Spindletop
Improving yield via process improvement
Backward integration of assets
Fibers$130-140MImproving yield via process improvement
Consolidation and integration of assets
Digital Building and
enabling digital
organization
Trans-formation
$30-35M

38200203 IVL Capital Markets Day ...SNG
~$350M in savings will be unlocked via the IVL cost transformation
Center-led
InitiativesBusiness Segment-led Initiatives
Run-rate savings from IVL cost transformation in $M, % of total savings
0
50
100
150
200
250
300
350
400
2020F 2021F 2022F 2023F
ERP GBS Digital Operational excellence Procurement & Supply Chain* SG&A
~20%
~50%
~70%
100%% saving achieved
Note: *Procurement does not include savings from raw materials discounts (direct procurement) captured by 2023, amounting to $42M
Source: IVL Financials; IVL Business Plan
~70M
~160M
~260M
~350M

39200203 IVL Capital Markets Day ...SNG
Indorama Management Council (IMC)
Indorama Business Council (IBC)
Americas IBC
(AmIBC)
Europe IBC
(EuIBC)
Portfolio / site
optimizationPeople
Procurement & supply
chain
Manufacturing
excellence
Functional excellence
(SG&A)
~$350M* Savings (run-rate) by 2023
Site 1 Site 2 Site 3 Site 4 Site 5 Site 6 Site 7 Site 8 Site 119…
Asia Pac. IBC
(APIBC)
We have a governance framework to track and realize Olympus
Note: All savings figures are on a 2023 run-rate basis and exclude CAPEX; *Cost savings from Olympus program do not include savings from raw materials discounts (direct procurement) captured by 2023,
amounting to $42M; Source: IVL Business Plan

40200203 IVL Capital Markets Day ...SNG
The Olympus program is a first-of-its kind program for IVL
Defining
company culture
Involved
every layer
Focused on
what’s important
Committed to
delivering savings
Supported by the
full leadership team
Responsible for
specific outcomes
Employee
engagement
Shared expertise
across organization
Source: IVL Business Plan

41
Key Messages: Cost & Efficiency Transformation
Over the last 20 years, IVL has successfully acquired and integrated >50 assets;
however, we can continue to drive deeper integration and cost efficiency1
We are currently undertaking a number of Olympus corporate initiatives in ERP,
shared services and digital transformation, with projected savings of $90-100M3
2 We have launched Olympus, a company-wide cost transformation program, whose
objective is the delivery of ~$350M savings run-rate in 2023
Each business segment has also developed Olympus cost excellence programs,
amounting to a further $240-270M savings by 20234
We have established a governance structure, led by the Indorama Management
Council, to monitor and ensure the delivery of Olympus5

42
COMBINED PET
Integrated PET, Packaging,
Specialty Chemical
Mr. DK Agarwal
Chief Executive Officer – Combined PET and IOD Business

43200203 IVL Capital Markets Day ...SNG
Note: *Financial performance figures are for Combined PET (PET, PTA, PX, Packaging, Specialty Chemical); **EBITDA contribution value is based on IVL pro-forma including Spindletop
Source: IVL Financials
2019 PET production by producer: 58%IVL EBITDA**
~$940MEBITDA
11%EBITDA Margin
14%ROCE
Largest global PET resin
producer
Strong financial performance
and contribution*
(LTM 3Q2019)
Integrated and resilient
business
80%+ PTA Integration
59 manufacturing sites
in 22 countries
Top quartile cost position
IVL
20%
IVL
IVL is the world leader in PET
44200203 IVL Capital Markets Day ...SNG
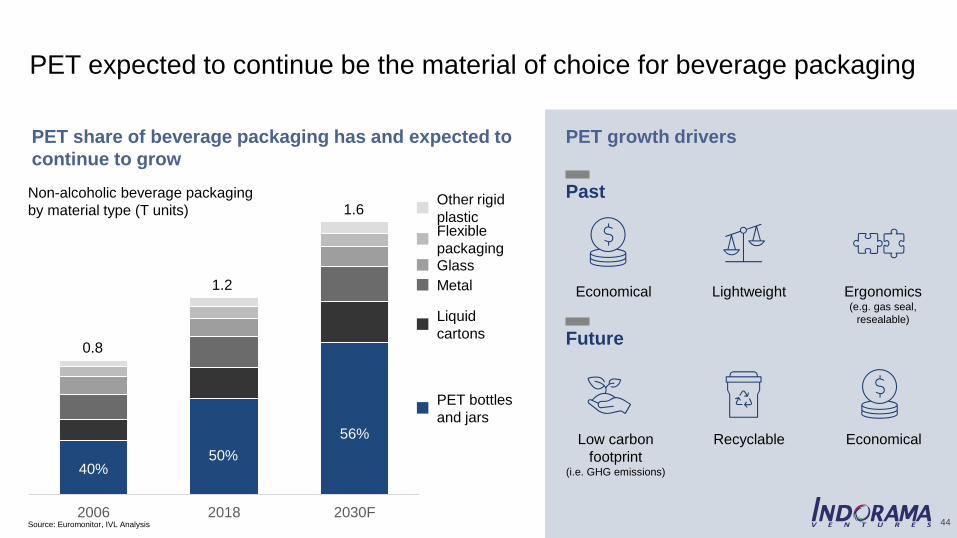
Source: Euromonitor, IVL Analysis
PET bottles
and jars
Liquid
cartons
Glass
Flexible
packaging
Metal
Other rigid
plastic
PET growth drivers
Past
Future
Economical Lightweight Ergonomics (e.g. gas seal,
resealable)
RecyclableLow carbon
footprint (i.e. GHG emissions)
Economical
PET share of beverage packaging has and expected to
continue to grow
PET expected to continue be the material of choice for beverage packaging
2006 2018 2030F
40%50%
56%
0.8
1.2
1.6Non-alcoholic beverage packaging
by material type (T units)
44

45200203 IVL Capital Markets Day ...SNG
Spreads to remain normalized in the near term given low utilization
Note: Spreads = PET FOB China - (PTA Spot CFR x 0.86 + MEG ICIS Spot NEA x 0.34)
Source: Wood Mackenzie, IVL Analysis
188 209
307
244 219 216
224 224
70%
75%
80%
85%
90%
95%
100%
0
50
100
150
200
250
300
350
2016 2017 2018 2019E 2020F 2021F 2022F 2023F
World PET % Operating Rate World PTA % Operating Rate Integrated PET
Spreads will normalize in near term
$/t
Integrated PET Spreads

46200203 IVL Capital Markets Day ...SNG
Note: Cost Curve for 9-month 2019; *PET Import parity price = ICIS PET China FOB + Duty + Ocean freight + Interest + Local freight from China to the respective region;
Europe PET cash costs are lower than the US due to lower PTA feedstock costs in Europe
Source: Industry Data, IVL Analysis
IVL PET has an advantaged cost position to weather the currently low
spread environment
0
500
1,000
1,500
- 0.5 1 1.5 2 2.5 3 3.5 4 4.5
EU28 Cost Curves (2019)
Total cash cost ($/t)
Capacity (mt)
US Cost Curves (2019) EU28 Cost Curves (2019)
Total cash cost ($/t)
Capacity (mt)
PET Import parity to Europe*
EU28
Demand
Capacity (mt)
EU28
Demand
Capacity (mt)
US Cost Curves (2019)
0
200
400
600
800
1000
1200
1400
1600
0
500
1,000
1,500
- 0.5 1 1.5 2 2.5 3
PET Import parity to US – 2019 (YTD)*
US
Demand
IVL
-U
S P
lan
t 1
IVL
-U
S P
lan
t 2
IVL
-E
U P
lan
t 3
IVL
–E
U P
lan
t 4
IVL
-E
U P
lan
t 2
IVL
-E
U P
lan
t 1
Total cash cost ($/t)

47200203 IVL Capital Markets Day ...SNG
3 Recycling
• Expand mechanical
recycling footprint
• Develop chemical
recycling solutions
• Build PET circular
value chain
Recycling capacity
and returns
Vision
Aspiration
Strategic
priorities
Metrics
To add value to our customers and the environment by delivering superior packaging solutions
Maintain double-digit
ROCE
Core business
growth23
• Deliver Corpus Christi
• Expand high-value-
added portfolio
• Explore investments in
developing market
outside China
1 Operational efficiency
and cost reduction
• Deliver Olympus cost
transformation targets
• Turnaround IPA
business
IVL market share
in key geographies
4 Adjacency growth
• Enter new applications
and market segments
• Diversify into attractive
packaging segments
EBITDA contribution
beyond beverage resinsCost savings and
yield improvement
Become the leader
in circular PET
Deepen cost advantage
vs. peers
We are implementing a strategy to strengthen our leadership position across
the PET value chain
Source: IVL Business Plan

48200203 IVL Capital Markets Day ...SNG
Initiatives
1
Savings* (2023 run-rate)
Program
1 Manufacturing
Excellence
2Indirect
Procurement &
Supply Chain
Optimization
Note: *All savings figures exclude CAPEX
Source: IVL Business Plan
$60-70M
$5M
Olympus will unlock ~$80M cost savings by 2023
3SG&A/ Functional
Excellence $15M
• Factory workforce productivity improvement
• Plant automation and installation of predictive maintenance
• Change in Chemicals & Additives to optimize costs & consumption
• Logistics optimization
• Change of cargo transportation provider, e.g., in Turkey
• Manpower headcount optimization initiatives across all regions

49200203 IVL Capital Markets Day ...SNG
Source: Smithers Pira; Euromonitor; Interviews with industry participants
Market size
Growth rate
Profitability
Beverage
Food Homecare PharmaBeauty &
Personal CareWater Non-alcoholic Alcoholic
Large market for
packaging, one-step
adjacency for IVL from
current preforms business
Large market with
similar customer
profile
(major FMCGs)
Growing market
for PET given
substitution trends
Fast growing and
profitable; requires
approvals and
R&D
4
PET packaging opportunities
Beyond 2020, adjacent packaging growth opportunities will be explored
Attractive Neutral Less attractive Attractive new segments

50200203 IVL Capital Markets Day ...SNG
2009 2010 2011 2012 2013 2014 2015 2016 2017 2018 2019 2020F 2021F 2022F 2023F
Specialty chemicals: IPA business turnaround is underway
IPA business is underperforming… …and IVL is taking action to push for a recovery
Note: *LMF – Low Melt Fibers; UPR – Unsaturated Polyester Resin
Source: IVL Business Plan, IVL Financials
115
-22
57
83
172
61
~190
LTM 3Q18 LTM 3Q19 2023F
Core EBITDA ($M)
IPA NDC and PET HVA
IPA Asia Spreads ($/t)
Historical Avg. (’09-’19)IPA Asia Spreads
1Drive an increase in demand commercial
excellence initiatives to increase use of IPA vs other competing feedstocks
2 Convert IPA line to flexible PTA/IPA line to allow capacity adjustment based on market conditions
3 Optimize feedstock through tolling agreements

51200203 IVL Capital Markets Day ...SNG
Combined PET segment will grow and register healthy cash flowCombined PET segment will grow and register healthy cash flow
Note: *EBTIDA bridge excludes any potential adjacency growth opportunities (e.g. building a fully-fledged packaging business)
Source: IVL Business Plan
EBITDA ($B)*
Specialty Chemicals PackagingIntegrated PET
$4.4B ~$5B
Net operating
capital
employed
10 mt ~13 mtVolume
ROCE 14% >15%
EBITDA $0.9B $1.2-1.3B
Industry
spread
Cost
transfor-
mation
Projects
Overall financial performance
LTM 3Q2019 2023
Recycling
1.0
1.2-1.3
0.8
0.03 -0.5
0.3
0.10.160.05
0.0
0.2
0.4
0.6
0.8
1.0
1.2
1.4
2018 IVLpremium
andmix
Organicgrowth
2023Fcurrent
plan
• Corpus Christi,
USA
• Recycling
• Others• India PET
consolidation
• Recycling
organic growth
• Virgin PET
organic growth
• Others

52200203 IVL Capital Markets Day ...SNG
We are implementing Olympus to improve operational efficiencies and reduce costs
across our sites
PET demand projected to grow as it remains the material of choice for many
packaging applications given its superior functional and environmental properties1
IVL is pursuing a strategy to maintain double-digit ROCE, strengthen our cost
advantage and lead the circular economy for PET through a leading rPET business3
2 PET spreads likely to remain thin due to low industry utilization; IVL is best-positioned
to weather this given our scale, leading cost position and presence outside China
4
IVL will explore attractive adjacency growth opportunities, especially in other
packaging sectors where we can leverage our existing capabilities and therefore
have a “right to win”
5
Key Messages: Combined PET

53
COMBINED PET
Recycling & Sustainability
Mr. Yash Lohia
Chief Recycling Officer

54200203 IVL Capital Markets Day ...SNG
Plastic bottles
from at least 50%
recycled material by
2030 (in Europe)
25% recycled
content in plastics
packaging by 2025
35% rPET in all PET
bottles by 2025
Bottles made from 100%
rPET by 2021 (in major
water markets)
“What we really need is a war on waste,
not a war on plastics… we need to focus
on materials that have economic value to
be re-used again.. Plastic PET bottle is
one of them.”
James Quincey, Coca cola CEO
“We decided to choose PET because it
already has a developed recycling
market in Argentina, and by doing this, we
feed an inclusive recycling chain”
Maximiliano Sassone, Danone Argentina
Director of Research and Innovation
“PET is chosen due to the significantly
lower carbon footprint than alternatives
…Plastic is also much cheaper.”
Marina Bay Sands SG
Source: FMCG company websites; One Young World 2019 James Quincey Speech
rPET is a new growth engine for PET
Targets Quotes Products launched

55200203 IVL Capital Markets Day ...SNG
Vision
2025 Targets
Strategic
priorities
750kt of rPET production
~25% of IVL’s beverage
PET portfolio in the West12-14% ROCE
To reinvent PET as a trusted and safe material
Ecosystem: Develop and integrate the circular ecosystem for PET
Global one-stop solution Cost leadership Integration1 2 3
Build global scale leveraging
IVL’s extensive global
footprint
Create best-in-class assets,
leveraging 30 years of IVL’s
recycling experience
Integrate across multiple
technologies to make high
quality products
4
Source: IVL Business Plan
IVL has a clear strategy to be the leader in rPET
Mission To serve the needs of IVL’s customers by building a leading,
differentiated and economically attractive recycling business

56200203 IVL Capital Markets Day ...SNG
We have 5 key areas of differentiation that underpin our ambition
Source: IVL Business Plan
IVL’s extensive global footprint1 2 Customer intimacy and
trust in IVL brand
5 Partnerships with leaders
in PET circular economy to
drive the ecosystem
4 Partnership with leading
innovators to develop of
the next-gen technology
Collaborated to create
the first ever PET bottle
made from marine
plastic waste
JV to retrofit
chemical recycling
technology to
existing PET facilities
3 Leveraging the recycling
know-how from Wellman
Ability to leverage existing PET production
and distribution network to serve customers
One-stop solution for virgin PET & rPET
Ability to leverage relationship and trust
with global brands that IVL has developed
High quality products that serve customers’ needs
30+years of
recycling
experience
know how on
bottle washing,
customizable by
geography
Circular
Economy

57200203 IVL Capital Markets Day ...SNG
We plan to scale recycling capacity to 750,000 tons, while achieving a
double-digit ROCE
30
100
30
160
440
750
2019 2023F 2024F/2025F
Asia
EMEA
Americas
Note: ROCE shown here is only for Flake and rPET. SPS and rFiber ROCE not included
Source: IVL Business Plan
Capacity (kt)
ROCE (%) 10% 12-14% 12-14%

58200203 IVL Capital Markets Day ...SNG
rPET is a new growth engine for PET given its 100% recyclability; suppliers and
users are setting high aspirations for rPET use1
We have a competitive advantage in rPET, driven by our global footprint, recycling
expertise and strong partnerships across the circular value chain3
2 IVL has a clear recycling strategy and will build upon our #1 PET position to remain
the leader in rPET
We are investing in expanding our recycling capacity with a target to hit 750kt by
2025 while leading the development of the circular PET ecosystem4
Key messages: Recycling & Sustainability

59
INTEGRATED OXIDES & DERIVATIVES (IOD)
Mr. DK Agarwal
Chief Executive Officer – Combined PET and IOD Business

60200203 IVL Capital Markets Day ...SNG
IVL has built a large and diversified IOD business
Note: *EBITDA contribution value is based on IVL pro-forma including Spindletop; **Include EOA, LAB, Surf, PO, PG and EO; EG – Ethylene Glycol; EO – Ethylene Oxide; PO – Propylene Oxide; PG – Propylene
Glycol; EOA – Ethanolamines; LAB – Linear Alkyl Benzene
Source: Wood Mackenzie; IVL Financials; IVL Analysis
Spindletop brings further scale and business diversification
A
IVL +
Spin
. B
Spin
. C D E
IVL F
590
420
1010
IVL+ Spin.
pro-forma
Spin. IVL
IVL becomes the second largest
Ethylene Oxide producer in the US
$455M EBITDA
22% EBITDA margin
28% of IVL EBITDA*
11% ROCE
IOD represents an increasingly large
and profitable portion of IVL
(LTM 3Q2019 incl. Spindletop pro-forma) US EO capacity in 2019 (kt) Breakdown of IVL IOD portfolio,
EBITDA ($M)
Additional $60-70M in
2020 from IVOL
67
307
27
90
-
57
LTM3Q19 pre-transaction
LTM3Q19 pro-forma
95
455
HVA &
Derivatives**
EG
MTBE

61200203 IVL Capital Markets Day ...SNG
Cumulative Capacity (%)
Note: All cash costs don't include freight (factory gate); *2019 cash cost for Ethylene and MEG; **Avg. 2014-18 cash cost for PO. Spindletop uses PO-TBA (propylene oxide / tertiary butyl alcohol) technology, which yields
both PO and MTBE from Propylene and Isobutane. ME – Middle East; WE – Western Europe; NEA – North East Asia; SEA – South East Asia
Source: IHS Markit, Nexant, IVL Analysis
ME
EthaneN
ort
h A
me
rica
Eth
an
e
ME
Nap
hth
aS
EA
Na
ph
tha
NEA
Naphtha
Co
al T
o M
EG
WE
Nap
hth
a
$/t
20% 40% 60% 80% 100%M
ixe
d F
ee
d R
oW
Spindletop
Technology
(PO- TBA) &
Shale Gas
Advantage
20% 40% 60% 80% 100%
ME
Ethane
North
America
Ethane ME
LP
G
WE
Nap
hth
a
NE
A L
PG
ME
Naphth
a
SE
A N
ap
hth
a
Mix
ed
Fe
ed
Ro
W
NE
A N
ap
hth
a
$/t
CTO
MTO
Cumulative capacity (%) Cumulative capacity (%)
$/t
We are structurally advantaged from US shale and superior PO technology
20% 40% 60% 80% 100%
Cumulative capacity (%)
PO-TBA & PO-SM HPPO, CHPO, Cumene PO
~400
$/t
~200
$/t
Marginal producer $/t Marginal producer $/t
Global Integrated MEG Cash Cost*Global Ethylene Cash Cost* Global PO Cash Cost**

62200203 IVL Capital Markets Day ...SNG
IVOL cracker operations
IOD has a focused strategy to grow and further increase margins
Vision
Aspiration
Strategic
priorities
Metrics
To be a leading downstream producer in a high growth market leveraging low cost feedstock
Build an integrated
IOD value chain
Portfolio enhancement to HVA3
• Expand into high margin specialty
surfactants via Project Prosperity
• Explore attractive adjacencies in the
propylene (oxide) value chain
• Leverage Spindletop R&D and innovation
capabilities to explore new specialty
chemicals
1
• Stabilize IVOL (Lake Charles) cracker
operations
• Ensure best-in-class operating rates for
Lake Charles cracker
% of Spindletop
synergies captured
Expand HVA share
in portfolio
Maintain double digit
ROCE
EBITDA share from
HVA productsAsset reliability /
downtime %
Source: IVL Business Plan
Spindletop integration
• Consolidate SG&A and restructure
organization in Spindletop
• Improve yields, reduce waste and
leverage benefits from ethylene
integration via IVOL
• Improve reliability of IVOL and IVOG by
exploiting technical capabilities acquired
with Spindletop
2
IVOL cracker
operating rates

63200203 IVL Capital Markets Day ...SNG
Spindletop has expanded our global manufacturing and R&D footprint
Ankleshwar, India Botany, AustraliaIVOL, Lake Charles, LA
Assets before 2020 New Assets 2020 - Spindletop
Shanghai, ChinaBrussels, Belgium
Sao Paulo, Brazil
Mumbai, India
Melbourne, Australia
The Woodlands, TX
R&D and Technical Services
Dayton, TXPort Neches, TX Chocolate Bayou, TXIVOG, Clear Lake, TX

64200203 IVL Capital Markets Day ...SNG
• Ethylene yield improvement at
Spindletop
• Ethylene backward integration at IVOL
• Improved reliability and reduced
downtime from technology transfer /
sharing among assets
Operational
Excellence
• Organizational consolidation at
Spindletop and IVOL
~$45M savings/synergy to be captured by 2023* Range of new capabilities from Spindletop
that can be deployed across the IOD portfolio
Note: *Run-rate basis
Source: IVL Business Plan
Commercial capabilitiesWide and longstanding customer base
R&D capabilitiesOrganizational
consolidation
$30M savings
$15M savings
• 6 R&D centers with ~50 researchers
• 200+ active patents and ~200 pending
• Portfolio of specialty chemicals for surfactants
and niche applications in agrochemical, O&G
• Facilities dedicated to customized formulations
(e.g. Dayton site)
Spindletop integration will yield ~$45M in cost synergies, and bring new
capabilities to IVL

65200203 IVL Capital Markets Day ...SNG
0% 20% 40% 60% 80% 100%0% 20% 40% 60% 80% 100%0% 20% 40% 60% 80% 100%
Spindletop increases IVL’s margins and provides a platform for further
expansion into high value-added products
Spindletop acquisition enables IVL to move into higher value-add products We are exploring further downstream
options e.g. specialty surfactants
• Specialty Surfactants
Project Prosperity launched with
target of ~$60M EBITDA by 2022
onwards
• Adjacent Opportunities
Other downstream opportunities
e.g. in the PO value chain will be
explored in the medium term
IVOG + IVOL
Spindletop
Note: *Average contribution margin 2014-19, with 100% ethylene integration and 20% propylene integration; Contribution margin is revenue minus all variable costs. Volumes include Spindletop pro-forma. EG –
Ethylene Glycol; EO – Ethylene Oxide; EOA – Ethanolamines; PO – Propylene Oxide; MTBE - Methyl Tertiary Butyl Ether
Source: IHS Markit, Wood Mackenzie, IVL Business Plan; IVL Analysis
IVL Production Volume (%)
1X
1.5X
2.0X
3.1X
MTBE
Opportunity from 100% Propylene Integration
20% Propylene Integration (current business)
EO PO
EG
EOA
Su
rfa
cta
nts
1.4X
IVL contribution margin (2015-19 average)*
Per ton, EG = 1X
Avg contrib. margin = 1.5X

66200203 IVL Capital Markets Day ...SNG
230 211149
700
-20
-90 -6 45
IVOL
Spindletop***
Core EBITDA 2018 One-time effect Industry Spread IVL premium and mix Cost transformation Organic growth IVOL + Spindletop Core EBITDA 2023
Note: *Figure as of LTM 3Q2019 including IVOG, pro-forma Spindletop, excluding IVOL; **Figures include IVOG, Spindletop, IVOL; ***Includes Project Prosperity but excludes integration cost synergies, that is captured
under Cost synergies; Production volume excludes Spindletop’s captive production of EO and cracker
Source: IVL Financials; IVL Business Plan
EBITDA ($M)
EBITDA
Net operating
capital
employed
ROCE
Volume
LTM 3Q2019* 2023**
2018 Spread IVL
premium
and mix
Organic
growth
Cost
synergiesProjects 2023
2.2 mt
$455M
$2.6B ~$3B
~2.5 mt
11% ~13%
~$700M
Overall financial performance
Insurance
claims
Integrated Oxides segment projected to grow to ~$700M EBITDA

67200203 IVL Capital Markets Day ...SNG
Key Messages: Integrated Oxides
With the acquisition of Spindletop, IVL has built a large and diversified IOD business
from Huntsman that complements our existing Integrated PET and Fibers segments
We have completed the start up of our Lake Charles cracker at IVOL to fully realize
the benefits from backward integration of ethylene
IVL IOD has set out clear growth plans to fully integrate and capture the EBITDA
upside from IVOL and Spindletop by 2023 while maintaining double-digit ROCE
The integration of IVOL and Spindletop will lead to cost synergies of ~$45M and
~$60M EBITDA upside from specialty surfactants by 2023, in addition to significant
R&D and innovation capabilities
A critical element is that across our portfolio, IVL has a structural cost advantage from
low cost shale gas feedstock in the US, allowing for higher margins through the cycle2
1
3
4
5

FIBERS
Mr. Uday Gill
Chief Executive Officer – Fibers business

69200203 IVL Capital Markets Day ...SNG
Fibers has been organized into 3 application-focused verticals
50 manufacturing sites in 19 countries
Note: *EBITDA contribution value is based on IVL pro-forma including Spindletop
Source: IVL Business Plan; IVL Analysis
Airbags
Seatbelts
Tire reinforcements
Baby diapers
Adult incontinence
Feminine care
Clothing & active wear
Fire retardant apparel
Fabrics & home textile
Mobility Revenue: ~$1B
Hygiene ~$1B
Lifestyle~$1.5B
Mobility
Hygiene
Lifestyle
Reduce complexity
and fragmentation
Create lean and
empowered verticals
led by champions
Clear objectives
driving business
transformation
Enhance customer
centricity and intimacy
to improve value
1
2
3
$244M EBITDA
8% EBITDA
margin
15% of IVL
EBITDA*
3% ROCE
Fibers performance
(LTM 3Q2019)
$0.8B
$1.3B
$1.4B
Net revenues

70200203 IVL Capital Markets Day ...SNG
Each vertical has very strong underlying growth drivers
Source: Wood Mackenzie; IVL Analysis
Mobility Hygiene Lifestyle
Higher number of airbags/car driving
demand above automotive sales
Population, modern retailing and
higher per capita income in EMs
Affluence and urbanization creating
new class of consumers
Lowering emission with lighter, more
sustainable fibers and composites
Replacement demand for tires
outpacing automotive demand
Aging population creating demand for
adult incontinence in affluent markets
New functionalities for medical and
skin care leading to new growth area
New materials leading to high
demand in athleisure segment
Increasing focus on sustainability
creating new opportunities
Addressable Market & Volume CAGR '18-'23
$25-30B ~5% $10-15B ~5% $70-80B ~3%

71200203 IVL Capital Markets Day ...SNG
High
Lifestyle Mobility Hygiene
4
mt
We continue to identify and enter in attractive segments, to complement the
commodity business
Source: Wood Mackenzie, Smithers Pira, Price Hanna, Multiple online articles and journals and IVL Analysis
Attractive segments
Large commodity segmentsBubble size proportional
to market volume in mt
Gro
wth
Ra
te
HighLow
Low
Hig
h
Barriers to entry / Qualification period
Traditional Apparel
Home
Technical Clothing
Auto InteriorsTire Cord
Airbags
Medical & Hygiene
Baby Diaper
Feminine Care
Adult Incontinence
Protective Textiles
Agriculture
Filtration
Construction
Geo Tech
Industrial
Athleisure

72200203 IVL Capital Markets Day ...SNG
Fibers is exploring expansion into adjacent sub-segments
Note: Heat map scoring by multiplying the market size of each sub-segment with its growth rate and gross profit margin (e.g. insulation)
Source: Smithers Pira; Grand View Research; Interviews with industry participants; IVL Analysis
Segment
MaterialApparel
clothing, sportswear
Homeupholstery, fabric
Hygiene Fem care, diapers
Mobilityairbag, tires, belts
Industrialprotective, filter,
insulation
Medicalgowns, disposables
Polyester
Nylon
Aramid
PP/PE
Acrylic
Rayon
PLA
Composites
Attractive Neutral Less attractive Adjacent opportunitiesCurrent IVL focus

73200203 IVL Capital Markets Day ...SNG
Fibers has developed a strategy to double EBITDA by 2023
Mission
Aspirations
Strategic
priorities
Metrics
Continuously transform to maintain leadership by providing sustainable solutions for our customers
Double EBITDA
every 5 years
Double digit ROCE
in each vertical
• Expand capacity by 100 kt and
increase utilization by ~9ppt
• Strengthen collaboration with tire,
airbag, auto suppliers to increase
Share of Wallet
• Accelerate new product development
and commercialization in composites
• Expand capacity by 140 kt and
increase utilization by ~7ppt
• Accelerate development and
commercialization of new products
with improved functional and
environmental properties
• Diversify into medical offerings
• Expand capacity by 550 kt and
increase market share by 2%.
• Expand sustainable fibers offerings
through Deja (100% rPET) and iCare
• Diversify into sensitive skin-friendly
intimate apparel
Operational Excellence:
Olympus savings realized
Innovation: % of revenue
from new products (ongoing)
Commercial: # of partnerships
with key customers
Mobility Hygiene Lifestyle1 2 3
Deliver the Olympus cost transformation, asset turnaround and integration in each vertical (~$130M)
65% EBITDA share
from innovative products
Source: IVL Business Plan
Capital efficiency:
NWC reduction

74200203 IVL Capital Markets Day ...SNG
We are embarking on a ~130M cost transformation program under Olympus
Cost efficiency within each asset Consolidation and integration of assets
Source: IVL Business Plan
• Manpower rationalization and AI /
automation
• Cost innovations in operations e.g.
utilities, chemical, additives and packing
• Yield improvement via manufacturing
excellence initiatives
• Consolidation and integration within
business verticals, e.g. corporate function
centralization, footprint optimization
• Modernization of PF Mexico asset and
GLLV winder and fiber automation
• Integration of Trevira with Sinterama and
capture of combination synergies
$90M savings at run rate in 2023 $40M savings at run rate in 2023
$35M
$30M
$25M
$20M
$10M
$10M

75200203 IVL Capital Markets Day ...SNG
IVL is consistently innovating to extend our market lead
Light weight car seat with IVL
TecTape Hybrid Roving
AVK Innovation Award @
Composites Europe Fair 2019
Flame retardant, UV-resistant yarn
for outdoor applications
Brandenburg Innovation Award for
Plastics and Chemistry 2019
Heavy metal free fibers
commercialized at multiple sites
For sensitive skin, targeting
intimate wear and baby diapers
Over 21% of our revenues is from products developed in the last 5 years, supported by a pipeline of products
Source: IVL Press Release

76200203 IVL Capital Markets Day ...SNG
211
500130
Start ing value Cost transformation Volume Increase New Product Development EBITDA 2023
EBITDA
Net operating
capital
employed
ROCE
Volume
EBITDA ($M)
2018 Cost
transformation
Organic
growth
Projects 2023F
1.6 mt
$245M
$2.4B ~$2B
~2 mt
3% ~15%
~$500M
Overall financial performance
LTM 3Q2019 2023
Fibers has a clear plan to double EBITDA and hit double digit ROCE by 2023
Source: IVL Business Plan

77
Key Messages: Fibers
IVL remains focused on delivering the full potential of our strategically acquired
assets via integration and consolidation in 3 verticals (mobility, hygiene, lifestyle) 1
The Fibers segment is focused on doubling EBITDA in the next 5 years and
achieving a double-digit ROCE via an integrated strategy and turnaround plan3
2 Each vertical is projected to have sustainable growth driven by structural increases in
per capita income and evolving customer needs in safety, hygiene and performance
Olympus has been launched to enhance our value with improved operational
efficiency in each site and a consolidation/integration across multiple sites4
IVL aims to further cement our leadership position by deepening customer intimacy
through partnerships and driving innovation to create proprietary offerings5

78
LEADERSHIP DEVELOPMENT
Mr. Roberto Bettini
Chief Human Resources Officer

79200203 IVL Capital Markets Day ...SNG
IVL’s HR strategy contains 3 pillars
• Communicate IVL's leadership
model and competencies across the
organization
• Undertake training for 1000
senior/middle managers and 2500+
junior managers in the next 4 years
• Complete the design and
implementation of IVL's
performance management system
for all the levels below N-2*
• Progressively extend the
methodology to all levels in the
organization
• Establishment of 2 management
councils to provide structure and
clarity to our decision-making
• Groom IVL's next generation of
leaders who sit on the Indorama
Business Council (IBC)
Note: *Performance management system for N-2 level is already in place
Source: IVL HR Plan
Leadership DevelopmentPerformance ManagementStructure & Succession
80200203 IVL Capital Markets Day ...SNG
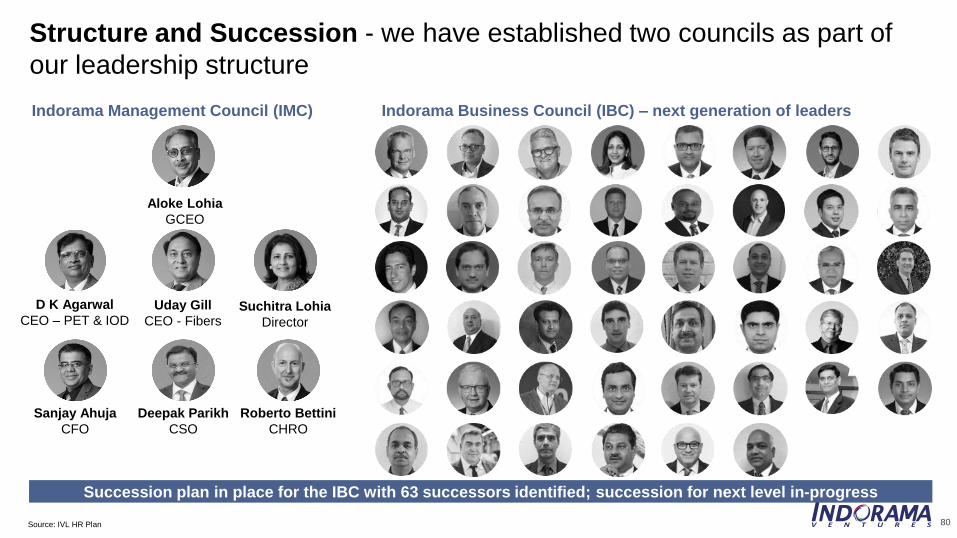
Structure and Succession - we have established two councils as part of
our leadership structure
Suchitra Lohia
Director
Aloke Lohia
GCEO
D K Agarwal
CEO – PET & IODUday Gill
CEO - Fibers
Sanjay Ahuja
CFO
Deepak Parikh
CSO
Roberto Bettini
CHRO
Indorama Management Council (IMC)
Succession plan in place for the IBC with 63 successors identified; succession for next level in-progress
Source: IVL HR Plan
Indorama Business Council (IBC) – next generation of leaders

81200203 IVL Capital Markets Day ...SNG
Performance management – an integrated and standardized system rolled
out across IVL
Objective settingOngoing coaching
and feedbackEvaluation Compensation
Deployment of an incentive
compensation model for
manager levels
Individual performance
Segment performance
IVL performance
Compensation
• Implementation of a
structured performance
review process
• Clear setting of targets
and expectations by
tenure
• Ensure feedback loops
mechanisms
• "Train the trainer": train
supervisors to provide
feedback
Identify appropriate
quantitative and qualitative
KPIs to assess individual
performance
Source: IVL HR Plan

82200203 IVL Capital Markets Day ...SNG
Leadership Development - we have defined the key elements of a
successful IVL leader
IVL LEADERS
Collectively create a dynamic, experiential and
innovative environment for growth and learning
Business growth Customer satisfaction Employee engagement
Drive results
Business acumen
Create new possibilities
Perform
Energize others
Stretch self and team
Get results as a team
Empower and motivate
Champion change
Influencer
Organizational agility
Navigate through uncertainties
Source: IVL Leadership Curriculum

83
Key Messages: Leadership Development
IVL embarking on a journey to transform our HR management, bringing increased
structure, governance and oversight from the corporate center1
IVL is actively investing in training and mentoring programs for all employees at
manager level or above
3
We have clearly defined what leadership means to us and are deploying the
initiatives needed to disseminate our leadership model throughout the organization
Establishment of a new performance management system that drives management
promotions and compensation based on a set of agreed and defined KPIs
4
2 We have a succession planning system that takes into account our talent pool and
succession risks to inform individual development and recruitment plans
5

84
BALANCE SHEET STRENGTH
Mr. Sanjay Ahuja
Chief Financial Officer

85200203 IVL Capital Markets Day ...SNG
Key Messages: Balance Sheet Strength
Olympus will yield cost savings of ~$350M by 2023 – a direct impact to IVL’s bottom
line1
IVL’s gearing ratio remains well-below debt-covenant thresholds; our balance sheet
projected to deleverage and create positive free cash flow post Spindletop acquisition3
2 Further working capital optimization, including through supply chain financing
initiatives, will continue to drive strong cash flows and enable dividend payouts
Diversified sources of debt, including green loans, result in a healthy debt profile
and a declining cost of financing4

86200203 IVL Capital Markets Day ...SNG
Manufacturing Excellence
Olympus will lead to ~$350M upside to IVL’s bottom line
Corporate-Led Initiatives Business Segment-Led Initiatives
SG&A / Functional Excellence $90-100M
Procurement** & Supply Chain
Excellence$20-30M
$130-140M
2023 EBITDA impact $M
ERPEnabling IVL to
manage core
operational
processes
Systems
$35-40M
Note: *Includes deployment of global business solution across finance, IT and HR, as well as a broader transformation initiative of the finance function; **Cost savings from Olympus program do not include savings
from raw materials discounts (direct procurement) captured by 2023, amounting to $42M; Source: IVL Business Plan
Global
Business
Solutions* Improving
business efficiency
and decision
support
$25M
Digital Building and
enabling digital
organization
Trans-formation
$30-35M
1

87200203 IVL Capital Markets Day ...SNG
OCF has been strong and we will further optimize our working capital
management
0.7 0.7
0.85
1.0
1.3
2015 2016 2017 2018 LTM 3Q19
Source: IVL Financials; IVL Business Plan
Sharp focus on working capital management
will continue going forward
LTM 3Q19: Reduced net working capital by 3
days in 3Q19 resulted in $120M inflow
2020P – 2023P: Implement supply chain
financing solutions and optimize inventory levels
Operating cash flow ($B)
2

88200203 IVL Capital Markets Day ...SNG
IVL consistently adheres to our dividend payout policy
Source: IVL Financials
51%
121%
79%50%
45%
37% 34% 32%
53%
1.97
0.30 0.350.76 1.06
1.79
2.91
4.43
2.63
1.000.36 0.28 0.38 0.48 0.66
1.001.40 1.40
2011 2012 2013 2014 2015 2016 2017 2018 LTM 3Q19
Dividend per share (THB)
Core EPS (THB)
Minimum dividend
payout policy at 30%
Dividend payout ratio (%)
2

89200203 IVL Capital Markets Day ...SNG
Gearing is well-below covenants and we continue to deleverage
• Net D/E ratio to remain
below the financial
covenants of 2.0x and
internal threshold of 1.5x
• Balance sheet will
gradually deleverage
with a net D/E below
1.0x from 2022 onwards
• Free cash flow
generation post
Spindletop acquisition
Note: *Jan 2020F CAPEX only includes Spindletop acquisition
Source: IVL Financials; IVL Business Plan
3
0.1
0.2
0.4
0.3 0.3
0.3
0.9
1.0
1.4
1.3
1.1
0.8
0.6
2018 2019E Jan 3, 2020* Dec 2020F 2021F 2022F 2023F
Fibers Growth CAPEX Maintenance CAPEX
Net Debt/Equity(x)
Spindletop
acquisition
Combined PET Growth CAPEX IOD Growth CAPEXCAPEX Plan (in $B)
Corporate Initiatives
2.4
1.0
2.0
2.9
1.0 0.9
0.6

90200203 IVL Capital Markets Day ...SNG
Strong cash flow will support the deleveraging efforts
8-9 8,458
7,207
5,7874,722 4-5
4,185 4-5
CoreEBITDA
Net WorkingCapital
Maint.Capex
Finance Cost& Cash Tax
Dividends FCF* beforeStrategic
Investment
CashAvailable for
DebtRepayment
StrategicInvestment**
2020F-2023F sources and uses of cash
Strong cash flow has been the
main source of funding for various
expenditures, including
maintenance CAPEX and dividends
Cash flow generated across the 4
years will cover all strategic
CAPEX, including Spindletop
Note: *FCF stands for Free Cash Flow, which is calculated by subtracting reported EBITDA with net working capital, maintenance capex, finance cost, cash tax and dividend;
*Strategic Investment = growth CAPEX + any net working capital on acquisitions
3
Unit: $B
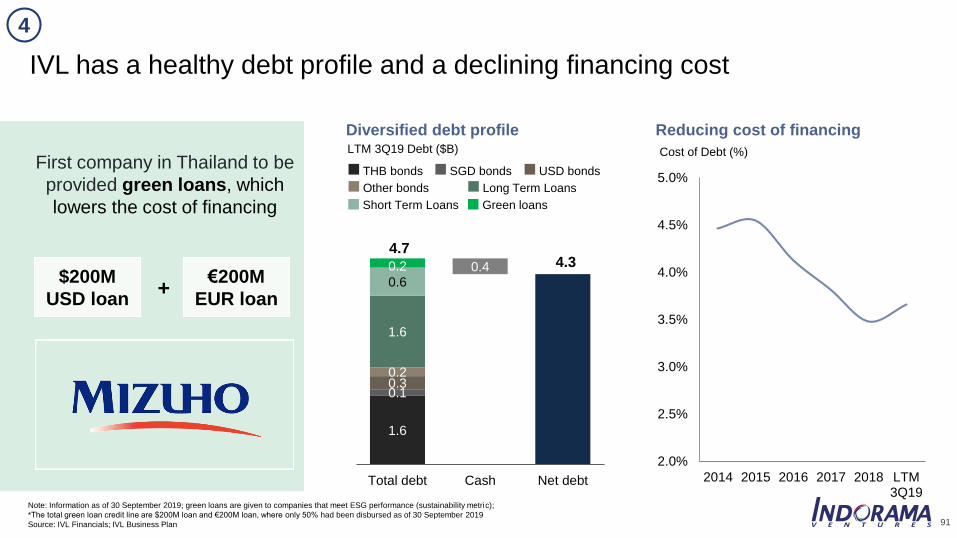
91200203 IVL Capital Markets Day ...SNG
IVL has a healthy debt profile and a declining financing cost
2.0%
2.5%
3.0%
3.5%
4.0%
4.5%
5.0%
2014 2015 2016 2017 2018 LTM3Q19
LTM 3Q19 Debt ($B)
THB bonds
Long Term Loans
Short Term Loans
Reducing cost of financingDiversified debt profile
Note: Information as of 30 September 2019; green loans are given to companies that meet ESG performance (sustainability metric);
*The total green loan credit line are $200M loan and €200M loan, where only 50% had been disbursed as of 30 September 2019
Source: IVL Financials; IVL Business Plan
Green loans
4.74.3
SGD bonds USD bonds
Other bonds
First company in Thailand to be
provided green loans, which
lowers the cost of financing
$200M
USD loan
€200M
EUR loan+
Cost of Debt (%)
1.6
0.10.30.2
1.6
0.6
0.2 0.4
Total debt Cash Net debt
4

KEY TAKEAWAYS
Mr. Aloke Lohia
Group Chief Executive Officer

93200203 IVL Capital Markets Day ...SNG
The outlook is challenging but IVL remains well-positioned for growth
External
Internal
Low point of the chemical cycle, where spreads
are expected to remain thin in the near-term
Downside risks to the global economy, from
geopolitical tensions, trade dislocation and the
recent n-CoV coronavirus
IVL with a top-tier cost position vs. competitors;
reinforcing this position via the Olympus program
IVL’s portfolio of businesses that addresses the
packaging, lifestyle, hygiene and safety needs
of consumers provides resiliency and diversity
Mitigations Challenges
Growing concerns on plastic waste and
environmental sustainability
Recent large acquisition of Spindletop; sizeable
effort needed to integrate and realize synergies
IVL in the process of building a leading rPET
business, leveraging our #1 position in PET
IVL has successfully integrated 50+ acquisitions
and we have set up an integrated leadership
team across all assets in the IOD segment
Source: IVL Business Plan

94200203 IVL Capital Markets Day ...SNG
Our 2023 strategy will guide all our actions in the next few years
Vision
Values
Financial
Aspiration
Differen-
tiators
Strategic
priorities
Metrics
To be a world-class chemical company making great products for society
Double-digit ROCE in each core business
Top decile TSR relative to peers
Lowest cost producer
in core products
Industry-leading
margins
% of high-potential
talent
Share of EBITDA from
adjacency businesses
Leading rPET player
in core markets
ScaleGlobal PET leader
Serial M&A Programmatic, buy
low, capture synergies
Global-local Close to customers in
global core markets
IntegratedValue chain
margin capture
Diversified Through cycle
resilient portfolio
“Our people make
the difference”
“We see change
as an opportunity”
“Diversity is
our strength”
“We are
responsible”
“The customer
is why we exist”
Recycling
LeadershipBuild leading rPET
business; set new bar
for sustainability
Adjacency
GrowthPursue organic and
bolt-on growth in
attractive adjacencies
Leadership
DevelopmentInvest in and develop the
best management team in
the industry
Thrusts – Diversification and Circular Economy EnablerMust do
Cost
TransformationAccelerate performance
through cost optimization
Asset
Full PotentialFocus on commercial
excellence to grow
revenues and margin
2 3 4 5
Strong cashflowacross the cycle
Source: IVL Business Plan
1

95200203 IVL Capital Markets Day ...SNG
Summary
IVL’s time-tested approach has generated strong returns for stakeholders through both the
peaks and valleys of the chemical cycle
We have a well articulated 2023 strategy focusing on 5 pillars: Cost Transformation via
Olympus, Asset Full Potential, Adjacency Growth, Recycling Leadership and our People
In combined PET, we aim to strengthen our cost advantage while also driving the circular
economy for PET by building a leading recycling business
In IOD, the priority we will fully integrate and capture synergies from IVOL and Spindletop to
further strengthen this large, diversified and growing business
In Fibers, we are focused on operational efficiency, asset integration, and innovation to meet
customer’s evolving needs, resulting in a business that delivers double-digit ROCE
Our aggregated businesses continue to generate healthy operating cash flow, we continue to
focus on working capital while simultaneously deleveraging the balance sheet
We continue to invest in our people, put in place organization and governance structures and
HR processes to ensure we have a healthy IVL for the future
1
2
3
4
5
6
7

96
Q&A

97200203 IVL Capital Markets Day ...SNG
Appendix

98200203 IVL Capital Markets Day ...SNG
Series of key events in the new few years
2018
• Strong industry
spreads
2020
• Some recovery of industry spreads from lows of 4Q19
• Potential global macro improvement leading to pipeline inventory buildups
• Full year impact of 2019 inorganic growth
• Recovery of volumes lost in 2019 due to unplanned shutdowns
• Full Spindletop contribution from mid-march 2020
• IVL Gas cracker startup in 1Q20
• Recycling growth
• Conversion of a US IPA line to a flexible IPA-PTA line
• Cost saving programs across segments
2019
• Very weak industry spreads in 4Q19
• Inorganic growth: India Fibers, UTT Fibers, Sinterama Fibers, Brazil
Fibers, Recycling
• $140M impact due to unplanned shutdowns
• Major global macro volatilities and lower prices resulted in low
pipeline inventories
2021
• Full year impact of Spindletop and US gas
cracker
• Recycling growth
• Cost saving programs across segments
• Free cash flow generation
2022/23
• Corpus Christi startup
• Spindletop expansion –
Project Prosperity
• Recycling growth
• Cost saving programs
across segments
• Free cash flow generation
Source: IVL Financials; IVL Business Plan