A NEW DESIGN OF THREE PHASE TRANSFORMER UNDER …
40
A NEW DESIGN OF THREE PHASE TRANSFORMER UNDER NONLINEAR LOAD CONDITION MUHAMMAD MOKHZAINI BIN AZIZAN UNIVERSITI SAINS MALAYSIA 2013
Transcript of A NEW DESIGN OF THREE PHASE TRANSFORMER UNDER …

A NEW DESIGN OF THREE PHASE TRANSFORMER UNDER
NONLINEAR LOAD CONDITION
MUHAMMAD MOKHZAINI BIN AZIZAN
UNIVERSITI SAINS MALAYSIA
2013

A NEW DESIGN OF THREE PHASE TRANSFORMER UNDER
NONLINEAR LOAD CONDITION
By
MUHAMMAD MOKHZAINI BIN AZIZAN
Thesis submitted in fulfilment of the requirements
for the degree of
Doctor of Philosophy
July 2013

ii
ACKNOWLEDGEMENT
First and foremost, I am thankful to Allah for His Mercy and Compassion that I
managed to complete this study successfully. I would like to thank my parents for their
exclusive attentions and thoughts they have given me without fail not only during the course
of my study but throughout my entire life as I remember it.
I have accumulated many debts in completing this thesis over a few years, since
2009, and it is a pleasure to acknowledge them. The most important persons are the study
supervisors Associate Professor Dr Ir Syafrudin Masri and Dr Mohamad Kamarol Mohd
Jamil. From Day One they stood hand in hand with me and continually supporting and
guiding me as a student as well as a person in general. It is an honour to work together with
these unbelievably dedicated people.
At PPKEE Power Lab, I have been blessed with great personalities all around, and
that makes life much easier socially and in term of conducting research works. They are Mr
Ahmad Shauki, Mr Jamaluddin, Mr Mohamad Nazir, and Mr Hairul Nizam. Their expert
assistance and guidance regarding my work are highly appreciated. The technical
competence levels are beyond any reasonable doubt and for that reason Power Lab is among
the few facilities that are hold in high regards at PPKEE and USM.
The debt is also owned to many strangers who become close friends. It is
unfortunate for me to not be able to name every single one of them here, but they know who
they are. I have been blessed with great friends all along my life and they certainly belong in
that category. Finally I would like to acknowledge UNIMAP and KPT for funding my study
here through the SLAB-UNIMAP-KPT scheme. Without their presence, none of this is
possible. It is my time to lend a hand back to the university and the nation. Insya Allah.
iii
TABLE OF CONTENT
PAGE
ACKNOWLEDGEMENT
ii
TABLE OF CONTENT
iii
LIST OF TABLE
vii
LIST OF FIGURE
LIST OF PLATE
LIST OF SYMBOL
LIST OF ABBREVIATION
viii
xi
xii
xiii
ABSTRAK
xiv
ABSTRACT xv
CHAPTER 1 INTRODUCTION
1.1 Background
1
1.2 Objectives 4
1.3 Problem Statement
4
1.4 Scope of Research
5
1.5 Thesis Contribution
6
1.6 Thesis Layout
6
CHAPTER 2 LITERATURE REVIEW
2.1 Electrical Power System
8
2.2 Characteristics of Load in Power System
12
2.3 Current Harmonic Distortion
14
2.4 Effects of Nonlinear Load to Power Distribution System
16
2.5 Power Transformer Losses
20
2.5.1 No Load Loss
22
2.5.1.1 Hysteresis Loss in Core
22

iv
2.5.1.2 Eddy Current Loss in Core 25
2.5.1.3
Total Loss in Core
28
2.5.2 Transformer Loss
29
2.5.2.1 Copper / Ohmic Loss
29
2.5.2.2 Eddy Current Loss in Winding
31
2.5.2.3 Other Stray Loss
34
2.6 Effects of Current Harmonics on Power Transformers
36
2.7 Effects of Harmonic Currents Towards Operation of Power
Distribution Transformer
39
2.7.1 Harmonic Standards and Guidelines
42
2.7.2 Transformer Temperature Rise under Continuous Operation
45
2.8 Current Mitigations Methods for Transformer Operation under
Nonlinear Load
47
2.8.1 Transformer Derating
47
2.8.2 K Factor Transformer
50
2.8.3 Transformer Oversizing
52
2.8.4 Active and Passive Filters
53
2.9 Disadvantages of Existing Mitigation Methods for Transformer
Operation under Nonlinear Load
54
2.10 A New Design of Power Transformer under Nonlinear Load
Condition
56
2.11 Summary 57
CHAPTER 3 METHODOLOGY OF NEW TRANSFORMER DESIGN
3.1 Introduction
58
3.2 Effects of Harmonic Current on the Power Loss of Magnetic
Materials
58
3.3 Understanding Relation between Magnetic Material Power
Losses and Increase of Sizes
62
3.4 Electromagnetic of New Design of Transformer under
Nonlinear Load Condition
65

v
3.5 General Working Methodology of Research
67
3.6 Methodology of Designing an E-I Core Three Phase
Transformer
68
3.6.1 Calculation of Harmonic Current 70
3.6.2
Relation between Transformer Operating Temperature and
Current Harmonics
71
3.6.3 Determining New Design of Power Transformer
72
3.6.4 (a) Increase of Winding Wire Wize
(b) Increase of Core Dimension
74
74
3.7 Finite Element Analysis on Three Phase Power Transformer at
Linear and Nonlinear Load
75
3.8
Finite Element Modelling Approach to Indicate Effect of
Harmonic Current towards Operation of Transformer
81
3.9
3.9.1
3.9.2
3.9.3
3.9.4
3.10
Determining Transformer Losses
Experiment Procedures
Experimental Equipments and Testing System Circuit
Rectification Process as a Source of Nonlinear Load
Measurement of Material Power Loss and Temperature under
Linear and Nonlinear Load Conditions
Summary
87
88
90
92
95
102
CHAPTER 4 RESULTS AND DISCUSSIONS
4.1 Experimental Results of New Design Three Phase Transformer
103
4.1.1 Utilizing Sizing Factor in The New Design of Three Phase
Transformer under Nonlinear Load Condition
106
4.2 A New Design of Three Phase Power Transformer under
Nonlinear Load Condition
111
4.2.1 Determination of New Transformer Parameter and
Performance
115
4.3 Summary
125

vi
CHAPTER 5
5.1
5.2
CONCLUSION AND FUTURE WORK
RECOMMENDATION
Conclusion
Future Work Recommendation
126
128
REFERENCES
LIST OF PUBLICATION
129
135
Appendix A
Table B.2 Magnetic Wire
137
Appendix B
Design and Dimensional Data E-I Laminations
138
Appendix C
E-I Lamination Thomas & Skinner 14 mil (Selected
Examples)
139
vii
LIST OF TABLE
Table 2.1 VA rating for three phase transformer (adapted from
(Electric, 2012)
9
Table 2.2 Transformer rating and rated current 10
Table 2.3 Transformer Class (adapted from (TWSEG, 2008) 11
Table 2.4 Harmonic limit according to individual order (adapted from
(IEEE, 1992)
43
Table 2.5 Maximum THDi to rated load condition (adapted from
(Kwok-tin, 2003)
44
Table 2.6 Transformer derating (adapted from (Sharifian et.al., 2003) 49
Table 2.7 K rating transformer with respect to equipment THDi 51
Table 2.8 Disadvantages of existing solutions 55
Table 3.1 Design specification 69
Table 3.2 Winding allocation and nature 78
Table 3.3 Flux density at selected regions 86
Table 3.4 Classes of transformer rating 91
Table 4.1 New material sizes of winding wire and transformer core 107
Table 4.2 Winding wire specification with variation of THDi 108
Table 4.3 Transformer core specification with variation of THDi 110
Table 4.4
Table 4.5
Comparison between initial design and new design
Efficiency test data with variations in THDi
112
119
Table 4.6
Efficiency test data with variations in load current 120

viii
LIST OF FIGURE
Figure 2.1 Power transformer locations in a typical power system
network
8
Figure 2.2 Linear load voltage and current waveforms 12
Figure 2.3 An example of sinusoidal current waveform drawn from
ASD heat pump unit
14
Figure 2.4 Categories of power transformer losses 21
Figure 2.5 B-H characteristic of power transformer core in hysteresis
mode
22
Figure 2.6 (a) Changing flux through medium induced eddy
current iec
25
Figure 2.7
(b) Cross sectional area of medium and rotation of iec
within it
Example of material medium
25
26
Figure 2.8 (a) Current going into direction of arrow and the
resulting magnetic field H around the current flow
32
Figure 2.8 (b) Opposite direction of eddy current to the direction
of current (adapted from (Gelduldt, 2005)
32
Figure 2.9 Reduced current density J as it goes to the centre of the
conductor
32
Figure 2.10 Flux density off HV winding cuts through LV windings 34
Figure 2.11 Distribution of electromagnetic field causing stray loss in
power transformer structures
35
Figure 2.12 Average copper temperature rise at transformer with
100% loading
45
Figure 3.1
Figure 3.2
Electrical equivalent circuit of a transformer
Typical temperature rises at magnetic material
59
60
Figure 3.3 Temperature curve at material under variation of THDi 62
Figure 3.4 Relation between material size and THDi 63
Figure 3.5 Determination of transformer magnetic material new size 64
Figure 3.6 General research flow chart 68
Figure 3.7 Finite element modeling general metholody 76
Figure 3.8 Three phase transformer with HV and LV winding
allocation
77

ix
Figure 3.9 Mesh by Opera FE solver 77
Figure 3.10 Flux distribution at core 79
Figure 3.11 Regions with high flux concentration 79
Figure 3.12 Flux density value by using BMOD function 80
Figure 3.13 Flux distribution at transformer under rated current
operation
81
Figure 3.14 Flux density at transformer under rated current 82
Figure 3.15 Flux density at transformer at rms load current with 50%
THDi
82
Figure 3.16 Selected regions to evaluate flux density at transformer
CSA
83
Figure 3.17 Flux density at transformer CSA (left leg) – Region A 83
Figure 3.18 Flux density at transformer CSA (middle leg) – Region B 84
Figure 3.19 Flux density at transformer CSA (right leg) – Region C 84
Figure 3.20 Flux density at transformer CSA – Region D 85
Figure 3.21 Flux density at transformer CSA – Region E 85
Figure 3.22 Flux density at transformer CSA – Region F 85
Figure 3.23 Flux density at transformer CSA – Region G 86
Figure 3.24 One line diagram of experiment procedures 88
Figure 3.25 Experiment procedures for transformer operation under
linear load
89
Figure 3.26 Experiment procedures for transformer operation under
nonlinear load
90
Figure 3.27 Per phase diagram of transformer loading nonlinear load 92
Figure 3.28 (a) Controlled distortion in current with respect to
voltage sinusoidal waveform
94
Figure 3.28 (b) Distortion equals to 52.5% with significant
harmonic components
94
Figure 3.29 Increase of winding wire temperature with variations of
THDi percentage
96
Figure 3.30 Increase of transformer core temperature with variation of
THDi percentage
97
Figure 3.31 Link between operating temperature (T) and THDi (%) 99
Figure 3.32 Relation between winding wire temperature (T) and THDi
(%)
100

x
Figure 3.33 Relation between transformer core temperature (T) and
THDi (%)
101
Figure 4.1 Increase of material temperature with variation of THDi 104
Figure 4.2 Relation between material size, THDi, and rated loss
(temperature)
105
Figure 4.3
Figure 4.4
Figure 4.5
Figure 4.6
Dimensional labelling for E-I stack lamination
Comparison new transformer operating temperature
Electric equivalent circuit of a transformer
Open circuit test transformer equivalent circuit
109
114
115
116
Figure 4.7 Short circuit test transformer equivalent circuit 116
Figure 4.8
Figure 4.9
Percentage of THDi at maximum transformer efficiency
Load current at maximum transformer efficiency
121
122

xi
LIST OF PLATE
Plate 3.1 Test transformer in place before distribution
board
91
Plate 3.2 Nonlinear loads at each phase 92
Plate 3.3
Plate 4.1
A close example of nonlinear load at L3
New design of three phase power transformer
for nonlinear load condition
93
123

xii
LIST OF SYMBOL
θ Angle
ω Angular
∆
Rc
R1
R2
ZT
XT
Xm
Difference
Core Resistance
Primary Resistance
Secondary Resistance
Transformer Impedance
Transformer Reactance
Magnetizing Inductance
ƞ Efficiency
Ω Ohm
µ Permeabiliy
π Pie
ρ Statis Resistivity
∑ Sum
xiii
LIST OF ABBREVIATION
ℛ Reluctant
A Area
At Effective area
AWG American Wire Gauge
B Flux density
f Frequency
h Harmonic order
I Rms current
i(t) Instanteneous current
ih Harmonic current
PC Transformer core Loss
PCOP Transformer copper loss
PEC,C Transformer core eddy current loss
PEC,W Transformer winding eddy current loss
PH,C Transformer core hysteresis loss
PLL Transformer load loss
PNL Transformer no load loss
POSL Transformer other stray loss
PT Total transformer loss
T Temperature
t Time
THDi Total Harmonic Distortion in Current
V Voltage
VA Volt-Ampere (Transformer capacity)
xiv
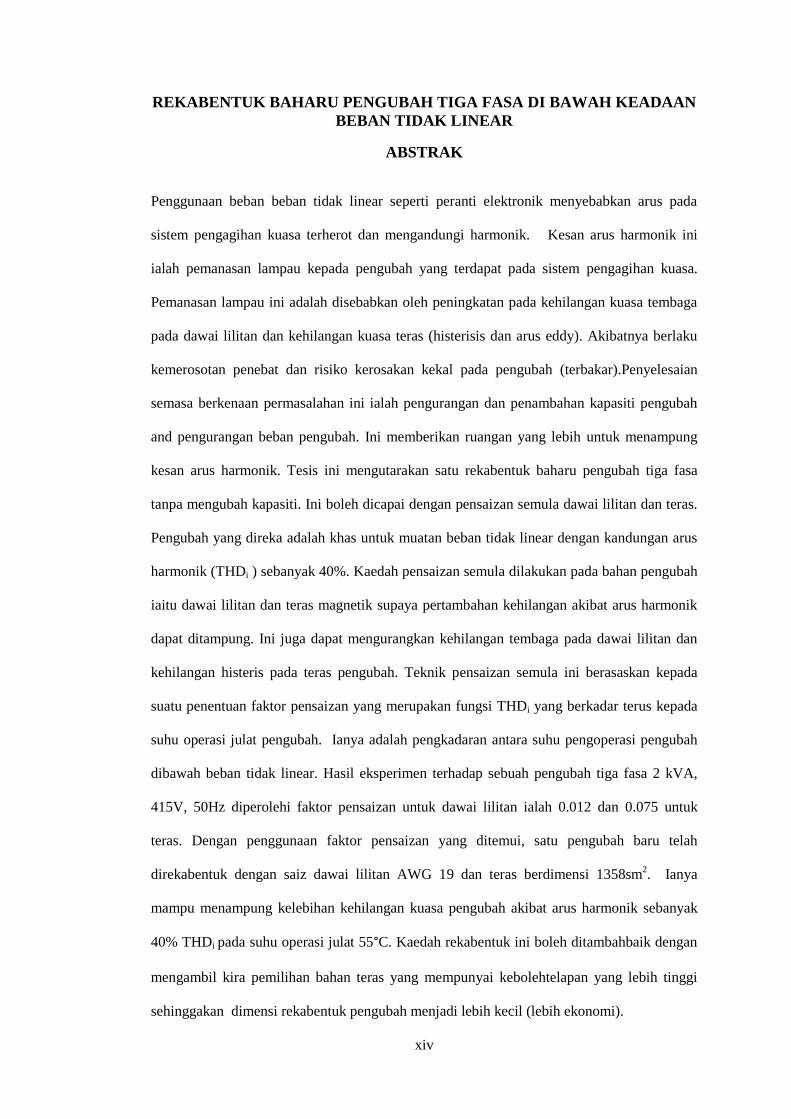
REKABENTUK BAHARU PENGUBAH TIGA FASA DI BAWAH KEADAAN
BEBAN TIDAK LINEAR
ABSTRAK
Penggunaan beban beban tidak linear seperti peranti elektronik menyebabkan arus pada
sistem pengagihan kuasa terherot dan mengandungi harmonik. Kesan arus harmonik ini
ialah pemanasan lampau kepada pengubah yang terdapat pada sistem pengagihan kuasa.
Pemanasan lampau ini adalah disebabkan oleh peningkatan pada kehilangan kuasa tembaga
pada dawai lilitan dan kehilangan kuasa teras (histerisis dan arus eddy). Akibatnya berlaku
kemerosotan penebat dan risiko kerosakan kekal pada pengubah (terbakar).Penyelesaian
semasa berkenaan permasalahan ini ialah pengurangan dan penambahan kapasiti pengubah
and pengurangan beban pengubah. Ini memberikan ruangan yang lebih untuk menampung
kesan arus harmonik. Tesis ini mengutarakan satu rekabentuk baharu pengubah tiga fasa
tanpa mengubah kapasiti. Ini boleh dicapai dengan pensaizan semula dawai lilitan dan teras.
Pengubah yang direka adalah khas untuk muatan beban tidak linear dengan kandungan arus
harmonik (THDi ) sebanyak 40%. Kaedah pensaizan semula dilakukan pada bahan pengubah
iaitu dawai lilitan dan teras magnetik supaya pertambahan kehilangan akibat arus harmonik
dapat ditampung. Ini juga dapat mengurangkan kehilangan tembaga pada dawai lilitan dan
kehilangan histeris pada teras pengubah. Teknik pensaizan semula ini berasaskan kepada
suatu penentuan faktor pensaizan yang merupakan fungsi THDi yang berkadar terus kepada
suhu operasi julat pengubah. Ianya adalah pengkadaran antara suhu pengoperasi pengubah
dibawah beban tidak linear. Hasil eksperimen terhadap sebuah pengubah tiga fasa 2 kVA,
415V, 50Hz diperolehi faktor pensaizan untuk dawai lilitan ialah 0.012 dan 0.075 untuk
teras. Dengan penggunaan faktor pensaizan yang ditemui, satu pengubah baru telah
direkabentuk dengan saiz dawai lilitan AWG 19 dan teras berdimensi 1358sm2. Ianya
mampu menampung kelebihan kehilangan kuasa pengubah akibat arus harmonik sebanyak
40% THDi pada suhu operasi julat 55°C. Kaedah rekabentuk ini boleh ditambahbaik dengan
mengambil kira pemilihan bahan teras yang mempunyai kebolehtelapan yang lebih tinggi
sehinggakan dimensi rekabentuk pengubah menjadi lebih kecil (lebih ekonomi).
xv
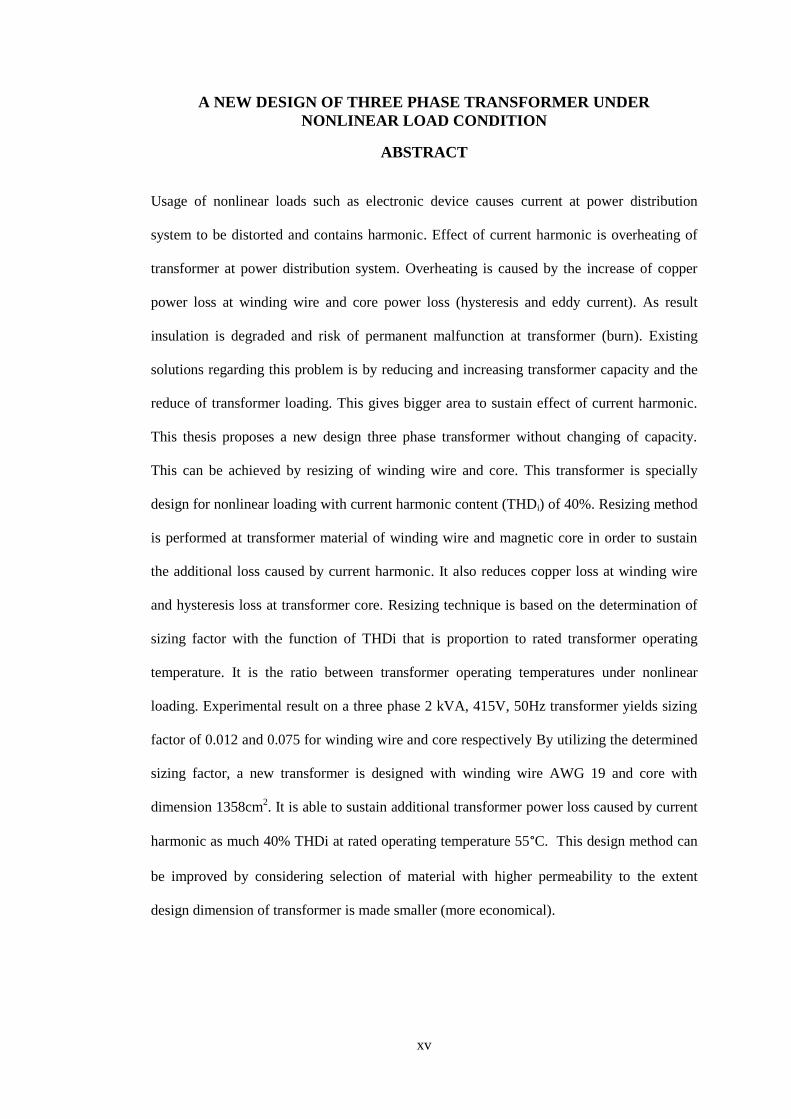
A NEW DESIGN OF THREE PHASE TRANSFORMER UNDER
NONLINEAR LOAD CONDITION
ABSTRACT
Usage of nonlinear loads such as electronic device causes current at power distribution
system to be distorted and contains harmonic. Effect of current harmonic is overheating of
transformer at power distribution system. Overheating is caused by the increase of copper
power loss at winding wire and core power loss (hysteresis and eddy current). As result
insulation is degraded and risk of permanent malfunction at transformer (burn). Existing
solutions regarding this problem is by reducing and increasing transformer capacity and the
reduce of transformer loading. This gives bigger area to sustain effect of current harmonic.
This thesis proposes a new design three phase transformer without changing of capacity.
This can be achieved by resizing of winding wire and core. This transformer is specially
design for nonlinear loading with current harmonic content (THDi) of 40%. Resizing method
is performed at transformer material of winding wire and magnetic core in order to sustain
the additional loss caused by current harmonic. It also reduces copper loss at winding wire
and hysteresis loss at transformer core. Resizing technique is based on the determination of
sizing factor with the function of THDi that is proportion to rated transformer operating
temperature. It is the ratio between transformer operating temperatures under nonlinear
loading. Experimental result on a three phase 2 kVA, 415V, 50Hz transformer yields sizing
factor of 0.012 and 0.075 for winding wire and core respectively By utilizing the determined
sizing factor, a new transformer is designed with winding wire AWG 19 and core with
dimension 1358cm2. It is able to sustain additional transformer power loss caused by current
harmonic as much 40% THDi at rated operating temperature 55°C. This design method can
be improved by considering selection of material with higher permeability to the extent
design dimension of transformer is made smaller (more economical).

1
CHAPTER 1
INTRODUCTION
1.1 Background
In general, sources of power system come from combinations of plants utilizing oil
fired thermal, gas turbine, hydro and mini hydro, diesel, and combine cycle plants. Advance
nations opt for nuclear generated plants and renewable energy sources such as wind turbine,
and solar farming. Through several stages of transmission lines, power system reaches
intended consumer through segregations of voltage levels that varies in accordance to
demands. Main transmission network often involves 66kV – 500kV voltage levels, while
distribution stage includes 33kV downwards until household level of 415/240V(Sulaiman,
2004). At the consumer end, distribution of electricity is separated to primary and secondary
system. A single primary distribution system is capable in feeding several secondary
distribution systems. Secondary distribution system serves residential and commercial
consumers, with variations of load types. Power distribution transformers are important
equipments in stepping down voltage levels from the higher level right to the consumer
loads. Delta primary and wye secondary (∆-Y) is the common winding configuration for
power distribution transformers. One of the reasons is for the primary delta to trap harmonics
from going upstream and its secondary wye provides neutral grounding for unbalance
loading at the phases.
In general, at power distribution system there are two types of loads – linear and
nonlinear loads. Burch explained linear load is a load that supplied by sinusoidal source at
fundamental frequency, produces only fundamental sinusoidal current or voltage (Burch et
al., 2003). For example, they are incandescent lights, induction motors, heaters, and boilers
and mostly available at residental and commercial premises. The other type is nonlinear load.
It is electric loads that significantly changes current waveforms in power system. They cause
distortions at current waveforms through either switching procedures in the equipment

2
installed, changes in electromagnetic properties of the nonlinear load, non periodic current
consumption by the load or simply by the combinations of the three. Flourescent lighthing,
air conditioning system, and variable speed drives (VSDs) are examples of nonlinear load
commonly available at industrials, commercials, and residential premises. Between the two
types of load, it is the nonlinear load that causes bad effect towards the operation of
distribution power transformers. Nowadays there are a lot of loads with nonlinear
characteristic connected to power system and they affected distribution transformers.
Distorted current waveforms means current harmonic exist and circulates inside the delta-
wye transformer. At a large distribution system, typical Total Harmonic Distortion in current
(THDi) ranges from 23.2% to 90.5% (Kushare et al., 2005) and EPR predicted 85% of all
power electric flows through combinations of nonlinear loads (Priyadharshini et al., 2012).
With such amount of harmonic distortion in current, the effects towards operation of power
transformer are substantial and the consequences are severe.
Desmet et al., described that nonlinear loads trigger the surge of pulses which cause
the distortion of current (Desmet et al., 2002). As results, observation to the distorted current
yields that there are combinations of fundamental and harmonic components and multiples
of frequencies to the fundamental frequency (Kneschke, 1999). Harmonic components in
current are a real risk towards power system reliability where they can easily adds up in
neutral conductor inside a three phase four wire system as neutral conductor is filled with
current nearly 2 times compared to line conductors, thus overcapacity occurred at neutral
line and greatly affecting material insulation properties (Ngandui & Paraiso, 2004). With
respect towards power system equipment such as power transformers, harmonic components
in current cause root mean square (RMS) of current to rise (Abbas & Saqib, 2007; Masri &
Chan, 2011). Variations in harmonic frequencies also increase hysteresis losses and
inductance values at transformers. An example of nonlinear load rising rms current
magnitude is observation by Grady that net harmonic current by personal computers and
light dimmers at 3rd
, 5th, and 7
th harmonic orders are about 81%, 53%, and 25% higher
3
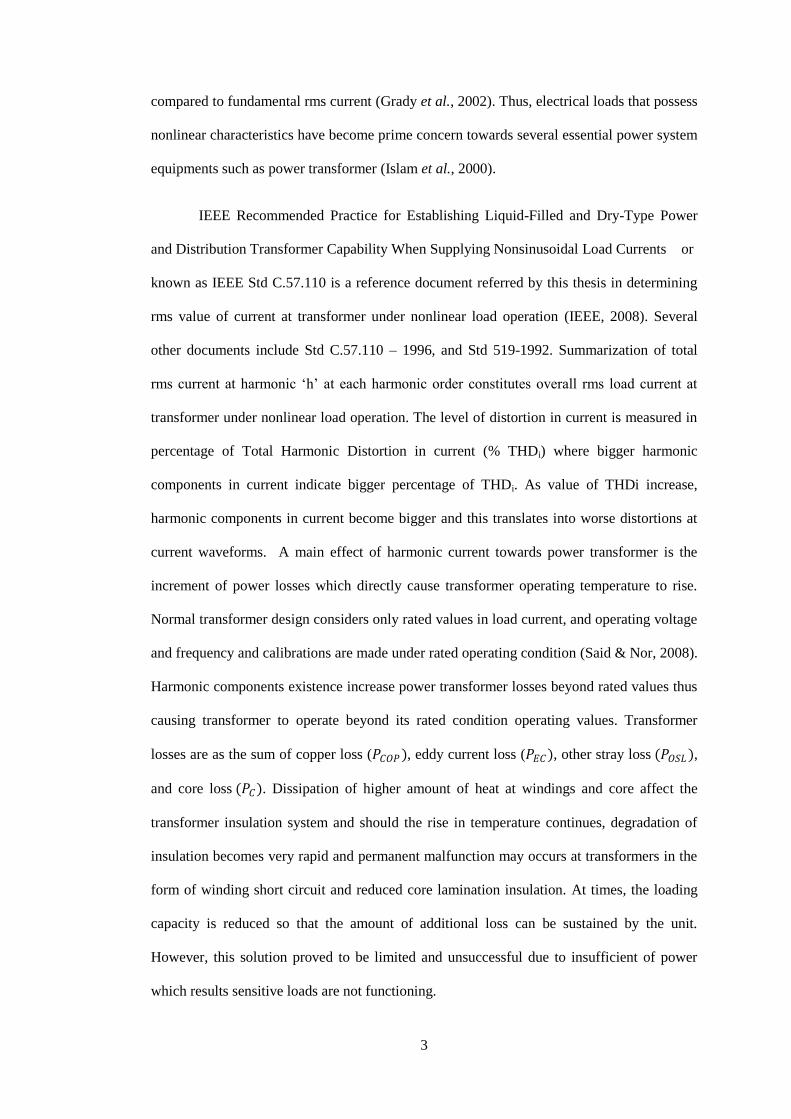
compared to fundamental rms current (Grady et al., 2002). Thus, electrical loads that possess
nonlinear characteristics have become prime concern towards several essential power system
equipments such as power transformer (Islam et al., 2000).
IEEE Recommended Practice for Establishing Liquid-Filled and Dry-Type Power
and Distribution Transformer Capability When Supplying Nonsinusoidal Load Currents or
known as IEEE Std C.57.110 is a reference document referred by this thesis in determining
rms value of current at transformer under nonlinear load operation (IEEE, 2008). Several
other documents include Std C.57.110 – 1996, and Std 519-1992. Summarization of total
rms current at harmonic ‘h’ at each harmonic order constitutes overall rms load current at
transformer under nonlinear load operation. The level of distortion in current is measured in
percentage of Total Harmonic Distortion in current (% THDi) where bigger harmonic
components in current indicate bigger percentage of THDi. As value of THDi increase,
harmonic components in current become bigger and this translates into worse distortions at
current waveforms. A main effect of harmonic current towards power transformer is the
increment of power losses which directly cause transformer operating temperature to rise.
Normal transformer design considers only rated values in load current, and operating voltage
and frequency and calibrations are made under rated operating condition (Said & Nor, 2008).
Harmonic components existence increase power transformer losses beyond rated values thus
causing transformer to operate beyond its rated condition operating values. Transformer
losses are as the sum of copper loss (𝑃𝐶𝑂𝑃), eddy current loss (𝑃𝐸𝐶), other stray loss (𝑃𝑂𝑆𝐿 ),
and core loss (𝑃𝐶). Dissipation of higher amount of heat at windings and core affect the
transformer insulation system and should the rise in temperature continues, degradation of
insulation becomes very rapid and permanent malfunction may occurs at transformers in the
form of winding short circuit and reduced core lamination insulation. At times, the loading
capacity is reduced so that the amount of additional loss can be sustained by the unit.
However, this solution proved to be limited and unsuccessful due to insufficient of power
which results sensitive loads are not functioning.

4
Life expectancy of transformer also greatly reduced due to insulations and magnetic
materials having to sustain bigger losses than they were designed for. Therefore, it is
acceptable to conclude that transformer operation often limited by the amount of temperature
it is designed for. During operations with nonlinear loads, increase in temperature at power
transformer goes beyond its rated values indicating the substantial rise in its operating
temperature (Geduldt, 2005).
1.2 Objectives
A few objectives are set for the completion of this thesis and they are:
(a) To produce a new design of power distribution transformer under nonlinear load
condition operation.
(b) To design a new transformer that is capable to operate at rated servicing temperature
with variations of THDi with a maximum of 50%
(c) To obtain a sizing factor to increase the sizes of magnetic core and winding wire of
transformer. The increase in sizes is emphasis with the new sizes to produce rated
servicing temperature.
(d) To find the relation between content of harmonic in current (THDi) with properties
of transformer such as temperature rise, and losses of magnetic winding and core.
1.3 Problem Statement
Widespread use of nonlinear loads has caused alarming cautions towards the
operation of power distribution transformers. Characteristic of loads has become more to
nonlinear and this causes severe effects towards transformer (Astorga et al., 2006).
Noticeable effects include rise of operating temperature of magnetic winding and core of
transformer (Al-Mousaoy, 2011), which leads to derating and reducing its capacity. Now that
it has to feed loads with much nonlinear characteristics, additional losses occur at power
transformers causing them to rise. KVA rating of transformer is determined by the full load

5
current which contains only fundamental components drawn at the primary winding (Rama
Rao, 2003). With the inclusion of nonlinear loads and current harmonics, the rating is no
longer applicable. Thus the transformer rating has changed (El-Saadawi et al., 2008) and has
to increase to accommodate current harmonic (Masri and Chan, 2011) .
This thesis explains a new solution to solve the problems of power transformer
operating under nonlinear load conditions. A new design of transformer is proposed where it
is capable to operate under nonlinear load. This new design is able to sustain the additional
losses caused by current harmonics. It produces similar amount of losses as rated operation
condition. By having a larger size of winding wire size and a larger magnetic core
dimension, the effects of harmonic losses can be sustained. The bigger sized materials can
accommodate the additional harmonic losses caused by nonlinear load and solve the issue of
increase in operating temperature. In the end, a new power transformer is produced and
tested under nonlinear load condition. Novelty of this new design is that it is a specially
designed unit to operate at full load current with variations of THDi. Unlike the existing in-
transformer solutions which emphasis on rising transformer kVA capacity or reducing
transformer loading, the new design also maintains its capacity and at the same time operates
at rated servicing temperature.
1.4 Scope of Research
In completing this thesis, a few scopes of research are determined in order to gather
the attention to the desired focus. They are:
a) In analyzing the effect of harmonics towards operation of transformer, only
distortion in current is considered. Level of voltage is assumed to be sinusoidal
without harmonic contents.
b) Testing and analysis considers dry type power distribution transformers. The
winding configuration is delta wye.

6
c) For the transformer testing, the content of harmonic is raise to a maximum 50%
THDi.
d) Pattern of THDi is assumed to be inversely proportional to the order of the
harmonics.
e) Typically available surveys on harmonic contents in current at small power
distribution system are taken as the THDi limits for the new power transformer.
1.5 Thesis Contribution
The contributions of this thesis varied from technical point of view as well as field
education as general. They are listed as follow.
a) A new design of transformer under nonlinear load condition is produced.
b) The new transformer is also another dimension for in-transformer harmonic current
mitigation methods.
c) A new transformer specially designed for nonlinear load operation is possible to be
produced with normal material type (ρ)
d) New knowledge relating THDi and loss parameters of transformer are found.
e) Effect of nonlinear load towards operating temperature of transformer is established.
1.6 Thesis Layout
This thesis is divided into five chapters. The first is the Introduction which presents
brief insight to the introductory of power system, harmonics, and transformer, and problem
statement which provide an impetus for this thesis development. The second chapter is the
Literature Reviews undertaken by this thesis. Previous researchers’ findings are discussed
and used to enhance this thesis progression and direction. Third is Methodology which
explains methods executed by this thesis in achieving objectives set. Flow charts are
presented in describing steps taken in mathematical analysis, finite element modeling, and
experimentations. Chapter 4 is the Results and Discussion which represents the findings of

7
this thesis in meeting the objectives set. Under this chapter the new design of transformer
under nonlinear load condition is proposed in detail. Final chapter is the Conclusion where it
summarizes the work of this thesis. It concludes overall accomplishment of this thesis with
an elaboration on future work in this research with more specific complete with added value
to current work.

8
CHAPTER 2
LITERATURE REVIEW
2.1 Electrical Power System
Electrical power system serves as a main framework in changing and transferring
electric energy from one form or one level to another level. Normally it is formed by three
main sub systems: generation, transmission, and distribution. Marizan (2004) explains that
three of them coexist with each other where transmission system delivers power generated
by generation systems, and distribution system spreads the power to consumers. This
delivery system is made possible with the inclusion of power transformer at distribution
points. Figure 2.1 shows placement of power transformer in a typical power system.
Generation plantsStep up power
transformerTransmission line
500kV – 66kV
Transmission
pylons
Power transformer
for HV consumers
HV consumers
Distribution
substation
Primary distribution
system 33kV-11kV
Secondary
distribution ystem
415/240VResidential
consumers
Commercial
consumers
Figure 2.1 Power transformer locations in a typical power system network
VA rating of power transformer varies according to its requirements of voltage, and full load
current at the load side (Electric, 2012). While the primary voltage rating follows the voltage

9
value at the distribution system, the secondary voltage is determined by the voltage required
at the load for the transformer to deliver its rated capacity (TWSEG, 2008). In
mathematically the VA rating of three phase transformer can be determined by:
TR L FLS 3 V I (2.1)
Where:
STR is the kVA rating of transformer
VL line voltage of system
IFL is full load current of transformer
Similarly in order to determine rated current of transformer, equation (2.1) can be utilized as
well. Table 2.1 shows an example of transformer VA rating commonly available from a
transformer designer Jefferson Electric (Electric, 2012).
Table 2.1 VA rating for three phase transformer (adapted from (Electric, 2012)
Transformer VA rating as in Table 2.1 considers voltage source of 480V. For voltage source
of 415V, transformer VA rating and rated current can be tabulated as in Table 2.2.

10
Table 2.2 Transformer rating and rated current
Transformer
(kVA)
Rated current iL (A)
1 1.39
2 2.78
3 4.17
6 8.34
9 12.5
15 20.8
* For rating voltage 415 V
Generally VA rating of transformer is determined by the transformer current carrying
capacity with the assumption of voltage source is constant. Content of current is capable to
raise the temperature of transformer due to accumulation of internal losses as rated current
results in rated transformer losses. The losses in transformer are proportional to the amount
of current, which means as the amount of current increase the loss is also increases. Thus,
limitation of transformer capacity is determined by its temperature. Capacity of kVA of one
particular transformer is its capability to provide an output with rated frequency, and current.
Insulation material that built the unit serves as indication to its temperature rating which
reflects its thermal capacity and kVA rating. Practical limitation on a power transformer is
the ability of it to deliver load current, 𝐼𝐿 without exceeding an already rated temperature
value. Thus, in selecting a unit of power transformer, attention must also be given towards it
temperature rating. Table 2.3 shows classification of transformer class.
11
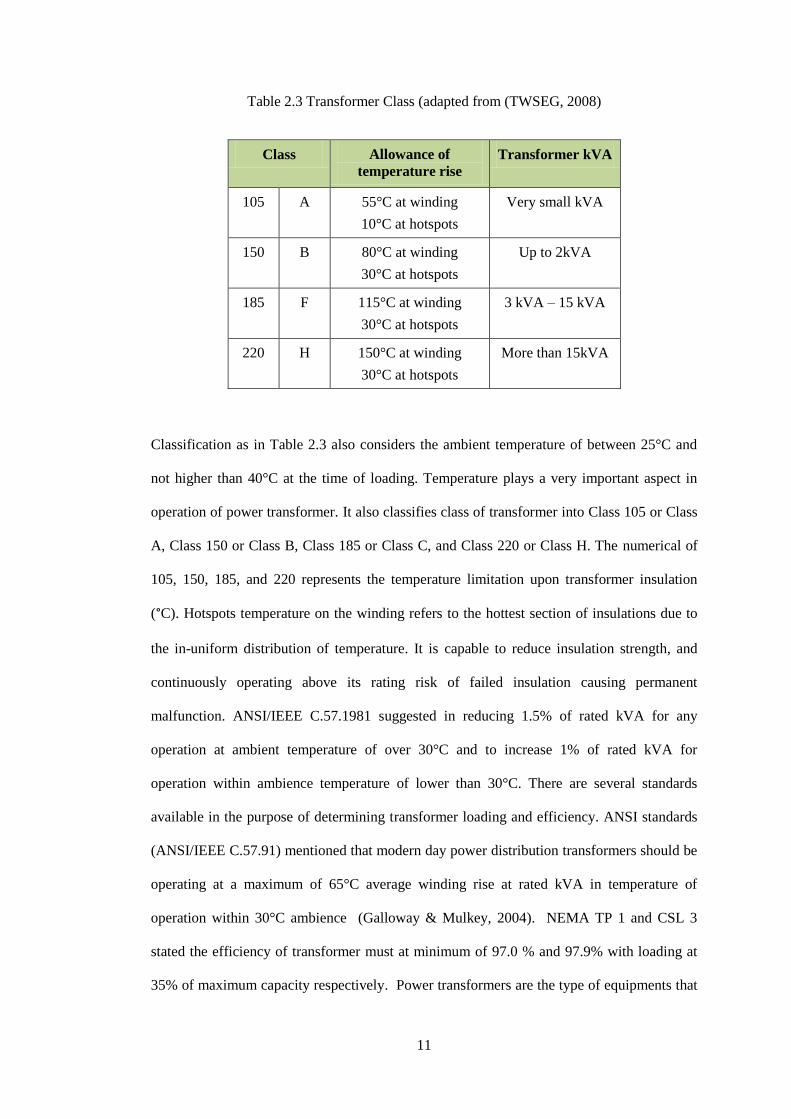
Table 2.3 Transformer Class (adapted from (TWSEG, 2008)
Class Allowance of
temperature rise
Transformer kVA
105 A 55°C at winding
10°C at hotspots
Very small kVA
150 B 80°C at winding
30°C at hotspots
Up to 2kVA
185 F 115°C at winding
30°C at hotspots
3 kVA – 15 kVA
220 H 150°C at winding
30°C at hotspots
More than 15kVA
Classification as in Table 2.3 also considers the ambient temperature of between 25°C and
not higher than 40°C at the time of loading. Temperature plays a very important aspect in
operation of power transformer. It also classifies class of transformer into Class 105 or Class
A, Class 150 or Class B, Class 185 or Class C, and Class 220 or Class H. The numerical of
105, 150, 185, and 220 represents the temperature limitation upon transformer insulation
(°C). Hotspots temperature on the winding refers to the hottest section of insulations due to
the in-uniform distribution of temperature. It is capable to reduce insulation strength, and
continuously operating above its rating risk of failed insulation causing permanent
malfunction. ANSI/IEEE C.57.1981 suggested in reducing 1.5% of rated kVA for any
operation at ambient temperature of over 30°C and to increase 1% of rated kVA for
operation within ambience temperature of lower than 30°C. There are several standards
available in the purpose of determining transformer loading and efficiency. ANSI standards
(ANSI/IEEE C.57.91) mentioned that modern day power distribution transformers should be
operating at a maximum of 65°C average winding rise at rated kVA in temperature of
operation within 30°C ambience (Galloway & Mulkey, 2004). NEMA TP 1 and CSL 3
stated the efficiency of transformer must at minimum of 97.0 % and 97.9% with loading at
35% of maximum capacity respectively. Power transformers are the type of equipments that

12
are load derived. Their types, winding configurations, sizing, temperature and kVA ratings,
and related standards are often considered the load characteristics. This further highlights the
importance of characteristics of load in determining the capacity of power transformers.
2.2 Characteristics of Load in Power System
The kVA rating of power transformer is related to the types of load available in
power system. Older units which dealt with linear types of load produce less power quality
problems and they have lower kVA and temperature ratings. Due to low possibility in
current harmonic problems, they possess lower overloading capacity (CRC Press, 2004).
Generally, in power system, there are two types of loads and they are linear load and
nonlinear loads. Combination of both type of loads exist in power system. However the
combinations of the loads are producing nonlinear characteristics.
Linear load has characteristic of drawing sinusoidal current whenever it is connected
to the voltage source of the power system (Kneschke, 1999). Burch mentioned that linear
load produces sinusoidal wave current at fundamental frequency, where it is similar to power
system frequency (Burch, 2003). Both voltage and current waveforms are of the same shape
at fundamental frequency. Figure 2.2 shows similarity of voltage and current waveforms
within fundamental frequency.
v/i
π/2
v
i
0 πθ
ωt
Figure 2.2 Linear load voltage and current waveforms

13
Mathematically the voltage and current waveforms drawn from linear load can be expressed
as:
1v(t) v sin t (2.2)
1i(t) i sin t (2.3)
Where:
i t is the instantaneous current
i1 is current fundamental component
v t is the instantaneous voltage
v1 is the voltage fundamental component
ω1 is the angular velocity equals 2πf1 and f1 is power system fundamental
frequency
θ is the phase angle between voltage and current
With reference to the waveforms in Figure 2.2, only fundamental components of 𝑖1 and 𝑣1
exist. Both contain only fundamental frequency, f1 (power system frequency). For example,
fundamental frequency of Malaysia power system is 50Hz. Linear loads are often resistive,
capacitive, or inductive in nature. Typically available linear loads are motors, heaters, and
incandescent lighting.
Instead, nonlinear loads produce distortions towards the current drawn and the
current waveform becomes nonsinusoidal, which consists of harmonic components. Consider
Figure 2.3 shows an example of nonlinear load nonsinusoidal current waveform from an
ASD heat pump unit.

14
Figure 2.3 An example of sinusoidal current waveform drawn from ASD heat pump unit
Common nonlinear loads available in power distribution network can be classified into three
categories; a) consisting filtered bridge rectifiers and single phase capacitor – example PCs
and TVs, b) consisting three phase power converter – example ASDs, and c) consisting
phase controlled single phase load – example heating loads and light dimmers.
2.3 Current Harmonic Distortion
Nonsinusoidal waveform is periodic in nature where it is combination of sinusoidal
waveforms with variation of frequencies. Thus, for such repetition waveforms, it can be
represented by Fourier analysis as:
h max
O h
h 1
f (t) F f (t)
(2.4)
ASD Heat Pump Current Waveform #1
Current - Ampere
THD = 123%
Phase Angle - Degree

15
Where:
𝐹𝑜 is the average value; = 1
2𝑎𝑜
h max
h
h 1
f (t)
is the variations of waveforms with frequencies and magnitudes;
h max
h h
h 1
a cos(h t) b sin (h t)
.
Similarly to current distortion caused by nonlinear load, harmonic current can be represented
as:
h max
1 h
h 1
i(t) i t i (t)
(2.5)
Where:
i1 is the fundamental component of current
ih is the fundamental component of current at h order of harmonic.
Equation (2.5) also can be rewrite as the following:
h max
1 1 1 h h h
h 1
i(t) 2 i sin ( t ) i (sin h t )
(2.6)
The rms value of current can be calculated by solving equation (2.5) and (2.6) and replacing
the integral limit from T1 to 0, with T1 equals to 1/f1 = 2π/ω1 :
1T
2 1/2
1 0
1I ( i (t)dt)
T (2.7)
Thus, by replacing i(t) in equation (2.7) with i(t) as in equation (2.5), rms value of current
can be determined as:

16
h max2 2 1/2
1 h
h 1
I (i i )
(2.8)
Distortion in current is quantified by the term THDi (Total Harmonic Distortion in current)
and it is represented in percentage (%). The bigger percentage means more distortion the
current is, thus indicating the large amount of harmonic components in current. THDi is the
ratio between sums of rms harmonic currents to the rms of fundamental current and is
described as:
h max2
h
h 2
i 1
I
THD x100%I
(2.9)
Where:
Ih is the rms harmonic current (from h=2nd
order to h=maximum significant order)
I1 is the rms fundamental current value.
2.4 Effects of Nonlinear Load to Power Distribution System
The widespread use of electronic devices which are the nonlinear loads has raised
the concern over current harmonic problems. Equation 2.3 and 2.4 show that rms value of
current rise with the existence of harmonic components as well as containing multiple
harmonic frequencies.
Earliest discovery of power quality problems associated with harmonics was found
with the saturation of irons in machines and transformers produced third harmonics current.
Several common problems are capacitor failures, and interference in sensitive equipments
such as meters and over current relays (Xu et al., 1991). ANSI/IEEE Std 18-1980 indicates,
including the inclusion of harmonic components, capacitor operation is limited at 180% of
rated rms current, or 1.8 times to the rated rms current (Wagner et al., 1993). Several surveys
indicated that due to widespread use of nonlinear loads to perform desired tasks, current
harmonics varies between 15% to 40% at selected small scale industries and domestic

17
premises (Nasini et al., 2012) (Gajanayake et al., 2005). Harmonic currents have an
abnormal high peak, according to (Desmet et al., 2002) where it can be as high as triple to
the RMS value of current. Harmonic producing loads are sensitive and immensely in used
today after the emergence of the electronics in the past a few decades (Gul & Bayrak, 1999) .
Single phase SMPS are big source of net harmonic currents which prompted the IEC to
implement regulations such as standard IEC 1000-3-2 in maintaining the health of an ac
system (Mansoor & Grady, 1998). Rectification process involves usage of diodes and
thyristors in controlling the dc power. This procedure causes injection of current harmonics
into system thus causing distortion in current and results in poor power quality. However by
thoroughly examine the parameters of the rectification system, inject of current harmonics
could be lessen (Kazem et al., 2005). Characteristic of single phase nonlinear load has been
studied to contain unbelievably high harmonic content between 102.8% THDi and 101.5%
THDi for fluorescent lamp with electronic ballast and UPS load respectively (Umeh et al.,
2003). Commonly found single phase nonlinear loads in households, offices, and industrial
places include fluorescent lighting, and equipments that possessed switch mode power
supplies (SMPS) such as televisions, fridge, and air conditioners among the vast examples
(Sankaran, 2002).
Among the examples of nonlinear loads available at industrial premises are static
converters, rectifiers, furnaces, phase controller, and rotating machines. Upon machines, the
rotor is impacted with some non negligible additional current that are induced in the damper
winding. According to Girgis, et. al (1989) it is not uncommon for large industrial loads to
produce high magnitude of current distortion, due to harmonics. An existence of 5th
harmonic in at industrial level transformer and capacitor banks tend to increase transformer
and capacitor rms currents to 91% and 132% respectively (Girgis et al., 1990). In a literature
explaining an experiment with VSD another common source of nonlinear loads at industrials
it is found that significant 5th, 7
th, and 11
th order harmonic current are produced (Islam et al.,
2000).

18
Overall THDi of a typical single phase system is recorded at 77% which is typical to
all single phase electronic equipments such as PC (Khan & Akmal, 2008) (Aintablian, 1996).
However, the distortion of current can be reduce through attenuation and diversity as proved
by Mansor, et.al., (Mansoor et al., 1995). Work by Venkatesh, et. al, (2008) shows modeling
of nonlinear loads ranging from industrial type of loads such as ASD to domestic loads of
house hold appliances such as TV sets, lightning, and personal computers (Venkatesh et al.,
2008). Important power system observatory and safety equipments such as fusing system,
and energy metering are also affected by nonlinear load existence inside power distribution
system. Meter phase is no longer accurate due to current and voltage that flow through
energy meter is no longer fundamental, but they contain harmonic components (Edwards et
al., 2011). The peak current value as high as 60% compared to rated has prompted the fuse
to trip even only at non reaction setting (Desmet et al., 2002). New developed applications in
conventional vehicles and Electric Vehicle (EV) are also in danger with the existence of
harmonic components in current. Nasiri in his literature discussed about harmonic producing
loads in undersea vehicles and ship, among others are electromagnetic gun, ASD system,
AC/DC rectifiers, and switching power supplies (Nasiri, 2005). Major power quality
problem inside the battery chargers for the EV is current harmonics. It is said that in future,
EV battery chargers still capable of producing distortion in current ranging from 10% -
100%. Although charging system and harmonic cancellation procedure operate at the same
time, distortion in current still exist between 6% to 30% in tested models.
Design of modern electrical system must consider the characteristics of loads
connected or predicted in the future to be installed in system. Based on the survey by Ling
and Eldridge, predominant harmonics belongs to the triplens, however special attention must
be accorded to high degree 5th and 7
th harmonics (Ling & Eldridge, 1994). They also
concluded that harmonic currents are capable to create voltage distortion where injection of
harmonic components in current interacts to the power system impedance thus resulting
distorted voltage of system. In a typical city distribution system, Yong mentioned that
19
commonly available nonlinear loads exist in the form of trolley bus converting station, arc
furnace, and equipments that contain SMPS such as TVs and microcomputers (Yong, 1997).
The effect of harmonic current is more obvious during low load hours when the load current
is low and voltage rises from many installed transformers in network (Wiechowski et al.,
2008). In a three phase four wire system, 3rd
harmonics current returns through the neutral
conductor and the three individual 3rd
harmonic current from each phase add up for a bigger
neutral current. Sometimes the amount could be 1.73 times or as much as 3 times the phase
current. As result, common effect of nonlinear loads towards 3 phase 4 wire system is the
severe damage to the neutral conductor as overheat and overcapacity occurred and cause
failure insulation and short circuit (Spitsa & Alexandrovitz, 2004). Document BS 7671 524-
020-03 stated that due to harmonic components in current, the neutral conductor must
possess CSA (cross sectional area) of not less than of phase conductor CSA (BEAMA,
2004). In a suggested remedy towards big neutral current, modern system designer must
consider neutral conductor as one of the current carrying conductor, and it must be
monitored on time basis. In fact, all neutral components such as the terminals and busbars
should be sized for the additional and hazardous neutral current (Gul & Bayrak, 2002). With
respect to neutral conductor CSA, it is adequate to size it at 1.73 times to the phase
conductor size, in order to protect the system (Gruzs, 1989a). An intriguing investigation
yield that by adding more nonlinear loads into distribution network actually reduce the THDi
and subsequently cancel some of the harmonic currents. This is due to the nature to the 5th
and 7th harmonic current from single and three phase nonlinear loads often act counter phase
(Hansen et al., 2000). Limiting the amount of harmonic current at point of common coupling
(PCC) from 5% to 20% is another approach by IEEE Std 519 in controlling load connectivity
to preserve power system harmonic current absorption capacity (Gruzs, 1989b).
In safeguarding power distribution system from the problem of harmonic currents,
advance modeling and estimations of harmonic are two important aspects to be explored.
Venkatesh produced network modeled after case study at the ISRO Cartosat 2A distribution

20
system. The simulation showed installation of capacitor banks ease the effect of nonlinear
loads in system where the data showed reduction of at least 1.0% at condition without the
banks(Venkatesh et al., 2008).
2.5 Power Transformer Losses
Thermal breakdown occurrence can be analyzed through a curve of energy as a
function of time. It also defines any equipment’s thermal breakdown point where failure of
material or insulation properties to withstand dissipation of loss or heat occurs. Power
transformer capabilities are thoroughly dependent to its thermal limit. As it nears the limit,
risk of breakdown is real thus corrective measures must be undertaken to avoid permanently
malfunction. Hotspot temperature is a term typically describes about power transformer
temperature pattern under loading (Pierce, 1994).
Life of dry type or liquid filled transformer depends on operational temperature
(Delaiba et al., 1995). IEC document 60076 – 11:2004 indicates that insulations are
classified according to their rated maximum operational temperature. It is an acceptable fact
that the operation of transformer depends on its material insulation properties and majority of
breakdowns are attributed to failure of insulating system (Geduldt, 2005). Rated kVA
capacity is designed based on maximum current delivered at rated voltage. Limitation of a
transformer operating capacity is the amount of current it is able to sustain without
exceeding rated temperature rise (TSEWG, 2008). However, with nonlinear load, the rated
kVA is no longer applicable due to the fact the current now no longer of rated value.
Harmonic current produces additional losses which cause the transformer operating
temperature to be bigger than operation under rated values.
High losses affecting the lifetime of power transformer which means signification
reduction of operational years. Internal heating is known to be an important factor where
cumulative of heat dissipation is able to reduce the strength of the dielectric materials and
saturate the insulations. The main problem is design procedure of power transformer does
21
not consider the nonlinear characteristic of current and voltage. Designers design and
calibrate the unit based at rated condition, however these days current has become more non
linear thus it is effecting the operation of power transformer. Losses of transformer can be
classified into two; no load loss and load loss, and both form the total loss of transformer.
Figure 2.4 illustrates categories of power transformer losses.
Transformer
Losses
No Load Load Loss
Copper
Loss
Eddy
current
Stray LossHysteresis Eddy
current
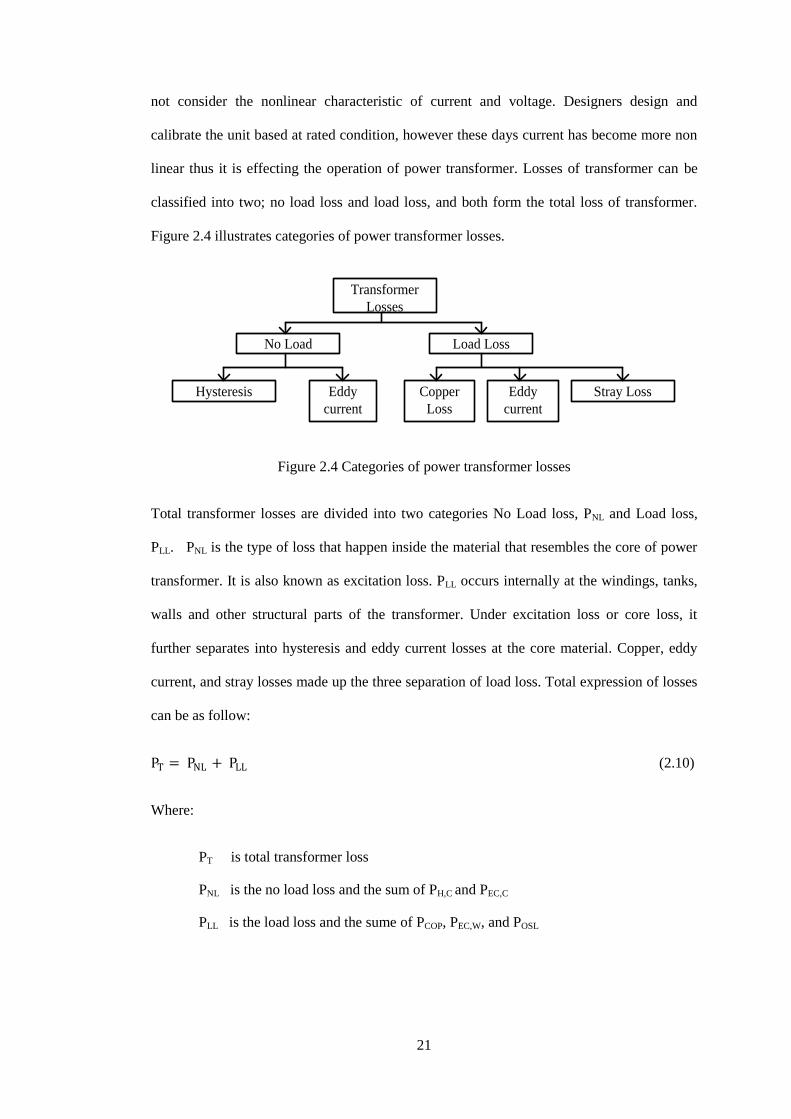
Figure 2.4 Categories of power transformer losses
Total transformer losses are divided into two categories No Load loss, PNL and Load loss,
PLL. PNL is the type of loss that happen inside the material that resembles the core of power
transformer. It is also known as excitation loss. PLL occurs internally at the windings, tanks,
walls and other structural parts of the transformer. Under excitation loss or core loss, it
further separates into hysteresis and eddy current losses at the core material. Copper, eddy
current, and stray losses made up the three separation of load loss. Total expression of losses
can be as follow:
PT = PNL + PLL (2.10)
Where:
PT is total transformer loss
PNL is the no load loss and the sum of PH,C and PEC,C
PLL is the load loss and the sume of PCOP, PEC,W, and POSL

22
2.5.1 No Load Loss
This is the type of loss that occurred at power transformer during current excitation
point. Loss includes dielectric loss, winding loss due to excitation and circulating current,
and core loss. However the most dominant of these is the core loss, with the other two are
very small and often negligible. Core loss or also known as iron loss is made of by
combination eddy current loss and hysteresis loss at the laminated core sheets.
2.5.1.1 Hysteresis Loss in Core
Hysteresis loss happens due to resistive nature of core material to realignment of
magnetic domains in it. However, to overcome this resistance, some amount of power is
needed in order to change magnetic alignment due to existence of supply voltage at the
primary end of transformer. Amount of power required in this process depends on the
operating frequency, the amount and type of core material, and the magnitude of magnetic
flux density. Hysteresis loss also dependent towards flux density which in turn also
dependent to the voltage that supplied to the unit and the number of winding turns at primary
end. Figure 2.5 shows BH characteristic curve of a core under hysteresis.
Figure 2.5 BH characteristic of power transformer core in hysteresis mode
Φ, B
Bmax
im, H
-Bmax
Br
-Br
Area

23
The area mentioned at the BH depicts at Figure 2.5 shows the amount of power needed to
oppose core material resistance to realign the changes in magnetism. It produces energy
which exists in the form of heat and cause increase in temperature at the core. Figure 2.5 also
shows with the increase of hysteresis, magnitude of ac magnetic flux Bmax also increase as
well as operating frequency. The amount of energy can be mathematically expressed as
below.
loopW (Hdb) (volume)
(2.11)
Where:
H is the energy stored in magnetic field
db is the variation of magnetic flux density of the measured loop area
Empirical justification upon total hysteresis energy loss in a certain volume can be found as:
n
H maxW bB (2.12)
Where:
WH is the energy by hysteresis loss
b and n are materials properties
Several agreements are made in relation to (2.12) where the flux density is uniformly
distributed and varyingly in cycle with frequency f. Power loss per cycle then can be
quipped as:
n
H maxP (b)(volume)(fB ) (2.13)

24
Equation (2.13) explains the hysteresis power loss is dependent on materials’ efficiency, its
volume, its operating frequency, and its magnetism properties. By knowing the Bmax
representation that relates to cross sectional area (CSA) of the core, applied voltage,
frequency of operation and number of turns, (2.13) can be simplified into a more complete
equation of hysteresis. While Bmax is known as:
max
c
V NIB
4.44f NA L
(2.14)
Where:
V is the applied voltage
N is the number of turn
Ac is the area
µ is the material permeability
I is the current at solenoid turns
L is the solenoid length
Thus by combining (2.14) and (2.13), transformer core hysteresis power loss (PH,C) can be
mathematically defined as:
maxH,C
c
n
max
C
VP (b) (volume) ( f ( )n)
4.44fNA
L x IbVf
NA
(2.15)
As noted by equation (2.15), hysteresis power loss at transformer magnetic core depends on
several parameters such applied voltage, solenoids’ length and number of turn, operating
frequency, and materials’ size and magnetism properties. However there are assumptions are
made in order to justify the hysteresis loss equations, and they are:
i. Each lamination that form stacked core has its own magnetic characteristics.
ii. Flux density across each lamination is assumed to be uniform.