A New Approach for Designing Steam Splitters and Inflow ... · 6/10/2013 1 A New Approach for...
11
6/10/2013 1 A New Approach for Designing Steam Splitters and Inflow Control Devices in Steam Assisted Gravity Drainage RESERVOIR SIMULATION GROUP Mohammad Kyanpour Zhangxing Chen OUTLINE Introduction to Steam Splitters & Inflow Control Devices Model Description Results & Conclusions Summary Acknowledgements Slide 2 RESERVOIR SIMULATION GROUP
Transcript of A New Approach for Designing Steam Splitters and Inflow ... · 6/10/2013 1 A New Approach for...

6/10/2013
1
A New Approach for Designing Steam Splitters and Inflow
Control Devices in Steam Assisted Gravity Drainage
RESERVOIR SIMULATION GROUP
Mohammad Kyanpour
Zhangxing Chen
OUTLINE
Introduction to Steam Splitters & Inflow Control Devices
Model Description
Results & Conclusions
Summary
Acknowledgements
Slide 2
RESERVOIR SIMULATION GROUP
6/10/2013
2
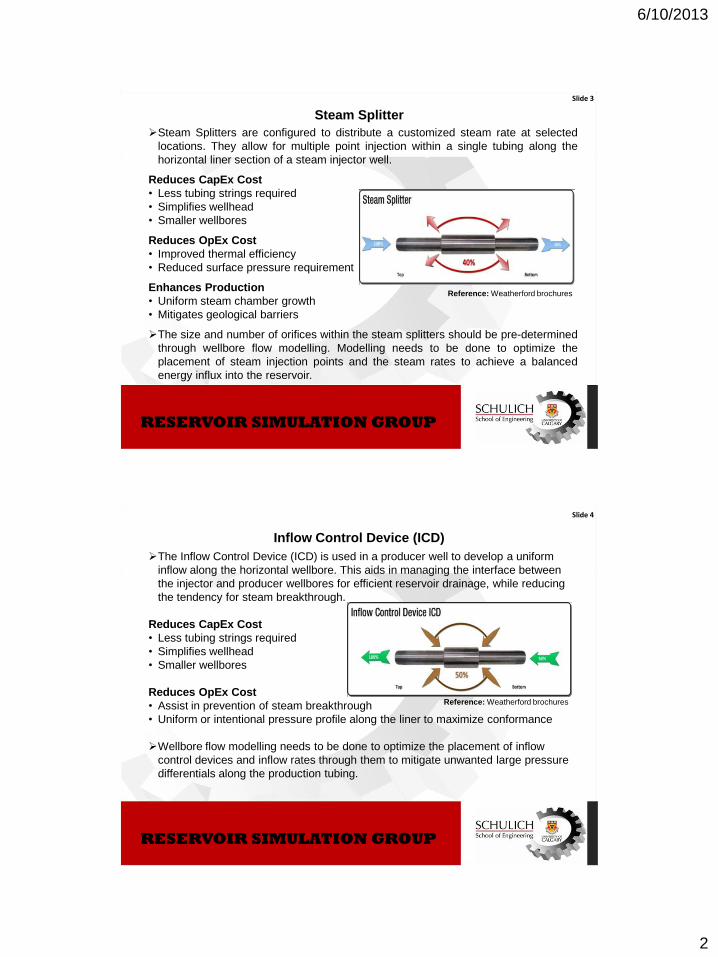
Steam Splitter
Steam Splitters are configured to distribute a customized steam rate at selected
locations. They allow for multiple point injection within a single tubing along the
horizontal liner section of a steam injector well.
Reduces CapEx Cost
• Less tubing strings required
• Simplifies wellhead
• Smaller wellbores
Reduces OpEx Cost
• Improved thermal efficiency
• Reduced surface pressure requirement
Enhances Production
• Uniform steam chamber growth
• Mitigates geological barriers
The size and number of orifices within the steam splitters should be pre-determined
through wellbore flow modelling. Modelling needs to be done to optimize the
placement of steam injection points and the steam rates to achieve a balanced
energy influx into the reservoir.
Slide 3
Reference: Weatherford brochures
RESERVOIR SIMULATION GROUP
Inflow Control Device (ICD)
The Inflow Control Device (ICD) is used in a producer well to develop a uniform
inflow along the horizontal wellbore. This aids in managing the interface between
the injector and producer wellbores for efficient reservoir drainage, while reducing
the tendency for steam breakthrough.
Reduces CapEx Cost
• Less tubing strings required
• Simplifies wellhead
• Smaller wellbores
Reduces OpEx Cost
• Assist in prevention of steam breakthrough
• Uniform or intentional pressure profile along the liner to maximize conformance
Wellbore flow modelling needs to be done to optimize the placement of inflow
control devices and inflow rates through them to mitigate unwanted large pressure
differentials along the production tubing.
Slide 4
Reference: Weatherford brochures
RESERVOIR SIMULATION GROUP

6/10/2013
3
Southern Pacific Senlac Project
Southern Pacific owned and operated since November 2009, previously owned by
EnCana.
Depth: 750 m, Reservoir Temperature: 29 oC, Current Reservoir Pressure:~2,600 kPaa
One pad of 2-3 SAGD well pairs drilled per year.
Currently operating Phases G, H, J and K.
This study was done for J Phase.
Slide 5
RESERVOIR SIMULATION GROUP
Slide 6
24 m
71 m
1,225 m
Number of Grids: 36x71x24=61,344
35mx1mx1m
i x j x k
Inj GDA 1@193 m ICP
Inj GDA 2@858 m ICP
Prod GDA 1@368 m ICP
Prod GDA 2@683 m ICP
Shale
Cummings
Dina
Devonian
Liner Hz Length=1,120 m
Tubing Length=1,085 m (35 m less than Liner)
Liner Size:7” Tbg Size: 4.5” Inst. Tbg: 1.5”
Model Description
RESERVOIR SIMULATION GROUP

6/10/2013
4
Slide 7
Model Description (Cont’d)
Schedule:
1-Three weeks of steam injection into the producer (Bullhead)
2-Shut-in for a Week to install ESP
3-Start SAGD: Steam injection in the injector and production from the producer
Producer Constraints During Bullhead
Producer: Max Steam Injection Rate=400 m3/d CWE
Max BHP=8,500 kPaa
Producer & Injector Constraints During SAGD
Producer: Min BHP=2,200 kPaa
Max Steam Production Rate Allowed in the Wellbore= 0.5 m3/d CWE
Max Liquid Rate=900 m3/d
Injector: Max BHP=3,500 kPaa
Max Steam Injection Rate=350 m3/d CWE
RESERVOIR SIMULATION GROUP
Slide 8
Oil Production Potential
A parameter calculated by STARS which is a function of: permeability, porosity,
pay thickness, relative perm to oil, oil viscosity, pressure and oil saturation.
0
10
20
30
40
50
60
70
80
90
100
0
6,000
12,000
18,000
24,000
30,000
36,000
42,000
48,000
54,000
60,000
0 100 200 300 400 500 600 700 800 900 1000 1100 1200 1300 1400
Oil
Pro
du
ctio
n P
ote
nti
al D
istr
ibu
tio
n [
%]
Oil
Pro
du
ctio
n P
ote
nti
al
Length [m]
Initial Oil Production Potential
Initial Oil Production Potential %
50% of oil potential
38% of the well length
15% of oil potential
36% of the well length
35% of oil potential
26% of the well length
RESERVOIR SIMULATION GROUP

6/10/2013
5
Slide 9
Initial Oil Production Potential Distribution Versus Geology
Dina
Devonian
Shale
Cummings
Dirty Channel/Mud Injector
Producer
RESERVOIR SIMULATION GROUP
STEP I: Investigate the impact of Steam Splitters and Inflow Control
Devices on SAGD performance and the quantity of each
Slide 10
Using GDAs in the Injector and Producer is beneficial. In the first year of SAGD, having One
Production GDA with no Injection GDA, increases oil production by 11.5%. Using only One Injection
GDA with no Production GDA increases oil production by 38%. Using both Production & Injection
GDAs increases oil production by 45% in the first year. These values are just for the number, size
and location of the ports mentioned in the above table for this reservoir.
We can achieve the optimum wellbore dynamics with one GDA in each producer and injector
wellbore.
RESERVOIR SIMULATION GROUP

6/10/2013
6
Why first year of performance forecast?
Slide 11
Impact of GDAs on
performance is more
significant in the first year.
Models with Injection GDA
Models without Injection GDA
RESERVOIR SIMULATION GROUP
STEP I - Initial Oil Production Potential distribution along the well pair
and Convection Heat Transfer distribution along the Injector
Slide 12
Ranking based on oil production and convective heat transfer: Case 1-2-3-4, 5, 7, 6, 8, 0
RESERVOIR SIMULATION GROUP

6/10/2013
7
STEP I – Steam chamber growth after 1 year
Slide 13
Ranking based on oil production and convective heat transfer: Case 1-2-3-4, 5, 7, 6, 8, 0
The pictures below show
oil saturation on this layer
Heel Toe
RESERVOIR SIMULATION GROUP
STEP II: Determine the number of ports for the Injector GDA
Slide 14
The increase in the number of Injector GDA ports did not result in any
significant changes in the overall oil production/performance.
Evaluation of convective heat distribution and oil production potential along
the well pair after 6 and 12 months suggested that an Injection GDA with 14
ports gives the best conformance.
RESERVOIR SIMULATION GROUP

6/10/2013
8
Slide 15
The increase in the number of Production GDA ports from 1 to 8 did not
significantly change the overall oil production/performance. All the runs
were made for a 14 port Injection GDA.
Evaluation of convective heat distribution and oil production potential
along the well pair after 6 and 12 months suggested that a Production
GDA with 4 ports gives the best conformance.
STEP III: Determine the number of ports for the Producer GDA
RESERVOIR SIMULATION GROUP
Slide 16
Benefits of using Injection GDA
For the same Pressure, Temperature & Steam Quality at the heel of injection tubing, the cases
without GDAs and with GDAs report the steam rates of 241 and 350 m3/d CWE respectively.
Using injection GDA, we can inject at higher steam rates with lower pressure drop in the horizontal
wellbore. In this case ~200 m3/d CWE of steam leaves the tubing through GDA and only 150 m3/d
CWE of steam flows through the toe. Therefore, there is a lower friction pressure drop from the
GDA to the toe (slower slope). This results in thermal efficiency improvement.
Inside Injection Tubing
Annulus ΔP=~200-300 kPa
Blue: No GDA case
Red: Optimum Case
GDA
ΔP=325 kPa
ΔP=510 kPa
Pressure Profile for the same BHP & Steam Quality at the heel of the Injection Tubing
RESERVOIR SIMULATION GROUP

6/10/2013
9
Slide 17
Benefits of using Injection GDA (cont’d)
Using injection GDAs, for the same flow conditions at the heel of the injection tubing (P, T & Steam
Quality), we can inject at higher steam rates and the injector annulus would be at higher pressure
and temperature.
Using injection GDAs will result in uniform draining of two sides of the mud channel. The
temperatures on both sides of the channel are similar.
Blue: No GDA case
Red: Optimum Case
ΔT=3 oC
Temperature Profile for the same BHP & Steam Quality at the heel of the Injection Tubing
RESERVOIR SIMULATION GROUP
Slide 18
Benefits of using Production GDA
The pressure drop along the producer annulus in the case of using no GDAs is 54 kPa, while for
the optimum case with GDA is 7 kPa. Using production GDA results in a more uniform pressure
in the producer annulus. This helps to avoid steam production/short-circuiting.
Using production GDA, 56% of the produced liquid enters the production tubing/scab liner
through the GDA. Hence, pressure drop from the toe to the GDA location is much less in the
case of using production GDA compared with the case with no production GDA.
Inside Scab Liner
Annulus GDA
Blue: No GDA case
Red: Optimum Case
Pressure Profile
RESERVOIR SIMULATION GROUP

6/10/2013
10
Slide 19
Summary
A work flow for designing Steam Splitters & Inflow Control Devices
in SAGD operations was presented. The approach includes both
reservoir and wellbore flow modelling.
The benefits of using both Steam Splitters & Inflow Control Devices
were shown using FlexWell.
RESERVOIR SIMULATION GROUP
Sponsors
20 RESERVOIR SIMULATION GROUP

6/10/2013
11
RESERVOIR SIMULATION GROUP
Thank You