Evolving Neural Networks That Are Both Modular and Regular ...

HAL Id: hal-00732119https://hal.archives-ouvertes.fr/hal-00732119
Submitted on 14 Sep 2012
HAL is a multi-disciplinary open accessarchive for the deposit and dissemination of sci-entific research documents, whether they are pub-lished or not. The documents may come fromteaching and research institutions in France orabroad, or from public or private research centers.
L’archive ouverte pluridisciplinaire HAL, estdestinée au dépôt et à la diffusion de documentsscientifiques de niveau recherche, publiés ou non,émanant des établissements d’enseignement et derecherche français ou étrangers, des laboratoirespublics ou privés.
A neural network approach for the development ofmodular product architecturesJohn Pandremenos, George Chryssolouris
To cite this version:John Pandremenos, George Chryssolouris. A neural network approach for the development of modularproduct architectures. International Journal of Computer Integrated Manufacturing, Taylor & Francis,2011, �10.1080/0951192X.2011.602361�. �hal-00732119�

For Peer Review O
nly
A neural network approach for the development of modular
product architectures
Journal: International Journal of Computer Integrated Manufacturing
Manuscript ID: TCIM-2010-IJCIM-0041.R1
Manuscript Type: Original Manuscript
Date Submitted by the Author:
19-Nov-2010
Complete List of Authors: Pandremenos, John; University of Patras, Laboratory for Manufacturing Systems and Automation
Chryssolouris, George; University of Patras, Laboratory for Manufacturing Systems and Automation
Keywords: DESIGN, NEURAL NETWORKS
Keywords (user): DSM
URL: http://mc.manuscriptcentral.com/tandf/tcim Email:[email protected]
International Journal of Computer Integrated Manufacturing
For Peer Review O
nly
A neural network approach for the development of modular product
architectures
J. Pandremenos and G. Chryssolouris*
Laboratory for Manufacturing Systems and Automation, University of Patras, Rio,
Patras 26500, Greece
*Corresponding author.
Tel. +302610997262
Fax. +302610997744
Email: [email protected]
The clustering of a product’s components into modules is an effective means of creating
modular architectures. This paper initially links the clustering efficiency with the
interactions of a product’s components and interesting observations are extracted. A
novel clustering method utilizing Neural Network algorithms and Design Structure
Matrices (DSMs) is then introduced. The method is capable of reorganizing the
components of a product in clusters, in order for the interactions to be maximized inside
and minimized outside the clusters. Additionally, a multi-criteria decision making
approach is used, in order for the efficiency of the different clustering alternatives,
derived by the network, to be evaluated. Finally, a case study is presented to
demonstrate and assess the application of the method. The derived algorithmic clustering
proved to be more efficient compared with the empirical one and thus, it can be used by
design engineers as an effective tool for the derivation of product clustering alternatives.
Keywords: design; Neural Networks; DSM
1. Introduction
A major customer demand is often the tailoring of a product to specific, individual
needs. The challenge is how to design and produce fast and inexpensively,
customized and easily adaptable goods of a high quality that are adequate for a mass
market. The development of modular design architectures is considered as an
efficient practice in order for this challenge to be met. The clustering of a product’s
components into modules is such an approach that involves the procedure of grouping
these components together, in order for dense interactions to be maintained within the
cluster and sparse outside them. The clustering technique transforms a non modular,
at part level, product design architecture into a modular one, at a clusters level.
Deleted: high quality
Deleted: ,
Deleted: which
Page 1 of 18
URL: http://mc.manuscriptcentral.com/tandf/tcim Email:[email protected]
International Journal of Computer Integrated Manufacturing

For Peer Review O
nly
A tool often used for the representation of the interaction among the elements
of a system, whether the system is a product, process or organization, is the Design
Structure Matrix (DSM). These matrices are usually binary, square and contain the
name of the system’s elements along their side (as row headings) and across the top
(as column headings). Whilst a link exists between node c to node d, the value of the
c-d element is regarded as unity or it is marked with X, otherwise, the element value
is zero or it is left empty. The diagonal elements of such matrices usually have a zero
value or they are left empty as well, since they do not play any role within the matrix
(Ulrich and Eppinger 2003). Clustering in a DSM is accomplished when the elements
of the matrix are rearranged so as to form groups, which comply with the clustering
rule: maximum interactions within the clusters and minimum outside them.
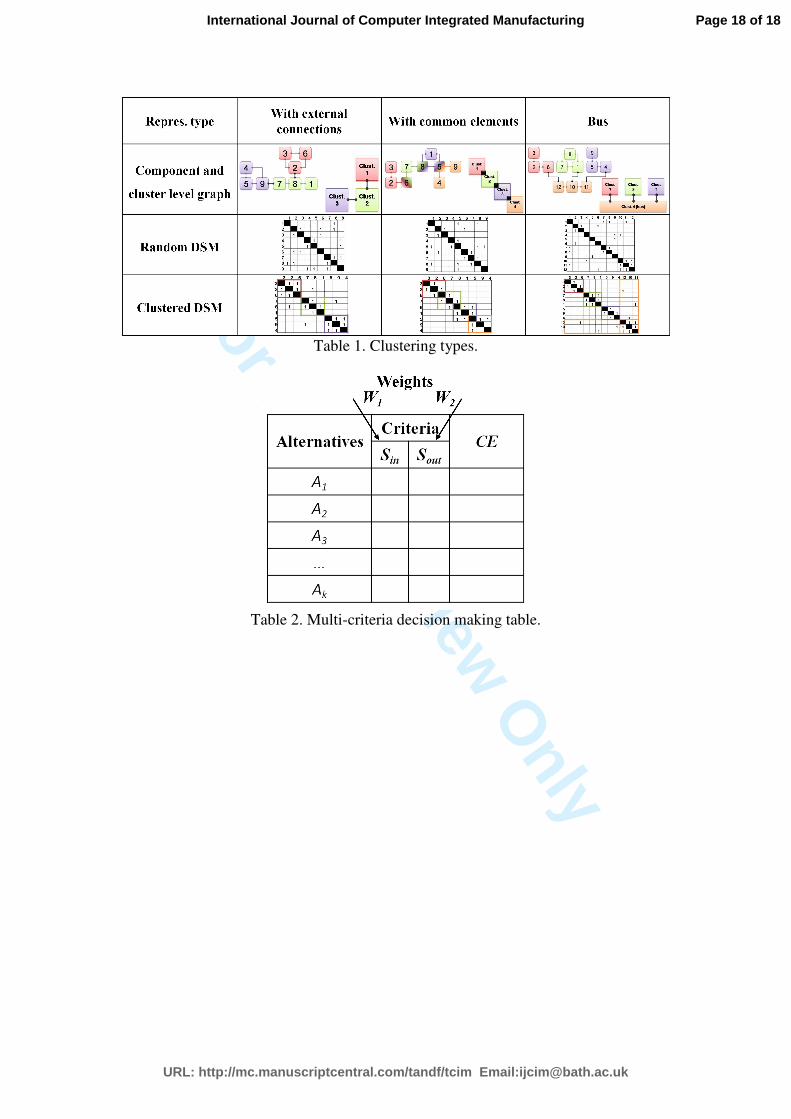
Table 1 shows examples of different clustering types.
In literature, a large amount of efficient methods for the development of
modular design architectures is available: from the Axiomatic Design Theory of Suh
(1990) and the Total Design of Pugh (1991) to the adaptable design of Gu et al.
(2004), the Modular Function Deployment of Ericsson and Erixon (1999) and the
Platform-Based Product family Development of Simpson et al. (2006). However, for
the purposes of this paper, only approaches focusing on the DSM clustering are
reviewed.
A large number of the clustering algorithms developed, are based on Genetic
Algorithms (GAs). Yu et al. (2003, 2007) developed a GA in order to perform DSM
clustering, using as criterion the minimum description length (MDL) principle that is
based on information theory. Some interesting features of their algorithm are the
possibility of having overlaps among the modules as well as the capability of
performing bus clustering. In 2006, the NASA Scientific and Technical Information
Deleted: used
Page 2 of 18
URL: http://mc.manuscriptcentral.com/tandf/tcim Email:[email protected]
International Journal of Computer Integrated Manufacturing

For Peer Review O
nly
(STI) Program Office developed in Excel, an efficient GA that was performing
clustering on DSMs included in a spreadsheet format within the program (Rogers et
al. 2006). Idicula’s (1995) approach was the first successful attempt to perform
clustering with a stochastic algorithm that was attempting iteratively to decrease the
value of a total coordination cost function. A couple of works were based on this
approach and developed it even further (Fernandez 1998, Thebeau 2001).
Mueller (2004) employed the King’s and the Modified Minimum Degree
algorithms so as to perform a sparse matrix reordering, in dot plot visualizations, to
reveal clusters within a data set. Dot plots, similarly to DSMs, are used to displaying
relationships among the elements in a data set. Sangal et al. (2005) represented
complex software architectures with DSMs and attempted to manage them with the
help of Lattix Inc’s Dependency Manager (LDM). LDM is the first commercially
available implementation of the DSM analysis for software. It offers algorithms that
may perform partitioning of DSMs, a task which is quite similar to clustering.
Browning (2001), in his review work, explained in detail, the importance of
the DSM clustering, described its different types, presented a number of algorithms
developed for that reason and gave examples of their application. Yassine and Braha
(2003) showed how clustering of project tasks with the help of DSM representations
can facilitate the concept of concurrent engineering. Furthermore, Yassine (2004)
employed DSMs and clustering algorithms for the planning, execution and
management of complex product development projects. Several clustering algorithms
that utilize simple mathematical operations have been developed for the formation of
“families” in process planning (Chryssolouris 2006). Additionally, Oliveira et al.
(2009) proposed a bipartite graph modelling with a graph clustering algorithm for the
partitioning of parts into “families” and the machines of a shop floor into groups, in
Page 3 of 18
URL: http://mc.manuscriptcentral.com/tandf/tcim Email:[email protected]
International Journal of Computer Integrated Manufacturing

For Peer Review O
nly
order to obtain manufacturing cells. Finally, Vesanto and Alhoniemi (2000)
investigated different approaches for the clustering of Self-Organizing Maps (tool for
data mining). Special attention was given to agglomerative clustering and partitive
clustering using k-means.
The above literature review has revealed that few techniques for the clustering
of a product parts there exist. A major part of these methods, which are indeed the
most efficient ones, is based on GAs in conjunction with the DSMs. Moreover, the
survey has shown that currently, there is no algorithm enabling the designer to
preselect the number of clusters that will be deriving from the clustering procedure.
The objective of this work is to investigate the clustering efficiency of the
different design architectures (at part level) as well as to develop a method, capable of
performing the clustering of a product’s components by using DSMs and Neural
Networks. In the next section, the clustering efficiency of the different architectures
is assessed. Section 3, describes comprehensively the clustering method proposed.
Section 4, examines the application of the new method to a real case study, a “state of
the art” car “Body in White”. In the last section, the results derived are evaluated and
conclusions are drawn.
2. Clustering Efficiency Assessment
Two main architectures are recognised in design, the integral (coupled interactions
among parts) and the modular one (uncoupled interactions between parts) (Ulrich
1995). However, very often, products of combined architectures exist.
The efficiency of a product’s components clustering is directly related to the
product’s design architecture, at part level. A product, having the fewest possible
interactions among its parts, is considered being an ideal modular product, at part
Page 4 of 18
URL: http://mc.manuscriptcentral.com/tandf/tcim Email:[email protected]
International Journal of Computer Integrated Manufacturing
For Peer Review O
nly
level. The clustering of the parts of such a product would result in sparse clusters,
also with sparse interactions among them (Figure 1a). On the other hand, an ideal
integral product, at part level, has the maximum possible number of interactions and
therefore, the application of the clustering technique to this product would lead to
dense clusters with dense interactions among them (Figure 1b).
Through the aforementioned observations and by going over the definition of
the ideal clustering (dense interactions within the clusters and sparse among them) it
may be concluded that clustering is not worthy when having ideal design architectures
(either integral or modular). In the case of a combined architecture (nowadays trend),
efficient clustering is feasible as it can be seen in the example of Figure 1c. The
clustering technique transforms non modular product design architecture into a
modular one.
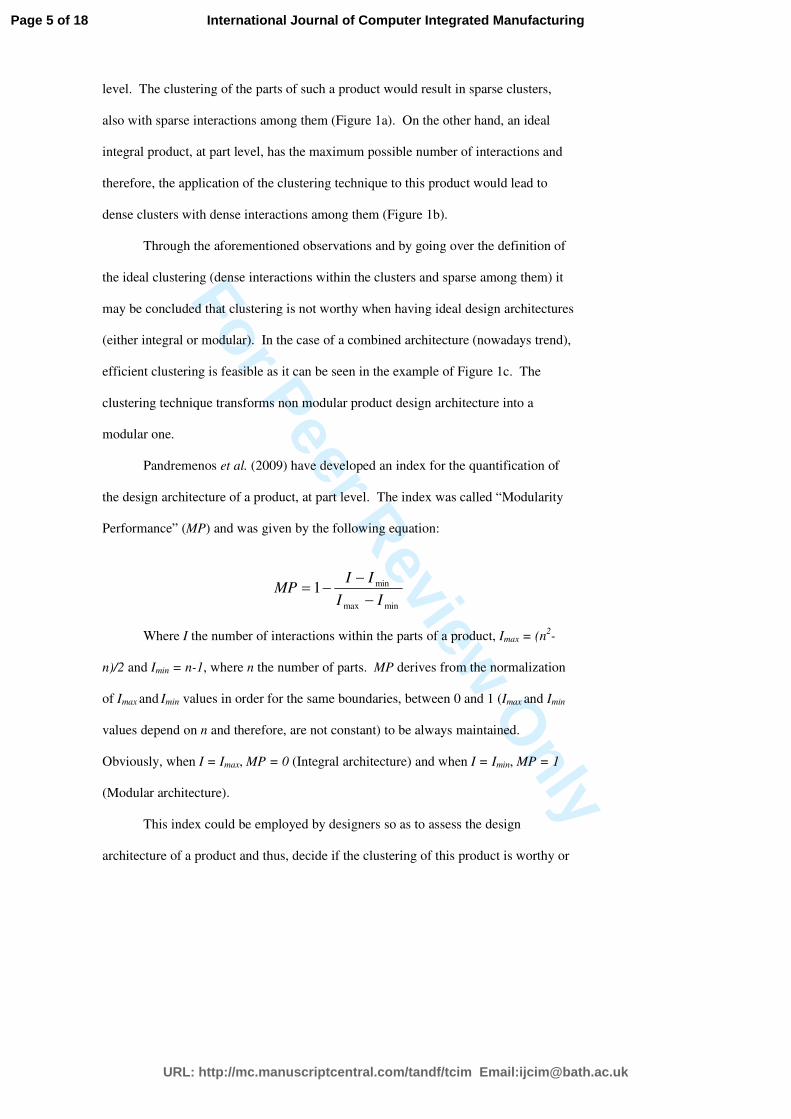
Pandremenos et al. (2009) have developed an index for the quantification of
the design architecture of a product, at part level. The index was called “Modularity
Performance” (MP) and was given by the following equation:
minmax
min1II
IIMP
−
−−=
Where I the number of interactions within the parts of a product, Imax = (n2-
n)/2 and Imin = n-1, where n the number of parts. MP derives from the normalization
of Imax and Imin values in order for the same boundaries, between 0 and 1 (Imax and Imin
values depend on n and therefore, are not constant) to be always maintained.
Obviously, when I = Imax, MP = 0 (Integral architecture) and when I = Imin, MP = 1
(Modular architecture).
This index could be employed by designers so as to assess the design
architecture of a product and thus, decide if the clustering of this product is worthy or
Page 5 of 18
URL: http://mc.manuscriptcentral.com/tandf/tcim Email:[email protected]
International Journal of Computer Integrated Manufacturing

For Peer Review O
nly
not. The closer the MP value would be to the boundaries (0 or 1) the less worthy
would be the clustering of this product.
3. DSM Clustering Algorithm
The problem of clustering the components of a product into modules, in terms of their
interactions, is non linear. Neural Networks are well known for their capability of
solving non linear problems. The algorithm proposed in this paper, is based on Self
Organizing Neural Networks (SONNs) trained with unsupervised competitive
learning and on DSM representations. The idea is to represent the interactions of each
product’s components through the DSM, with vectors, which are afterwards inserted
into the network for clustering. This may be the first attempt for solving the DSM
clustering problem with such an approach.
3.1. Algorithm description
The SONNs are widely utilized for the clustering of multidimensional data. The
layout of such a network consists of three layers: the input, the competitive and the
output (Figure 2). A brief explanation of each layer follows:
• Each node (v1 ... vi) of the input layer is a n-dimensional vector.
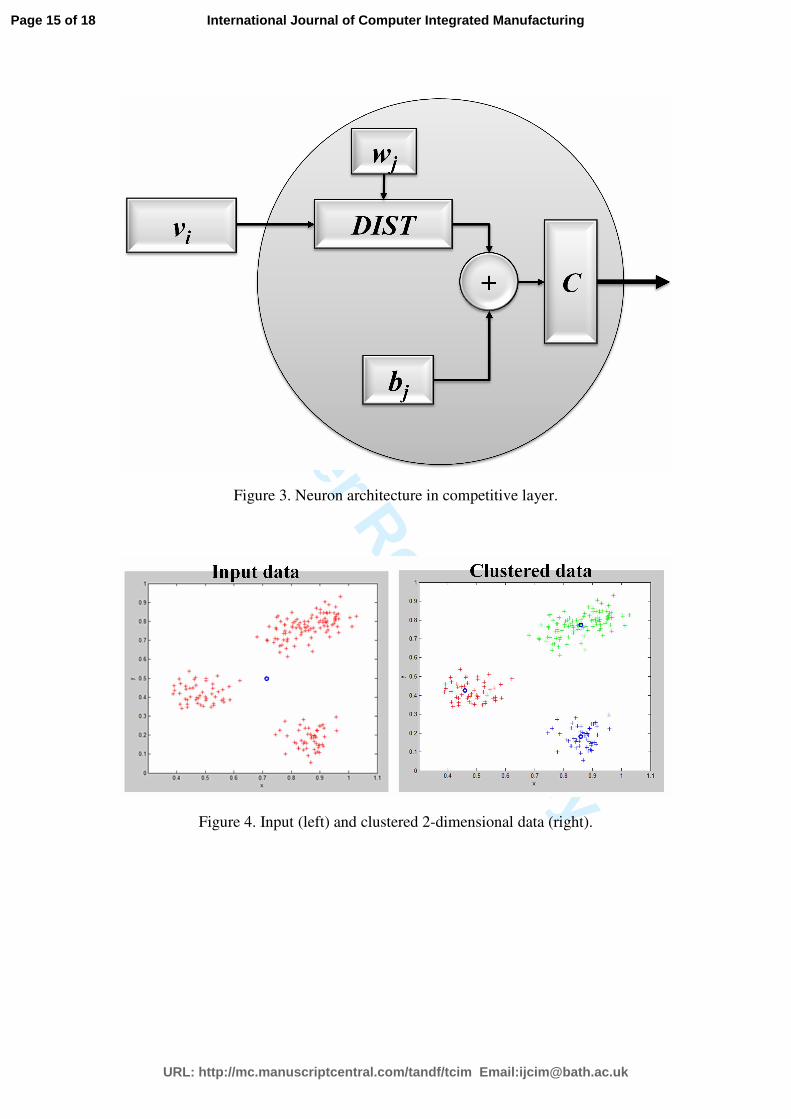
• Each node of the competitive layer is a neuron as in Figure 3. The number of
neurons is equal to that of the desired clusters to be produced.
• The single node of the output layer indicates the cluster each element of the
input layer belongs to.
The main idea behind the SONN is to group together the elements of the input
layer.
Each neuron (Figure 3) of the competitive layer is composed of:
• Weights (wj)
Deleted: t
Deleted: e
Page 6 of 18
URL: http://mc.manuscriptcentral.com/tandf/tcim Email:[email protected]
International Journal of Computer Integrated Manufacturing

For Peer Review O
nly
• These weights are vectors of the same dimension (n) as the input data vectors.
The distance between vi and wj is the main criterion of the jth
neuron for
selecting or not, the ith
element for the jth
cluster.
• Biases (bj)
The role of the bias is very important. The bias either “helps” to or “prevents”
the elements from being grouped in certain clusters. It is formed in such a
way so as to secure the formation of a predefined clusters’ number of about
the same number of elements. Consequently, the absence of bias would
permit the network to form fewer clusters than the desired number and in a
different magnitude.
• A distance function (DIST)
It calculates the Euclidian distance between vi and wj.
• A summing function
It adds the distance to the bias.
• A competitive transfer function (C)
It decides whether or not the ith
element will belong to the jth
cluster.
At each run of the network, the input vi enters one after the other all the
neurons (cluster) and the Euclidean distance between vi and wj is calculated. Then,
this calculated distance is added to the bias of the neuron in the summing function.
Finally, the sum enters the competitive function (C), which decides whether or not the
vi is going to be clustered into the certain cluster-neuron (Figure 3). The initial value
given to the weights occurs from the midpoint function (places the weights in the
middle of the input ranges). The cluster-neuron that wins the input vi is called the
“winner” neuron. After the completion of each run, the network provides a clustering
result. However, in order for the network to get trained, the aforementioned
procedure is iterated (epochs). At each epoch, the weights are updated based on the
Kohonen learning rule and the biases, according to the “learncon” learning function
(it grows the bias disproportionally to the percentage of the wins that a neuron
accomplishes). Three hundred epochs are sufficient for a well trained network
(Kohonen 2001).
3.1.1. Example
Page 7 of 18
URL: http://mc.manuscriptcentral.com/tandf/tcim Email:[email protected]
International Journal of Computer Integrated Manufacturing
For Peer Review O
nly
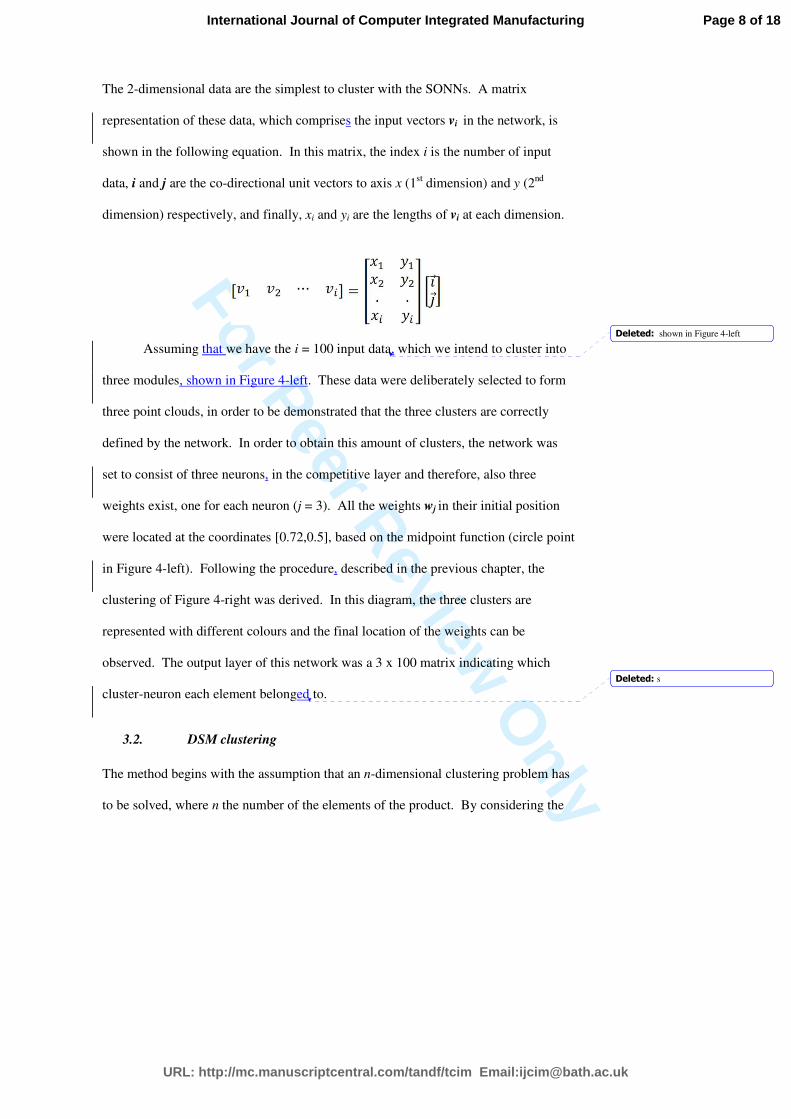
The 2-dimensional data are the simplest to cluster with the SONNs. A matrix
representation of these data, which comprises the input vectors vi in the network, is
shown in the following equation. In this matrix, the index i is the number of input
data, i and j are the co-directional unit vectors to axis x (1st dimension) and y (2
nd
dimension) respectively, and finally, xi and yi are the lengths of vi at each dimension.
Assuming that we have the i = 100 input data, which we intend to cluster into
three modules, shown in Figure 4-left. These data were deliberately selected to form
three point clouds, in order to be demonstrated that the three clusters are correctly
defined by the network. In order to obtain this amount of clusters, the network was
set to consist of three neurons, in the competitive layer and therefore, also three
weights exist, one for each neuron (j = 3). All the weights wj in their initial position
were located at the coordinates [0.72,0.5], based on the midpoint function (circle point
in Figure 4-left). Following the procedure, described in the previous chapter, the
clustering of Figure 4-right was derived. In this diagram, the three clusters are
represented with different colours and the final location of the weights can be
observed. The output layer of this network was a 3 x 100 matrix indicating which
cluster-neuron each element belonged to.
3.2. DSM clustering
The method begins with the assumption that an n-dimensional clustering problem has
to be solved, where n the number of the elements of the product. By considering the
Deleted: shown in Figure 4-left
Deleted: s
Page 8 of 18
URL: http://mc.manuscriptcentral.com/tandf/tcim Email:[email protected]
International Journal of Computer Integrated Manufacturing

For Peer Review O
nly
DSM of a product as the matrix, which contains the lengths of vi at each dimension,
the n vectors of n dimensions will derive as input for the network:
It should be remarked, that the values of the diagonal cells are filled with the
value “1”, in order for the algorithm to include the ith
element in the cluster that
contains the elements interacting with it. This vector representation will enable the
introduction of each element’s interactions with the Neural Network.
Following this vector representation of the DSM, the SONN is executed as
described in the previous chapter. A novelty introduced through the utilization of this
algorithm for DSM clustering, is that with the help of bias the design engineer is able
to preselect the number of clusters that will be deriving. Furthermore, considering
that each time that the network is run, it produces different clustering alternatives, a
multi-criteria decision making approach is employed in order to identify the optimum
clustering solution from the set of alternatives generated (Chryssolouris 2006). In
Table 2, A is the clustering alternative, index k is the number of the alternatives,
generated by the network, Sin is the sum of the cells having a zero value inside the
clusters, Sout is the sum of the interactions outside the clusters, W1 and W2 are weight
factors and finally, CE stands for the clustering efficiency index and derives from the
equation that follows. The bigger the CE is the more efficient is the clustering.
CE = 1/(W1*Sin + W2*Sout)
Page 9 of 18
URL: http://mc.manuscriptcentral.com/tandf/tcim Email:[email protected]
International Journal of Computer Integrated Manufacturing
For Peer Review O
nly
The values of the weights W1 and W2 are chosen depending on the clustering
outcome expected by the designer. A greater W1 would result in denser clusters and a
greater W2 in fewer external interactions. Since these coefficients are interdependent,
they should meet the following equation:
W1 + W2 = 1
4. Case study
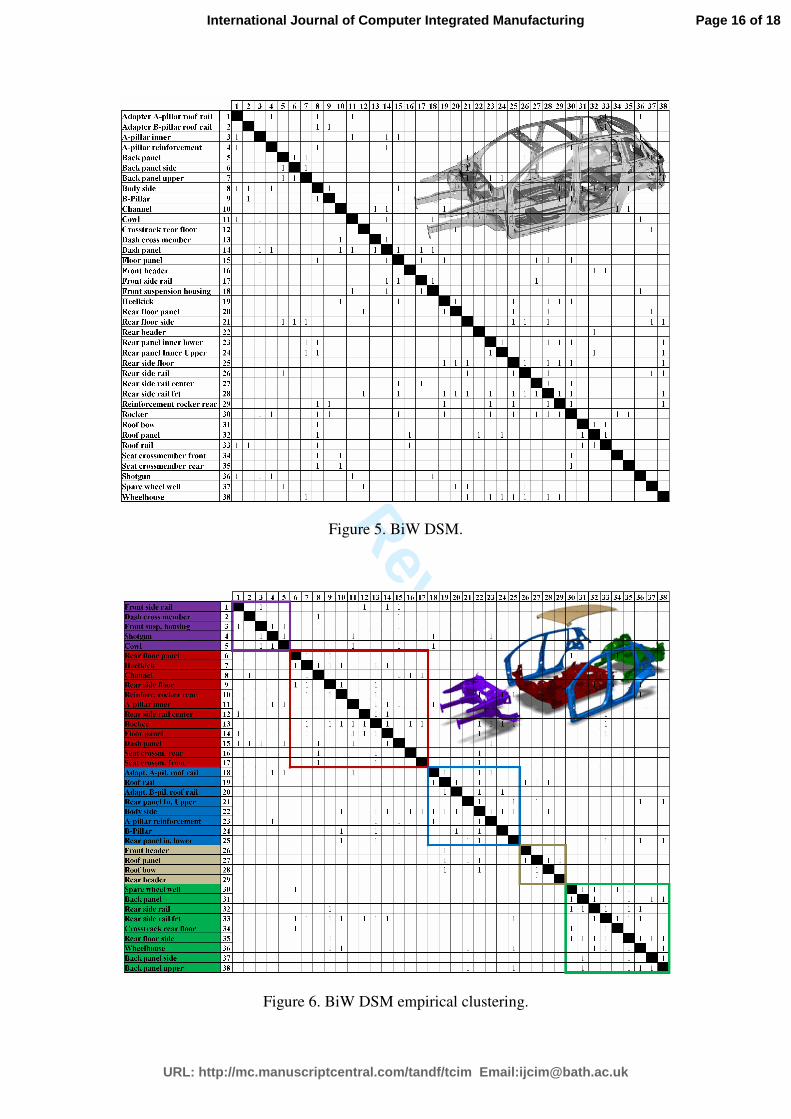
A car’s Body in White (BiW) was selected as a case study in order for the proposed
algorithm to be applied and evaluated. The BiW DSM presented in the work of
Pandremenos et al. (2009) was utilized. It consists of 38 parts and 108 interactions
among them (Figure 5). In order to assess the clustering efficiency the MP was
calculated to have the value of 0.89. Since this value reveals a quite modular
architecture, the clustering is not expected to be very efficient. However, the
automotive industry seems to be benefiting from it and thus, it is applied to BiWs.
From the clustered BiWs, platform modules may occur and through them different car
variants can be generated. Most of the times, the clustering is performed empirically,
since it is based on the knowledge and experience of design engineers. The BiW
utilized in this study is empirically clustered into five modules, as shown in Figure 6.
The same DSM has been clustered by the method introduced in this paper.
The algorithm was set to produce five modules (the same with the empirical
clustering and was run for 50 times. Therefore, k = 50 different DSM clustering
alternatives were obtained and evaluated with the CE index. For the calculation of
CE, a 0.5 value was selected for W1 and W2. The results are shown in Figure 8. It can
be easily observed that all the CE values having derived from the different runs of the
Neural Network, are much higher than the CE of the empirical clustering. The
Deleted: more
Deleted: s
Deleted: it in
Page 10 of 18
URL: http://mc.manuscriptcentral.com/tandf/tcim Email:[email protected]
International Journal of Computer Integrated Manufacturing

For Peer Review O
nly
maximum CE is derived from the 28th
run and it is equal to 0.009901. The clustered
DSM having resulted from this run, is shown in Figure 7. It should be also pointed
out that the clustering of the case study, derived within 30 seconds only, with the use
of the MATLAB R2009b software installed in a PC, having an “Intel Core 2 Duo
SP9400/2.4GHz/1066MHz/6MB” processor and 4 GB RAM.
5. Conclusions
The clustering efficiency study has revealed that the most efficient clustering is
achieved when dealing with products of a combined design architecture. Moreover,
the Neural Network algorithm developed proved to have important novelties:
• Easy and fast to be formulated for a successful DSM clustering.
• The number of modules produced can be either predefined by the operator,
with the help of the Bias, or determined by the network itself (without the use
of the Bias).
• The efficiency of the clustering was measured with an index which took into
consideration the number of interactions both within and outside the clusters.
The method was successfully applied to a real case study, a car BiW, and five
modules were obtained. Similarities, in front and rear end modules are observed
between the clustering of the proposed method and the empirical clustering. From
Figure 7, it can be easily observed that the algorithmic clustering is still not efficient
enough (as it was expected from the calculation of the MP). However, the evaluation
of the two approaches with the help of the CE index has shown a more efficient
clustering for the case of the algorithm (Figure 8). The feasibility of this clustering
architecture though, is an issue that needs to be further investigated. Several aspects,
such as the integrity of the modules during assembly, the way product variation can
be derived from such modules’ split up, the rigidity of the final product and others,
may affect the feasibility of a clustering architecture. The approach, at its current
Page 11 of 18
URL: http://mc.manuscriptcentral.com/tandf/tcim Email:[email protected]
International Journal of Computer Integrated Manufacturing

For Peer Review O
nly
condition, can be used by design engineers as a tool for the derivation of product
clustering suggestions, during the new product family/platform design. Moreover, the
approach is also valid for everything that can be represented through a DSM (e.g.
software, project teams etc.).
In future work, more case studies will be investigated and the criteria for the
clustering assessment will be enriched so as to take into account more aspects. The
integration of the CE index into the network’s architecture will also be considered in
such a way so as to produce directly the optimum clustering solution (reinforcement
learning). Additionally, a quantitative comparison of the MP with the CE will be tried
and the capability of the network to produce bus clusters will be examined. Finally,
this approach will be compared with other existing algorithms.
6. Acknowledgement
The work was partially supported by the EU funded project: FP6-2004-NMP-NI-4-026621, Multi-
FUnctional maTerials and related prodUction technologies integRated into the Automotive industry of
the future –FUTURA”.
7. References
Browning, T.R., 2001. Applying the Design Structure Matrix to System
Decomposition and Integration Problems: A review and new directions. IEEE
Transactions on engineering management, 48 (3), 292–306.
Chryssolouris, G., 2006. Manufacturing systems: Theory and Practice. 2nd ed. New
York: Springer.
Ericsson, A. and Erixon, G., 1999, Controlling Design Variants, Dearborn, Michigan:
Society of Manufacturing Engineers.
Fernandez, C.I.G., 1998. Integration analysis of product architecture to support
effective team co-location. Dissertation. Massachusetts Institute of
Technology.
Gu, P., Hashemian, M. and Nee, A.Y.C., 2004, Adaptable design, Annals of CIRP, 53
(2), 539 – 557.
Idicula, J., 1995. Planning for concurrent engineering. Dissertation. Nanyang
Technological University.
Kohonen, T., 2001. Self-Organizing Maps. 3rd ed. Heidelberg: Springer.
Mueller, C., 2004. Sparse Matrix Reordering Algorithms for Cluster Identification.
For I532, Machine Learning in Bioinformatics.
Page 12 of 18
URL: http://mc.manuscriptcentral.com/tandf/tcim Email:[email protected]
International Journal of Computer Integrated Manufacturing

For Peer Review O
nly
Oliveira, S., Ribeiro, J.F.F. and Seok, S.C., 2009. A spectral clustering algorithm for
manufacturing cell formation. Computers and Industrial Engineering, 57 (3),
1008-1014.
Pandremenos, J., Chatzikomis, C. and Chryssolouris, G., 2009. On the Quantification
of Interface Design Architectures. Asian International Journal of Science and
Technology in Production and Manufacturing, 2 (3), 41-48.
Pugh, S., 1991, Total design: integrated methods for successful product engineering,
New York: Prentice Hall.
Rogers, J.L., Korte, J.J. and Bilardo Jr., V.J., 2006. Development of a Genetic
Algorithm to Automate Clustering of a Dependency Structure Matrix. NASA
Technical Reports Server (NTRS).
Sangal, N. Et al., 2005. Using Dependency Models to Manage Complex Software
Architecture. OOPSLA’ 05, 167-176.
Simpson, T., Siddique, Z. and Jiao, J., 2006, Platform-Based Product family
Development, Product Platform and Product Family Design: Methods and
Applications, New York: Springer, 1-15.
Suh, N.P., 1990, The principles of design, New York: Oxford University Press.
Thebeau, R.E., 2001. Knowledge management of system interfaces and interactions
for product development processes. Dissertation. Massachusetts Institute of
Technology.
Ulrich, K.T., 1995. The role of product architecture in the manufacturing firm.
Research Policy, 24, 419-440.
Ulrich, K.T. and Eppinger, S.D., 2003. Product Design and Development. 3rd ed.
New York: McGraw-Hill.
Vesanto, J. and Alhoniemi, E., 2000. Clustering of Self-Organizing Map. IEEE
transactions on Neural Networks, 11 (3), 586-600.
Yassine, A. and Braha, D., 2003. Complex Concurrent Engineering and the Design
Structure Matrix Method. Concurrent Engineering: Research and
Applications, 11 (3), 165-176.
Yassine, A., 2004. An Introduction to Modeling and Analyzing Complex Product
Development Processes Using the Design Structure Matrix (DSM) Method.
Italian Management Review, 9, 72-78.
Yu, T.-L., Yassine, A.A. and Goldberg, D.E., 2003. A genetic algorithm for
developing modular product architectures. Proceedings of DETC’ 03.
Yu, T.-L., Yassine, A.A. and Goldberg, D.E., 2007. An information theoretic method
for developing modular architectures using genetic algorithms. Res Eng
Design, 18, 91-109.
Page 13 of 18
URL: http://mc.manuscriptcentral.com/tandf/tcim Email:[email protected]
International Journal of Computer Integrated Manufacturing

For Peer Review O
nly
Figure 1. Clustering on Modular, Integral and Combined design architectures.
Figure 2. Neural Network architecture.
Page 14 of 18
URL: http://mc.manuscriptcentral.com/tandf/tcim Email:[email protected]
International Journal of Computer Integrated Manufacturing
For Peer Review O
nly
Figure 3. Neuron architecture in competitive layer.
Figure 4. Input (left) and clustered 2-dimensional data (right).
Page 15 of 18
URL: http://mc.manuscriptcentral.com/tandf/tcim Email:[email protected]
International Journal of Computer Integrated Manufacturing
For Peer Review O
nly
Figure 5. BiW DSM.
Figure 6. BiW DSM empirical clustering.
Page 16 of 18
URL: http://mc.manuscriptcentral.com/tandf/tcim Email:[email protected]
International Journal of Computer Integrated Manufacturing

For Peer Review O
nly
Figure 7. BiW DSM algorithm based clustering.
Figure 8. CE for empirical and algorithm based clustering of BiW DSM.
Page 17 of 18
URL: http://mc.manuscriptcentral.com/tandf/tcim Email:[email protected]
International Journal of Computer Integrated Manufacturing
For Peer Review O
nly
Table 1. Clustering types.
Table 2. Multi-criteria decision making table.
Page 18 of 18
URL: http://mc.manuscriptcentral.com/tandf/tcim Email:[email protected]
International Journal of Computer Integrated Manufacturing