A Neural Map of Interaural Intensity Differences in the ... · 2666 Manley et al. l Interaural...
12
The Journal of Neuroscience, August 1988; 8(8): 2885-2878 A Neural Map of Interaural Intensity Differences in the Brain Stem of the Barn Owl Geoffrey A. Manley,’ Christine Kiippl,’ and Masakazu Konishi* ‘Institut ftir Zoologie, Technische Universitgt Mtinchen, 8046 Garching, F.R.G., and ‘Division of Biology, California Institute of Technology, Pasadena, California 91125 The nucleus ventralis lemnisci lateralis pars posterior (VLVp) is the first binaural station in the intensity-processing path- way of the barn owl. Contralateral stimulation excites and ipsilateral stimulation inhibits VLVp cells. The strength of the inhibition declines systematically from dorsal to ventral within the nucleus. Cells selective for different intensity dis- parities occur in an orderly sequence from dorsal to ventral within each isofrequency lamina. Cells at intermediate depths in the nucleus are selective for a particular narrow range of interaural intensity differences independently of the abso- lute sound-pressure level. A simple model of the interaction between inhibition and excitation can explain most of the response properties of VLVp neurons. The map of selectivity for intensity disparity is mainly based on the gradient of inhibition. The facial ruff, preaural flap, and external meatus of the barn owl are asymmetrical, such that the right and left ears are more sensitive to high-frequency sound coming from above and below eye level, respectively (Payne, 197 1; Knudsen and Konishi, 1978). Each coordinate locus in the owl’s auditory space is defined by a unique pair of interaural time and intensity differences (ITD and IID, respectively). Neurophysiological investigations at all levels of the owl’s auditory pathway up to the midbrain nucleus mesencephalicus laterale pars dorsalis (MLD, the avian hom- olog of the mammalian inferior colliculus) have shown that this peripheral specialization is accompanied by a differentiation of the auditory pathway into 2 sets of nuclei (Knudsen and Konishi, 1978; Moiseff and Konishi, 1983; Sullivan and Konishi, 1984; Takahashi et al., 1984; Konishi, 1986a). Following the branch- ing of the auditory nerve fibers into the cochlear nuclei, the information with regard to ITD and IID is processed separately. ITD and IID information is reunited in the midbrain, where cells highly sensitive to specific combinations of ITD and IID occur. These cells respond only to sound coming from particular directions. These “space-specific neurons” form a map of au- ditory space in the external nucleus of the MLD (ICx), which Received Feb. 4, 1987; revised Dec. 15, 1987; accepted Dec. 15, 1987. We thank Gene Akutagawa for excellent histology, Terry Takahashi and Her- mann Waaner for introducina G.A.M. and C.K. to comuuter oroerams. and Andv . . Moiseff, who wrote some of the programs. We also thank 0. GlLich, U. Hausler, G. Klump, E. Knudsen, H.-J. Leppelsack, H. Oeckinghaus, T. Takahashi, and H. Wagner for commenting on an earlier version of the manuscript. This work was supported by an NIH grant to M.K., by a travel fellowship to G.A.M. from the Volkswagenstiftung, and by the Deutsche Forschungsgemeinschaft within the pro- aram of the SFB 204. “Gehiir.” Correspondence should be addressed to Professor Geoffrey A. Manley, Institut Bir Zoologie, Lichtenbergstr. 4, 8046 Garching, W. Germany. Copyright 0 1988 Society for Neuroscience 0270-6474/88/082665-12$02.00/O receives all of its auditory input from the central nucleus of the MLD (ICC) (ICC and ICx from the terminology of Knudsen, 1983). The initial neurophysiological studies of the 2 parts of the auditory system established the divergence of the information- processing pathways and described the activity of cells in many of the nuclei (Moiseff and Konishi, 1983). In general, much more is known about the time difference-processing than about the intensity difference-processing pathway. Whereas a map of ITD has already been demonstrated for the brain stem (Konishi, 1986b; Sullivan and Konishi, 1986) it is not known where and how a map of IID is generated in the auditory pathway. The nucleus ventralis lemnisci lateralis pars posterior (VLVp) of the lower brain stem is the first site of binaural convergence in the intensity pathway. This nucleus appears to receive input from the contralateral nucleus angularis, the first station in the intensity-processing pathway (T. Takahashi and M. Konishi, unpublished observations). Some properties of the VLVp have been reported in an earlier paper by Moiseff and Konishi (1983). These authors have noted that cells of the VLVp are excited by contralateral stimulation and inhibited by ipsilateral stimula- tion (EI response pattern) and that the relative strength of these inputs varied from cell to cell. The units were not sensitive to ITD. The present paper reports a map of IID in the VLVp and describes the response properties that are correlated with the selectivity for and the mapping of IID. Materials and Methods The techniques employed in this study were similar to those reported in earlier papers (Moiseff and Konishi, 198 1 b, 1983) and will be sum- marized. Adult barn owls (Tyto alba; 4 males and 4 females) were anesthetized with ketamine hydrochloride (4 mg/kg/hr; Vetalar, Parke- Davis) and diazepam (injectable Valium, 1.5 mg/kg; Roche). The owls were restrained by a leather jacket and placed under a heating blanket. An aluminum plate cemented onto the owl’s skull held the head at a desired angle relative to the stereotaxic system used. This plate allowed us to reproduce the same head angle from bird to bird and from ex- periment to experiment. Glass-insulated platinum-iridium electrodes (Wolbarsht et al., 1960) were positioned stereotaxically. A stepping-motor microdrive advanced the electrode vertically through fore- and midbrain tissue into the brain stem to depths of up to 18 mm. In the plane of the electrode penetrations, the VLVp has a maximal depth of 1.6 mm and a mediolateral extent of about 1.1 mm (Fig. 1). In the rostrocaudal axis, the nucleus is about 1.3 mm long. Selected electrode tracks were marked by electrolytic lesions placed in a pattern suitable for easy identification in the histo- logical sections. They were later identified by the accumulation of dark glial cells in cresyl violet-stained sections (30 pm) cut as near the plane of the electrode tracks as possible (Fig. 1). We usually recorded from both the right and left sides of the brain, with an interval of 2 d between experiments. At the end of each experiment, the craniotomy was care-
Transcript of A Neural Map of Interaural Intensity Differences in the ... · 2666 Manley et al. l Interaural...
The Journal of Neuroscience, August 1988; 8(8): 2885-2878
A Neural Map of Interaural Intensity Differences in the Brain Stem of the Barn Owl
Geoffrey A. Manley,’ Christine Kiippl,’ and Masakazu Konishi*
‘Institut ftir Zoologie, Technische Universitgt Mtinchen, 8046 Garching, F.R.G., and ‘Division of Biology, California Institute of Technology, Pasadena, California 91125
The nucleus ventralis lemnisci lateralis pars posterior (VLVp) is the first binaural station in the intensity-processing path- way of the barn owl. Contralateral stimulation excites and ipsilateral stimulation inhibits VLVp cells. The strength of the inhibition declines systematically from dorsal to ventral within the nucleus. Cells selective for different intensity dis- parities occur in an orderly sequence from dorsal to ventral within each isofrequency lamina. Cells at intermediate depths in the nucleus are selective for a particular narrow range of interaural intensity differences independently of the abso- lute sound-pressure level. A simple model of the interaction between inhibition and excitation can explain most of the response properties of VLVp neurons. The map of selectivity for intensity disparity is mainly based on the gradient of inhibition.
The facial ruff, preaural flap, and external meatus of the barn owl are asymmetrical, such that the right and left ears are more sensitive to high-frequency sound coming from above and below eye level, respectively (Payne, 197 1; Knudsen and Konishi, 1978). Each coordinate locus in the owl’s auditory space is defined by a unique pair of interaural time and intensity differences (ITD and IID, respectively). Neurophysiological investigations at all levels of the owl’s auditory pathway up to the midbrain nucleus mesencephalicus laterale pars dorsalis (MLD, the avian hom- olog of the mammalian inferior colliculus) have shown that this peripheral specialization is accompanied by a differentiation of the auditory pathway into 2 sets of nuclei (Knudsen and Konishi, 1978; Moiseff and Konishi, 1983; Sullivan and Konishi, 1984; Takahashi et al., 1984; Konishi, 1986a). Following the branch- ing of the auditory nerve fibers into the cochlear nuclei, the information with regard to ITD and IID is processed separately. ITD and IID information is reunited in the midbrain, where cells highly sensitive to specific combinations of ITD and IID occur. These cells respond only to sound coming from particular directions. These “space-specific neurons” form a map of au- ditory space in the external nucleus of the MLD (ICx), which
Received Feb. 4, 1987; revised Dec. 15, 1987; accepted Dec. 15, 1987. We thank Gene Akutagawa for excellent histology, Terry Takahashi and Her-
mann Waaner for introducina G.A.M. and C.K. to comuuter oroerams. and Andv . . Moiseff, who wrote some of the programs. We also thank 0. GlLich, U. Hausler, G. Klump, E. Knudsen, H.-J. Leppelsack, H. Oeckinghaus, T. Takahashi, and H. Wagner for commenting on an earlier version of the manuscript. This work was supported by an NIH grant to M.K., by a travel fellowship to G.A.M. from the Volkswagenstiftung, and by the Deutsche Forschungsgemeinschaft within the pro- aram of the SFB 204. “Gehiir.”
Correspondence should be addressed to Professor Geoffrey A. Manley, Institut Bir Zoologie, Lichtenbergstr. 4, 8046 Garching, W. Germany. Copyright 0 1988 Society for Neuroscience 0270-6474/88/082665-12$02.00/O
receives all of its auditory input from the central nucleus of the MLD (ICC) (ICC and ICx from the terminology of Knudsen, 1983).
The initial neurophysiological studies of the 2 parts of the auditory system established the divergence of the information- processing pathways and described the activity of cells in many of the nuclei (Moiseff and Konishi, 1983). In general, much more is known about the time difference-processing than about the intensity difference-processing pathway. Whereas a map of ITD has already been demonstrated for the brain stem (Konishi, 1986b; Sullivan and Konishi, 1986) it is not known where and how a map of IID is generated in the auditory pathway.
The nucleus ventralis lemnisci lateralis pars posterior (VLVp) of the lower brain stem is the first site of binaural convergence in the intensity pathway. This nucleus appears to receive input from the contralateral nucleus angularis, the first station in the intensity-processing pathway (T. Takahashi and M. Konishi, unpublished observations). Some properties of the VLVp have been reported in an earlier paper by Moiseff and Konishi (1983). These authors have noted that cells of the VLVp are excited by contralateral stimulation and inhibited by ipsilateral stimula- tion (EI response pattern) and that the relative strength of these inputs varied from cell to cell. The units were not sensitive to ITD. The present paper reports a map of IID in the VLVp and describes the response properties that are correlated with the selectivity for and the mapping of IID.
Materials and Methods The techniques employed in this study were similar to those reported in earlier papers (Moiseff and Konishi, 198 1 b, 1983) and will be sum- marized. Adult barn owls (Tyto alba; 4 males and 4 females) were anesthetized with ketamine hydrochloride (4 mg/kg/hr; Vetalar, Parke- Davis) and diazepam (injectable Valium, 1.5 mg/kg; Roche). The owls were restrained by a leather jacket and placed under a heating blanket. An aluminum plate cemented onto the owl’s skull held the head at a desired angle relative to the stereotaxic system used. This plate allowed us to reproduce the same head angle from bird to bird and from ex- periment to experiment.
Glass-insulated platinum-iridium electrodes (Wolbarsht et al., 1960) were positioned stereotaxically. A stepping-motor microdrive advanced the electrode vertically through fore- and midbrain tissue into the brain stem to depths of up to 18 mm. In the plane of the electrode penetrations, the VLVp has a maximal depth of 1.6 mm and a mediolateral extent of about 1.1 mm (Fig. 1). In the rostrocaudal axis, the nucleus is about 1.3 mm long. Selected electrode tracks were marked by electrolytic lesions placed in a pattern suitable for easy identification in the histo- logical sections. They were later identified by the accumulation of dark glial cells in cresyl violet-stained sections (30 pm) cut as near the plane of the electrode tracks as possible (Fig. 1). We usually recorded from both the right and left sides of the brain, with an interval of 2 d between experiments. At the end of each experiment, the craniotomy was care-

2666 Manley et al. l Interaural Intensity Diierence Map in Owl Brain Stem
Imm
VLVp-
Figure I. Two transverse sections through the midbrain and brain stem of the barn owl, showing the location of the nucleus VLVp, lesions, and electrode tracks. A, An electrode track penetrated the medial border region of the VLVp and encountered 4 cells with BF 7-8 kHz. A lesion was placed just below an ITD-sensitive cell with BF 7.5 kHz, which was localized on the lateral border of VLVa. Because of a slightly oblique plane of section, 3 unrelated electrode tracks are visible dorsally. B, An electrode track penetrated the central region of the VLVp and encountered 6 cells with BF between 6.9 and 9.9 kHz. Lesions were placed at levels above the first and below the last cells.

The Journal of Neuroscience, August 1988, 8(8) 2667
351
Discharge rate
(spikes/ presentation)
30-
25-
80 70 $0 i0 40 30 20 1‘0
Average binaural intensity (attenuation, dB)
b
fully closed with dental cement, a local anesthetic, and an antiseptic ointment applied to the skin, and the scalp wound was closed by suture. The birds were housed individually during the recovery period.
Auditory stimuli consisted of tone or pseudorandom-noise bursts (2 set-I, 100 msec duration, 5 msec rise and decay times) delivered through magnetic earphones. The earpieces containing the earphone and a probe microphone (Knowles BT1759) were fitted snugly into the external au- ditory meatus. We equalized sound-pressure levels in the 2 ears before each experiment. Digital attenuators driven by a PDP- 1 l/40 computer adjusted the levels of tone bursts of different carrier frequencies during frequency tuning according to a calibration table for the earphones, and controlled the IID and the ITD during the experiment. All experiments were carried out with the animal in a shielded, sound-attenuating cham- ber.
Extracellular action potentials were amplified and level-discriminated before conversion to computer-compatible signals. Cells were detected using a contralateral noise search stimulus, and their response properties usually determined by a standard protocol including both monaural and binaural stimulation. In all cases, the cell’s response was recorded as the mean number of spikes per stimulus presentation (average of 5), and selected data were stored on magnetic disks for subsequent analysis. Sensitivity to variations in ITD distinguished cells of the adjoining nucleus VLVa (a, anterior) from those of the VLVp (Moiseff and Kon- ishi, 1983) and served as a physiological means of identifying the VLVp before histological verification of lesioned sites. A digital phase shifter driven by the computer varied ITD for the test of ITD sensitivity.
Using monaural contralateral stimuli, frequency response curves were first obtained for VLVp cells. Using 10 repetitions at a constant sound pressure that yielded a vigorous but nonsaturated discharge rate at the best frequency, we established an automated random stepping procedure that presented frequencies over a range of at least +0.75 octaves. In- hibitory response curves were obtained in a similar fashion. In neurons with little or no spontaneous discharge, inhibitory response curves were obtained by inducing a nonadaptive rate of discharge by presenting a continuous noise to the contralateral ear. Sensitivity to variations in average binaural intensity (ABI) and IID was determined with binaural noise and tones within the ranae of 540 dB above the individual cell’s threshold.
Description of parameters Average binaural intensity-ABZ. (The sound-pressure level will be re- ferred to as “intensity” for the sake of brevity.) Algebraic sum of the ipsilateral and contralateral sound-pressure levels measured in decibels, divided by 2. The ABI rate function recorded response rates of cells to increasing, but equal, intensity at both ears.
Znteraural intensitv difference-ZZD. A standard test of the interaction of sound intensity to the left and right ears. The intensity to one ear
Figure 2. Responses to equal stimu- lation of both ears. Binaural rate func- tions to decreasing attenuation for 5 typical VLVp cells with equal tonal (BF) stimulation to both ears. a-d, Trend of activity from the low rates of dorsal to the high rates of ventral cells. In cells such as d, the ABI and monaural con- tralateral rate functions are very simi- lar. Cell e is an example of a nonmono- tonic function (see text).
was decreased automatically, while increasing the intensity to the other ear by the same amount (usually 2 dB steps), thus keeping the ABI constant. We studied IID responses at differing ABI. Most frequently, the cells were tested using ABI differing by 1 O-l 5 dB; in exceptional cases, ABI differing by up to 28 dB were used.
Half-maximum point. The IID level in decibels at the point at which the cell’s discharge rate reaches 50% of its maximum. This parameter is simply a pragmatic way of defining the position of an IID function on the IID axis.
Dynamic range. The decibel range over which a cell increases or decreases its discharge rate between 5 and 95% of the maximal rate. For monaural and IID curves, this range refers to the respective axes (decibel or IID in decibels). The IID dvnamic ranae is used for con- venience to describe the sensitivity of ace11 to variation in IID.
Strength of inhibition. The percentage reduction in discharge rate at a point on the ABI rate function as compared to the same intensity on the monaural contralateral rate function (see Fig. 7A). Except where otherwise stated (for example, for comparisons at several levels in one cell), the curves were compared at the intensity at which the monaural rate function had reached about two-thirds of its saturation rate; this intensity varied between 15 and 25 dB above the monaural response threshold.
Inhibitory threshold. Ipsilateral intensity at which a drop in sponta- neous activity of more than 5% occurred, or, in the case of an induced discharge rate from steady contralateral noise, an equivalent drop in this rate.
Znteraural time difference-ZTD. In the ABI test, the ongoing binaural time disparity was varied automatically in a noise stimulus from -300 (left ear leads) to +300 psec (right ear leads) in steps of 30 psec. Wagner et al. (1987) showed that this sampling interval yielded results indistin- guishable from those obtained at 10 psec intervals for all frequencies.
Rank order of cells. It would have been desirable for trend analyses to use the absolute depth of each cell as a coordinate. However, the surfaces of the brain and of the nucleus are convex and there are vari- ations in head size and electrode angle, so that samples of neurons obtained from different animals cannot be directly compared. To com- pare response properties between different animals, we thus ranked cells in the order in which the electrode encountered them. All figures that use this convention indicate that 1 is the first cell, 2 the second, etc.; position 6 gives the sixth and any seventh and eighth cells together. This convention was applied to penetrations in which 3 or more cells were encountered.
Results The following analyses used 95 single-cell and 35 multiple-cell (2 or 3 cell) recordings in 14 VLVp nuclei of 8 owls. Except for
2666 Manley et al. * Interaural Intensity Difference Map in Owl Brain Stem
Discharge rate
(spikes/ presentation)
50
40
30
20
10
0
IID (dB) IID (dB) IID (dB)
30
25
20
15
10
5
0
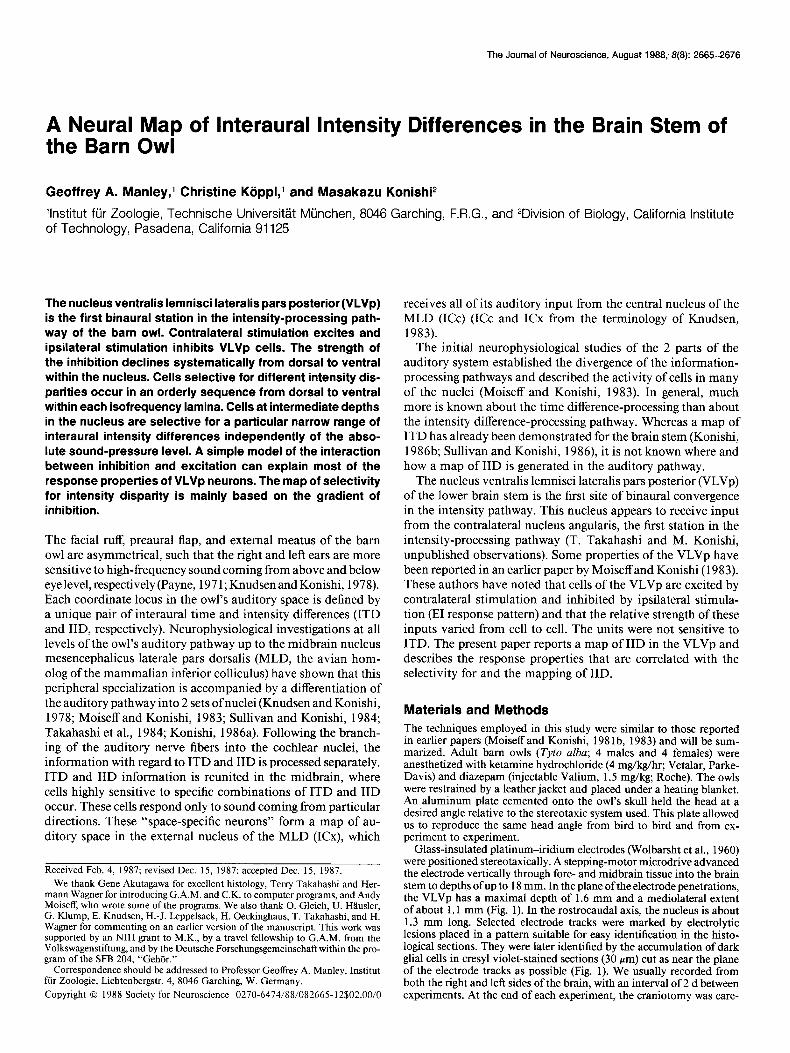
Figure 3. Responses to variations in IID. A-C, IID rate functions for representative cells with different amounts of inhibition, from dorsal (A) to ventral (Cl levels in the VLVv. Neaative IID values indicate hiaher ivsilateral. and vositive IID values hiaher contralateral intensitv. The lines represent j ABI separated by -10 dg Curves for the lowest ABI are doked, the next dished, and those for the highest ABI, solid. A, A dorsal cell with 95% inhibition and stimulated at BF (7.9 kHz). Towards higher ABI, the IID function shifts contralaterally. B, A cell with 60% inhibition, stimulated at BF (8.6 kHz). The half-maximum point hardly changes between the different curves. At the highest ABI, the rate function is less sensitive to IID. C, A ventral cell with little inhibition and stimulation at BF (7.9 kHz). The IID rate functions shift steadily to more ipsilateral positions at higher ABI.
trend analyses, the figures contain only the results of single-cell recordings. All cells showed an EI response, being excited by the contralateral ear and inhibited by the ipsilateral ear.
Response to variations in ABI and IID We analyzed the response of neurons to variations in ABI and IID. Different neurons responded differently to increasing ABI (Fig. 2). For most dorsal cells, equal intensity to both ears pro- duced no discharge at all (spontaneous activity was usually zero in such cells; Fig. 2, curve a). At the other extreme (Fig. 2, curve d) were ventral cells, whose discharge rate rose rapidly with increasing ABI. All response patterns between these 2 extremes were found (e.g., Fig. 2, curves b and c).
Variation in IID also caused different cells to respond differ- ently. A typical cell lying in the dorsalmost layers of the nucleus showed an IID pattern like that in Figure 3A. As noted above, these cells showed no or little discharge for equal intensity (zero IID), regardless of ABI. Increasing intensity to the contralateral ear, and decreasing intensity to the ipsilateral ear, however, produced a steep rise in discharge rate to a plateau. The half- maximum IID lay contralateral to zero IID (Figs. 3A, 4A; in all IID figures, negative values indicate higher intensity at the ip- silateral ear and positive values higher intensity at the contra- lateral ear). In addition, increasing ABI caused the half-maxi- mum IID to shift to even more contralateral positions (Fig. 3A).
Ventral cells showed the opposite pattern. The half-maximum point for such cells lay ipsilateral to zero IID (i.e., at negative values in Figs. 3C and 4A) and shifted to a more ipsilateral position for an increase in ABI (Fig. 3C). In both dorsal and ventral cells, the IID response to best frequency (BE) tones resembled that to noise. For example, the half-maximum IID were usually the same, in spite of large differences in some cells in the maximum discharge rates to tones and to noise.
Cells occurred along the electrode track in an orderly sequence according to their half-maximum IID values (Fig. 4A). Cells encountered earlier (Fig. 4A) in dorsoventral penetrations had half-maximum IID biased for greater contralateral intensities, and those encountered later had half-maximum IID biased for greater ipsilateral intensities. In Figure 4A, cells from different isofrequency laminae are lumped together and are rank-ordered
according to the sequence of recording instead of the actual depth of recording. Despite these constraints, the correlation between the anatomical position and the half-maximum value is clear.
Intensity independence of IID tuning About 30% of cells had their half-maximum points within a few decibels of zero IID. These cells occupied the middle layers of the nucleus. Each cell had a particular value for the half-max- imum IID and different cells showed different values. Some of these cells showed no shift at all of their half-maximum point with increasing ABI for stimulation with tones or with noise (Fig. 3B; in this figure, compare the 2 curves at the lowest ABI levels). However, all cells showed some shift both near their threshold and at very high ABI levels, where sensitivity to IID decreases and the rate function tends to tilt around the half- maximum point (Fig. 3B). The mean half-maximum point for 22 cells that showed shifts of the half-maximum points of 2 dB or less in either direction for a 10 dB rise in ABI was 1.4 * 3.8 dB contralateral (Fig. 4B). Thus, there exists a significant pop- ulation of cells in the VLVp whose half-maximum points lie near zero IID and are essentially independent of absolute in- tensity.
Changes in monaural excitatory and inhibitory response properties with depth In this and the next section, we present the characteristics of monaural responses with respect to their relevance for explain- ing both the observed patterns of binaural responses to varia- tions in ABI and IID and the presence of a map of IID. Over 80% of cells showed a monotonic increase in spike count with increasing intensity of a monaural contralateral stimulus (Fig. 5A, curves al and a2). The range of maxima for individual cells was 55-420 and 85-520 spikes . set’ for noise and tones, re- spectively. Maximal discharge rate to both noise and BF tones increased systematically with recording depth (Fig. 5B). The mean excitatory dynamic range was 29.1 dB (noise) and 3 1.3 dB (tones). For both noise and tones, the dynamic range varied between 12 and 50 dB and showed a very weak tendency to increase with depth. About 15% of cells, particularly those near
The Journal of Neuroscience, August 1988, 8(8) 2669
Half- maximum
20
10
0
-10
-20
x Tones
o Noise
Number 3 of cells
ill I 0 1 2 3 4 5 6 -6 -4 -2 0 2 4 6 8
Position of cell in Half-maximum penetration point (dB IID)
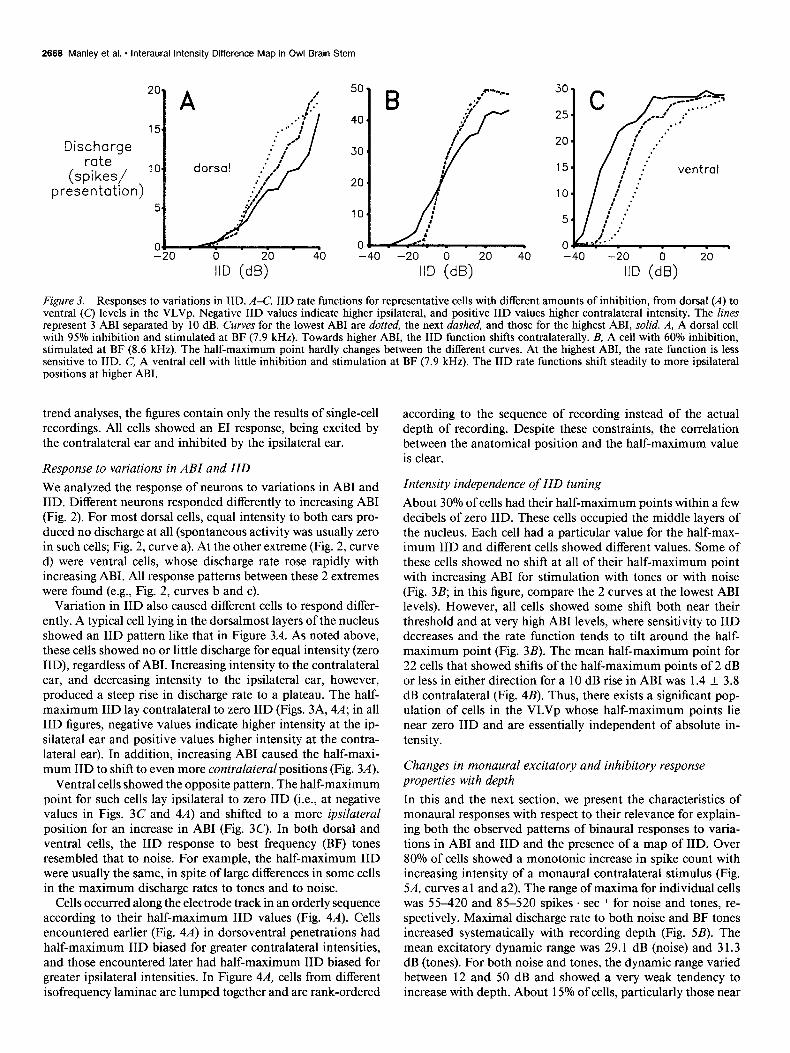
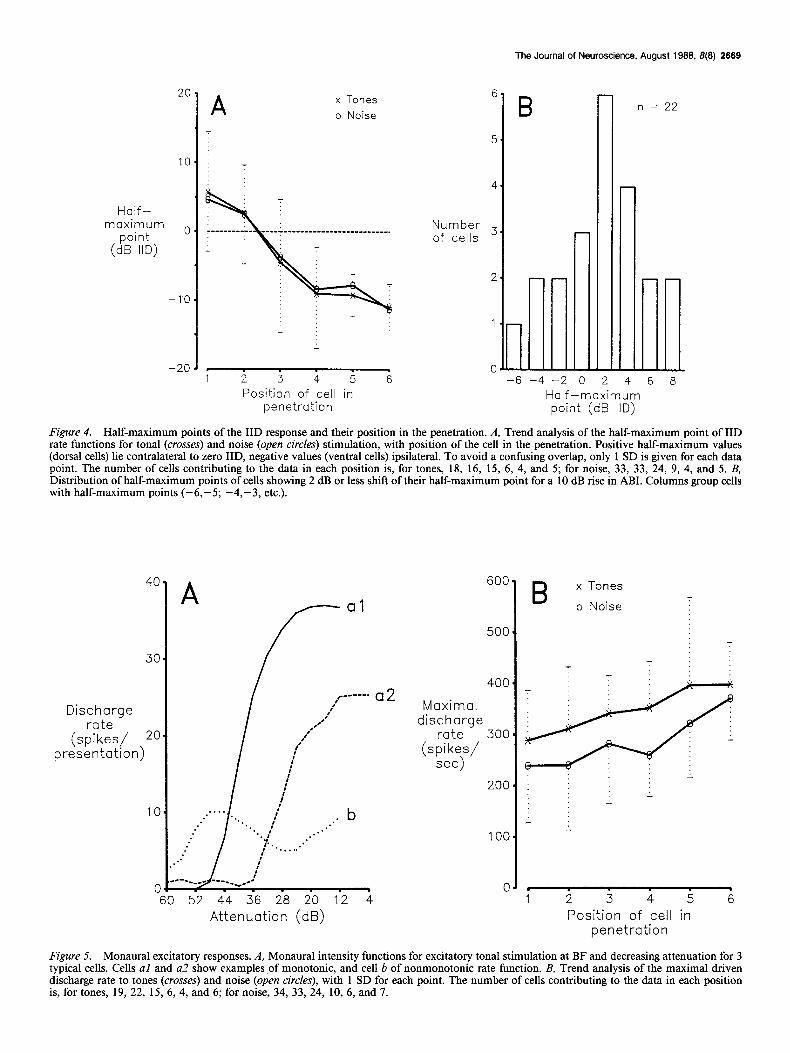
Figure 4. Half-maximum points of the IID response and their position in the penetration. A, Trend analysis of the half-maximum point of IID rate functions for tonal (crosses) and noise (open circles) stimulation, with position of the cell in the penetration. Positive half-maximum values (dorsal cells) lie contralateral to zero IID, negative values (ventral cells) ipsilateral. To avoid a confusing overlap, only 1 SD is given for each data point. The number of cells contributing to the data in each position is, for tones, 18, 16, 15, 6, 4, and 5; for noise, 33, 33, 24, 9, 4, and 5. B, Distribution of half-maximum points of cells showing 2 dB or less shift of their half-maximum point for a 10 dB rise in ABI. Columns group cells with half-maximum points (-6,-5; -4,-3, etc.).
40
Discharge rate
(spikes/ *O presentation)
10
0
Attenuation (dB)
600
500
4oc
Maximal discharge
rate 3oc
2oc
IOC
C
x Tones
o Noise T
L I
1 2 3 4 5 6 Position of cell in
penetration
Figure 5. Monaural excitatory responses. A, Monaural intensity functions for excitatory tonal stimulation at BF and decreasing attenuation for 3 typical cells. Cells al and a2 show examples,of monotonic, and cell b of nonmonotonic rate function. B, Trend analysis of the maximal driven discharge rate to tones (crosses) and noise (open circles), with 1 SD for each point. The number of cells contributing to the data in each position is, for tones, 19, 22, 15, 6, 4, and 6; for noise, 34, 33, 24, 10, 6, and 7.

2670 Manley et al. * Interaural Intensity Difference Map in Owl Brain Stem
Threshold (attenuation, 40
dB)
x Excitation
o Inhibition
i i il 4 i s Position of cell in
penetration
10 Threshold difference
(dB) 0
n = 36 r = -0.695 p<O.OOl
Strength of inhibition @I
Figure 6. Excitatory and inhibitory thresholds. A, Trend of excitatory (crosses) and inhibitory (open circles) tonal thresholds and their difference (dashed line) with rank order of cells. For each data point, 1 SD is indicated. In penetrations with more than 5 cells, dorsal cells had a negative threshold difference. All cells in a penetration were included irrespective of BF. The number of cells contributing to the data in each position is, for excitatory threshold, 20, 19, 16, 5, 4, and 5; for inhibitory threshold, 19, 17, 14, 5, 4, and 5. B, Scatter diagram of the threshold difference (excitatory minus inhibitory attenuation) at BF compared to the strength of inhibition. The dashed line is a simple linear regression.
the dorsal surface, had nonmonotonic curves, with the spike count decreasing again above a certain intensity (Fig. 5A, curve b). For dorsal cells, the dynamic range of inhibition was 6-7 dB less than the dynamic range of excitation (means of 19.3 and 26.5 dB, respectively, for the first cell in penetrations). This difference between dynamic ranges fell to zero for ventral cells (both near 31 dB).
There was also a tendency for the relationship between the excitatory and inhibitory thresholds to change with depth. On the dorsal edge of the nucleus, the inhibitory threshold for noise was the same as, or even lower than, the excitatory threshold. For cells lying more centrally in the nucleus, the excitatory threshold was, on average, 10 dB lower than the inhibitory threshold. The difference for BF tones was even greater (means of 16-l 7 dB; Fig. 6A). Although this threshold relationship is obscured in the trend analysis (Fig. 6A), in penetrations where the number of cells (5 or more) indicates a more complete sam- pling, it actually reverses with depth. The threshold difference is correlated with the strength of inhibition (Fig. 6B), the thresh- olds being the same for cells with a strength of inhibition near 70%.
A gradient in the strength of inhibition is the primary determinant of the binaural response properties We compared the strength of inhibition in cells recorded at different depths and found a systematic gradient. The strength of inhibition was (by definition; Fig. 7A) 100% for the dorsal cells showing no discharge for equal intensity to both ears (Fig. 2, curve a), whereas the strength of inhibition was 15% or less for ventral cells (Fig. 7B). Ventral cells showed spontaneous activity, which allowed us to measure inhibitory threshold levels
without adding contralateral stimulation. The inhibitory thresh- olds in such cells were higher than the excitatory (Fig. 6B). However, even when the inhibition had set in, the strength of inhibition changed less than 10% with increasing ABI. Thus, the ABI rate functions were often almost indistinguishable from the monaural functions (Fig. 5A, curve al; Fig. 2, curve d).
At intermediate depths, we found cells that showed inter- mediate strengths of inhibition (Fig. 7B) and intermediate slopes of ABI functions (Fig. 2, curves b and c). These cells were sys- tematically arranged in depth according to their strength of in- hibition (Fig. 78). In 10% of cells, a fall in rate at high levels was observed, instead of a discharge plateau (Fig. 2, curve e). These were not necessarily the cells with nonmonotonic mon- aural rate functions.
There is a good correlation between the strength of inhibition and the half-maximum point of the IID rate function (Fig. 7C). Strongly inhibited cells have their half-maximum point at pos- itive (contralateral) values, whereas for weakly inhibited cells, this point is at negative (ipsilateral) values. In addition, the strength of inhibition is correlated with the direction and mag- nitude of the shift of the half-maximum point of the IID rate function for a 10 dB rise in ABI (Fig. 70). Strongly inhibited cells shift their half-maximum point to more contralateral po- sitions, whereas weakly inhibited cells shift to more ipsilateral positions. Cells showing little or no shift have a mean strength of inhibition near 60%.
The relationship of the dynamic range measured in the IID response curves to the degree of inhibition is complex. A rank- order analysis of cells in all penetrations gave mean IID “dy- namic ranges,” dorsally to ventrally, of 24.8-38.5 dB IID (noise) and 28.2-42.4 dB IID (tones), respectively (Fig. 8). Cells that
The Journal of Neuroscience, August 1966, 8(6) 2671
100
80
Discharge rate 60
(% re. monaural) 40
100
80
Tgth 6o inhibition
(%) 4o
20
0
20% inhibition
BI
60% inhibition
*~nu,P.P,n (Z) lb
C a00 8 p
/ CQ 0;
3 n = 38
o 8: r = 0.816 p<O.OOl
, dau
0 ” 0
/o 0
0 ;hO
0 O P!ib30°0 L
-30 -20 -10 0 10 20 30 Half-maximum point
(dB IID)
100
80
Strength 6o of
inhibition 40
@> 20
0
-20
100
80
Strength 60 of
inhibition (%) 4o
20
0
7 .B T
x Tones o Noise
b
c. - -
. 1 2 3 4 5 6
Position of cell in penetration
D 0
0
n = 64
0 0 ,p&)o = 0 Oo j’ 0
r 0.738
d 0 p<O.OOl
0 / 0 j’ 0 0
Y;O, wo 0 o-jig O
Ed38 m
-io - -;(J - - - I-0 Shift of half-
maximum point (dB)
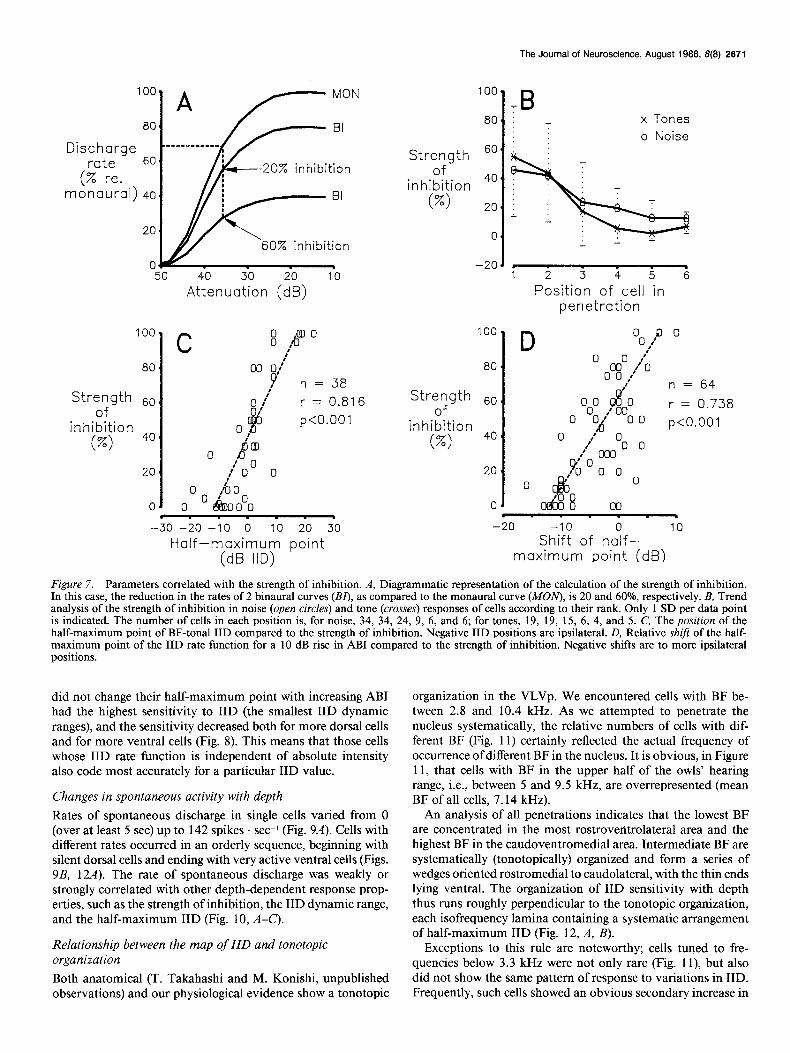
Figure 7. Parameters correlated with the strength of inhibition. A, Diagrammatic representation of the calculation of the strength of inhibition. In this case, the reduction in the rates of 2 binaural curves @I), as compared to the monaural curve (MOlv), is 20 and 60%, respectively. B, Trend analysis of the strength of inhibition in noise (open circles) and tone (crosses) responses of cells according to their rank. Only 1 SD per data point is indicated. The number of cells in each position is, for noise, 34, 34, 24, 9, 6, and 6; for tones, 19, 19, 15, 6, 4, and 5. C, The position of the half-maximum point of BF-tonal IID compared to the strength of inhibition. Negative IID positions are ipsilateral. D, Relative shift of the half- maximum point of the IID rate function for a 10 dB rise in ABI compared to the strength of inhibition. Negative shifts are to more ipsilateral positions.
did not change their half-maximum point with increasing ABI had the highest sensitivity to IID (the smallest IID dynamic ranges), and the sensitivity decreased both for more dorsal cells and for more ventral cells (Fig. 8). This means that those cells whose IID rate function is independent of absolute intensity also code most accurately for a particular IID value.
Changes in spontaneous activity with depth Rates of spontaneous discharge in single cells varied from 0 (over at least 5 set) up to 142 spikes . set-l (Fig. 9A). Cells with different rates occurred in an orderly sequence, beginning with silent dorsal cells and ending with very active ventral cells (Figs. 9B, 12A). The rate of spontaneous discharge was weakly or strongly correlated with other depth-dependent response prop- erties, such as the strength of inhibition, the IID dynamic range, and the half-maximum IID (Fig. 10, A-C).
Relationship between the map of IID and tonotopic organization Both anatomical (T. Takahashi and M. Konishi, unpublished observations) and our physiological evidence show a tonotopic
organization in the VLVp. We encountered cells with BF be- tween 2.8 and 10.4 kHz. As we attempted to penetrate the nucleus systematically, the relative numbers of cells with dif- ferent BF (Fig. 11) certainly reflected the actual frequency of occurrence of different BF in the nucleus. It is obvious, in Figure 11, that cells with BF in the upper half of the owls’ hearing range, i.e., between 5 and 9.5 kHz, are overrepresented (mean BF of all cells, 7.14 kHz).
An analysis of all penetrations indicates that the lowest BF are concentrated in the most rostroventrolateral area and the highest BF in the caudoventromedial area. Intermediate BF are systematically (tonotopically) organized and form a series of wedges oriented rostromedial to caudolateral, with the thin ends lying ventral. The organization of IID sensitivity with depth thus runs roughly perpendicular to the tonotopic organization, each isofrequency lamina containing a systematic arrangement of half-maximum IID (Fig. 12, A, B).
Exceptions to this rule are noteworthy; cells tuned to fre- quencies below 3.3 kHz were not only rare (Fig. 1 l), but also did not show the same pattern of response to variations in IID. Frequently, such cells showed an obvious secondary increase in

2672 Manley et al. - Interaural Intensity Difference Map in Owl Brain Stem
Figure 8. Relationship between IID sensitivity and the half-maximum point. The line is a locally weighted regression (Cleveland, 1979) and illustrates that cells with a half-maximum point near zero IID have the smallest dynamic ranges. A 2-tailed Mann-Whitney U test, dividing the data into 4 blocks accord- ing to their half-maximum values (c-10, -lOto-l;O-9, loandgreat- er), showed that all blocks are signili- cantlv different from one another. with the exception of the comparison of - 10 to - 1 and 10 and greater. The dotted line marks zero IID.
60
Dynamic
(z%) 3o
n = 38
-25
discharge at sound pressures where inhibition normally domi- nates. We attribute these effects to cross-talk via the middle ear canal (Moiseff and Konishi, 198 1 b), such that the actual stim- ulus at the eardrum was not the same as our nominal values. Similar behavior was observed in some monaural responses, with the ipsilateral stimulation producing an anomalous dis-
Number of cells
25
0 15 35 55 75 95 115135 Spontaneous discharge rate
(spikes/set)
1
- 20 -15 -10 -5 0 5 10 15 20 Half-maximum point (dB IID)
charge increase at intensities 30-40 dB above the contralateral levels for the same rates.
Do excitatory and inhibitory inputs match in frequency? It would be interesting to know whether the inhibitory influences are such that other frequencies contribute to the formation of
Discharge 80 - rate
60'
40.
20'
oJ . 1 2 3 4 5 6
Position of cell in penetration
Figure 9. Spontaneous discharge. A, Histogram of the number of cells with different spontaneous rates in the VLVp. The jirst column does not represent a true rate class, but cells with 0 spontaneous activity (as measured for at least 5 set). All other columns show the mean rate of a rate class 10 spikes set-’ wide. B, Trend analysis of the spontaneous discharge rate. One standard deviation for each data point is given. The number of cells contributing to the data in each position is, from left to right, 34, 34, 26, 11, 6, and 8.

The Journal of Neuroscience, August 1988, 8(8) 2673
Spont. a’ discharge
20
0
A 120 1 n = 52 100.
r = -0.58 p<O.OOl 80'
60. 0
o 0“. 0’4 Ei
oo 9
0
‘l$
8 0 “b O 00 d3 cosb \F, amooQml
4 0 20 40 60 80 100
Strength of inhibition (%)
B 120
100
80
60
0 20 40 60 80
Dynamic range (dB IID)
40 ’
20.
i ‘: 00% O
‘\I, O n = 52
= ':, r -0.68 0
i3 p<O.OOl 0
\ 0 ::, oo
A@ 0
3 09 's .~
01 1
-30-20-10 0 10 20 30
\ 0 C
Half-maximum point (dB IID)
Figure 10. Parameters correlated with spontaneous discharge rate. Dashed lines are simple linear regressions. A, Spontaneous activity and strength of inhibition for noise. B, Spontaneous rate and “IID dynamic range” for the same cells. C, Spontaneous activity and half-maximum point of the IID curve (for noise stimuli). The Spearman rank-correlation test gave similar significance values for A-C.
a map of half-maximum IID in a single-isofrequency lamina. To address this question, we obtained both excitatory and in- hibitory response curves for a sample of 59 cells. For one-quarter of the cells, the inhibitory curve was just as frequency-selective as the excitatory curve and centered on the same frequency. Some of these cells showed narrow response curves (Fig. 13A), others much broader curves (Fig. 13B). In 3 cells, the inhibitory curve was shifted more than 500 Hz to lower or higher fre- quencies (Fig. 130). For the other three-quarters of the cells, the inhibitory response curve was less frequency-selective than the excitatory curve (Fig. 13C). In almost all cases, however, the best inhibitory and excitatory frequencies matched very well.
Discussion We propose a simple model to explain both the response of VLVp cells to IID and the mapping of the half-maximum IID in the nucleus. In order to simplify the model, we make the following assumptions: cells receive excitatory and inhibitory inputs with the same dynamic range of 20 dB and the same threshold. Inhibition is the algebraic subtraction of spike count from that due to the excitatory input. We modeled the IID response for 3 cases with 100,60, and 20% strength of inhibition by assuming that the inhibitory contribution subtracts, maxi- mally, 100, 60, and 20% of the excitatory spike count, respec- tively.
As Figure 14, B-D, shows, this simple model closely simulates the observed IID rate functions obtained for cells at 3 different depths, as in Figure 3, A-C. The model mimics the shifts of the IID rate function with increasing ABI and even the decrease in sensitivity to IID at higher ABI levels (cf. Figs. 3B, 140. The model is sufficient for explaining neuronal responses to varia- tions in IID without incorporating such factors as the contri- bution of different frequency channels and nonlinear interaction between excitatory and inhibitory effects. Although the rela- tionship between the thresholds for monaural excitatory and inhibitory inputs and between their dynamic ranges changes with depth, it appears that the depth-dependent gradient of
inhibition is the major determinant of the map of half-maxi- mum IID. Part of the map contains cells that show no or little shift of the half-maximum IID with changing ABI. These cells respond maximally to a specific range of IID near zero IID. The responses are virtually independent of absolute sound intensity and they are also sensitive to small changes in IID. Therefore, these cells are suitable for encoding IID.
A map of this kind has not been demonstrated at low brain stem levels in mammals. Although a systematic shift in neural sensitivity to IID has been shown in 2 regions of the inferior colliculus of the moustached bat (Wenstrup et al., 1985, 1986) and in the deep layers of the superior colliculus of the cat (Wise and Irvine, 1985) it is not clear at what level of the mammalian auditory system this pattern arises. The collicular nuclei may simply receive topographical projections of IID maps from low-
Number of cells per
600-Hz group
2.6 3.0 5.0 6.2 7.4 n 8.6 In
Best frequency (kHz)
Figure 1 I. Representation of best frequency. Histogram of the number of cells encountered in 12 VLVp nuclei arranged in BF groups. The frequency range covered is 2.3-10.7 kHz, in 600-Hz-wide bins.

2674 Manley et al. - Interaural Intensity Difference Map in Owl Brain Stem
Figure 12. Four aspects of the re- sponse properties of 5 consecutive cells in a single penetration. A, The best fre- quencies of the cells (left ordinate) change little with depth, whereas the spontaneous activity (right ordinate) rises substantially. B, The strength of inhibition (left ordinate) falls with cell depth, the position of the half-maxi- mum point (right ordinate) changes from contralateral to ipsilateral.
Relative discharge
rate (%
25
75
Relative discharge 5.
rate (%;)
25
Best freiikUiiezj=Y
8
6
100
80
6.75 17 17.25 17.5 17.75 18
Streonfgth 6o inhibition
(7%) Jo
20
B &-. l .
Half-max.
80
70
60
50
40
30
20
10
0
Spont. discharge
rate (spikes/set)
0 16.75 17 17.25 17.5 17.75 18
Recording depth (mm)
Fre:uency (kLiz) 12 3
Fre:uency (k9Hz) 12
10
5
0 Half- maximum
-5 point (dB IID)
-10
., . 3 6 9 12
100
75
50
25
0
D ** ,.-’ ,’ : ----_._ :
LJL : : /’ : : : : : ,’ i, ,J’ : 8’ ; : 1,:

The Journal of Neuroscience, August 1988, 8(8) 2676
-10 0 10 20
IID (dB)
Discharge rate @>
IID (dB) IID (dB) IID (dB)
100
c “;;-- :‘/ : ,’
80 : / f;/’
60 :,#
.;a :
l ’
: 40
;: ,’ : 60%
20 ; : ; : inhibition
/ :
220 .: :
-10 0 10 20
Figure 14. A model of IID responses. A, Diagram of the procedure used to calculate the IID response for a hypothetical cell with 60% inhibition. The dashed lines represent the excitatory and inhibitory monaural inputs, the solid line the result of the algebraic subtraction of inhibition from excitation. This resultant model output curve corresponds to the dotted line in C. Other model output curves in A-Cwere calculated in a corresponding fashion, assuming that higher ABI produce a greater overlap of the monaural input curves. B-D, Model IID rate functions at different ABI. Line patterns as in Figure 3. B, For 100% inhibition, the IID rate functions shift contralaterally with increasing intensity. This represents the situation in Figure 3A. C, For 60% inhibition, there is a range of ABI over which the half-maximum point hardly changes. At the highest ABI, the rate function is less sensitive to IID. This shows close similarities to Figure 3B. D, For 20% inhibition, the rate function shifts to more ipsilateral positions for higher ABI, as in Figure 3C.
er-order nuclei. Although EI and EE neurons have been reported in the S segment of the cat superior olive (Boudreau and Tsuchi- tani, 1968) and in the dorsal nucleus of the lateral lemniscus (Brugge et al., 1970), no clear map of IID was found. The su- perior olivary nucleus of mammals is the first binaural station where IID-sensitive neurons occur. However, the medial su- perior olive contains mostly EE cells and the lateral superior olive mostly IE neurons, which receive inhibitory input from the contralateral side and excitatory input from the ipsilateral side (Irvine, 1986). The mammalian homolog of the VLVp remains to be established.
Mapping of IID in the VLVp of the barn owl finds its parallel in the nucleus laminaris, which maps ITD. Thus, in both the time- and intensity-processing pathways, transformation from spike codes to place codes occurs in the first binaural station. In both pathways, the first map is centrally synthesized; it is not due to topographical projection of the basilar papilla, but to processing of binaural disparities. Furthermore, once a map is formed, it projects topographically onto higher stations (Ko- nishi, 1986b). The orientation of maps also follows certain rules; for instance, both ITD in the nucleus laminaris (Sullivan and
t
Konishi, 1986) and IID in the VLVp are mapped along an axis perpendicular to the tonotopic axis. The laminaris map of ITD appears to project topographically onto the ICC, where ITD are also mapped along an axis perpendicular to the tonotopic axis (Wagner et al., 1987).
The VLVp projects tonotopically to the part of the ICC that is not occupied by the terminals of laminaris axons (T. Taka- hashi and M. Konishi, unpublished observations). The ICC map of ITD projects to the external nucleus, ICx; here, ICC neurons tuned to different frequencies but selective for the same ITD converge onto single loci in the map of auditory space (Wagner et al., 1987). For this reason, space-specific neurons are broadly tuned to frequency. A similar projection pattern is expected in the intensity pathway. VLVp cells that are selective for the same IID appear to occur at about the same depth across different frequency laminae. This organization by IID is likely to be projected to the ICC, from which different frequency channels may converge in the ICx as in the time-processing pathway.
The map ofauditory space in the ICx results from convergence of the time- and intensity-processing pathways. In this map, ITD and IID are mapped along axes that are orthogonal to each
Figure 13. Excitatory (continuous lines) and inhibitory (dashed lines) response curves for 4 representative cells in the VLVp. The ordinate gives the discharge rate as the percentage of maximum for the response curves. The tuning of both response curves is fairly sharp in A, broad in B. Cell B was encountered immediately after cell A in a penetration in which all other cells were sharply tuned. Cell C illustrates a case in which the inhibitory curve is less frequency-selective than the excitatory curve. In D, the inhibitory BF is displaced downward in frequency as compared to the excitatory curve. The BF of the inhibitory curve was the same as the matched excitatory and inhibitory BF of cells lying above this cell in the same penetration.
2676 Manley et al. * lnteraural Intensity Difference Map in Owl Brain Stem
other. Space-specific neurons are selective for a particular com- bination of ITD and IID (Moiseff and Konishi, 198 1 a). Their IID response curves are bell-shaped, unlike those of VLVp cells. A simple method of obtaining a bell-shaped curve would be to combine VLVp curves from the 2 sides. Two other observations suggest possible contributions of VLVp cells to the formation of the auditory space map: the predominance, among cells show- ing little or no shift of half-maximum point, of cells preferring small IID (cf. Fig. 4B); and the distribution of best frequencies. Space-specific neurons in ICx that have their receptive fields near the middle of the face are much more numerous than those representing eccentric positions (Knudsen and Konishi, 1978). Frequency is an important factor in localization; frequencies between 4 and 8 kHz are most suitable for localization. How- ever, the larger errors of localization with low frequencies (~4 kHz) are mostly in elevation (Knudsen and Konishi, 1978). Neurons tuned to frequencies lower than about 4 kHz are not only underrepresented in the VLVp, but also lack the typical IID selectivity. Similarly, despite the broad tuning of space- specific neurons, their excitatory tuning curves tend to be cen- tered between 4 and 9 kHz (Knudsen, 1984).
In conclusion, VLVp cells encode interaural intensity differ- ences by means of the interaction of excitatory and inhibitory inputs. The cells form a map of IID along the dorsoventral axis of the nucleus. Interaction of excitatory input with a dorsoven- tral gradient of inhibition gives rise to the map of IID. Encoding and mapping of IID in this nucleus presumably contribute to the IID selectivity of space-specific neurons and to the formation of the elevational axis of the auditory space map. Some of the attributes of the VLVp map are correlated with the use of IID for sound localization by the barn owl.
References Boudreau, J. C., and C. Tsuchitani (1968) Binaural interaction in the
cat superior-olive S-segment. J. Neurophysiol. 31: 442-454. Brugge, J. F., D. J. Anderson, and L. M. Aitkin (1970) Responses of
neurons in the dorsal nucleus of the lateral lemniscus of the cat to binaural tonal stimulation. J. Neurophysiol. 33: 441458.
Cleveland, W. S. (1979) Robust locally weighted regression and smoothing scatterplots. J. Am. Stat. Assoc. 74: 829-836.
Irvine, D. R. F. (1986) The Auditory Brainstem: Progress in Sensory Physiology 7, D. Ottoson, ed., Springer-Verlag, Berlin, Heidelberg, New York, Tokyo.
Knudsen, E. I. (1983) Subdivision of the inferior colliculus in the barn owl (Tyto alba). J. Comp. Neurol. 218: 174-186.
Knudsen, E. I. (1984) Synthesis of a neural map of auditory space in the owl. In Dynamic Aspects of Neocortical Function, Cl. M. Edelman, W. E. Gall, and W. M. Cowan, eds., pp. 375-396, Wiley, New York.
Knudsen, E. I., and M. Konishi (1978) Space and frequency are rep- resented separately in auditory midbrain of the owl. J. Neurophysiol. 41: 870-884.
Konishi, M. (1986a) How auditory space is encoded in the owl’s brain. In Comparative Neurobiology: Modes of Communication in the Ner- vous System, M. J. Cohen and F. Strumwasser, eds., pp. 335-349, Wiley, New York.
Konishi, M. (1986b) Centrally synthesized maps of sensory space. Trends Neurosci. 9: 163-168.
Moiseff, A., and M. Konishi (1981a) Neuronal and behavioral sen- sitivity to binaural time differences in the owl. J. Neurosci. I: 40-48.
Moiseff. A.. and M. Konishi (198 lb) The owl’s interaural nathwav is not involved in sound localization: J. Comp. Physiol. 144: 299-3b4.
Moiseff, A., and M. Konishi (1983) Binaural characteristics of units in the owl’s brainstem auditory pathway: Precursors of restricted spatial receptive fields. J. Neurosci. 3: 2553-2562.
Payne, R. S. (197 1) Acoustic location of prey by barn owls (Tyto alba). J. Exp. Biol. 54: 535-573.
Sullivan, W. E., and M. Konishi (1984) Segregation of stimulus phase and intensity coding in the cochlear nucleus of the barn owl. J. Neu- rosci. 4: 1787-1799.
Sullivan, W. E., and M. Konishi (1986) Neural map ofinteraural phase difference in the owl’s brainstem. Proc. Nat. Acad. Sci. USA 83: 8400-8404.
Takahashi, T., A. Moiseff, and M. Konishi (1984) Time and intensity cues are processed independently in the auditory system of the owl. J. Neurosci. 4: 1781-1786.
Wagner, H., T. Takahashi, and M. Konishi (1987) Representation of interaural time difference in the central nucleus of the barn owl’s inferior colliculus. J. Neurosci. 7: 3 105-3116.
Wenstrup, J. J., L. S. Ross, and G. D. Pollack (1985) A functional organization of binaural responses in the inferior colliculus. Hearing Res. 17: 191-195.
Wenstrup, J. J., L. S. Ross, and G. D. Pollack (1986) Binaural response organization within a frequency-band representation of the inferior colliculus: Implications for sound localization. J. Neurosci. 6: 962- 973.
Wise, L. Z., and D. R. F. Irvine (1985) Topographic organization of interaural intensity difference sensitivity in deep layers of cat superior colliculus: Implications for auditory spatial representation. J. Neu- rophysiol. 54: 185-2 11.
Wolbarsht, M. L., E. F. MacNichol, and M. G. Wagner (1960) Glass insulated platinum microelectrode. Science 132: 1309-l 3 10.