A N EW A PPROACH T O E DF V ALIDATION ISDA 2000 2 VALIDATION BACKGROUND What is meant by Validation?...
25
A NEW APPROACH TO EDF VALIDATION ISDA 2000
-
Upload
phoebe-flowers -
Category
Documents
-
view
217 -
download
3
Transcript of A N EW A PPROACH T O E DF V ALIDATION ISDA 2000 2 VALIDATION BACKGROUND What is meant by Validation?...

A NEW APPROACH TO
EDF VALIDATION
ISDA 2000
2
VALIDATION BACKGROUND
What is meant by Validation?Checking the impact of Methodology
Assumptions on Result Reliability
Why is it more of an issue now?Because of the new Basel Committee
proposed framework

3
VALIDATING METHODOLOGIES
Common computations call on:
Market Price assumptions Rating Judgment assumptions Historical Reference assumptions Economic Environment assumptions
What are their limitations?
4
VALIDATION CHALLENGE
Statistical rules applied for market risks are inappropriate
So validating default expectations requires to start with credit risk basics
5
CORE VALIDATION ISSUES
Can stable and consistent signals of default be predicted at least one year ahead of time?
If yes, do these signals change over time?
If yes, what are changes a function of?

6
ADDRESSING VALIDATION ISSUES
With the Default Filter(TM) Probability of Default computation methodology
Methodology: “Model assisted numerical analysis” allowing macro-economic and specific company simulations
Default: Missing committed payment after 3 months grace period
7
VALIDATION DATA
The issue with historical data:
Choice of a good reference base Choice of time period Addressing missing data Addressing data reliability

8
VALIDATION DATABASES
.
DATABASETOTAL NUMBER
OFBORROWERS
INDUSTRIESREPRESENTED
MONTH-TO-DATECOMPLETION
UPDATE
PLANNEDCOMPLETION
DATE
Asia( Excluding Japan)
11,000 ManufacturingConstructionFinanceServicesOthers
455616905533332428
Maintain
Japan 20,000 ManufacturingConstructionFinanceServices
1078173160478
Expand
Western Europe 20,000 ManufacturingConstructionFinanceServices
15344025251900
Expand

9
BUILDING REFERENCE DATABASES
Driven by Distance and Homogeneity measures
0
CR
TD/TNW
GPM
Complemented Ranked Datapoints vs Current Ratio (-) values.
0.00
0.20
0.40
0.60
0.80
1.00
1.20
1.40
1.60
1.80
2.00
Cu
rre
nt
Ra
tio
(-) Nondefaults
Defaults
Added Nondefaults
Added Defaults

10
HOMOGENEITY OF COMPLEMENTARY DATA
ILLUSTRATION OF DISTRIBUTION OF GREATER CHINA COMPANIES CREDIT FACTOR VALUES AGAINST OTHER ASIAN
CREDIT FACTOR VALUES
0.00
200.00
400.00
600.00
800.00
1,000.00
1,200.00
Dis
tan
ce f
rom
no
n d
efau
lt o
rig
in
Other_Asian_Portfolio
Greater ChinaCompanies_Portfolio
11
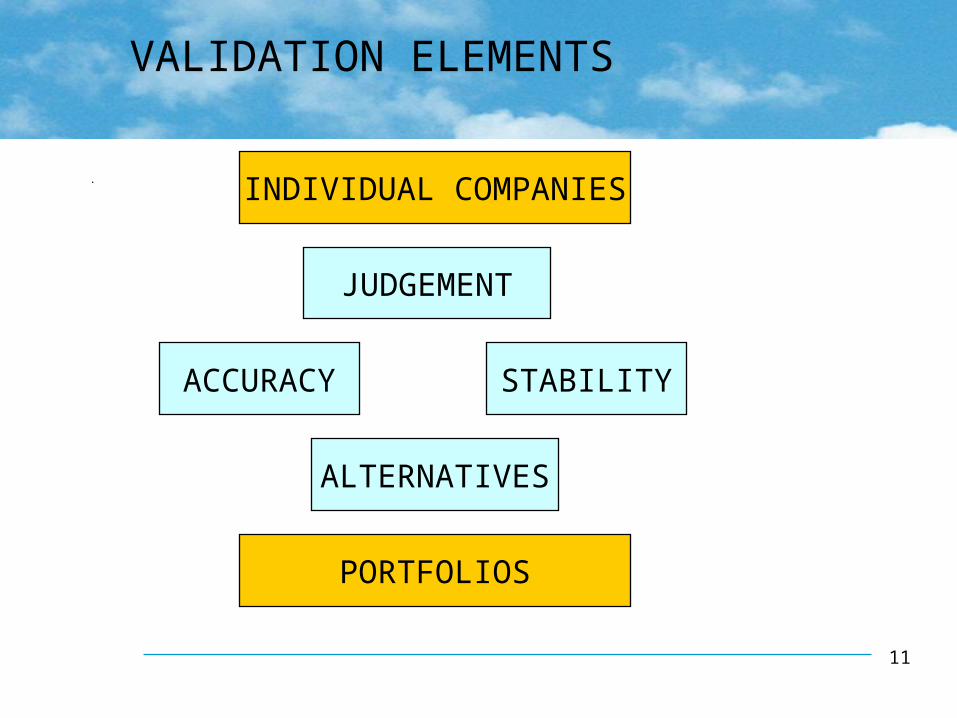
VALIDATION ELEMENTS
.
ACCURACY STABILITY
INDIVIDUAL COMPANIES
PORTFOLIOS
ALTERNATIVES
JUDGEMENT
12
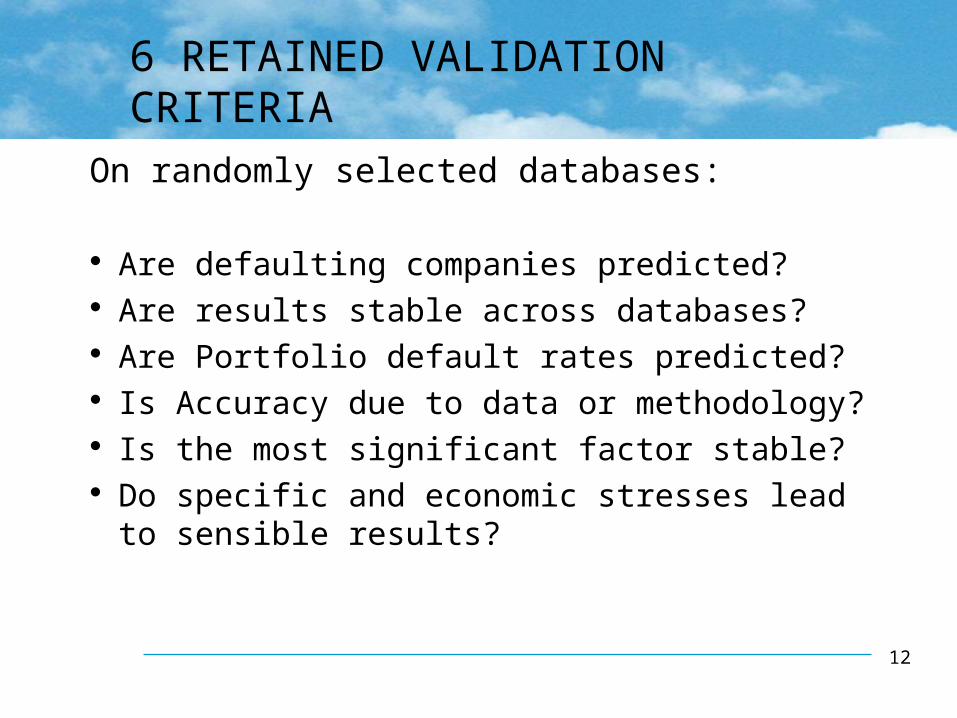
6 RETAINED VALIDATION CRITERIA
On randomly selected databases:
Are defaulting companies predicted? Are results stable across databases? Are Portfolio default rates predicted? Is Accuracy due to data or methodology? Is the most significant factor stable? Do specific and economic stresses lead
to sensible results?
13
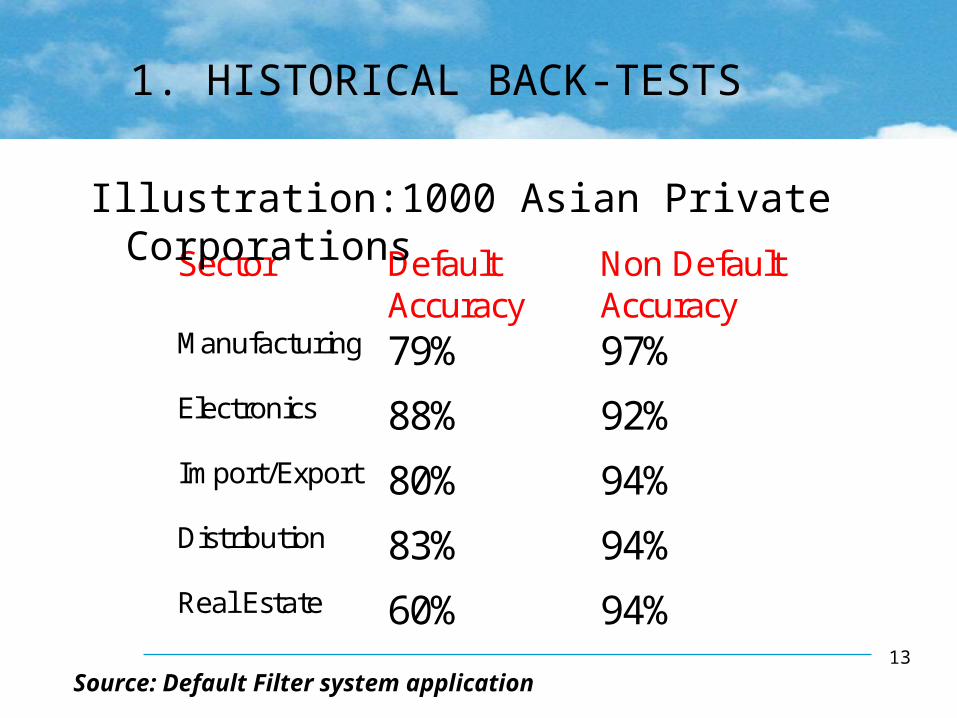
1. HISTORICAL BACK-TESTS
Source: Default Filter system application
Sector DefaultAccuracy
Non DefaultAccuracy
Manufacturing 79% 97%Electronics 88% 92%Import/Export 80% 94%Distribution 83% 94%Real Estate 60% 94%
Illustration:1000 Asian Private Corporations

14
2. COMPARATIVE BACK-TESTS
Source: Default Filter system application
Comparative Back-Testing AccuracyASIAN CONSTRUCTION INDUSTRY
0%
20%
40%
60%
80%
100%
120%
1 17
33
49
65
81
97
113
129
145
161
177
193
209
225
241
257
273
289
305
321
337
353
369
385
401
417
433
449
465
481
497
Sample Number
Accu
racy L
evel
Illustration: Same data but alternative methodologies
Default FilterNo Default Portfolio Default
15
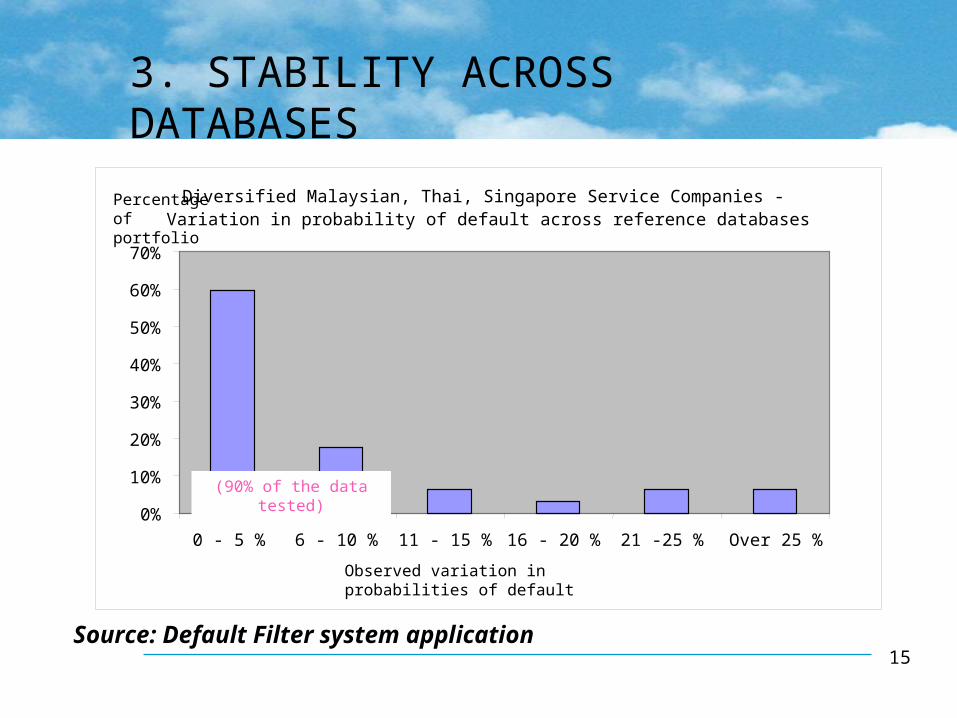
3. STABILITY ACROSS DATABASES
0%
10%
20%
30%
40%
50%
60%
70%
0 - 5 % 6 - 10 % 11 - 15 % 16 - 20 % 21 -25 % Over 25 %
Diversified Malaysian, Thai, Singapore Service Companies - Variation in probability of default across reference databases
Percentage of portfolio
Observed variation in probabilities of default
(90% of the data tested)
Source: Default Filter system application
16
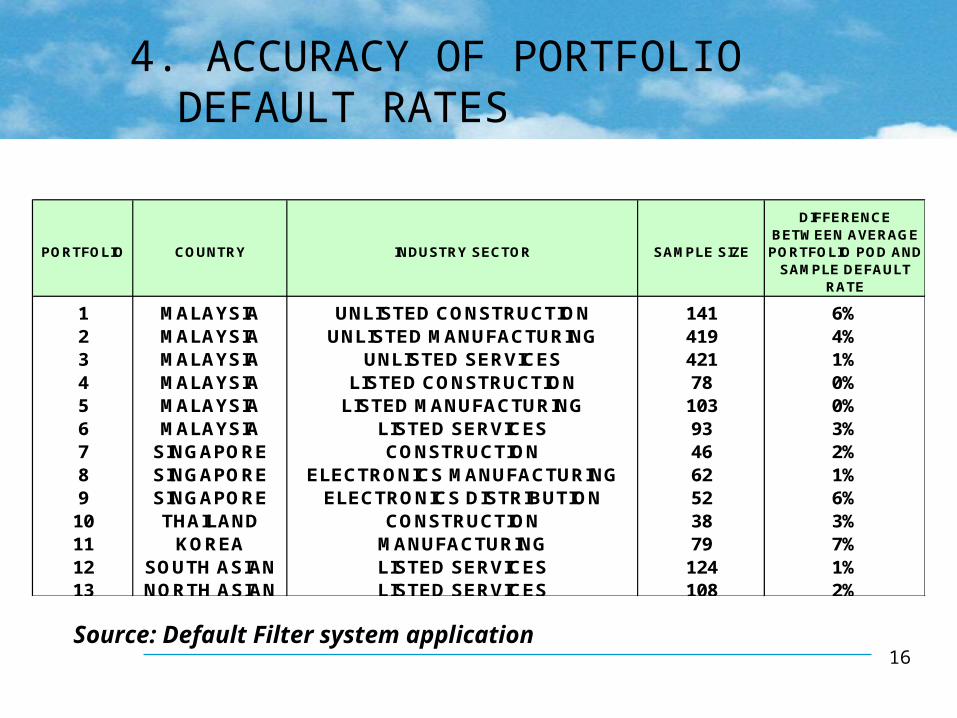
4. ACCURACY OF PORTFOLIO DEFAULT RATES
PORTFOLIO COUNTRY INDUSTRY SECTOR SAMPLE SIZE
DIFFERENCE BETWEEN AVERAGE PORTFOLIO POD AND
SAMPLE DEFAULT RATE
1 MALAYSIA UNLISTED CONSTRUCTION 141 6%2 MALAYSIA UNLISTED MANUFACTURING 419 4%3 MALAYSIA UNLISTED SERVICES 421 1%4 MALAYSIA LISTED CONSTRUCTION 78 0%5 MALAYSIA LISTED MANUFACTURING 103 0%6 MALAYSIA LISTED SERVICES 93 3%7 SINGAPORE CONSTRUCTION 46 2%8 SINGAPORE ELECTRONICS MANUFACTURING 62 1%9 SINGAPORE ELECTRONICS DISTRIBUTION 52 6%
10 THAILAND CONSTRUCTION 38 3%11 KOREA MANUFACTURING 79 7%12 SOUTH ASIAN LISTED SERVICES 124 1%13 NORTH ASIAN LISTED SERVICES 108 2%
Source: Default Filter system application

17
5. STABILITY OF MOST SIGNIFICANT FACTOR
Source: Default Filter system application
QUICK RATIO FOR A PORTFOLIO OF NON-DEFAULTING UNLISTED MALAYSIANCONSTRUCTION COMPANIES PLOTTED AGAINST RISK GRADUATION
0.00
0.20
0.40
0.60
0.80
1.00
1.20
1.40
1.60
GRADE 5 POD 21 - 25 %
GRADE 4 POD16 - 20 %
GRADE 3 POD11-15 %
GRADE 2 POD6 -10 %
GRADE 1 POD0-5 %

18
6. SENSITIVITY TO CHANGES
Scenario Scenario User defined scenario1 1 2 1
Probability of Default 0.15 0.25 0.24 0.05Credit Margin 3.00% 5.00% 4.80% 1.00%FACTORSTurnover 984,750 Gross Profit 427,822 Net Profit Before Tax 43,492 Net Cashflow from Operations 20,000
Current Ratio 0.80 0.64 0.40 1.34Quick Ratio 0.78 0.62 0.39 1.07
Average Collection Period (Days) 90.00 117.00 90.00 102.87Average Payment Period (Days) 30.00 39.00 30.00 17.77Total Liabilities/NTW 0.93 0.93 0.93 0.49Total Interest Bearing Debt/NTW 0.51 0.51 0.51 1.43
Times Interest Earned 1.00 0.60 1.00 2.11
NPBT over Turnover 0.04 0.03 0.04 0.24
Construction Weakening Economy Liquidity Squeeze Correlated
Source: Default Filter system application

19
SUMMARISED VALIDATION BOARD
Illustration for the Asian Electronic Manufacturing Industry
Accuracy
TotalDefault
WeightsSign
s
94%82%
6
Stability
Portfolio
Predicted
Observed
13%
12%
Significance
0%
20%
40%
60%
80%
100%
120%
1 4 7 10
13
16
19
22
25
28
31
34
37
40
43
46
49
52
55
58
61
64
67
70
73
76
79
82
85
88
Samples
Pred
icti
ve A
ccu
racy
Default Filter Default rate
No Default
Comparison
63% < 5%
72% < 10%
76% < 20%
deviations
deviations
deviations
[0.004,6.23] ok
FactorsQuick Ratio
0.00
0.50
1.00
1.50
2.00
2.50
Soundness

20
SUMMARISED VALIDATION BOARD
Illustration for the Asian Oil and Gas Industry
Accuracy
TotalDefault
Factors
WeightsSigns
95%60%
8
[-3.38,0.02] ok
Stability
77% < 5%
Portfolio
Predicted
Observed
7%
9%
Significance
0
0.5
1
1.5
[30,100] [10,30[ [5,10[ [1,5[ [0,1[
Probability of Default
Cu
rren
t A
sset
s/S
ales
Soundness
84% < 10%
91% < 20%
Comparison
deviations
deviations
deviations0%
20%
40%
60%
80%
100%
120%
1 4 7 10
13
16
19
22
25
28
31
34
37
40
43
46
49
52
55
58
61
64
67
70
73
76
79
82
85
88
91
94
97
100
Samples
Pred
ictiv
e A
ccu
racy
Default Filter
No Default
Default rate

21
OPPORTUNITIES FOR RISK MANAGEMENT
Compare Risk Signals between Homogeneous Groups
Developed Markets Electronics
0
0.1
0.2
0.3
0.4
0.5
0.6
0.7
0.8
0.9
0 50 100 150
Po
D
Non Japan Asia Electronics
0.00
0.20
0.40
0.60
0.80
1.00
1.20
0 50 100 150 200
Po
D
•Current Profile•For 10% decrease in Sales
Legend:

22
1997 Probability of default of banks in Asia Under Normal Conditions
Philip
pin
es
Hong
Kong
Assess sensitivity to Macro-economic Changes
Pro
bab
ility o
f D
efa
ult
Taiw
an
Mala
ys
ia Sin
gapo
re Kore
a
Thaila
nd In
donesi
a0.0
0.2
0.4
0.6
0.8
1.0
1.2
Probability of bank default
OPPORTUNITIES FOR RISK MANAGEMENT
23
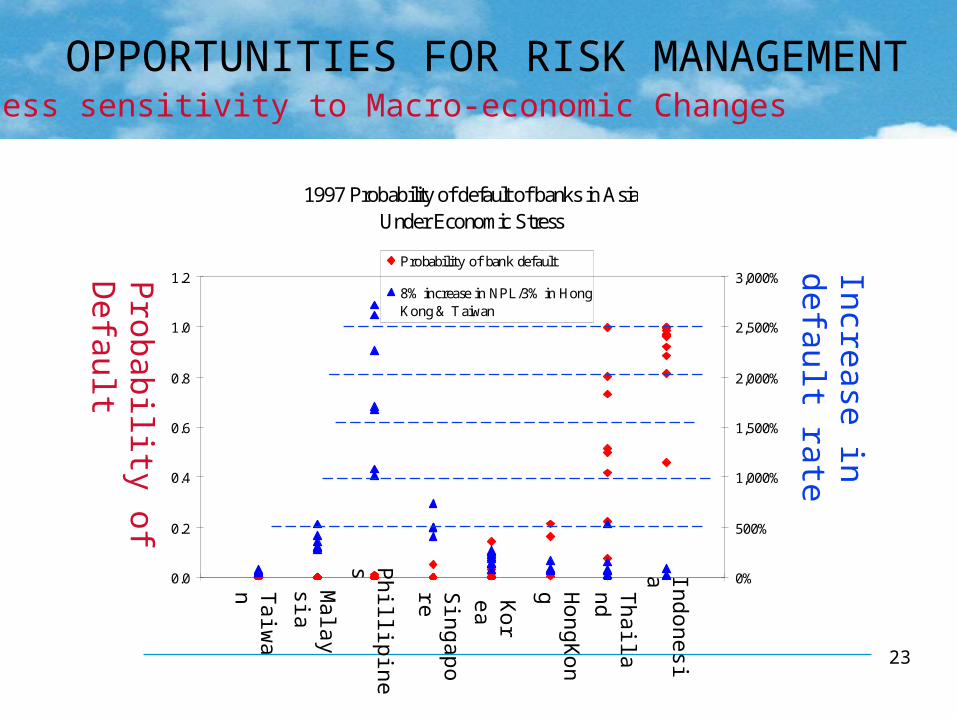
1997 Probability of default of banks in Asia Under Economic Stress
0.0
0.2
0.4
0.6
0.8
1.0
1.2
0%
500%
1,000%
1,500%
2,000%
2,500%
3,000%Probability of bank default
8% increase in NPL/3% in HongKong & Taiwan
Taiw
an
Malaysi
a Phillipin
es Singapore
Kore
a HongK
ong
Thailand
Indonesia
Assess sensitivity to Macro-economic Changes
Probability of D
efault
Increase in default rate
OPPORTUNITIES FOR RISK MANAGEMENT

24
BUSINESS OPPORTUNITIES
1. Risk Communication tool to trade assets
2. Default Indices and sensitivity to economy
3. Contingent Pricing for Portfolios
4. Portfolio Insurance

25
INDUSTRY INITIATIVE FOR BENCHMARKING DEFAULT RISK
Internet Interface iqfinancial.comSector
Credit Factor InputFactor 1
Factor 2
Factor 3
Factor 4
Factor 5
Save Input?Open Input?
Yes/No
Yes/No
Future Environmentin country GDPin sector growthin FX rate
in interest rateScenario
NameSave Scenario?Open Scenario?Open Simulation?
Yes/No
Yes/No
Yes/No
Probability of Default
Rating Equivalent
Validation Results?Save Probability?
Yes/No
Yes/No
Validation Definition
Sector Definition
Factor Definition
Rating Equivalent Definition
Instructions Sector’s Default Profile