O'opu Prints and Dissections - University of Hawaii at Manoa
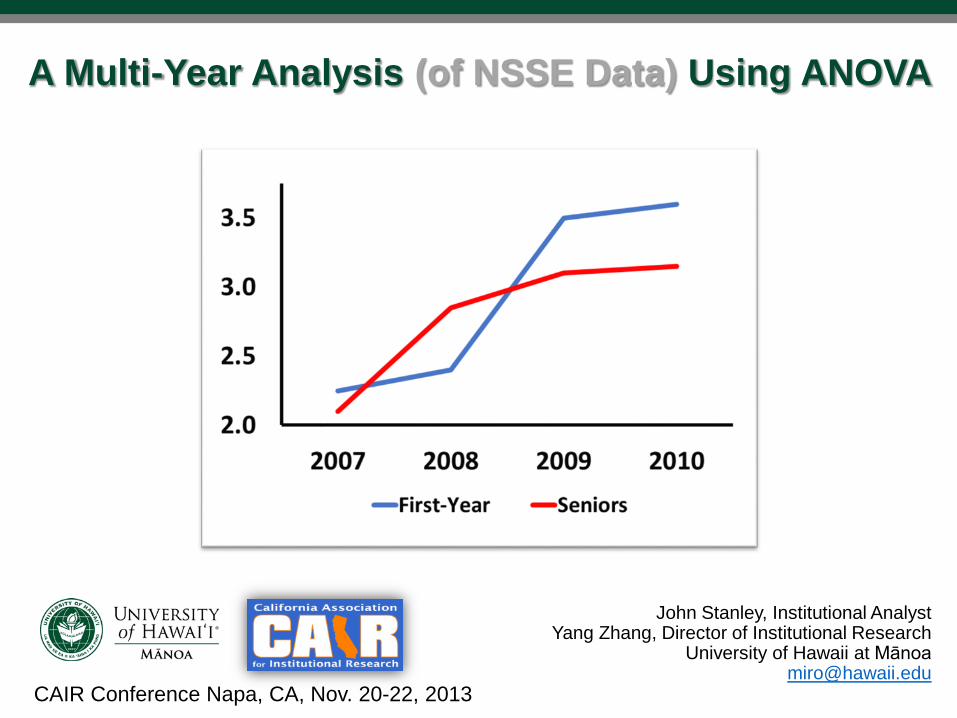
A Multi-Year Analysis (of NSSE Data) Using ANOVA
John Stanley, Institutional AnalystYang Zhang, Director of Institutional Research
University of Hawaii at Mā[email protected]
CAIR Conference Napa, CA, Nov. 20-22, 2013

• What is a multi-year data analysis and why is it useful?
• UH Mānoa example using NSSE data
• Brief background on NSSE• Research question• Methodology• Step-by-Step data analysis• Results
• Limitations and future studies
Presentation Outline
1

What is a Multi-Year Data Analysis?
In multi-year designs, we are interested in measuring whether there has been a meaningful change in outcomes over time.
2

Research Questions that can be Addressed by ‘Multi-Year’ Analysis
• Cross-Sectional (A): “Are 2005 and 2008 first year students’ experiences about advising significantly different?”
• Longitudinal (B): “Did 2005 first year students’ experiences change in 2008 when they became seniors?”
• (C): “Are 2005 first year students’ perceptions of a supportive campus environment significantly different from 2005 seniors?”
4
From NSSE Multi-Year Data Analysis Guide 2012
From NSSE Multi-Year Data Analysis Guide 2012
Multi-Year analyses can belongitudinal or cross-sectional
4

Why NSSE?• NSSE is popular. As of 11/18/2013, 721 institutions will participate
in 2014. Two million students have participated NSSE since 2000.• NSSE Schedule: Administered in spring, reports is available in
summer, and student responses are available in early fall.• NSSE focuses on student engagement. It indirectly measures the
extent to which first-year and senior students participate in educational practices that contribute to their academic and personal growth.
• Survey questions and benchmarks • 5 benchmarks: level of academic challenge; active and collaborative
learning; student-faculty interaction; supportive campus environment, enriching educational experiences.
• Who will be interested in findings: leadership, faculty, committees (retention and graduation, strategic planning, initiatives, etc.)
6

UH Manoa Example
• Context: UH Mānoa’s Strategic Plan for 2002-2010 called for increasing support for academic advising.
• Approximately 40 new academic advising positions were created:
• Faculty involvement in advising and mentoring increased considerably between 2002 and 2010.
• Manoa Advising Center (MAC) formed in January 2007.
• Can NSSE data be used to indirectly measure the effectiveness of these strategic planning decisions?
i.e. Given the implementation of additional advising services in 2006-07, how much did student perceptions of the quality of academic advising increase from 2005 to 2009?
5

Research Question
Given the implementation of additional advising services at UHM in 2006-07, how much did student perceptions in the quality of academic advising increase from 2005 to 2009?
7From NSSE Multi-Year Data Analysis Guide 2012
From NSSE Survey PDF, 2008
Today’s Example is designed like this
7

Useful documentation provided by NSSE to get you started
• NSSE Multi-Year Data Analysis Guide
• Contextualizing NSSE effect sizes
• SPSS syntax for merging multiple years of data
• Excel codeset for tracking year-to-year variable changes
• Working with NSSE Data: A Facilitator’s Guide
Link to NSSE Data Analysis Resources:http://nsse.iub.edu/html/analysis_resources.cfm
8
NSSE Multi-Year Data Analysis Guide

Relevant Literature
Astin, A. W. (1993). What matters in college? Four critical years revisited. San Francisco: Jossey-Bass.
Herzog, S., and Bowman, N. A. (Eds.). (2011). Special issue: validity and limitations of college student self-report data. New Directions for Institutional Research. 2011(150). 1–120.
Kuh, G. D. (2000). Understanding campus environments. In Barr, M. J., and Desler, M. (Eds.), Handbook on student affairs administration (2nd ed.). San Francisco: Jossey-Bass.
Kuh, G. D., et al. (2010). Student success in college: creating conditions that matter. San Francisco: Jossey-Bass.
Pascarella, E., and Terenzini, P. (2005). How college affects student: volume 2, a third decade of research. San Francisco: Jossey-Bass.
Porter, S. R. (2013). Self-reported learning gains: a theory and test of college student survey response. Research in Higher Education. 54(2). 201–226.
9

Data AnalysisFour Steps:
1. Merge Multiple Years of NSSE Data
2. Perform Data Management Tasks
a) Check Data Quality (sampling error, changes over time)b) Random Samplingc) Weighting
3. Choose Statistical Method
4. Data Analysis
a) One-way ANOVAb) Post-hoc tests (Tukey Test)c) Cohen’s d
10

Step 1: Merge Multiple Years of NSSE Data
NSSE provides a SPSS script that can merge multiple years of data in to one combined file called “combinedfile.sav”.
http://nsse.iub.edu/html/analysesSyntax_original.cfm
11

Step 2: Review Respondent Characteristics
From NSSE Executive Snapshot 2008 (University of Hawaii at Mānoa)
12
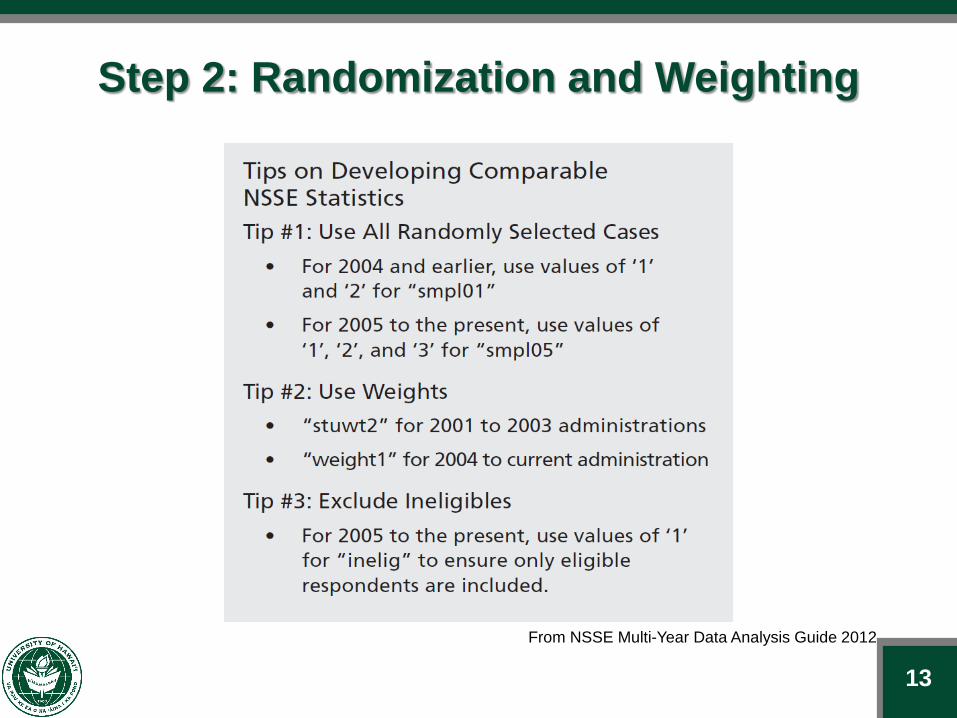
Step 2: Randomization and Weighting
From NSSE Multi-Year Data Analysis Guide 2012
13

Step 3: Choosing a Method
From NSSE Multi-Year Data Analysis Guide 2012
14
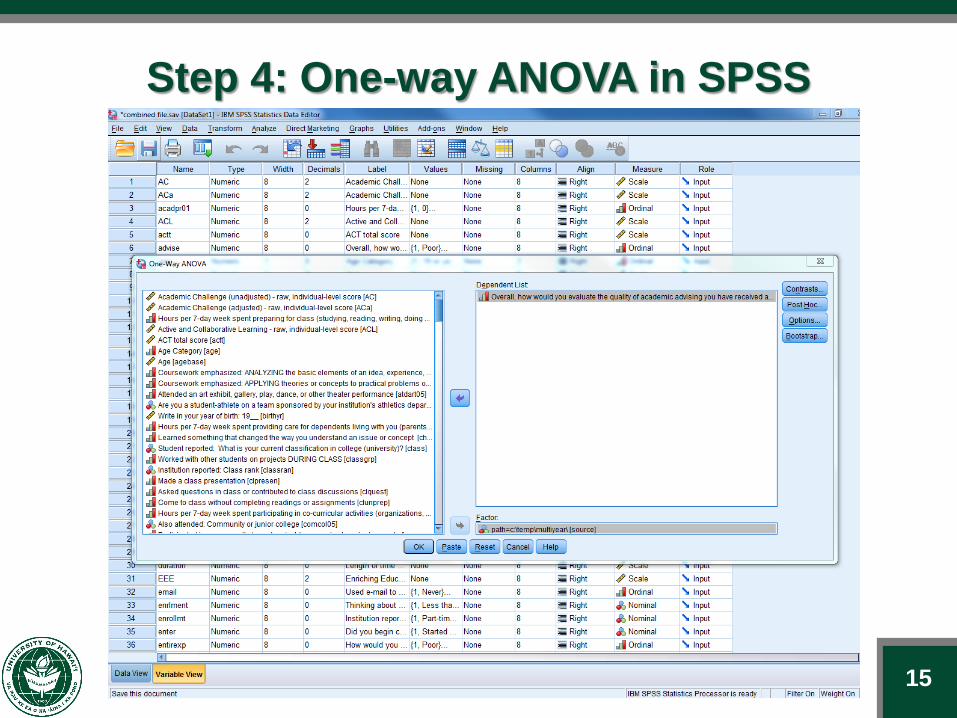
Step 4: One-way ANOVA in SPSS
15

One-way ANOVA: Options
16

One-way ANOVA: Post Hoc Test
17
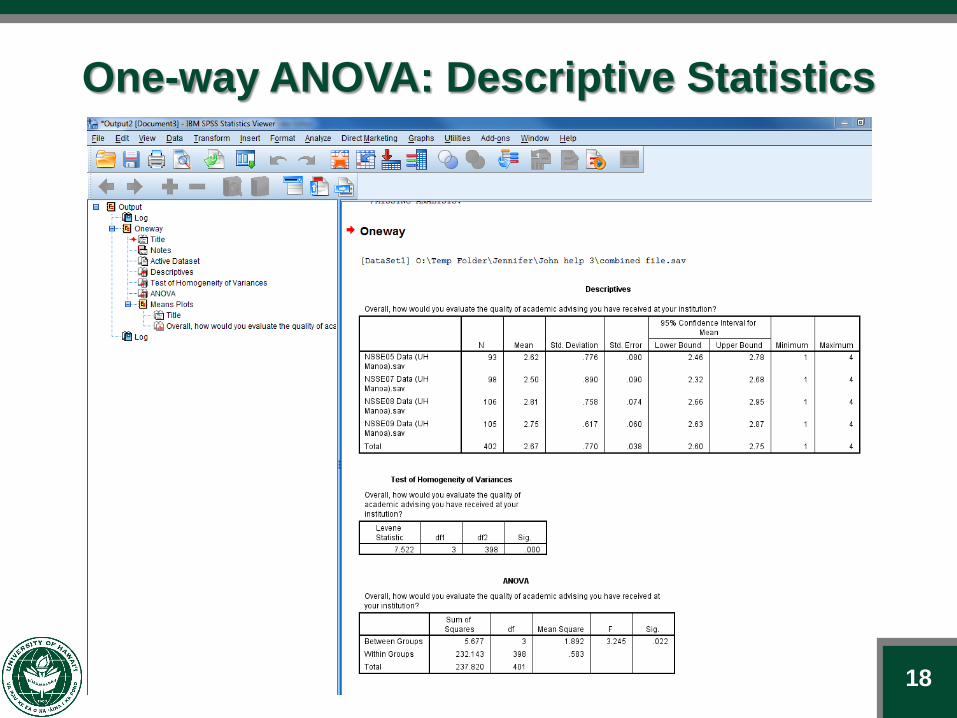
One-way ANOVA: Descriptive Statistics
18

One-way ANOVA: Post Hoc Results
19

One-way ANOVA: Means Plot
20

p = 0.023
One-way ANOVA: Means Plot
21

p = 0.023;Cohen’s d = -0.375
One-way ANOVA: Means Plot
23

Proposed Reference Values for Effect Size Interpretation
Effect SizeSmall 0.1Medium 0.3Large 0.5Very Large 0.7
(NSSE Benchmark Comparisons)
24

• Choose criteria to measure based on strategic planning priorities.
• Identify and focus on specific questions. Are you looking for general shifts in engagement, or something more specific to assess a particular campus initiative?
• Follow steps to ensure data quality, randomization, and weighting.
• Post-hoc tests to see where the differences lies
• Check effect sizes
Summary
25

Limitations/ Challenges:-- Sample size difference in different years-- Limited knowledge about college initiatives and strategies-- Change of NSSE instruments over years, especially in 2013
(Benchmarks to Engagement Indicators)
Future studies employing a multi-year analysis -- analyzing other NSSE questions & benchmarks-- using other external or home grown surveys results. Such
as graduating seniors survey, first year experience survey, alumni survey, etc.
Limitations and Future Studies
26
Questions and Suggestions?26

Mahalo
John Stanley, Institutional AnalystYang Zhang, Director
University of Hawaii at ManoaManoa Institutional Research Office
Questions: [email protected]
Link to this presentation:http://manoa.hawaii.edu/ovcaa/mir/pdf/cair2013.pdf
27