
A Multi-Response Optimization for Isomerization of Light ...
14
The British University in Egypt The British University in Egypt BUE Scholar BUE Scholar Chemical Engineering Engineering 2019 A Multi-Response Optimization for Isomerization of Light Naphtha A Multi-Response Optimization for Isomerization of Light Naphtha Donia Abdel Nasser Fathy The British University in Egypt Moustafa A. Soliman The British University in Egypt, [email protected] Follow this and additional works at: https://buescholar.bue.edu.eg/chem_eng Part of the Operational Research Commons Recommended Citation Recommended Citation Fathy, Donia Abdel Nasser and Soliman, Moustafa A., "A Multi-Response Optimization for Isomerization of Light Naphtha" (2019). Chemical Engineering. 79. https://buescholar.bue.edu.eg/chem_eng/79 This Article is brought to you for free and open access by the Engineering at BUE Scholar. It has been accepted for inclusion in Chemical Engineering by an authorized administrator of BUE Scholar. For more information, please contact [email protected].
Transcript of A Multi-Response Optimization for Isomerization of Light ...
The British University in Egypt The British University in Egypt
BUE Scholar BUE Scholar
Chemical Engineering Engineering
2019
A Multi-Response Optimization for Isomerization of Light Naphtha A Multi-Response Optimization for Isomerization of Light Naphtha
Donia Abdel Nasser Fathy The British University in Egypt
Moustafa A. Soliman The British University in Egypt, [email protected]
Follow this and additional works at: https://buescholar.bue.edu.eg/chem_eng
Part of the Operational Research Commons
Recommended Citation Recommended Citation Fathy, Donia Abdel Nasser and Soliman, Moustafa A., "A Multi-Response Optimization for Isomerization of Light Naphtha" (2019). Chemical Engineering. 79. https://buescholar.bue.edu.eg/chem_eng/79
This Article is brought to you for free and open access by the Engineering at BUE Scholar. It has been accepted for inclusion in Chemical Engineering by an authorized administrator of BUE Scholar. For more information, please contact [email protected].

International Journal of Innovative Technology and Exploring Engineering (IJITEE)
ISSN: 2278-3075, Volume-8 Issue-11, September 2019
3921
Published By:
Blue Eyes Intelligence Engineering
& Sciences Publication
Retrieval Number: K17740981119/2019©BEIESP
DOI: 10.35940/ijitee.K1774.0981119
Abstract: Isomerization process is considered one of the main
processes used to produce high octane rating gasoline with
improved environmental conditions and less emissions. The main
keys of performance in isomerization units are the product yield,
paraffin isomerization number (PIN) and octane number (RON).
In this article we present a multi-response optimization strategy
for an industrial naphtha continuous isomerizationprocess that
aims to maximize RON, PIN and yield. Data of 53-runs including
feed compositions as well as operating conditions; reactor
temperature, benzene content, liquid hour space velocity, feed
PIN, hydrogen to hydrocarbon ratio, feed octane number, C7+
content, inlet reactor temperature and iC5/C5P ratio are collected
from a refinery company over a period of two months to test the
effect of each variable and their interaction over each response
individually using analysis of variance (ANOVA). Model
reduction is applied for the three models in order to exclude any
insignificant data and improve the model’s accuracy. Finally, the
optimum operating conditions for the process are selected using
numerical optimization in Design Expert 11 by comparing with
the real industrial data runs to give the maximum yield, PIN and
RON which are 99.992, 122 and 86 respectively. Benzene content
is selected to be 1.807 wt%, reactor temperature;143oC, LHSV;
0.882 h-1, feed PIN; 64.611, H2/HC; 0.07, feed RON; 74.408, C7+;
4.06 wt%, inlet reactor temperature; 116oC and iC5/C5P ratio
45.768.
Keywords : Isomerization, multi-response optimization, Penex
process, response surface methodology.
I. INTRODUCTION
Due to the rapidly increasing requirements for gasoline and
petrochemicals over the past decades, upgrading light
hydrocarbons has been the center of attention due to the rising
commercial applications. Stringent rules and regulations have
been forced over several regions to encourage clean fuels.
The new gasoline composition regulations all over the world
included lead phase down, oxygen content requirements and
benzene minimization. According to Jones and Pujado, the
EPA (U.S. Environmental Protection Agency) has set a
regulation of minimizing the gasoline pool’ benzene amount
to 0.62 volume%. The isomerization reaction of light naphtha
helps to meet the required specification in the market in
addition to rising market’s share of different gasoline grades.
Naphtha with low-octane number is refined to produce
Revised Manuscript Received on September 05, 2019.
* Correspondence Author
Donia Abdel Nasser Fathy, Fresh Graduate from Chemical Engineering
Programme, The British University in Egypt, El Shorouk City, Cairo, Egypt.
Email: [email protected]
Moustafa Aly Soliman*, Professor of Chemical Engineering, The
British University in Egypt, El Shorouk City, Cairo, Egypt. Email:
isomerate of high-octane rating about 80 to 93. Two of the
most widely used techniques are UOP’s Penex for pentane
and hexane paraffins isomerization and Butamer which
isomerizes normal butane to iso-butane [1].
There are two empirical methods of measuring octane
number; research (RON) (ASTM Method 2699) and motor
(MON) (ASTM 2700). Both techniques use the same engine
type for testing but with different operating conditions. RON
is always larger than MON because RON measures the
performance of the engine with frequent acceleration,
however MON measures the performance on highway and at
heavy load conditions. [1]. The isomerization reactions are
exothermic. According to Le Chatelier’s Principle, these
reactions are favored at low temperature values [2]. The
temperature elevation is due to the side reactions of benzene
saturation, naphthene ring hydrocracking and coking which
are highly exothermic. However, the branched paraffin
isomers’ thermodynamic equilibria are favored at low
temperature as shown in figure (1) [3]. Isomerization
reactions’ rate is relatively slow, hence long residence time is
used to achieve an optimum conversion. Since isomerization
always occurs along with hydrocracking, yield decreases.
Paraffins with several branches are easily hydrocracked than
mono-branches [4]. The heat of reaction of isomerization,
benzene saturation, hydrocracking and naphthene ring
opening are 2200, 50,000, 11,000 and 11,000 kcal/kmol
respectively. According to the previous values, it is shown
that benzene saturation reaction is highly exothermic and
consequently it reduces the isomerate’s yield. Thus, the
benzene content in the feedstock should be limited [5].
Figure.1.Pentane Equilibria
For an economic operation, maintaining high catalyst activity
at low operating temperatures is essential. The most common
commercial catalyst used by UOP is I-8 which has been used
since 1981. Nowadays, the current most used catalysts are
UOP I-82 and I-84 [1].
Recently, three catalysts types
A multi-Response Optimization for Isomerization
of light Naphtha
Donia Abdel Nasser Fathy, Moustafa Aly Soliman
A multi-response optimization for isomerization of light naphtha
3922
Published By:
Blue Eyes Intelligence Engineering
& Sciences Publication
Retrieval Number: K17740981119/2019©BEIESP
DOI: 10.35940/ijitee.K1774.0981119
are used in the naphtha isomerization units and all of the three
contain platinum [6].
The feed to the isomerization unit contains benzene, olefins,
in addition to heavy hydrocarbons (C7+), X-factor term is used
to identify their content according to the following equation:
X-factor = (wt.% Methyl cyclopentane) + (wt.% Benzene) +
(wt.% cyclohexane) + (wt.%C7+)
The performance of the isomerization plants can be
determined by several methods such as the isomerate yield
(>97%), product research octane number (RON) and the
paraffin isomerization (PIN) which can be evaluated using the
following equation:
PIN = (product’s isopentane) / (∑Product’s C5 Paraffins) +
C (2,2 DMB and 2,3 DMB in product) / (∑product’s C6
paraffins)
For a 1 number increase of the feed’s X-factor, the PIN is
expected to decrease about 0.5 numbers due to the catalyst
ability to absorb C6 cyclic compounds as well as C7+ and
convert the active sites. Hence, higher temperatures will be
used to get the optimum catalyst performance [3].
During the optimization process, the outlet temperatures are
maintained to obtain maximum reaction rate and manipulate
the lag reactor equilibrium concentrations. This will lead to
product iso ratio maximization and economic optimum
conditions. In addition to this, maximum yield of isomerate
octane barrels can be obtained with high octane number [3].
In order to maximize the liquid yield, some refineries require
high benzene and reformer benzene precursors; MCP and CH
in the feed due to the regulations concerning reducing the
benzene content in the total gasoline pool. Hence, the benzene
content in the reformate and the gasoline pool is reduced with
no high-octane requirement in the isomerate produced.
However, some other refineries prefer maximizing the
product octane number over the liquid yield [3].
The inlet lead and lag reactor temperatures are adjusted and
optimized at the beginning of each run. By varying the lead
inlet temperature, the outlet temperature as well as the iso
ratios are monitored. The most significant controlling
iso-ratio to determine the optimum temperature is the
iso-pentane and hence similar methodology is applied for the
lag reactor [6].
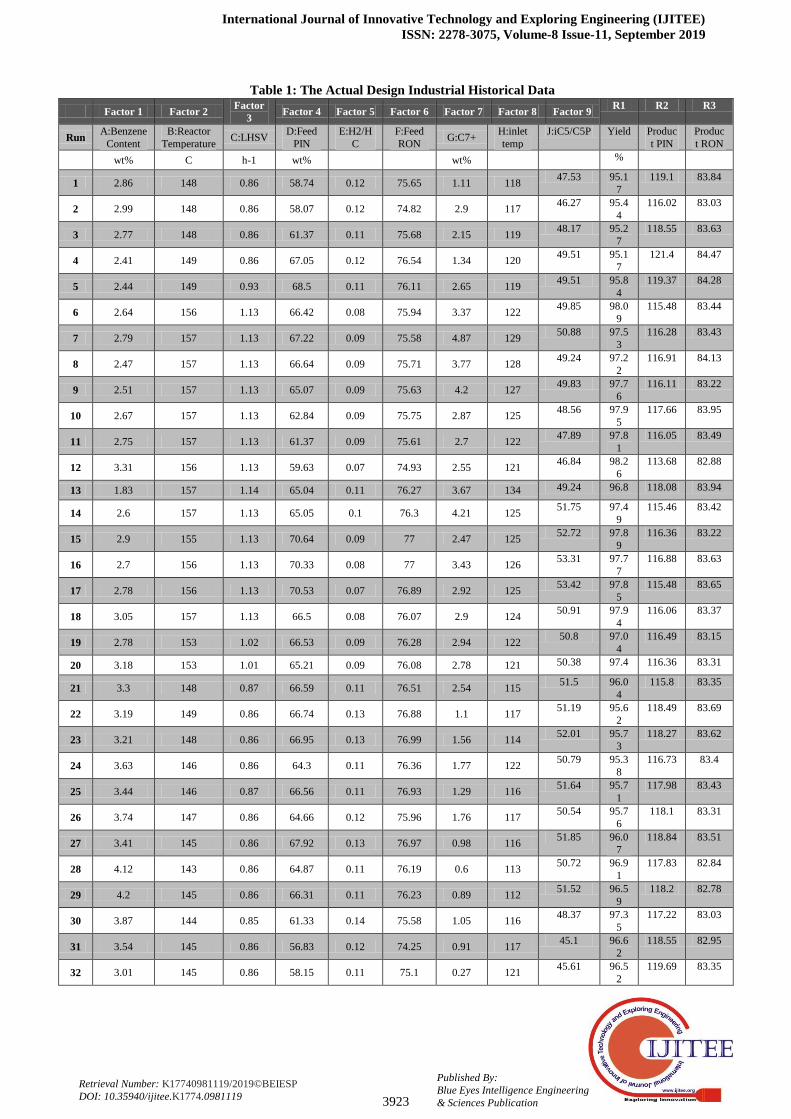
II. RESPONSE SURFACE METHODOLOGY
A multi-response optimization strategy for an industrial
naphtha continuous isomerization process that aims to obtain
high isomerate yield, PIN and RON is proposed. First, by
using design expert 11 software, three quadratic models of
three responses which are; product yield, product PIN and
product RON are analyzed. Nine factors were used via several
runs in order to detect the significance of each factor on each
obtained model as shown in table 1. The factors are benzene
content, reactor temperature, LHSV, feed PIN, H2/HC ratio,
feed RON, C7+
content, inlet reactor temperature and
iC5/C5P ratio (ratio of isopentane to all C5 paraffins %).
Trials are applied to reduce the model by excluding some runs
in order to obtain high predicted and adjusted R squared
values and improve the models. Second, the optimum
conditions are obtained by numerical optimization to give the
maximum responses. The variables are coded from A to J
respectively. Firstly, naphthene content in the feed
composition was added in the model design, however it
showed an insignificant effect on the three responses which
contradicts Shehata et al.’s paper. This can be explained due
to using different catalyst or different operating conditions.
After applying model reduction for all the three responses, the
analysis for each one is obtained with logit transform in order
to set an upper and lower boundary for the response values.
The industrial data for analysis included 53 runs after
reduction for a period of operation of two months. The data is
shown in table.1.
International Journal of Innovative Technology and Exploring Engineering (IJITEE)
ISSN: 2278-3075, Volume-8 Issue-11, September 2019
3923
Published By:
Blue Eyes Intelligence Engineering
& Sciences Publication
Retrieval Number: K17740981119/2019©BEIESP
DOI: 10.35940/ijitee.K1774.0981119
Table 1: The Actual Design Industrial Historical Data
Factor 1 Factor 2 Factor
3 Factor 4 Factor 5 Factor 6 Factor 7 Factor 8 Factor 9
R1 R2 R3
Run A:Benzene
Content
B:Reactor
Temperature C:LHSV
D:Feed
PIN
E:H2/H
C
F:Feed
RON G:C7+
H:inlet
temp
J:iC5/C5P Yield Produc
t PIN
Produc
t RON
wt% C h-1 wt% wt% %
1 2.86 148 0.86 58.74 0.12 75.65 1.11 118 47.53 95.1
7
119.1 83.84
2 2.99 148 0.86 58.07 0.12 74.82 2.9 117 46.27 95.4
4
116.02 83.03
3 2.77 148 0.86 61.37 0.11 75.68 2.15 119 48.17 95.2
7
118.55 83.63
4 2.41 149 0.86 67.05 0.12 76.54 1.34 120 49.51 95.1
7
121.4 84.47
5 2.44 149 0.93 68.5 0.11 76.11 2.65 119 49.51 95.8
4
119.37 84.28
6 2.64 156 1.13 66.42 0.08 75.94 3.37 122 49.85 98.0
9
115.48 83.44
7 2.79 157 1.13 67.22 0.09 75.58 4.87 129 50.88 97.5
3
116.28 83.43
8 2.47 157 1.13 66.64 0.09 75.71 3.77 128 49.24 97.2
2
116.91 84.13
9 2.51 157 1.13 65.07 0.09 75.63 4.2 127 49.83 97.7
6
116.11 83.22
10 2.67 157 1.13 62.84 0.09 75.75 2.87 125 48.56 97.9
5
117.66 83.95
11 2.75 157 1.13 61.37 0.09 75.61 2.7 122 47.89 97.8
1
116.05 83.49
12 3.31 156 1.13 59.63 0.07 74.93 2.55 121 46.84 98.2
6
113.68 82.88
13 1.83 157 1.14 65.04 0.11 76.27 3.67 134 49.24 96.8 118.08 83.94
14 2.6 157 1.13 65.05 0.1 76.3 4.21 125 51.75 97.4
9
115.46 83.42
15 2.9 155 1.13 70.64 0.09 77 2.47 125 52.72 97.8
9
116.36 83.22
16 2.7 156 1.13 70.33 0.08 77 3.43 126 53.31 97.7
7
116.88 83.63
17 2.78 156 1.13 70.53 0.07 76.89 2.92 125 53.42 97.8
5
115.48 83.65
18 3.05 157 1.13 66.5 0.08 76.07 2.9 124 50.91 97.9
4
116.06 83.37
19 2.78 153 1.02 66.53 0.09 76.28 2.94 122 50.8 97.0
4
116.49 83.15
20 3.18 153 1.01 65.21 0.09 76.08 2.78 121 50.38 97.4 116.36 83.31
21 3.3 148 0.87 66.59 0.11 76.51 2.54 115 51.5 96.0
4
115.8 83.35
22 3.19 149 0.86 66.74 0.13 76.88 1.1 117 51.19 95.6
2
118.49 83.69
23 3.21 148 0.86 66.95 0.13 76.99 1.56 114 52.01 95.7
3
118.27 83.62
24 3.63 146 0.86 64.3 0.11 76.36 1.77 122 50.79 95.3
8
116.73 83.4
25 3.44 146 0.87 66.56 0.11 76.93 1.29 116 51.64 95.7
1
117.98 83.43
26 3.74 147 0.86 64.66 0.12 75.96 1.76 117 50.54 95.7
6
118.1 83.31
27 3.41 145 0.86 67.92 0.13 76.97 0.98 116 51.85 96.0
7
118.84 83.51
28 4.12 143 0.86 64.87 0.11 76.19 0.6 113 50.72 96.9
1
117.83 82.84
29 4.2 145 0.86 66.31 0.11 76.23 0.89 112 51.52 96.5
9
118.2 82.78
30 3.87 144 0.85 61.33 0.14 75.58 1.05 116 48.37 97.3
5
117.22 83.03
31 3.54 145 0.86 56.83 0.12 74.25 0.91 117 45.1 96.6
2
118.55 82.95
32 3.01 145 0.86 58.15 0.11 75.1 0.27 121 45.61 96.5
2
119.69 83.35
A multi-response optimization for isomerization of light naphtha
3924
Published By:
Blue Eyes Intelligence Engineering
& Sciences Publication
Retrieval Number: K17740981119/2019©BEIESP
DOI: 10.35940/ijitee.K1774.0981119
33 2.7 145 0.86 58.33 0.1 75.37 1.23 116 46.45 96.8
5
119.63 84.09
34 2.7 147 0.86 58.33 0.11 75.37 1.23 118 46.45 95.8
5
119.63 84.09
35 2.88 148 0.85 62.35 0.1 76.17 1.01 118 49.69 97.2 117.7 83.5
36 3.25 146 0.85 59.96 0.09 74.72 1.05 117 47.9 97.4
6
117.53 83
37 2.96 147 0.86 61.1 0.1 75.08 1.15 118 49.79 96.3
3
118.16 83.26
38 3.32 147 0.86 59.66 0.11 74.91 1.22 115 48.98 97.3
7
117.38 83.28
39 3.24 146 0.86 60.48 0.12 75.2 1.06 117 49.15 96.6
8
116.75 83.13
40 3.15 147 0.86 61.74 0.1 75.53 1.64 115 48.44 95.8
5
116.66 83.53
41 3.53 145 0.85 58.57 0.13 74.9 0.6 114 46.03 97.7
4
119.46 83.7
42 4.3 147 0.84 60.87 0.12 74.77 1.01 112 47.64 98.6 116.66 82.71
43 4.74 154 1 58.26 0.09 74.59 1.53 124 47.73 97.6
8
114.52 82.42
44 3.53 152 1.01 57.73 0.08 75.24 2.13 119 47.42 97.7
1
112.11 82.76
45 2.85 153 1.01 63.9 0.08 75.71 2.85 123 48.72 97.5
2
115.36 83.38
46 2.59 153 1.01 60.35 0.07 75.55 1.93 121 46.5 98.0
9
117.81 83.91
47 2.58 154 1.02 58.11 0.07 75.08 2.92 118 46.38 98.1
3
115.36 83.7
48 2.77 153 1.01 59.73 0.07 75.47 2.1 117 47.05 98.2
2
113.64 83.15
49 3.18 153 1.01 58.01 0.08 74.94 3.21 116 46.07 97.9
3
113.62 82.75
50 2.15 153 1.02 60.66 0.1 76.26 1.63 121 46.74 97.7
8
118.36 83.93
51 3.17 153 1.01 63.2 0.08 75.68 3.93 121 49.76 97.8
3
115.09 83.06
52 3.22 155 1.01 60.46 0.08 75.2 3.31 123 47.7 97.7
4
114.98 83.12
53 3.22 156 1.01 60.46 0.08 75.2 3.31 123 47.7 97.8
9
114.98 83.12
III. RESULTS AND DISCUSSION
The predicted model is examined for adequacy to avoid any
possible errors with the normality assumptions. After 53 runs
have been applied where the product yield, PIN and RON
have been reported for each run for a period of two month
working days in naphtha isomerization unit, a regression
model has been developed to show the empirical relationship
among the yield response and the nine process variables.
a. Yield Response
The quadratic equation is represented as:
International Journal of Innovative Technology and Exploring Engineering (IJITEE)
ISSN: 2278-3075, Volume-8 Issue-11, September 2019
3925
Published By:
Blue Eyes Intelligence Engineering
& Sciences Publication
Retrieval Number: K17740981119/2019©BEIESP
DOI: 10.35940/ijitee.K1774.0981119
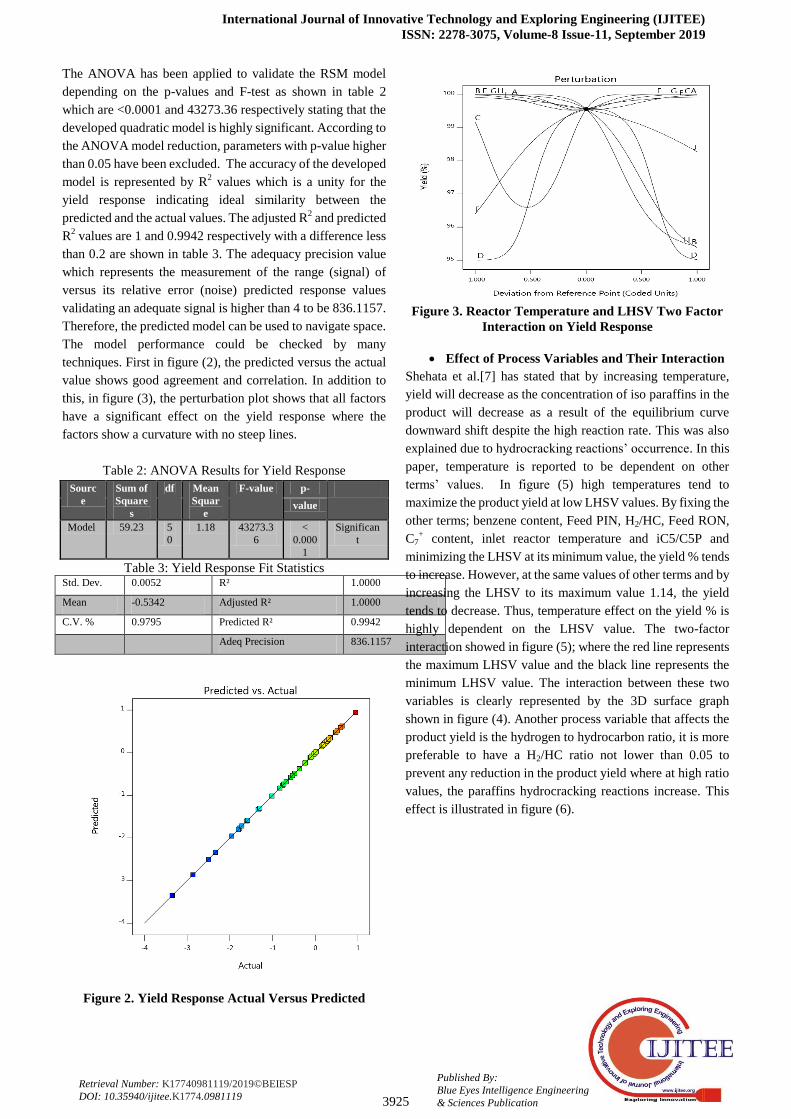
The ANOVA has been applied to validate the RSM model
depending on the p-values and F-test as shown in table 2
which are <0.0001 and 43273.36 respectively stating that the
developed quadratic model is highly significant. According to
the ANOVA model reduction, parameters with p-value higher
than 0.05 have been excluded. The accuracy of the developed
model is represented by R2 values which is a unity for the
yield response indicating ideal similarity between the
predicted and the actual values. The adjusted R2 and predicted
R2 values are 1 and 0.9942 respectively with a difference less
than 0.2 are shown in table 3. The adequacy precision value
which represents the measurement of the range (signal) of
versus its relative error (noise) predicted response values
validating an adequate signal is higher than 4 to be 836.1157.
Therefore, the predicted model can be used to navigate space.
The model performance could be checked by many
techniques. First in figure (2), the predicted versus the actual
value shows good agreement and correlation. In addition to
this, in figure (3), the perturbation plot shows that all factors
have a significant effect on the yield response where the
factors show a curvature with no steep lines.
Table 2: ANOVA Results for Yield Response
Sourc
e
Sum of
Square
s
df Mean
Squar
e
F-value p- value
Model 59.23 5
0
1.18 43273.3
6
<
0.000
1
Significan
t
Table 3: Yield Response Fit Statistics Std. Dev. 0.0052 R² 1.0000
Mean -0.5342 Adjusted R² 1.0000
C.V. % 0.9795 Predicted R² 0.9942
Adeq Precision 836.1157
Figure 2. Yield Response Actual Versus Predicted
Figure 3. Reactor Temperature and LHSV Two Factor
Interaction on Yield Response
Effect of Process Variables and Their Interaction
Shehata et al.[7] has stated that by increasing temperature,
yield will decrease as the concentration of iso paraffins in the
product will decrease as a result of the equilibrium curve
downward shift despite the high reaction rate. This was also
explained due to hydrocracking reactions’ occurrence. In this
paper, temperature is reported to be dependent on other
terms’ values. In figure (5) high temperatures tend to
maximize the product yield at low LHSV values. By fixing the
other terms; benzene content, Feed PIN, H2/HC, Feed RON,
C7+ content, inlet reactor temperature and iC5/C5P and
minimizing the LHSV at its minimum value, the yield % tends
to increase. However, at the same values of other terms and by
increasing the LHSV to its maximum value 1.14, the yield
tends to decrease. Thus, temperature effect on the yield % is
highly dependent on the LHSV value. The two-factor
interaction showed in figure (5); where the red line represents
the maximum LHSV value and the black line represents the
minimum LHSV value. The interaction between these two
variables is clearly represented by the 3D surface graph
shown in figure (4). Another process variable that affects the
product yield is the hydrogen to hydrocarbon ratio, it is more
preferable to have a H2/HC ratio not lower than 0.05 to
prevent any reduction in the product yield where at high ratio
values, the paraffins hydrocracking reactions increase. This
effect is illustrated in figure (6).

A multi-response optimization for isomerization of light naphtha
3926
Published By:
Blue Eyes Intelligence Engineering
& Sciences Publication
Retrieval Number: K17740981119/2019©BEIESP
DOI: 10.35940/ijitee.K1774.0981119
Figure 4. Yield Response Perturbation Curve
Figure 5. Temperature Effect on Yield at Low and high
LHSV Values
Figure 6: Effect of H2/HC Ratio on the Product Yield
Response
B. PIN Response
The quadratic equation is represented as follows:
Logit (Product PIN) = Ln[(Product PIN - 112.00)/(122.00 -
Product PIN)] = -442.53140 +63.11522 A -1.63394 B
-1299.55334 C + 0.368789 D -7745.58475 E + 91.92662 F -
49.01562 G -1.05509 H - 78.24086 J - 0.373512 AB +
67.54897 AC -0.815661 AD +215.49168 AE -1.42187 AF +
1.25347 AG - 0.401225 AH + 2.16666 AJ +18.06828 BC -
0.428957 BD +53.80705 BE +0.465028 BF + 0.971135
BG - 0.034295 BH + 0.406007 BJ+19.60201
CD-1305.07112 CE -10.22137 CF - 15.75189 CG + 2.32047
CH -28.40578 CJ -13.67716 DE +1.03883 DF -0.177573 DG
-0.124835 DH -0.179163 DJ -14.76996 EG +7.01112 EH
+2.23262 EJ -1.52861 FG + 0.213441 FJ + 0.969278 GJ +
0.253900 HJ + 0.699986 A² - 0.151490 B²-430.40073 C²
-0.040655 D² +1079.40873 E² -1.45663 F²
-1.12963 G²
Similarly, the ANOVA has been applied to validate the RSM
model depending on the p-values and F-test as shown in table
4 which are <0.0001 and 38538.87 respectively stating that
the developed quadratic model is highly significant.
According to the ANOVA model reduction, parameters with
p-value higher than 0.05 have been excluded. The accuracy
of the developed model is represented by R2 values which is a
unity for the PIN response indicating ideal similarity between
the predicted and the actual values. The adjusted R2 and
predicted R2 values are 1 and 0.9973 respectively with a
difference less than 0.2 are shown in table 5. The adequacy
precision value which represents the measurement of the
range (signal) of versus its relative error (noise) predicted
response values validating an adequate signal is higher than 4
to be 1406.9103. Therefore, the predicted model can be used
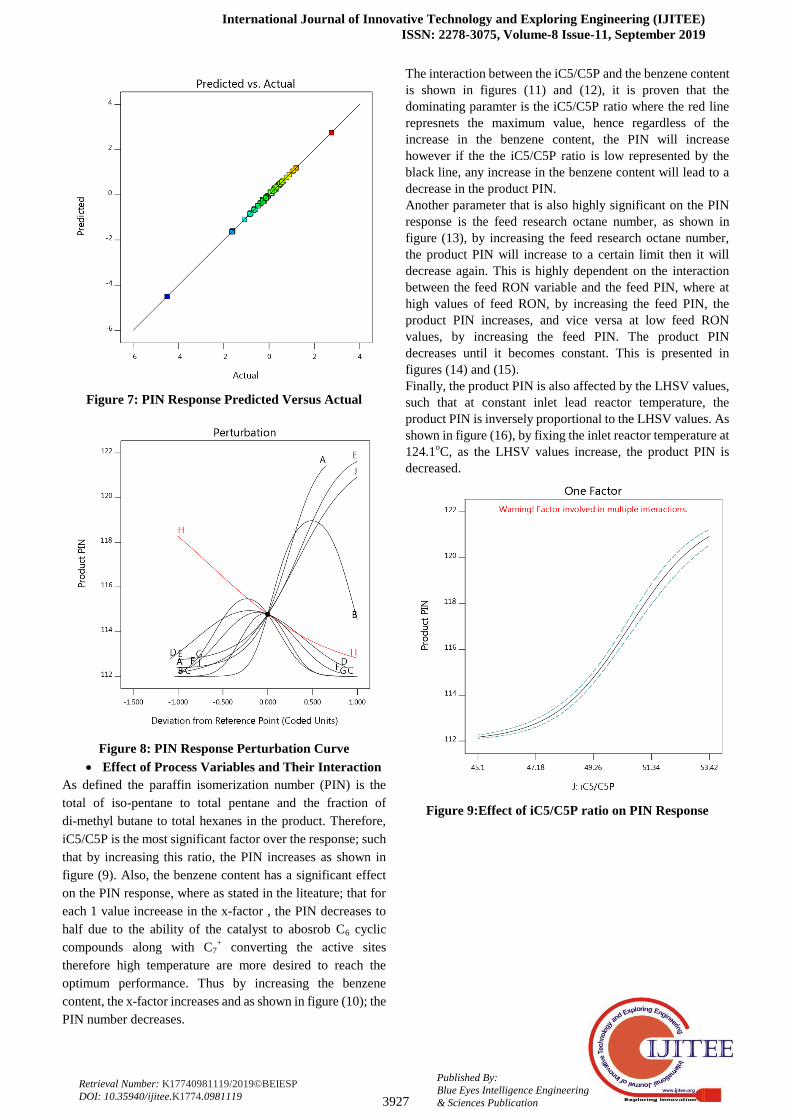
to navigate space. The PIN developed model has been
validated by the following graphs; in figure (7), the predicted
versus actual values graph has given a precise agreement, , in
figure (8), the perturbation plot showed a curvature trend for
all the process variables indicating their high sensitivity over
the response except for the inlet reactor temperature (H)
which is almost a steep line.
Table 4: ANOVA Results for PIN Response
Table 5: Fit Statistic for PIN Response Std. Dev. 0.0053 R² 1.0000
Mean -0.0541 Adjusted R² 1.0000
C.V. % 9.81 Predicted R² 0.9973
Adeq Precision 1406.9103
Source Sum
of
Squar
es
df Mean
Squar
e
F-value p-value
Model 53.17 49 1.09 38548.87 <
0.0001
signific
ant
International Journal of Innovative Technology and Exploring Engineering (IJITEE)
ISSN: 2278-3075, Volume-8 Issue-11, September 2019
3927
Published By:
Blue Eyes Intelligence Engineering
& Sciences Publication
Retrieval Number: K17740981119/2019©BEIESP
DOI: 10.35940/ijitee.K1774.0981119
Figure 7: PIN Response Predicted Versus Actual
Figure 8: PIN Response Perturbation Curve
Effect of Process Variables and Their Interaction
As defined the paraffin isomerization number (PIN) is the
total of iso-pentane to total pentane and the fraction of
di-methyl butane to total hexanes in the product. Therefore,
iC5/C5P is the most significant factor over the response; such
that by increasing this ratio, the PIN increases as shown in
figure (9). Also, the benzene content has a significant effect
on the PIN response, where as stated in the liteature; that for
each 1 value increease in the x-factor , the PIN decreases to
half due to the ability of the catalyst to abosrob C6 cyclic
compounds along with C7+ converting the active sites
therefore high temperature are more desired to reach the
optimum performance. Thus by increasing the benzene
content, the x-factor increases and as shown in figure (10); the
PIN number decreases.
The interaction between the iC5/C5P and the benzene content
is shown in figures (11) and (12), it is proven that the
dominating paramter is the iC5/C5P ratio where the red line
represnets the maximum value, hence regardless of the
increase in the benzene content, the PIN will increase
however if the the iC5/C5P ratio is low represented by the
black line, any increase in the benzene content will lead to a
decrease in the product PIN.
Another parameter that is also highly significant on the PIN
response is the feed research octane number, as shown in
figure (13), by increasing the feed research octane number,
the product PIN will increase to a certain limit then it will
decrease again. This is highly dependent on the interaction
between the feed RON variable and the feed PIN, where at
high values of feed RON, by increasing the feed PIN, the
product PIN increases, and vice versa at low feed RON
values, by increasing the feed PIN. The product PIN
decreases until it becomes constant. This is presented in
figures (14) and (15).
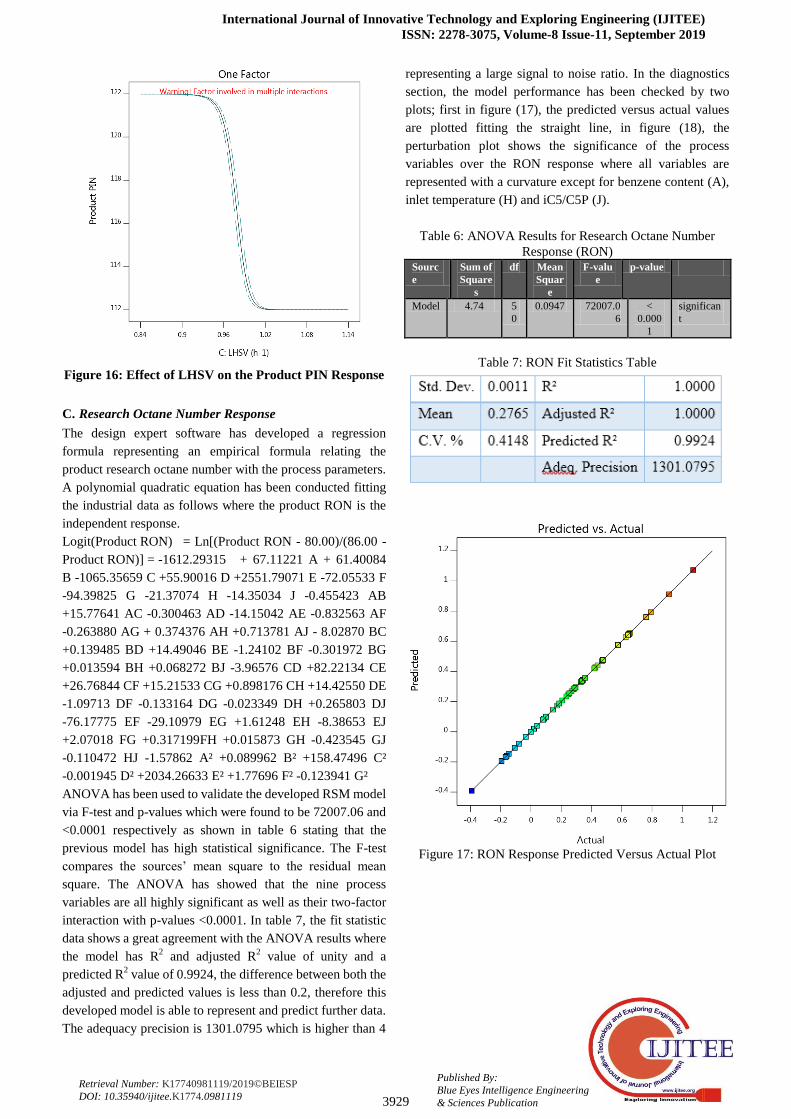
Finally, the product PIN is also affected by the LHSV values,
such that at constant inlet lead reactor temperature, the
product PIN is inversely proportional to the LHSV values. As
shown in figure (16), by fixing the inlet reactor temperature at
124.1oC, as the LHSV values increase, the product PIN is
decreased.
Figure 9:Effect of iC5/C5P ratio on PIN Response

A multi-response optimization for isomerization of light naphtha
3928
Published By:
Blue Eyes Intelligence Engineering
& Sciences Publication
Retrieval Number: K17740981119/2019©BEIESP
DOI: 10.35940/ijitee.K1774.0981119
Figure 10: Effect of Benzene Content on PIN Response
Figure 11: The Interaction Effect Between iC5/C5P and
Benzene Content on the Product PIN Response
Figure 12: 3D Interaction Effect of Benzene Content and
iC5/C5P on the Product PIN
Figure 13: Feed RON Effect on the Product PIN
Response
Figure 14: Feed RON and Feed PIN Interaction on PIN
Response
Figure 15: 3D Surface Interaction between Feed RON
and Feed PIN on Product PIN Response
International Journal of Innovative Technology and Exploring Engineering (IJITEE)
ISSN: 2278-3075, Volume-8 Issue-11, September 2019
3929
Published By:
Blue Eyes Intelligence Engineering
& Sciences Publication
Retrieval Number: K17740981119/2019©BEIESP
DOI: 10.35940/ijitee.K1774.0981119
Figure 16: Effect of LHSV on the Product PIN Response
C. Research Octane Number Response
The design expert software has developed a regression
formula representing an empirical formula relating the
product research octane number with the process parameters.
A polynomial quadratic equation has been conducted fitting
the industrial data as follows where the product RON is the
independent response.
Logit(Product RON) = Ln[(Product RON - 80.00)/(86.00 -
Product RON)] = -1612.29315 + 67.11221 A + 61.40084
B -1065.35659 C +55.90016 D +2551.79071 E -72.05533 F
-94.39825 G -21.37074 H -14.35034 J -0.455423 AB
+15.77641 AC -0.300463 AD -14.15042 AE -0.832563 AF
-0.263880 AG + 0.374376 AH +0.713781 AJ - 8.02870 BC
+0.139485 BD +14.49046 BE -1.24102 BF -0.301972 BG
+0.013594 BH +0.068272 BJ -3.96576 CD +82.22134 CE
+26.76844 CF +15.21533 CG +0.898176 CH +14.42550 DE
-1.09713 DF -0.133164 DG -0.023349 DH +0.265803 DJ
-76.17775 EF -29.10979 EG +1.61248 EH -8.38653 EJ
+2.07018 FG +0.317199FH +0.015873 GH -0.423545 GJ
-0.110472 HJ -1.57862 A² +0.089962 B² +158.47496 C²
-0.001945 D² +2034.26633 E² +1.77696 F² -0.123941 G²
ANOVA has been used to validate the developed RSM model
via F-test and p-values which were found to be 72007.06 and
<0.0001 respectively as shown in table 6 stating that the
previous model has high statistical significance. The F-test
compares the sources’ mean square to the residual mean
square. The ANOVA has showed that the nine process
variables are all highly significant as well as their two-factor
interaction with p-values <0.0001. In table 7, the fit statistic
data shows a great agreement with the ANOVA results where
the model has R2 and adjusted R
2 value of unity and a
predicted R2 value of 0.9924, the difference between both the
adjusted and predicted values is less than 0.2, therefore this
developed model is able to represent and predict further data.
The adequacy precision is 1301.0795 which is higher than 4
representing a large signal to noise ratio. In the diagnostics
section, the model performance has been checked by two
plots; first in figure (17), the predicted versus actual values
are plotted fitting the straight line, in figure (18), the
perturbation plot shows the significance of the process
variables over the RON response where all variables are
represented with a curvature except for benzene content (A),
inlet temperature (H) and iC5/C5P (J).
Table 6: ANOVA Results for Research Octane Number
Response (RON) Sourc
e
Sum of
Square
s
df Mean
Squar
e
F-valu
e
p-value
Model 4.74 5
0
0.0947 72007.0
6
<
0.000
1
significan
t
Table 7: RON Fit Statistics Table
Figure 17: RON Response Predicted Versus Actual Plot

A multi-response optimization for isomerization of light naphtha
3930
Published By:
Blue Eyes Intelligence Engineering
& Sciences Publication
Retrieval Number: K17740981119/2019©BEIESP
DOI: 10.35940/ijitee.K1774.0981119
Figure 18: Product RON Perturbation Plot
Effect of Process Variables and Their Interaction
The RON produced from this Penex isomerization unit ranges
from 82.42 to 84.47. First the benzene content in the naphtha
feed. As shown in figure (19), as the benzene content in the
feed increases, the product RON undergoes a significant
decline. This can be explained due to higher possibility of
benzene saturation reactions which is highly exothermic
favored at low temperature values, therefore the benzene
content must not exceed certain limit which is about 5%. This
issue can be adjusted by controlling the reactor temperature,
thus by increasing the benzene content the reactor
temperature should be decreased for optimum results and
higher product RON. In figure (20), the interaction effect
between the product RON and the reactor temperature is
represented, where the red line represents the maximum value
for reactor temperature and the black line represents the
minimum value, at high reactor temperature (157oC), by
increasing the benzene content, the octane number increases
until certain limit where more benzene saturation reactions
occur and hence the product RON undergoes a rapid
decrease. While at low reactor temperature (143oC), by
increasing the benzene content in the feed, the product RON
is not affected, and it continues to reach the desired values.
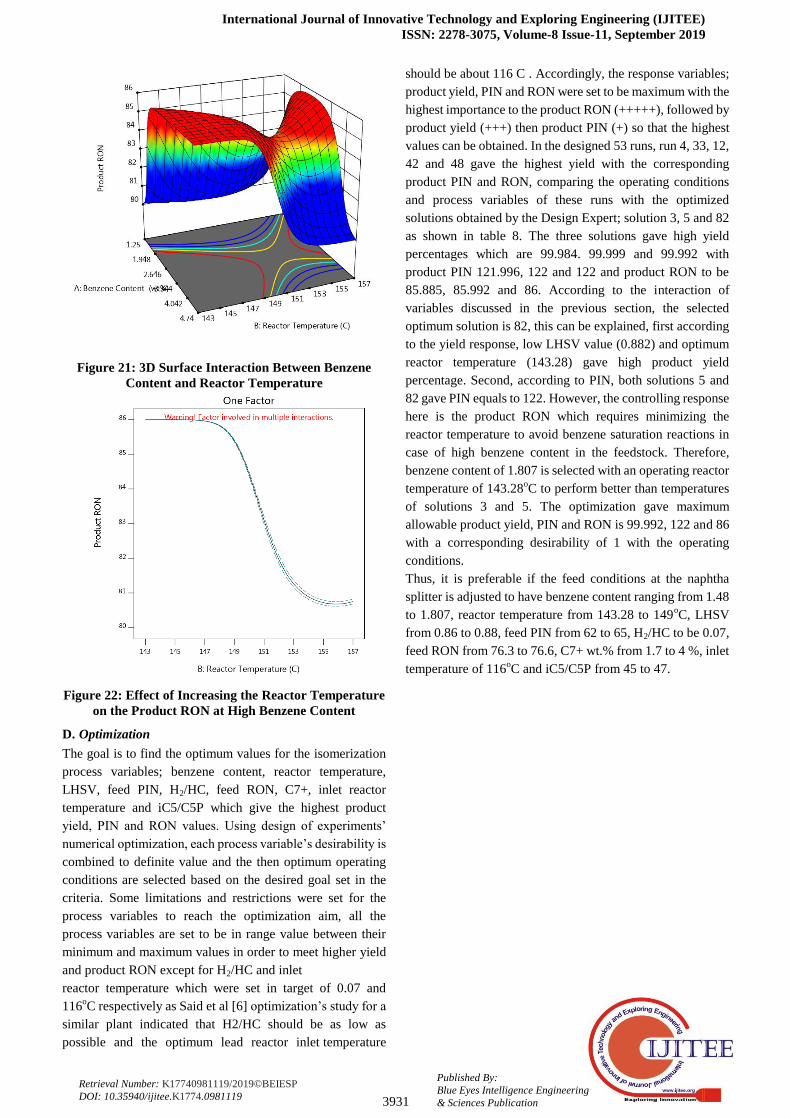
The same effect is represented by the 3D surface interaction
shown in figure (21). Validating these results, the effect of
reactor temperature on the product research octane number
RON has been tested, where it shows an agreement with the
previously stated results. As shown in figure (22), at high
benzene content values, by increasing the reactor temperature
the product RON decreases.
Figure 19: Effect of Benzene Content on Product Research
Octane Number RON
Figure 20: Interaction between benzene content and reactor
temperature effect on RON response
International Journal of Innovative Technology and Exploring Engineering (IJITEE)
ISSN: 2278-3075, Volume-8 Issue-11, September 2019
3931
Published By:
Blue Eyes Intelligence Engineering
& Sciences Publication
Retrieval Number: K17740981119/2019©BEIESP
DOI: 10.35940/ijitee.K1774.0981119
Figure 21: 3D Surface Interaction Between Benzene
Content and Reactor Temperature
Figure 22: Effect of Increasing the Reactor Temperature
on the Product RON at High Benzene Content
D. Optimization
The goal is to find the optimum values for the isomerization
process variables; benzene content, reactor temperature,
LHSV, feed PIN, H2/HC, feed RON, C7+, inlet reactor
temperature and iC5/C5P which give the highest product
yield, PIN and RON values. Using design of experiments’
numerical optimization, each process variable’s desirability is
combined to definite value and the then optimum operating
conditions are selected based on the desired goal set in the
criteria. Some limitations and restrictions were set for the
process variables to reach the optimization aim, all the
process variables are set to be in range value between their
minimum and maximum values in order to meet higher yield
and product RON except for H2/HC and inlet
reactor temperature which were set in target of 0.07 and
116oC respectively as Said et al [6] optimization’s study for a
similar plant indicated that H2/HC should be as low as
possible and the optimum lead reactor inlet temperature
should be about 116 C . Accordingly, the response variables;
product yield, PIN and RON were set to be maximum with the
highest importance to the product RON (+++++), followed by
product yield (+++) then product PIN (+) so that the highest
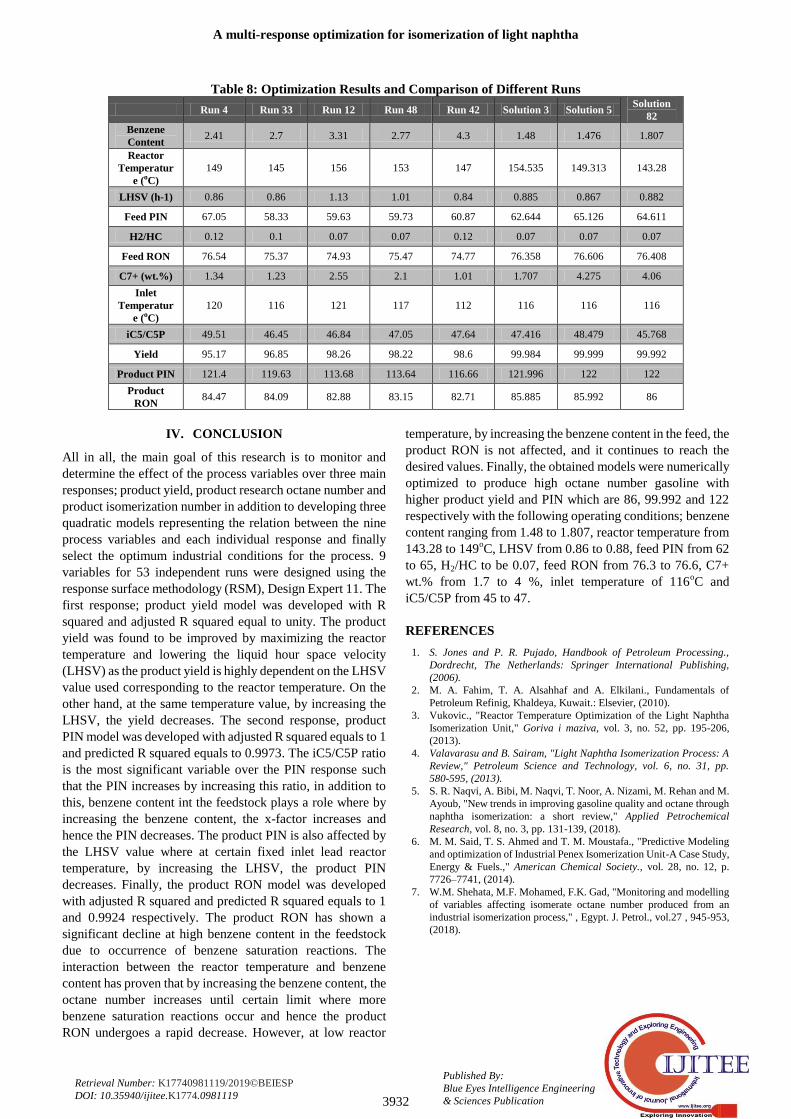
values can be obtained. In the designed 53 runs, run 4, 33, 12,
42 and 48 gave the highest yield with the corresponding
product PIN and RON, comparing the operating conditions
and process variables of these runs with the optimized
solutions obtained by the Design Expert; solution 3, 5 and 82
as shown in table 8. The three solutions gave high yield
percentages which are 99.984. 99.999 and 99.992 with
product PIN 121.996, 122 and 122 and product RON to be
85.885, 85.992 and 86. According to the interaction of
variables discussed in the previous section, the selected
optimum solution is 82, this can be explained, first according
to the yield response, low LHSV value (0.882) and optimum
reactor temperature (143.28) gave high product yield
percentage. Second, according to PIN, both solutions 5 and
82 gave PIN equals to 122. However, the controlling response
here is the product RON which requires minimizing the
reactor temperature to avoid benzene saturation reactions in
case of high benzene content in the feedstock. Therefore,
benzene content of 1.807 is selected with an operating reactor
temperature of 143.28oC to perform better than temperatures
of solutions 3 and 5. The optimization gave maximum
allowable product yield, PIN and RON is 99.992, 122 and 86
with a corresponding desirability of 1 with the operating
conditions.
Thus, it is preferable if the feed conditions at the naphtha
splitter is adjusted to have benzene content ranging from 1.48
to 1.807, reactor temperature from 143.28 to 149oC, LHSV
from 0.86 to 0.88, feed PIN from 62 to 65, H2/HC to be 0.07,
feed RON from 76.3 to 76.6, C7+ wt.% from 1.7 to 4 %, inlet
temperature of 116oC and iC5/C5P from 45 to 47.
A multi-response optimization for isomerization of light naphtha
3932
Published By:
Blue Eyes Intelligence Engineering
& Sciences Publication
Retrieval Number: K17740981119/2019©BEIESP
DOI: 10.35940/ijitee.K1774.0981119
Table 8: Optimization Results and Comparison of Different Runs
Run 4 Run 33 Run 12 Run 48 Run 42 Solution 3 Solution 5 Solution
82
Benzene
Content 2.41 2.7 3.31 2.77 4.3 1.48 1.476 1.807
Reactor
Temperatur
e (oC)
149 145 156 153 147 154.535 149.313 143.28
LHSV (h-1) 0.86 0.86 1.13 1.01 0.84 0.885 0.867 0.882
Feed PIN 67.05 58.33 59.63 59.73 60.87 62.644 65.126 64.611
H2/HC 0.12 0.1 0.07 0.07 0.12 0.07 0.07 0.07
Feed RON 76.54 75.37 74.93 75.47 74.77 76.358 76.606 76.408
C7+ (wt.%) 1.34 1.23 2.55 2.1 1.01 1.707 4.275 4.06
Inlet
Temperatur
e (oC)
120 116 121 117 112 116 116 116
iC5/C5P 49.51 46.45 46.84 47.05 47.64 47.416 48.479 45.768
Yield 95.17 96.85 98.26 98.22 98.6 99.984 99.999 99.992
Product PIN 121.4 119.63 113.68 113.64 116.66 121.996 122 122
Product
RON 84.47 84.09 82.88 83.15 82.71 85.885 85.992 86
IV. CONCLUSION
All in all, the main goal of this research is to monitor and
determine the effect of the process variables over three main
responses; product yield, product research octane number and
product isomerization number in addition to developing three
quadratic models representing the relation between the nine
process variables and each individual response and finally
select the optimum industrial conditions for the process. 9
variables for 53 independent runs were designed using the
response surface methodology (RSM), Design Expert 11. The
first response; product yield model was developed with R
squared and adjusted R squared equal to unity. The product
yield was found to be improved by maximizing the reactor
temperature and lowering the liquid hour space velocity
(LHSV) as the product yield is highly dependent on the LHSV
value used corresponding to the reactor temperature. On the
other hand, at the same temperature value, by increasing the
LHSV, the yield decreases. The second response, product
PIN model was developed with adjusted R squared equals to 1
and predicted R squared equals to 0.9973. The iC5/C5P ratio
is the most significant variable over the PIN response such
that the PIN increases by increasing this ratio, in addition to
this, benzene content int the feedstock plays a role where by
increasing the benzene content, the x-factor increases and
hence the PIN decreases. The product PIN is also affected by
the LHSV value where at certain fixed inlet lead reactor
temperature, by increasing the LHSV, the product PIN
decreases. Finally, the product RON model was developed
with adjusted R squared and predicted R squared equals to 1
and 0.9924 respectively. The product RON has shown a
significant decline at high benzene content in the feedstock
due to occurrence of benzene saturation reactions. The
interaction between the reactor temperature and benzene
content has proven that by increasing the benzene content, the
octane number increases until certain limit where more
benzene saturation reactions occur and hence the product
RON undergoes a rapid decrease. However, at low reactor
temperature, by increasing the benzene content in the feed, the
product RON is not affected, and it continues to reach the
desired values. Finally, the obtained models were numerically
optimized to produce high octane number gasoline with
higher product yield and PIN which are 86, 99.992 and 122
respectively with the following operating conditions; benzene
content ranging from 1.48 to 1.807, reactor temperature from
143.28 to 149oC, LHSV from 0.86 to 0.88, feed PIN from 62
to 65, H2/HC to be 0.07, feed RON from 76.3 to 76.6, C7+
wt.% from 1.7 to 4 %, inlet temperature of 116oC and
iC5/C5P from 45 to 47.
REFERENCES
1. S. Jones and P. R. Pujado, Handbook of Petroleum Processing.,
Dordrecht, The Netherlands: Springer International Publishing,
(2006). 2. M. A. Fahim, T. A. Alsahhaf and A. Elkilani., Fundamentals of
Petroleum Refinig, Khaldeya, Kuwait.: Elsevier, (2010). 3. Vukovic., "Reactor Temperature Optimization of the Light Naphtha
Isomerization Unit," Goriva i maziva, vol. 3, no. 52, pp. 195-206,
(2013). 4. Valavarasu and B. Sairam, "Light Naphtha Isomerization Process: A
Review," Petroleum Science and Technology, vol. 6, no. 31, pp.
580-595, (2013). 5. S. R. Naqvi, A. Bibi, M. Naqvi, T. Noor, A. Nizami, M. Rehan and M.
Ayoub, "New trends in improving gasoline quality and octane through
naphtha isomerization: a short review," Applied Petrochemical
Research, vol. 8, no. 3, pp. 131-139, (2018). 6. M. M. Said, T. S. Ahmed and T. M. Moustafa., "Predictive Modeling
and optimization of Industrial Penex Isomerization Unit-A Case Study,
Energy & Fuels.," American Chemical Society., vol. 28, no. 12, p.
7726–7741, (2014). 7. W.M. Shehata, M.F. Mohamed, F.K. Gad, "Monitoring and modelling
of variables affecting isomerate octane number produced from an
industrial isomerization process," , Egypt. J. Petrol., vol.27 , 945-953,
(2018).
International Journal of Innovative Technology and Exploring Engineering (IJITEE)
ISSN: 2278-3075, Volume-8 Issue-11, September 2019
3933
Published By:
Blue Eyes Intelligence Engineering
& Sciences Publication
Retrieval Number: K17740981119/2019©BEIESP
DOI: 10.35940/ijitee.K1774.0981119
AUTHORS PROFILE
Donia Abdel Nasser Fathy, earned her
bachelor’s degree in chemical engineering from
the British University in Egypt.
Moustafa Aly Soliman, earned his bachelor’s
and master’s degrees in chemical engineering
from Cairo University; and his PhD in chemical
engineering from the University of Waterloo. His
pioneering research has resulted in three books,
more than 170 journal and conference papers, and
five patents.


![Dynamics Response Reconstruction - MathWorks · Dynamic Response Reconstruction Chinmay Pawaskar ... [Optimization] Topology, topography, shape and size optimization [Ride & Handling]](https://static.fdocuments.in/doc/165x107/5fe306eab7a18e7f0c5c98d3/dynamics-response-reconstruction-mathworks-dynamic-response-reconstruction-chinmay.jpg)