A Multi-Purpose Vibration Experiment Using Labvie€¦ · · 2004-03-01A Multi-Purpose Vibration...
10
Proceedings of the 2003 American Society for Engineering Education Annual Conference & Exposition Copyright 2003, American Society for Engineering Education Session 1426 A Multi-Purpose Vibration Experiment Using Labview Nikos Kiritsis, Yi-Wei Huang, David Ayrapetyan Engineering Department McNeese State University P. O. Box 91735 Lake Charles, LA 70609 1. Abstract The response of an aluminum cantilever beam under harmonic excitation is simultaneously measured using a strain gage, a linear variable differential transformer and an accelerometer, and compared with the real time theoretical response. All data acquisition and analysis is done using a custom built Labview virtual instrument. This fundamental experiment from the vibration area is used at McNeese State University in many different ways throughout the mechanical engineering curriculum. First, it is used in the freshman level Introduction to Engineering course as an example of a typical modern engineering laboratory set up. Second, it is a very popular demonstration used in the sophomore level Strength of Materials course during the discussion of stress-strain relations and how strain measurements are used to derive information about stress. Third, it serves as an example of transducer integration in the junior level Engineering Measurements Laboratory, illustrating operational principles of three transducers and the potential of mathematically deriving the same information from different transducers. Fourth, being a common application described in almost every mechanical vibrations textbook, it serves as a very effective demonstration in the Mechanical Vibrations senior level course emphasizing vibration measurement devices and the agreement between theory and experiment. Finally, it is a moderate difficulty example used in the senior level Virtual Instrumentation course that involves data acquisition, data processing and analysis as well as an elaborate human-machine-interface. Even though students encounter the same experiment in many different courses, each presentation of this experiment satisfies different learning objectives, complements and expands the previous presentation and illustrates the open-ended aspect of quality engineering education. 2. Introduction The Engineering Department at McNeese State University offers an ABET accredited Bachelor of Science in Engineering degree with concentrations in four major disciplines: Chemical, Civil, Electrical and Mechanical Engineering. The Department excels in undergraduate engineering education and is committed to preparing students for careers in both industry and graduate
Transcript of A Multi-Purpose Vibration Experiment Using Labvie€¦ · · 2004-03-01A Multi-Purpose Vibration...
Proceedings of the 2003 American Society for Engineering Education Annual Conference & Exposition Copyright 2003, American Society for Engineering Education
Session 1426
A Multi-Purpose Vibration Experiment Using Labview
Nikos Kiritsis, Yi-Wei Huang, David Ayrapetyan
Engineering Department McNeese State University
P. O. Box 91735 Lake Charles, LA 70609
1. Abstract The response of an aluminum cantilever beam under harmonic excitation is simultaneously measured using a strain gage, a linear variable differential transformer and an accelerometer, and compared with the real time theoretical response. All data acquisition and analysis is done using a custom built Labview virtual instrument. This fundamental experiment from the vibration area is used at McNeese State University in many different ways throughout the mechanical engineering curriculum. First, it is used in the freshman level Introduction to Engineering course as an example of a typical modern engineering laboratory set up. Second, it is a very popular demonstration used in the sophomore level Strength of Materials course during the discussion of stress-strain relations and how strain measurements are used to derive information about stress. Third, it serves as an example of transducer integration in the junior level Engineering Measurements Laboratory, illustrating operational principles of three transducers and the potential of mathematically deriving the same information from different transducers. Fourth, being a common application described in almost every mechanical vibrations textbook, it serves as a very effective demonstration in the Mechanical Vibrations senior level course emphasizing vibration measurement devices and the agreement between theory and experiment. Finally, it is a moderate difficulty example used in the senior level Virtual Instrumentation course that involves data acquisition, data processing and analysis as well as an elaborate human-machine-interface. Even though students encounter the same experiment in many different courses, each presentation of this experiment satisfies different learning objectives, complements and expands the previous presentation and illustrates the open-ended aspect of quality engineering education.
2. Introduction The Engineering Department at McNeese State University offers an ABET accredited Bachelor of Science in Engineering degree with concentrations in four major disciplines: Chemical, Civil, Electrical and Mechanical Engineering. The Department excels in undergraduate engineering education and is committed to preparing students for careers in both industry and graduate
Proceedings of the 2003 American Society for Engineering Education Annual Conference & Exposition Copyright 2003, American Society for Engineering Education
school. McNeese’s commitment to undergraduate engineering education is shown by: a) limiting enrollment in engineering courses to 25 students, b) limiting enrollment in senior design courses to 10 students, c) exclusively assigning professional faculty to teach engineering courses and laboratories (no graduate students) and d) constantly upgrading the courses to incorporate new technologies. This paper describes one of our attempts to incorporate state-of-the-art technology and instrumentation in a number of undergraduate mechanical engineering courses. Cantilever beams under harmonic excitation are traditionally used in undergraduate mechanical engineering textbooks as applications of harmonically excited, damped, one-degree-of-freedom systems [3,5,7]. Because of its simplicity, vibrating cantilever beams are also commonly used as engineering laboratory experiments. The literature is full of such citations. As examples of courses that often use some type of a vibrating beam, we can mention: instrumentation [1], experimentation and measurement [2], mechanical systems [6], as well as multidisciplinary courses [4]. The experiment presented here was first used in the Engineering Measurements Laboratory. Quickly, it became a very popular experiment among students. This prompted us to investigate ways to expose additional students to the instrumentation involved. The resulted uses of this experiment are presented in this paper.
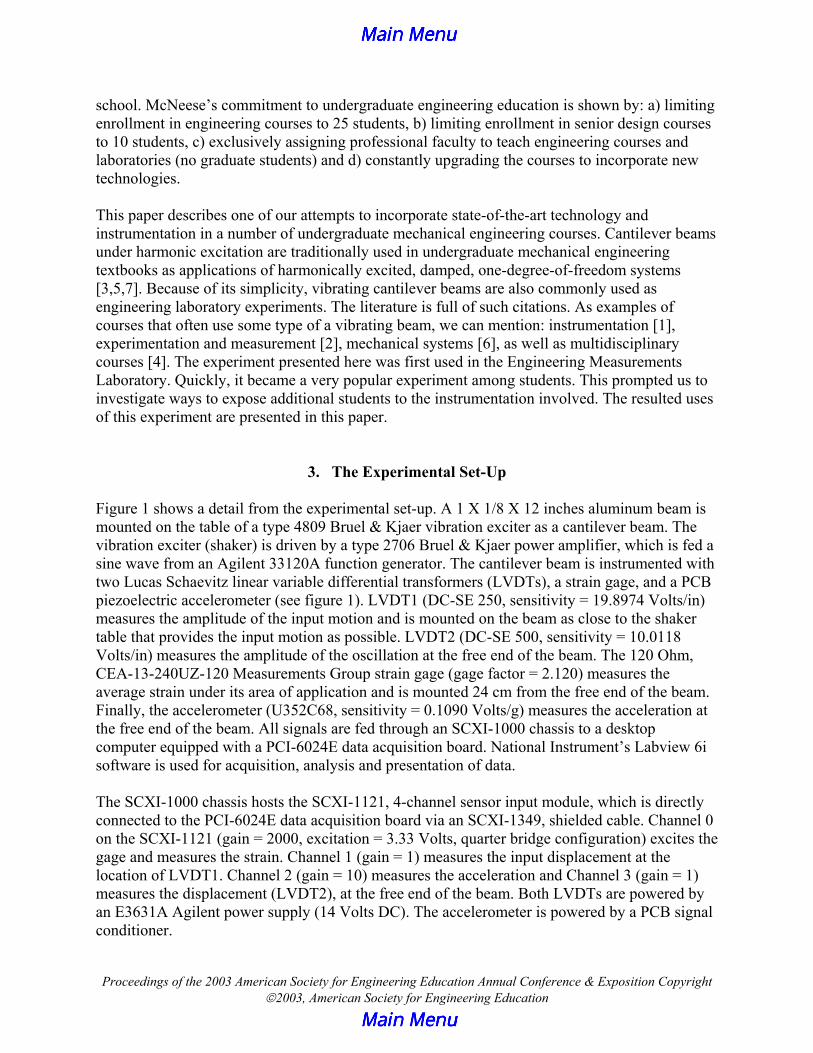
3. The Experimental Set-Up Figure 1 shows a detail from the experimental set-up. A 1 X 1/8 X 12 inches aluminum beam is mounted on the table of a type 4809 Bruel & Kjaer vibration exciter as a cantilever beam. The vibration exciter (shaker) is driven by a type 2706 Bruel & Kjaer power amplifier, which is fed a sine wave from an Agilent 33120A function generator. The cantilever beam is instrumented with two Lucas Schaevitz linear variable differential transformers (LVDTs), a strain gage, and a PCB piezoelectric accelerometer (see figure 1). LVDT1 (DC-SE 250, sensitivity = 19.8974 Volts/in) measures the amplitude of the input motion and is mounted on the beam as close to the shaker table that provides the input motion as possible. LVDT2 (DC-SE 500, sensitivity = 10.0118 Volts/in) measures the amplitude of the oscillation at the free end of the beam. The 120 Ohm, CEA-13-240UZ-120 Measurements Group strain gage (gage factor = 2.120) measures the average strain under its area of application and is mounted 24 cm from the free end of the beam. Finally, the accelerometer (U352C68, sensitivity = 0.1090 Volts/g) measures the acceleration at the free end of the beam. All signals are fed through an SCXI-1000 chassis to a desktop computer equipped with a PCI-6024E data acquisition board. National Instrument’s Labview 6i software is used for acquisition, analysis and presentation of data. The SCXI-1000 chassis hosts the SCXI-1121, 4-channel sensor input module, which is directly connected to the PCI-6024E data acquisition board via an SCXI-1349, shielded cable. Channel 0 on the SCXI-1121 (gain = 2000, excitation = 3.33 Volts, quarter bridge configuration) excites the gage and measures the strain. Channel 1 (gain = 1) measures the input displacement at the location of LVDT1. Channel 2 (gain = 10) measures the acceleration and Channel 3 (gain = 1) measures the displacement (LVDT2), at the free end of the beam. Both LVDTs are powered by an E3631A Agilent power supply (14 Volts DC). The accelerometer is powered by a PCB signal conditioner.
Proceedings of the 2003 American Society for Engineering Education Annual Conference & Exposition Copyright 2003, American Society for Engineering Education
Figure 1. A detail from the experimental set-up.
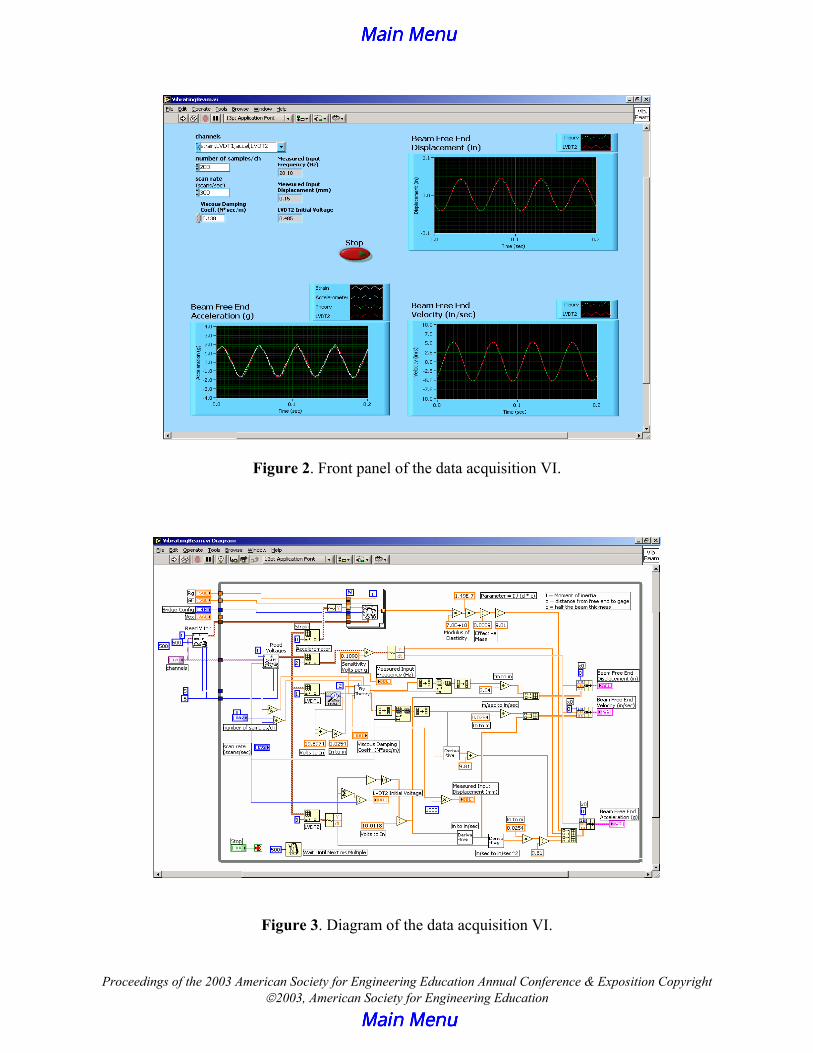
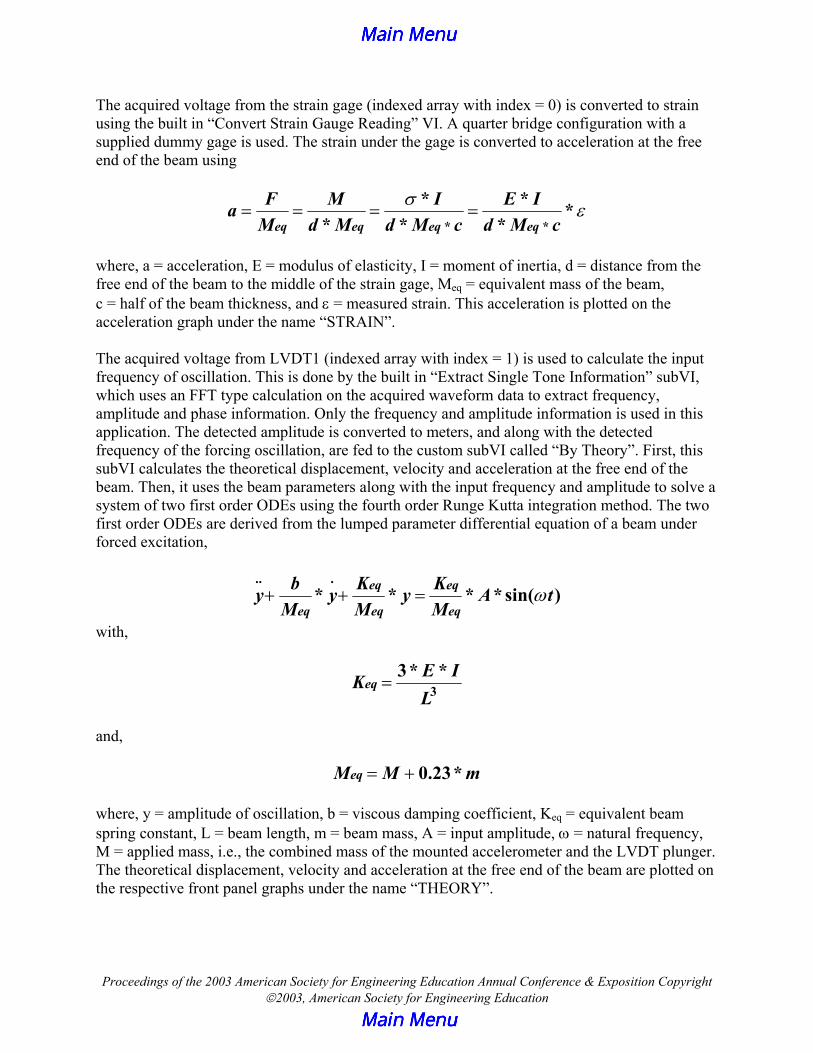
4. Data Acquisition and Analysis The virtual instrument called “VibratingBeam” shown in figure 2 is used to acquire and process all data. It reads 200 samples at each of the four virtual channels (strain, LVDT1, accel, and LVDT2) at a rate of 300 samples per second. The beam’s free end displacement (in inches), velocity (in inches per second) and acceleration (in inches per second squared) are displayed on three graphs as a function of time. The top right graph shows the theoretical (using LVDT1) and measured (using LVDT2) free end displacements. The bottom right graph shows the theoretical and measured beam free end velocities. Finally, the bottom left graph shows the theoretical and measured (using the strain gage, LVDT2 and accelerometer) beam free end acceleration. Figure 3 shows the diagram of the VibratingBeam VI. The built in “AI Acquire Waveforms” VI is used to acquire all data from the specified channels by sampling the channels at the specified rate. The acquired data is written in a four column array with column 0 = strain, column 1 = LVDT1, column 2 = acceleration, and column 3 = LVDT2.
Proceedings of the 2003 American Society for Engineering Education Annual Conference & Exposition Copyright 2003, American Society for Engineering Education
Figure 2. Front panel of the data acquisition VI.
Figure 3. Diagram of the data acquisition VI.
Proceedings of the 2003 American Society for Engineering Education Annual Conference & Exposition Copyright 2003, American Society for Engineering Education
The acquired voltage from the strain gage (indexed array with index = 0) is converted to strain using the built in “Convert Strain Gauge Reading” VI. A quarter bridge configuration with a supplied dummy gage is used. The strain under the gage is converted to acceleration at the free end of the beam using
* *
* * ** * *eq eq eq eq
F M I E IaM d M d M c d M c
σ ε= = = =
where, a = acceleration, E = modulus of elasticity, I = moment of inertia, d = distance from the free end of the beam to the middle of the strain gage, Meq = equivalent mass of the beam, c = half of the beam thickness, and ε = measured strain. This acceleration is plotted on the acceleration graph under the name “STRAIN”. The acquired voltage from LVDT1 (indexed array with index = 1) is used to calculate the input frequency of oscillation. This is done by the built in “Extract Single Tone Information” subVI, which uses an FFT type calculation on the acquired waveform data to extract frequency, amplitude and phase information. Only the frequency and amplitude information is used in this application. The detected amplitude is converted to meters, and along with the detected frequency of the forcing oscillation, are fed to the custom subVI called “By Theory”. First, this subVI calculates the theoretical displacement, velocity and acceleration at the free end of the beam. Then, it uses the beam parameters along with the input frequency and amplitude to solve a system of two first order ODEs using the fourth order Runge Kutta integration method. The two first order ODEs are derived from the lumped parameter differential equation of a beam under forced excitation,
.. .* * * * sin( )eq eq
eq eq eq
b K Ky y y A tM M M
ω+ + =
with,
33* *
eqE IKL
=
and,
0.23*eqM M m= + where, y = amplitude of oscillation, b = viscous damping coefficient, Keq = equivalent beam spring constant, L = beam length, m = beam mass, A = input amplitude, ω = natural frequency, M = applied mass, i.e., the combined mass of the mounted accelerometer and the LVDT plunger. The theoretical displacement, velocity and acceleration at the free end of the beam are plotted on the respective front panel graphs under the name “THEORY”.
Proceedings of the 2003 American Society for Engineering Education Annual Conference & Exposition Copyright 2003, American Society for Engineering Education
The acquired voltage from the accelerometer (indexed array with index = 2) is divided by the accelerometer sensitivity of 0.1090 volts per (g) to calculate the beam free end acceleration in (g) and displayed on the acceleration graph under the name “ACCELEROMETER”. After subtracting the initial voltage, the acquired voltage from LVDT2 (indexed array with index = 3) is converted to displacement in inches and sent to the displacement graph under the name “LVDT2”. The measured displacement is also fed to the custom built “Derivative'” subVI where is converted to velocity in inches per second. This velocity is fed to a second “Derivative” subVI and converted to acceleration, first in meters per second squared, and then in (g). The velocity and acceleration signals are displayed on the respective graphs under the name “LVDT2”. The entire data acquisition is done within an infinite loop, which can be stopped by pressing the STOP button on the front panel. All required numerical parameters are coded as Labview constants. The viscous damping coefficient (b) is calculated from separate measurements and is coded as a digital control. The free end displacement of a cantilever beam under a free vibration with an initial displacement is recorded on an oscilloscope and then (b) is calculated from the logarithmic decrement of the trace. Figure 2 shows the theoretical and experimental results in three graphs (0.2 seconds each) for the resonance case (ωn = 20.1 Hz). As can be seen from the figure, the theoretical and experimental displacement, velocity and acceleration results are almost identical. The different type dotted and solid curves can not be distinguished from each other.
5. Integration to the Curriculum This fundamental experiment from the vibration area is used at McNeese State University in many different ways throughout the mechanical engineering curriculum. The following sections describe the way this experiment interacts with several courses and the student feedback.
5.1. Pre-Freshman and Freshman Level Just like any other engineering college, McNeese State University faces many challenges in recruiting and retaining engineering students. One way to battle this situation is to expose pre-freshman and freshman engineering students to state-of-the-art instrumentation typically used by upper level students in an effort to raise their interest and curiosity about engineering. At the pre-freshman level this vibration experiment is presented during our regularly scheduled open houses and impromptu visits of prospective students. During these presentations, the operation of the system is highlighted and the fact that this is one of many modern engineering experiments designed and built exclusively for student use is conveyed. The feedback from pre-freshman students is very positive. They are generally impressed with the computer integration and its associated instrumentation and are curious about the sensors involved, how they work, what they do, etc. The vibration experiment is also presented to our freshman engineering class as part of the required ENGR 109 Engineering Science and Computing course. During the presentation of the
Proceedings of the 2003 American Society for Engineering Education Annual Conference & Exposition Copyright 2003, American Society for Engineering Education
experiment, the different engineering disciplines involved in the design of the experiment are noted and discussed. A discussion of the mathematical analysis of the acquired data being the dividing line between engineers and technicians follows. The students who have taken or are taking calculus respond more favorably to the mathematical analysis capabilities of Labview. The graphical programming environment used by Labview is a completely new environment for all students (pre-freshman and freshman level) and is received very well. Their primary question is “When am I going to use this equipment?” At this time, the classes where this experiment is used and its educational values are discussed as described in sections 5.1, 5.2 and 5.3. Overall, students get excited about the level of sophistication involved and appear anxious to take the classes where they can use this equipment along with the others found in the laboratories.
5.2. Sophomore Level At the sophomore level this experiment is used as a demonstration in the ENGR 305 Strength of Materials course. In this course the students are exposed for the first time to stress and strain relationships, the measurement of strain and beam deflection calculations. The entire apparatus is placed on a large cart and brought to the classroom where ENGR 305 is taught. Even though strain gages are discussed in the text and the students are presented with many pictures, this is the first time they see a real strain gage bonded on metal. Its principle of operation is discussed along with the circuitry needed in order to take strain and deflection data. Since only the static behavior of the beam is of interest, the VI presented here is slightly changed to record and display the strain, stress and static deflection of the beam when a load is applied at its free end without any excitation at the other end. LVDT2 is used to measure the static deflection at the free end and the gage measures the strain. LVDT1 and the accelerometer are not used. The experimental data of stress and deflection are compared with the theory studied in class. This live demonstration of engineering principles is very popular among students. They immediately notice the simplicity behind the construction of a strain gage, which, coupled with its high sensitivity to very small strains makes a lasting impression on them. The agreement between theory and experiment, is something they see for the first time in a “live” and realistic engineering system. Most of the students leave the classroom excited and curious about the rest of the transducers and equipment involved which they know will be discussed the next time they encounter this experiment.
5.3 Junior Level At the junior level, this experiment is used as part of the ENGR 318 Engineering Measurements Laboratory. In ENGR 318 students study the operational principles of several different transducer types used in engineering measurements. Strain gages are studied along with other wheatstone bridge based transducers, accelerometers along with force transducers and LVDTs are combined with RVDTs. During the course, there are individual experiments performed using each transducer type. Towards the end of the course this vibration experiment is presented as an example of transducer integration on a realistic engineering system.
Proceedings of the 2003 American Society for Engineering Education Annual Conference & Exposition Copyright 2003, American Society for Engineering Education
At this level, the same experiment that students have seen twice in the past, takes a new meaning. This is the time when they really understand how transducers convert physical quantities to electrical signals. Given the magnitude and quality of the measured signal, they see the need for signal conditioning. Although signal conditioning is not studied in this course, students are exposed to simple principles such as gain, resolution, range filtering, etc. They understand the need of all the supporting equipment such as amplifiers, power supplies, A/D converters, etc., in order to acquire quality signals using the computer. This experiment serves as a “capstone” application for the students where they use their acquired knowledge to measure acceleration using three different transducers. The advantage of Labview versus traditional portable strain indicators becomes evident when dynamic data is acquired. The agreement between theoretical and experimental data impresses all students.
5.4 Senior Level At the senior level, mechanical engineering students encounter this experiment twice. In the fall semester, it is used as a demonstration in the MEEN 414 Mechanical Vibrations course. During the study of harmonically excited vibrations of damped the derivation, manipulation, and simulation of the governing equations is discussed extensively in class. The function of the “By Theory” subVI shown in figure 3 is also coded in Matlab, which is the problem solver software, used in the course. The differences and similarities of the two software are mentioned. As part of the MEEN 414 course, students also study damped systems and the experimental determination of the viscous damping coefficient (b). As part of the demonstration, (b) is calculated in class using logarithmic decrements on an experimentally acquired trace (using an oscilloscope) of the same cantilever beam system under free oscillation with an initial displacement. Since the damping coefficient is coded as a control on the front panel, the experiment is also run with b = 0 and the results are compared to the b ≠ 0 case. During the spring semester, this experiment is used in the elective ENGR 418 Virtual Instrumentation course. Students who take this course learn how to program virtual instruments using Labview 6i and use this experiment as a working demonstration of simultaneous acquisition of multiple signals. Particular focus is given on the use of the built in “AI Acquire Waveform” subVI, the construction of the FOR LOOP, data analysis, graphing and array functions. Hardware configuration of the data acquisition equipment using National Instrument's Measurement and Automation Explorer is also discussed extensively. In their senior year, mechanical engineering students complete their interaction with this vibration experiment. They now have a completely different view and appreciation of modern engineering experimentation than when they first saw the apparatus at the freshman level. They now see the potential of mathematically modeling physical systems and the use of modern instrumentation to measure the physical quantities needed in order to verify the derived model. Students who take ENGR 418 have the benefit of learning how to program in Labview and that gives them the most complete view of the system under study.
6. Discussion
Proceedings of the 2003 American Society for Engineering Education Annual Conference & Exposition Copyright 2003, American Society for Engineering Education
Measuring the response and analyzing the motion of an aluminum cantilever beam under harmonic excitation is certainly not anything that has not been done before. Variations of this experiment are used in undergraduate engineering laboratories of several universities. Only a representative sample of its uses is presented in the bibliography. However, our approach is innovative in four aspects. First, unlike other authors [1,4,6], our approach uses three different transducers to simultaneously measure the response of the system, in this case acceleration. Dibble’s [2] set-up resembles the one presented here with some differences in the how and where the forced oscillation is applied and the data acquisition system. Second, our experiment is completely automated. In other words, with the click of a button the computer acquires all data, performs all required mathematical analysis and writes the results on the front panel. This is possible due to the versatility of the Labview software. King [4] also uses Labview to acquire data, but due to the fewer transducers used, his application is less elaborate. Third, our experimental design allows the use of the same experiment in a series of different courses throughout the mechanical engineering curriculum as presented in this paper. Each time the students interface with the vibrating beam apparatus, they are exposed to different scientific principles and learning objectives. This versatility enhances the experiment’s value. Fourth and most important, is that the acquired data allow the simultaneous solution of the governing equation that describes the theoretical model. Therefore, students are able to see and compare theoretical with experimental results in real time. Thus, this experiment serves as a very illustrative example of how theory and experiment complement each other.
7. Conclusion A vibrating cantilever beam experiment was originally developed for use in the undergraduate Engineering Measurements Laboratory at McNeese State University. However, because of the interest it generated among students, and some unique features in its design, it is also used in other undergraduate engineering courses throughout the mechanical engineering curriculum as well as at the pre-freshman level. The authors acknowledge the support of the Louisiana Board of Regents through the Traditional Enhancement Program of 2000 under grant number LEQSF 2000-01-ENH-TR-53 (Enhancement of the Engineering Measurements Laboratory).
8. Bibliography
[1] Blotter Jonathan, 2002, “ME 363 – Instrumentation”, Bringham Young University, Provo, UT. [2] Dibble Robert W., “ME 107A – Experimentation and Measurement”, University of California at Berkeley. [3] Inman Daniel J., 2001, “Engineering Vibration”, Prentice Hall, New Jersey. [4] King R., Parker T., Grover T., 1998, “Multidiscipline Engineering Laboratory I”, Colorado School of Mines, Golden, CO. [5] Kelly Graham S., 2002, “Fundamentals of Mechanical Vibrations”, McGraw Hill Inc., New York.
Proceedings of the 2003 American Society for Engineering Education Annual Conference & Exposition Copyright 2003, American Society for Engineering Education
[6] Reinkensmeyer David J., “MAE 106 Mechanical Systems Laboratory”, University of California at Irvine. [7] Rao Singiresu S., 1995, “Mechanical Vibrations”, Addison-Wesley Publishing Company Inc., New York.
9. Biographies NIKOS KIRITSIS is an assistant professor of Mechanical Engineering at McNeese State University. He holds a B.S. in Physics, B.S.E. in Engineering Physics (1987) both from Wright State University in Dayton, OH, a M.S. in Mechanical Engineering from The Ohio State University (1989) and a Ph.D. from the University of Texas at Austin (1999). During his tenure at McNeese, Dr. Kiritsis established the Engineering Measurements and Systems and Control Laboratories. YI-WEI HUANG holds a B.S. degree in Mechanical Engineering from Tatung University in Taipei, Taiwan. In December of 2002 he graduated with a Master of Engineering from McNeese State University and is currently pursuing a Ph.D. degree in Mechanical Engineering at the University of Texas at Arlington. DAVID AYRAPETYAN is a native of the former Soviet Republic of Turkmenistan. David started his education in the U.S.A . as an exchange high school student. After graduation, he enrolled at McNeese State University where he is pursuing a B.S. in Engineering with concentration in Electrical Engineering .


![Anastasios Taliotis: Un. Of Crete, CCTP Elias Kiritsis and Anastasios Taliotis Arxiv:[1111.1931]](https://static.fdocuments.in/doc/165x107/5697bfdc1a28abf838cb11db/anastasios-taliotis-un-of-crete-cctp-elias-kiritsis-and-anastasios-taliotis.jpg)

