A multi-level analysis of innovation diffusion: The …oa.upm.es/38116/1/EMRAH_KARAKAYA.pdfvery...
155
Departamento de Ingeniería de la Organización, Administración de Empresas y Estadísticas UNIVERSIDAD POLITÉCNICA DE MADRID Escuela Técnica Superior de Ingenieros Industriales A multi-level analysis of innovation diffusion: The case of solar photovoltaic systems in Germany and the disillusion of grid parity PhD Thesis Emrah Karakaya Supervisors: Antonio Hidalgo Nuchera Universidad Politécnica de Madrid, Spain Cali Nuur KTH Royal Institute of Technology, Sweden 2015
Transcript of A multi-level analysis of innovation diffusion: The …oa.upm.es/38116/1/EMRAH_KARAKAYA.pdfvery...

Departamento de Ingeniería de la Organización,
Administración de Empresas y Estadísticas
UNIVERSIDAD POLITÉCNICA DE MADRID
Escuela Técnica Superior de Ingenieros Industriales
A multi-level analysis of
innovation diffusion:
The case of solar photovoltaic systems in Germany
and
the disillusion of grid parity
PhD Thesis
Emrah Karakaya
Supervisors:
Antonio Hidalgo Nuchera
Universidad Politécnica de Madrid, Spain
Cali Nuur
KTH Royal Institute of Technology, Sweden
2015


iii
Tribunal nombrado por el Magfco. y Excmo. Sr. Rector de la Universidad Politécnica de
Madrid, el dia … de …………... de 2015.
Presidente:
Secretario:
Vocal:
Vocal:
Vocal:
Suplente:
Suplente:
Realizado el acto de lectura y defensa de la Tesis el día … de …….……. de 2015 en la
Escuela Técnica Superior de Ingenieros Industriales.
El Presidente El Secretario
Los Vocales


v
Acknowledgements
When I started my journey from Germany to Spain (and to Sweden) in 2011 September, I
knew this opportunity might turn into a great place to discover the knowledge about the
society and, consequently, myself. I knew that the degree of Doctor of Philosophy (PhD)
would not help or change me, but my day-to-day interaction with people would do so. I
have extremely enjoyed having the opportunity to learn from my peers, friends and
colleagues from all over the world, particularly those I met in Spain, Sweden and
Germany. These people have inspired me in every aspect, both academically and socially,
and have definitely influenced who I am today and how this PhD Thesis has been
developed.
First of all, I would like to thank all the people I met at Universidad Politecnica de
Madrid (UPM) during 2 and half years. I thank Antonio, my PhD supervisor, for his great
support and calm guidance during the entire process. I really enjoyed my time in UPM,
also thanks to my awesome colleagues; Marcia, Marin, Frano, Shoaib, Fadi, Sarah, Raul,
Jing, Mitra, Inez, Vicente, Gustavo and Simon. If I know something about the world of
science, politics, academics and society now, it is thanks to these great people. In addition,
I thank Ignacio Romero for his valuable feedback and help during the last year of my PhD.
I also had an amazing 1 year at KTH Royal Institute of Technology in Sweden. My PhD
supervisor, Cali, deserves special thanks. He has always supported me, believed in me and
motivated me in every way possible. Moreover, I thank Johan Hoffmann for his valuable
comments and help during the third year of my PhD. In addition, I was surrounded by
amazing people at KTH, Monia, Maxim, Jonatan, Pranpreya, Niklas, Yasmine M., Mats,
Richard, Sudipa, Nidal, Michael, Annika and Vicky, and I was amazed by the friendly and
productive atmosphere at KTH.
I would like to thank all of those who were involved in making the European Doctorate
of Industrial Management (EDIM) program possible: among others, Martina, Linda,
Felipe, Paolo, Mats, Antonio, Cali, Isabel and Kristin. During the EDIM workshops, the
feedback of Mats, Massimo and Niklas on my work have been very influential and
motivational for me. These workshops have not only improved my academic skills but
also let me get to know great people: Anna, Andres, Hakan, Guido, Isaac, Milan, Seyoum,
Keivan, Yasmine H., and Vikash. Especially, I cannot thank enough Anna, Monia and
Andres, without whom, I would never ever have enjoyed these 4 years so much.
I also express my sincere gratitude to Thomas Hartmann (Hartmann Energietechnik
GmbH) and his colleagues for giving me the opportunity to learn and to obtain the
empirical data in Germany. I especially thank all of the respondents who were
interviewed, including the directors from Solar Partner Association and the residents of
Rottenburg am Neckar. Hubert Wellhausser deserves special thanks as well. He has not
only helped me to understand the German context but also inspired me to be a calmer,
happier, more conifedent and more optimistic person. I also would like to thank Barbara

vi
Breithschopf of the Fraunhofer Institute for Systems and Innovation Research ISI in
Germany for her kind guidance through my 3 month stay in Karlsruhe.
In addition, I have enjoyed being an active member of Erasmus Mundus Student and
Alumni Association (EMA). The amazing people I have met through EMA have been
very influential for developing my interpersonal and intercultural skills. I would like to
express my sincere gratitude to, among others, Pelicano, Anna, Peter, Georgiana, Tahseen
and Leasa, for inspiring me in many personal and professional aspects.
Last but not least, I thank my amazing friends and family. Although my parents and
brother have been 3000 km away, I have enjoyed their encouragement and support all the
time during this work. Sizi çok çok çok seviyorum!
Madrid, 16.06.2015
Emrah Karakaya
vii
This research was conducted within the framework of the “European Doctorate in
Industrial Management” - EDIM - which was funded by The Education, Audiovisual and
Culture Executive Agency (EACEA) of European Commission under Erasmus Mundus
Action 1 programmes.


ix
Abstract
Will renewable energy sources supply all of the world energy needs one day? Some argue yes,
while others say no. However, in some regions of the world, the electricity production through
renewable energy sources is already at a promising stage of development at which their electricity
generation costs compete with conventional electricity sources’, i.e., grid parity. This achievement
has been underpinned by the increase of technology efficiency, reduction of production costs and,
above all, years of policy interventions of providing financial support. The diffusion of solar
photovoltaic (PV) systems in Germany is an important frontrunner case in point. Germany is not
only the top country in terms of installed PV systems’ capacity worldwide but also one of the
pioneer countries where the grid parity has recently been achieved. However, there might be a
cloud on the horizon. The diffusion rate has started to decline in many regions. In addition, local
solar firms – which are known to be important drivers of diffusion – have started to face
difficulties to run their businesses. These developments raise some important questions: Is this a
temporary decline on diffusion? Will adopters continue to install PV systems? What about the
business models of the local solar firms? Based on the case of PV systems in Germany through a
multi-level analysis and two complementary literature reviews, this PhD Dissertation extends the
debate by providing multiple wealth of empirical details in a context-limited knowledge. The first
analysis is based on the adopter perspective, which explores the “micro” level and the social
process underlying the adoption of PV systems. The second one is a firm-level perspective, which
explores the business models of firms and their driving roles in diffusion of PV systems. The third
one is a regional perspective, which explores the “meso” level, i.e., the social process underlying
the adoption of PV systems and its modeling techniques. The results include implications for both
scholars and policymakers, not only about renewable energy innovations at grid parity, but also in
an inductive manner, about policy-driven environmental innovations that achieve the cost
competiveness.
Keywords: Solar; deployment; business model; demand; policy; adoption, eco-innovation

xi
Resumen
¿Suministrarán las fuentes de energía renovables toda la energía que el mundo necesita algún día?
Algunos argumentan que sí, mientras que otros dicen que no. Sin embargo, en algunas regiones del
mundo, la producción de electricidad a través de fuentes de energía renovables ya está en una
etapa prometedora de desarrollo en la que su costo de generación de electricidad compite con
fuentes de electricidad convencionales, como por ejemplo la paridad de red. Este logro ha sido
respaldado por el aumento de la eficiencia de la tecnología, la reducción de los costos de
producción y, sobre todo, los años de intervenciones políticas de apoyo financiero. La difusión de
los sistemas solares fotovoltaicos (PV) en Alemania es un ejemplo relevante. Alemania no sólo es
el país líder en términos de capacidad instalada de sistemas fotovoltaicos (PV) en todo el mundo,
sino también uno de los países pioneros donde la paridad de red se ha logrado recientemente. No
obstante, podría haber una nube en el horizonte. La tasa de difusión ha comenzado a declinar en
muchas regiones. Además, las empresas solares locales – que se sabe son importantes impulsores
de la difusión – han comenzado a enfrentar dificultades para manejar sus negocios. Estos
acontecimientos plantean algunas preguntas importantes: ¿Es ésta una disminución temporal en la
difusión? ¿Los adoptantes continuarán instalando sistemas fotovoltaicos? ¿Qué pasa con los
modelos de negocio de las empresas solares locales? Con base en el caso de los sistemas
fotovoltaicos en Alemania a través de un análisis multinivel y dos revisiones literarias
complementarias, esta tesis doctoral extiende el debate proporcionando riqueza múltiple de datos
empíricos en un conocimiento de contexto limitado. El primer análisis se basa en la perspectiva del
adoptante, que explora el nivel "micro" y el proceso social que subyace a la adopción de los
sistemas fotovoltaicos. El segundo análisis es una perspectiva a nivel de empresa, que explora los
modelos de negocio de las empresas y sus roles impulsores en la difusión de los sistemas
fotovoltaicos. El tercero análisis es una perspectiva regional, la cual explora el nivel "meso", el
proceso social que subyace a la adopción de sistemas fotovoltaicos y sus técnicas de modelado.
Los resultados incluyen implicaciones tanto para académicos como políticos, no sólo sobre las
innovaciones en energía renovable relativas a la paridad de red, sino también, de manera inductiva,
sobre las innovaciones ambientales impulsadas por las políticas que logren la competitividad de
costes.


xiii
Disclaimer
Some parts of this PhD Thesis have already been published as:
Karakaya, E., Nuur, C., & Hidalgo, A. (2016). Business model challenge: Lessons
from a local solar company. Renewable Energy, 85, 1026–1035.
Karakaya, E., & Sriwannawit, P. (2015). Barriers to the adoption of photovoltaic
systems: The state of the art. Renewable and Sustainable Energy Reviews, 49, 60–
66.
Karakaya, E., Hidalgo, A., & Nuur, C. (2015). Motivators for adoption of
photovoltaic systems at grid parity: A case study from Southern Germany.
Renewable and Sustainable Energy Reviews, 43, 1090-1098.
Karakaya, E., Hidalgo, A., & Nuur, C. (2014). Diffusion of eco-innovations: A
review. Renewable and Sustainable Energy Reviews, 33, 392-399.


xv
Index
1. Introduction ................................................................................................................... 1
1.1. Setting the scene ..................................................................................................... 1
1.2. The literature gaps, aim and research questions ..................................................... 3
1.3. Structure and outline of the Thesis ......................................................................... 8
2. Solar PV systems ......................................................................................................... 13
2.1. Technology ........................................................................................................... 13
2.2. Diffusion............................................................................................................... 16
2.3. Grid parity ............................................................................................................ 19
3. Diffusion of innovations .............................................................................................. 23
3.1. Theoretical approach ............................................................................................ 23
3.2. State-of the art ...................................................................................................... 26
3.3. The multi-level perspective .................................................................................. 46
4. Methodology ................................................................................................................ 59
4.1. Case study approach ............................................................................................. 59
4.2. Indicator-based approach ..................................................................................... 64
4.3. Finite element method .......................................................................................... 70
5. Results and discussions ............................................................................................... 77
5.1. Micro level analysis ............................................................................................. 77
5.2. The business models............................................................................................. 83
5.3. Meso level analysis .............................................................................................. 91
5.4. Mathematical model ............................................................................................. 96
5.5. A meta-analysis .................................................................................................. 100
6. Conclusions, contributions and limitations ............................................................... 105
6.1. Theoretical implications and contributions ........................................................ 105
6.2. Methodological implications and contributions ................................................. 107
6.3. Policy implications ............................................................................................. 108

xvi
6.4. Limitations and future research .......................................................................... 109
6.5. Conclusions ........................................................................................................ 111
7. Appendix .................................................................................................................... 113
7.1. List of publications ............................................................................................. 113
8. References .................................................................................................................. 115

xvii
List of figures
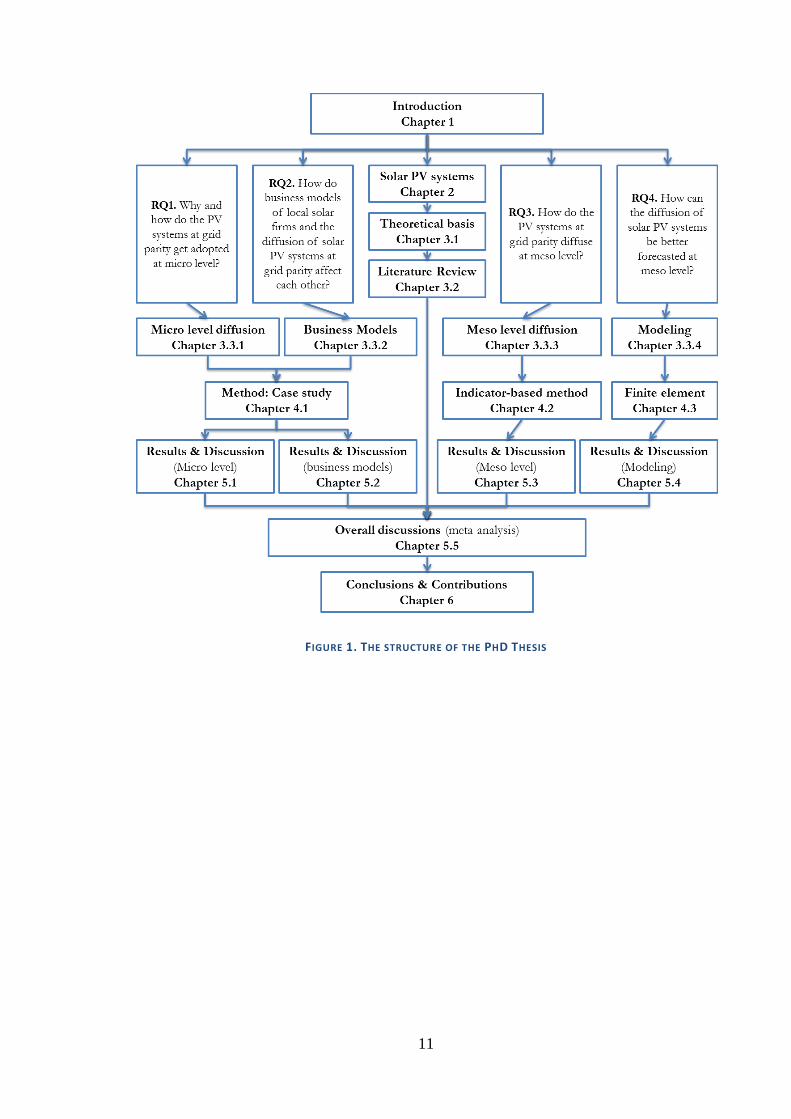
Figure 1. The structure of the PhD Thesis .......................................................................... 11
Figure 2. Some historical steps for PV systems .................................................................. 14
Figure 3. A solar PV system on a roof-top ......................................................................... 14
Figure 4. Best research cell efficiencies ............................................................................. 16
Figure 5. Renewable energy share of global electricity production ................................... 17
Figure 6. Annual installations of PV systems ..................................................................... 17
Figure 7. Numbers of yearly PV installations in Germany ................................................. 18
Figure 8. Number of photovoltaic installations in three districts........................................ 19
Figure 9. Comparison of electricity generation costs ......................................................... 21
Figure 10. Monthly installations vs. feed-in tariff in Germany .......................................... 21
Figure 11. The comparison of two literature reviews ......................................................... 27
Figure 12. The evolution of research articles related to "diffusion of eco-innovations" .... 32
Figure 13. Penetration rate in percent ................................................................................. 54
Figure 14- The location of HET.......................................................................................... 60
Figure 15- The HET and its neighborhood ......................................................................... 61
Figure 16. Geographic zip code areas and states in Germany ............................................ 65
Figure 17- Typical implementation steps for Finite Element Model .................................. 71
Figure 18- The illustration of flow in innovations in space ................................................ 73
Figure 19- The modeled geography from Southern Germany ............................................ 74
Figure 20- The computational mesh on approximated geographic .................................... 75
Figure 21- Different PV solutions for various needs and concepts .................................... 84
Figure 22- The value network of a local solar company .................................................... 87
Figure 23- The comparison between diffusions of PV systems at different levels ............ 88
Figure 24- Revenue of HET from PV installations and other services and products ......... 89
Figure 25- The declining average cost of PV installations ................................................. 90
Figure 26. Box plots of indicators for each state ................................................................ 91
Figure 27. The spatial diffusion pattern of PV in 10 zip code areas of Germany .............. 93
Figure 28. The growth rate for cumulative number of PV installations in Germany ......... 94
Figure 29- Diffusion rate after 13 years .............................................................................. 97
Figure 30- The patterns of s-curves at 5 locations .............................................................. 97
Figure 31- Innovation flux after 3 months, 4 years, 7 years and 10 years .......................... 99
Figure 32- Diffusion ratio after 3 months, 4 years, 7 years and 10 years ........................... 99

xviii
Figure 33. Discussions diagram ........................................................................................ 100

xix
List of tables
Table 1. The link between research questions and methods ................................................. 9
Table 2. Keywords used for compiling the database from Google Scholar. ...................... 29
Table 3. Overview of reviewed publications by country .................................................... 31
Table 4. Business model components ................................................................................. 50
Table 5. A system of indicators that proxy lead market attributes for PV.......................... 67
Table 6. The values for innovation diffusivity.................................................................... 74
Table 7. The spatial visualization of the indicators for lead market attributes ................... 92


1
1. INTRODUCTION
1.1. SETTING THE SCENE
Concerns about scarcity of natural resources, climate change and geopolitics have
prompted governments to support the diffusion of sustainable modes of energy
production. As a recent special report from the Economist (2015, p. 3) argues, “modern
life is based on the ubiquitous use of fossil fuels, all of which have big disadvantages.
Coal, the cheapest and most abundant, has been the dirtiest, contributing to rising
emissions. Oil supplies have been vulnerable to geopolitical shocks and price collusion by
producers. Natural gas has mostly come by pipeline—and often with serious political
baggage, as in the case of Europe’s dependence on Russia. Nuclear power is beset by
political troubles, heightened by public alarm after the accident at Japan’s Fukushima
power station in 2011”. For a long time, increasing the share of renewable energy share,
mainly for replacing the fossil fuels and nuclear power, has been high on the policy
agenda of several countries. For instance, the European Union (EU) has set a target of
20% share of renewable energy in the overall energy consumption by 2020 (EP, 2009).
This is a part of the process of “democratizing” the energy market (da Graça Carvalho et
al., 2011). The democratization of the energy market is often linked to the decentralized
structures of electricity production through renewable energy innovations (see e.g. S.
Wirth, 2014, p. 236). In such markets, households do not only have the right for choosing
between the renewable energy sources (e.g., solar, wind and biomass) and non-renewable
ones (fossil and nuclear fuels) but also produce energy and distribute it.
There are several sources of renewable energy which are expected to pave the way for this
transition towards sustainable modes of energy production. One of this is solar
photovoltaic (PV) technology, which generates electricity from solar radiation. The
ambition is that the PV adopters can generate electricity, consume the part they need and
then; supply the rest of the electricity to the grid (if they cannot store). Although the
electricity generated by PV systems account only for 0,7% of the global electricity
production and 2.6% of the Europe’s (EPIA, 2013; Ren21, 2014), the International Energy
Agency (IEA) argues that the sun could be the world’s largest source of electricity by

2
2050, ahead of fossil fuels, nuclear power and other sources of renewable energy such as
wind and hydropower (IEA, 2014). Through the reduction of production costs and the
increase of technology efficiency, solar PV systems could be argued to be becoming
competitive when compared with conventional electricity sources in terms of the levelized
cost of electricity generation. This cost competitiveness is often referred to the “grid
parity” which is a time and space specific stage. When the solar grid parity is achieved in
one region, it means that the cost of generating PV electricity is cheaper than the retail
price of electricity. According to a recent literature review by Munoz et al., (2014), several
scholars believe that achieving the grid parity is an important milestone for wider
diffusion of solar PV systems. The hope is that grid parity might make the diffusion of PV
systems independent of policy support. But the question is whether this is happening.
Recently, in some regions of the world, grid parity of solar PV systems has been achieved.
According to PV parity project, co-financed by the Intelligent Energy Europe programme
of the European Commission, Italy, Spain and Germany did achieve the grid parity in
2012, while Austria, Belgium, Czech Republic, France, Greece, Portugal, the Netherlands
and the United Kingdom had not yet (PvParity, 2013). What makes Germany is one of the
pioneer countries of grid parity is a result of its competitive installations costs for PV
systems, low interest rates on financial loans and high electricity retail costs (compared to
many other countries). Beyond the grid parity, Germany also represents the largest market
in the world, having 27% share of global PV installed capacity (EPIA, 2014a), which
supplies around 5.2% of country´s electricity consumption (Wirth, 2013). Although
having a relatively limited solar radiation potential, the diffusion of solar PV systems in
Germany has outperformed those of other countries, which have larger land area and
higher solar radiation, e.g., the USA, Spain, Turkey, Brazil, Saudi Arabia and Japan.
One of the most important drivers of solar PV diffusion in Germany has been the
implementation of Renewable Energy Act (EEG) in 2000 and its subsequent amendment
in 2004 (Dewald and Truffer, 2011; Jacobsson and Lauber, 2006). EEG is a nationwide
act which applies to all states in Germany. It financially supports PV adopters through
feed-in tariff schemes in all PV market segments. Under a feed-in tariff, adopters are paid
a cost-based price for the PV electricity they supply to the grid. The effective
implementation of EEG had resulted in continuous increase of the number of yearly
installations in Germany lasting until 2011. However, since 2012, the market has been
facing new conditions. First of all, solar PV energy in Germany has already achieved grid
3
parity. Secondly, the policy support, i.e., the feed-in tariff of EEG, probably as a
consequence of the grid parity, has been scaled down. Thirdly, the diffusion rate has
started to decline for the very first time in many regions of Germany. These new
conditions raise some interesting questions. What happens after achieving the grid parity?
Will diffusion rate incline or decline? What about the solar firms, will they be affected by
the change?
1.2. THE LITERATURE GAPS, AIM AND RESEARCH QUESTIONS
For the purpose of this Thesis, PV systems are conceptualized as environmental
innovations. However, this raises the questions of why and how this could be possible. In
the policy discourse, the notion of innovation is used rather loosely. It appears that
everything is about innovations. Influenced by policy discourse or not, the diffusion of a
variety of innovations has been the subject of study for management and economics
scholars for several decades. Innovation, defined as an idea, practice, or object that is
perceived as new by an individual or other unit of adoption (Rogers, 2003), is the core of
the diffusion process. Innovation is a very broad term and indeed can be anything as long
as it is perceived new by adopters. The variety of innovations that are analyzed in the
literature goes back to the early scholars of diffusion. For example, Griliches (1957)
analyzed the diffusion of hybrid seed corn, which is a product of controlled crossing of
specially selected parental strains, among American farmers. Mansfield (1961) studied the
diffusions of twelve type of innovations, such as, among others, trackless mobile loader
and continuous mining machine, among firms in particular industries. The examples of
innovations in the literature are many. Installing solar PV system is just another kind of
innovation for adopters. However, from a conceptual viewpoint, one can raise a question
worth pondering. Why can electricity generation from the solar PV system be perceived as
an innovation? There are two possible arguments for conceptualizing the electricity
generation from PV system as an innovation. Firstly, none of the new PV adopters had
adopted the PV systems before. Therefore, the solar PV installation is (will be) perceived
as new. Secondly, even in the case of re-adoption, solar PV system installation would still
be perceived as new. This is because solar PV systems have been characterized by
continuous incremental changes on their efficiency and appearance, and therefore, the new
installation will be perceived as an innovation by re-adopters as well. Moreover, if PV
systems can be conceptualized as innovations, why also as environmental ones? Beise and
Rennings (2005) argues that environmental innovations are the innovations that avoid or

4
reduce environmental harms. Is it really the case for the PV systems? This can be an
important debate to discuss in detail - which will probably go beyond the scope of this
Thesis. In a nutshell, I am aware of the limitations of the conceptualization PV systems as
environmental innovations. For example, manufacturing of solar PV systems can lead
some negative environmental impacts in terms of waste disposal (Kannan et al., 2006, p.
562) and greenhouse gas intensive production in some particular regions (Hsu et al., 2012,
p. 132). In addition, the regional diffusion of solar PV systems may result in global
rebound effects, i.e., the reduction of greenhouse gas emissions through PV systems in a
particular region may lead an increase of emissions in another region (see Van den Bergh,
2013a, 2013b). In spite of all these, for the purpose of this Dissertation, it is assumed that
adoption of PV systems reduce the usage of non-renewable energy sources such as fossil
fuels. It is because, in many cases of PV adoption, the electricity generation from PV
systems replace the electricity generation from fossil fuels and nuclear energy. As widely
known, the combustion of fossil fuels produces the greenhouse effect and air pollutants.
This means that each adoption of PV systems is likely to reduce or avoid the production of
greenhouse effect and air pollutants. This is also in line with the research on life cycle
analysis that compares the environmental impact of solar PV systems and fossil fuels (e.g.,
Fthenakis et al., 2008).
In the literature, there has been a broad agreement that the diffusion of innovations does
follow a spatiotemporal pattern (Brown, 1975; Hägerstrand, 1967), so is the case of the
diffusion of solar PV systems. However, it does not necessarily mean that diffusion
always follows a local to regional and regional to national pathway in time and space.
Some areas or cities could have better interconnectivity even though they are located on
the other sides of the world, e.g., the cities on the spice trade route in the medieval period
(5th
-15th
century) or the cities that host the airline hubs in the 21st century. In spite of all
these complexity of interconnectivities, one can still observe a typical s-curve when the
diffusion rate is plotted over a length of time (Bass, 1969; Rogers, 1962) or wave-like
propagations when it is plotted over a length of time and space (Haynes et al., 1977).
These diffusion paths seem to be easily observable, but this is not always the case for all
kinds of innovations. Sometimes, policymakers, through interventions, may induce or
hinder any stage of the diffusion, as it recently happens in the cases of environmental and

5
renewable energy innovations1. Addressing this, the literature on diffusion of
environmental innovations such as renewable energy technologies has also focused on
policy measures (e.g. Beise and Rennings, 2005; Foxon and Pearson, 2008; Tsoutsos and
Stamboulis, 2005). In theory, policy makers, by introducing different measures, e.g.,
subsidies or feed-in tariffs, aim to compensate the high upfront costs of environmental and
renewable energy technologies faced by potential adopters. However, high costs are not
anymore a barrier for some particular technologies in some regions. Solar PV systems
provide an important illustration for this (see Karakaya and Sriwannawit, 2015). Although
solar grid parity have been achieved in a few regions, e.g., southern Germany, and will
soon be achieved in the many others2, understanding diffusion dynamics at grid parity
remains as an understudied topic in the literature.
With this in mind, this Dissertation aims to provide a multi-level analysis on the diffusion
of solar photovoltaic systems at grid parity. In the literature, for multi-level analysis
approach, the definitions of micro, meso and macro levels are diverse (see e.g., Geels,
2010; Hannah and Lester, 2009; MacVaugh and Schiavone, 2010; Waarts and van
Everdingen, 2005). For the purpose of this Dissertation, these levels are defined as same
as the level of observation on diffusion. Micro level is the individual level; meso level is
the regional level and the macro level is the global level. Although, the term of “region” is
often used for sub-national territories (see e.g. Cooke and Morgan, 1998), “region” in this
Thesis refers to any particular geographic or political area of the world. This means, a
region can be a country, a sub-area of a country or a set of countries.
So what? Why the multilevel analysis approach? The diffusion of innovations is often
considered as a complex phenomenon (see Garcia and Jager, 2011; Kiesling et al., 2011).
This means that if an innovation is adopted by some individuals, it might (or not) give a
rise to diffusion on macro scales. As Rogers et al., (2005) argues micro and meso level
behaviors influence each other. Micro-level is vital to be understood, as it leads to the
emergence behavior at the meso level. The meso level is also important to be observed, as
it influences micro behaviors as a feedback. Diffusion of innovations in the energy field,
particularly those that have environmental innovation characteristics such as renewable
1 The detailed discussions on the concept of environmental and renewable energy innovations are given in the chapter 3. 2 According to PV Parity Project (2011-2013), which was co-financed by the Intelligent Energy Europe programme of
the European Commission, majority of the EU member states will expected to achieve the PV grid parity for residential
sector by 2020 (see PvParity, 2013)

6
energy innovations, constitutes even more complex patterns. One the one hand, policy
makers or incumbent actors might intervene the process at meso and macro levels (see e.g.
Darmani et al., 2014; Jacobsson and Lauber, 2006). On the other hand, the influence of
local actors could drive the diffusion at micro and meso levels (see e.g. Fabrizio and
Hawn, 2013; Graziano and Gillingham, 2014). Therefore, I believe, in order to understand
the diffusion of solar PV systems at grid parity, we need to consider the multi-levels of
phenomenon.
Interplaying between micro and meso level of diffusion, this Thesis provides three
different types of analysis and a proposal of modeling method. The first one is the micro
level analysis of the diffusion of solar PV systems at grid parity. The analytical
underpinnings of this analysis is the theory of diffusion of innovations (Rogers, 2003).
Moreover, this analysis aims to contribute on the literature of renewable energy. To date,
renewable energy research has extensively studied the factors that influence the diffusion
rate of solar PV systems. These factors are identified as policy measures, including feed-in
tariffs (Hoppmann et al., 2013; Jacobsson and Lauber, 2006; Jäger, 2006; Zhang et al.,
2011), peer effects and adopters’ socioeconomic background (e.g. Bollinger and
Gillingham, 2012; McEachern and Hanson, 2008; Peter et al., 2002; Zhang et al., 2011)
and the role of local solar companies (e.g. Dewald and Truffer, 2012; Fabrizio and Hawn,
2013). Although some recent studies have conducted economic analysis for the grid parity
of solar PV systems (e.g. Haas et al., 2013; Spertino et al., 2014), less has been said about
the micro-level social processes underlying the diffusion at grid parity. Therefore, I raise
the following research question for the micro level. RQ1. Why and how do the PV
systems at grid parity get adopted at micro level?
The second analysis explores the link between the firms’ business models and the
diffusion of PV systems at micro and meso levels. This analysis is anchored in the
assumption that the diffusion of PV systems is affected not only by the technology, policy
and adopters but also by the firms which supply and install the solar PV systems. During
diffusion of innovations, the firms can act as change agents at micro level, while forming
the necessary market structure at meso level. The business models of firms have been
studied for several contexts such as transportation (e.g., Kley et al., 2011; Tongur and
Engwall, 2014) and energy (e.g., Nair and Paulose, 2014; Okkonen and Suhonen, 2010).
Although the business models in PV sector have also been discussed (e.g. Huijben and
Verbong, 2013; Loock, 2012; Richter, 2013a), the empirical focus has only been limited to

7
the large sized electric utilities, solar cells production firms and households. However,
little attention has been paid to the business models of local solar firms, which are known
to be important drivers of diffusion. Thus, the following research question is formulated.
RQ2. How do business models of local solar firms and the diffusion of solar PV systems
at grid parity affect each other?
The third analysis is at meso level. The theoretical underpinnings of this analysis is based
on the lead market hypothesis (Beise, 2001). This analysis aims to contribute on both
literature of diffusion of innovations and the research on sustainability transitions, a
research field that focuses on systematic shifts for the adoption of environmental
innovations in a variety of industrial areas including energy. Although the importance of
space and sub-national regions has recently received attention in the literature on
sustainability transitions, there are not many studies on diffusion phase. Some studies
(Coenen et al., 2012; Truffer and Coenen, 2012) reveal that the majority of previous
literature had failed to reflect about the space-specific contexts and extend an invitation
for research that considers the spatial heterogeneity of regions. Consequently, a variety of
studies (e.g. Binz et al., 2014; Smith et al., 2014) have studied the space on sustainable
transitions and shed light on the role of actors, networks and institutions. Yet, little
systematic attention has been paid to the demand side of sub-national dynamics for such
transitions. Understanding the patterns of diffusion at meso level is particularly critical for
innovations with both private and public good characteristics such as PV systems (see e.g.
Fabrizio and Hawn, 2013; Graziano and Gillingham, 2014). Therefore, I raise the
following research question. RQ3. How do the PV systems at grid parity diffuse at meso
level?
In addition, this Thesis proposes a modeling method at meso level. Modeling the diffusion
patterns of innovations at meso level has been a great interest of a variety of scholars for
several decades, through models that have been based on one dimension, i.e., time (e.g.
Bain, 1963; Harvey, 1984; Meade & Islam, 1998; Sharif & Islam, 1980), and two
dimensions, i.e., time and space (Hägerstrand, 1967; Haynes et al., 1977; Morrill, 1970).
In the literature of solar PV systems, both one and two dimensional models have been
studied (e.g. Guidolin and Mortarino, 2010; Higgins et al., 2014; Kwan, 2012; Luque,
2001; Masini and Frankl, 2002; Mesak and Coleman, 1992). Through these models, the
ambition is to forecast the diffusion of solar PV systems based on different scenarios. If
this can be achieved, policy makers can develop more efficient measures to drive the

8
diffusion process of solar PV systems in the future. However, the majority of current
modeling methods have failed to address the impact of spatial heterogeneity and,
therefore, not have been able to forecast the diffusion in space domain. Thus, the
following research question is formulated. RQ4. How can the diffusion of solar PV
systems be better forecasted at meso level?
1.3. STRUCTURE AND OUTLINE OF THE THESIS
In order to understand the micro and meso level mechanisms behind such energy-related
phenomena, interdisciplinary and multi-methodological approaches are needed (Sovacool,
2014a). Addressing this need, this Dissertation has been developed through a variety of
methods (see Table 1), some results of which have been already published (Karakaya and
Sriwannawit, 2015; Karakaya et al., 2016, 2015, 2014a). The first method has been
systematic literature review approach. The other methods are case study method,
indicator-based approach and finite element method, through which the four overarching
and interrelated RQs of this Thesis have been specifically addressed. The two literature
reviews synthesize the relevant studies in two research domains: diffusion of eco-
innovations and diffusion of solar PV systems. The contribution of these systematic
literature reviews is twofold. Firstly, they help on developing the theoretical frameworks
to be used for answering the RQs. Secondly, the results of them are used for interpreting
the findings and implications of this Thesis. For example, on the one hand, the lead market
model, which is identified to be a comprehensive concept for studying diffusion of
environmental innovations (according to the systematic literature review on environmental
innovations), is used in developing the theoretical framework for meso level analysis. On
the other hand, the barriers identified in the review on solar PV systems are used for
interpreting the findings of micro level analysis.

9
TABLE 1. THE LINK BETWEEN RESEARCH QUESTIONS AND METHODS3
Level Method
Innovation Focus Relevance to Research
Questions
Inn
ovati
on
in
Gen
eral
En
vir
on
men
tal
Inn
ovati
on
s
Sola
r P
V s
yst
ems
Q1 Q2 Q3 Q4
Mix Literature
Reviews
*** * *
*** * *
Micro Case Study
*** *** *
Firms *** ***
Meso
Indicator-based * * * * *** *
Finite Element * * * ***
The overarching spatiotemporal focus of the Thesis is Germany in 2012 and the
technology in focus is solar PV system. However, each analysis has a slightly different
combination of spatiotemporal and technological scope. The case study is based on a case
of solar PV systems with less than 40kWp capacity in Tübingen in Germany in 2012,
while the indicator-based approach focuses on the case solar PV systems with less than
10kWp capacity of whole Germany from 2000 to 2012. In early 2000s, the installations
that have a less than 10 kWp capacity were mostly households’ adoption. However, in
early 2010s, the installations that have a less than 40 kWp capacity were mostly
households. Therefore, in this Thesis, the adopters are sometimes referred as households.
When it comes to literature reviews, on the one hand, the first literature review is based on
the research papers on eco-innovations published from 1973 to 2012. On the other hand,
the second literature review covers the literature, which was published from 2011 to 2013,
on diffusion of solar PV systems in a variety of countries, including both low and high
income economies.
3 Asterisks represent the proportion of relevance; three asterisks are for the highest relevance, while zero is for the
lowest.

10
Figure 1 presents the flow and interlinks of the chapters and sub-chapters of the PhD
Thesis. In this token, the rest of the Thesis is structured as follows. Chapter 2 outlines the
background information about solar PV systems. Chapters 3 explain the theoretical
constructs and analytical framework that are used at interpreting the data. In this chapter,
sub-chapter 3.1 outlines the theoretical approach and key constructs. Sub-chapter 3.2
presents the core results of systematic literature reviews (along with their methodological
aspects), which are based on solar PV systems in particular and environmental innovations
in general. Sub-chapter 3.3 outlines the analytical framework in respect to four
perspectives: micro-level, business models, meso-level and modeling. These sub-chapters
also present the state of the art for corresponding research streams. Furthermore, chapter 4
is dedicated to methodological aspects, e.g., research design, case selection, unit of
analysis, data collection and data analysis. This chapter is divided into three sub-chapters,
which explains the methods used in this Dissertation. The first one is case study
methodology (sub-chapter 4.1), which is used for micro-level and business model
analyses. The second one is indicator-based approach, which is used for meso level
analysis (sub-chapter 4.2), and the third one is finite element method (sub-chapter 4.3).
Anchored in the analyses at different levels, chapter 5 presents the discussions. The
discussions are divided into sub-chapters presenting the possible answers for the RQs
(sub-chapter 5.1-4) and acombined analysis (sub-chapter 5.5). Finally, chapter 6 presents
the overarching implications, conclusions, contributions and limitations of the PhD Thesis.
This last chapter also extends a detailed invitation for future research on diffusion of, in
particular, renewable energy innovations at grid parity and, in general, policy-driven
environmental innovations at cost competitiveness.
11
FIGURE 1. THE STRUCTURE OF THE PHD THESIS

13
2. SOLAR PV SYSTEMS
Generally, there are three different ways of generating energy from the sun: passive heat
energy that we receive naturally, solar thermal energy which provides us with hot water
(e.g., the case of solar thermal heating systems) and photovoltaic (PV) energy that we use
to generate electricity to run appliances and lighting (EPIA, 2010). Solar PV system is the
field of technology and research related to the devices which directly convert sunlight into
electricity; and the solar cell is the elementary building block of the photovoltaic
technology (EC, 2007). Solar cells can be made from different semiconductor materials
such as silicon which is the most widely used material for this purpose. There is no
limitation to silicon availability as a raw material as silicon is the second most abundant
material in the world (EPIA, 2010). Compared with fossil-fuel- based electricity
generation technologies, solar PV systems produce far less life-cycle air emissions.
According to Fthenakis et al. (2008), if electricity from photovoltaics replaces electricity
from the average grids in the US and Europe, it will lead to at least 89% reductions of
greenhouse gas emissions, pollutants, heavy metals, and radioactive species. These
pollution reductions are expected be even greater if the PV systems are decentralized
systems, such as the ones on the roof-tops of households, instead of centralized ones.
2.1. TECHNOLOGY
The history of PV systems goes back to the discovery of photovoltaic effect and the
discovery of the fact that sun's energy creates a flow of electricity in selenium in the 19th
Century (Petrova-Koch et al., 2009, p. 2). However the turning point was in the early
1950s, when the accidental discovery of Pearson et al. (1954), the scientists from Bell
Labs, took place (Kazmerski, 2006, p. 105). It changed the history of photovoltaic
systems. The discovery was using silicon instead of selenium. In a short period, the
scientists invented more efficient PV cells than selenium cells at generating electricity.
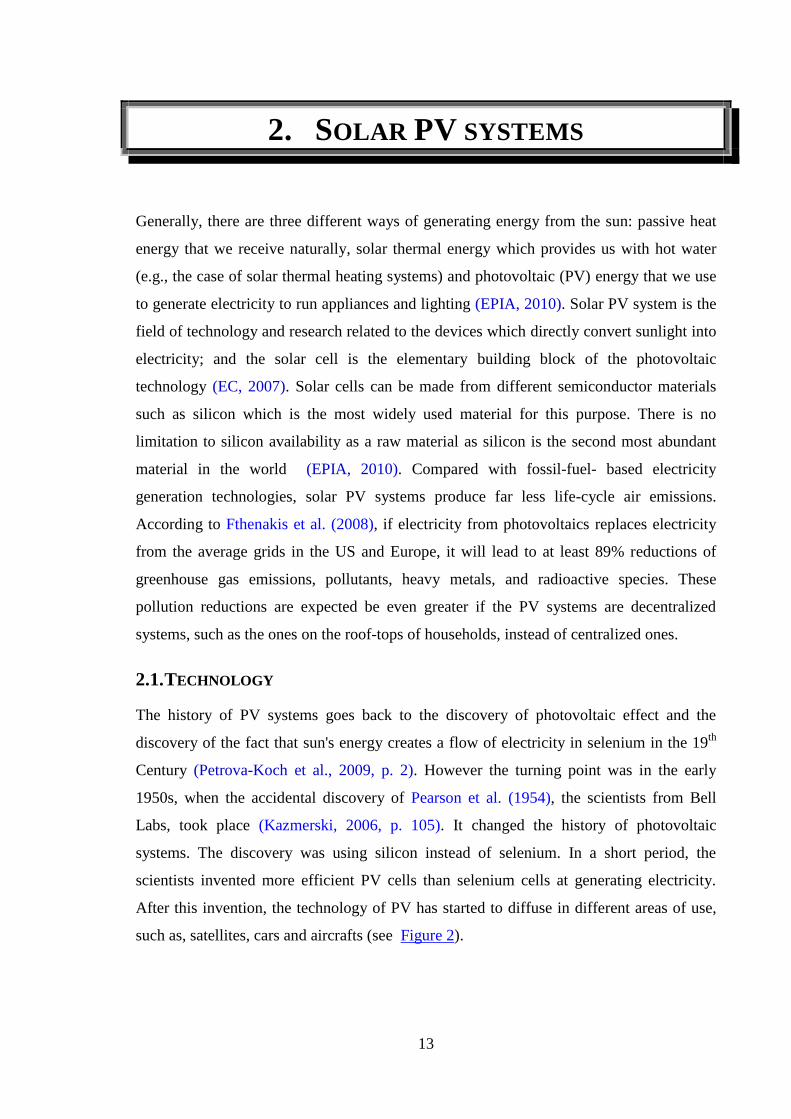
After this invention, the technology of PV has started to diffuse in different areas of use,
such as, satellites, cars and aircrafts (see Figure 2).
14
FIGURE 2. SOME HISTORICAL STEPS FOR PV SYSTEMS4
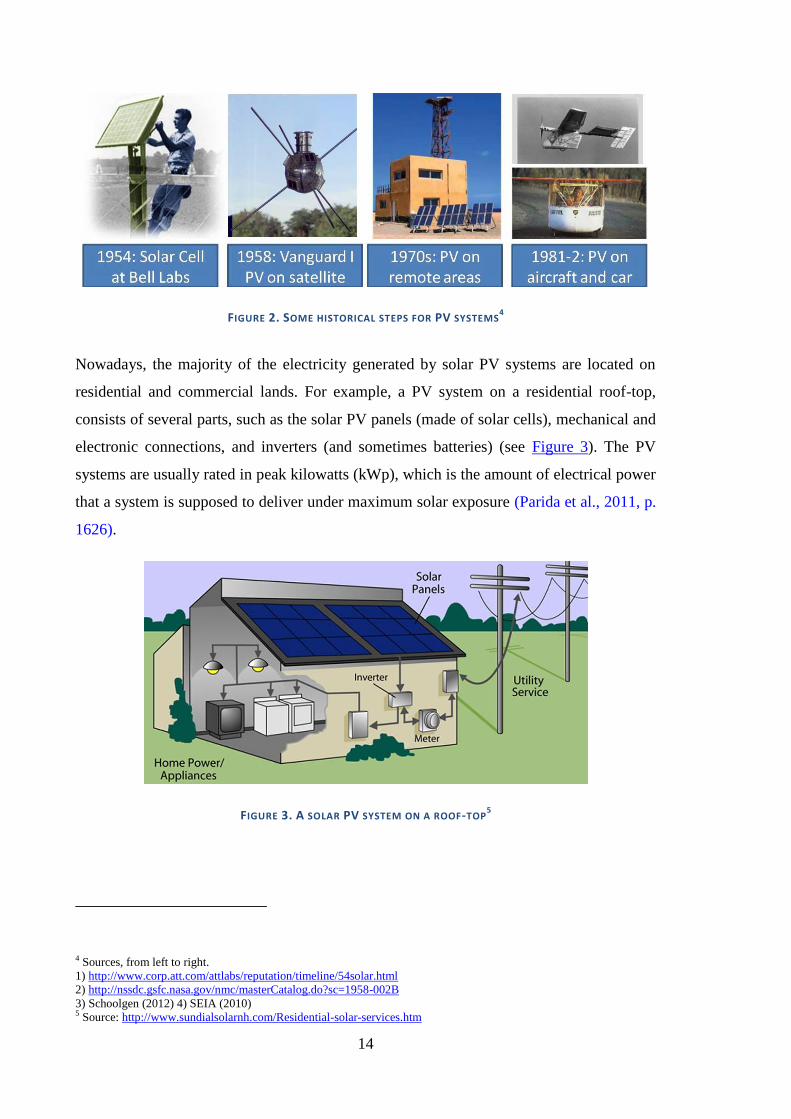
Nowadays, the majority of the electricity generated by solar PV systems are located on
residential and commercial lands. For example, a PV system on a residential roof-top,
consists of several parts, such as the solar PV panels (made of solar cells), mechanical and
electronic connections, and inverters (and sometimes batteries) (see Figure 3). The PV
systems are usually rated in peak kilowatts (kWp), which is the amount of electrical power
that a system is supposed to deliver under maximum solar exposure (Parida et al., 2011, p.
1626).
FIGURE 3. A SOLAR PV SYSTEM ON A ROOF-TOP5
4 Sources, from left to right.
1) http://www.corp.att.com/attlabs/reputation/timeline/54solar.html
2) http://nssdc.gsfc.nasa.gov/nmc/masterCatalog.do?sc=1958-002B
3) Schoolgen (2012) 4) SEIA (2010) 5 Source: http://www.sundialsolarnh.com/Residential-solar-services.htm

15
The main manufacturing processes (as well as the technology) of photovoltaic can be
currently categorized into mainly two groups: crystalline silicon technology (so called
wafer based) and thin film technology. There are also many different cell types developed
recently which are starting to be commercialized or still at the research level (EPIA,
2010). An efficiency progress graphic of all these PV technologies is shown in Figure 4.
The efficiency rates demonstrated in this chart are the best values reached by various
research & development institutions worldwide. They are laboratory prototype cells and a
couple of years may be needed to be commercialized. For example, the laboratory
prototype Crystalline Si Cells has already reached the level of 25% efficiency, but the
most of the Crystalline Si PV cells in the market have the efficiency rate under 20%. For
many new PV technologies reaching high level of efficiency rates, the main challenge is
the high costs needed for implementation at the commercial level.

16
FIGURE 4. BEST RESEARCH CELL EFFICIENCIES6
2.2. DIFFUSION
The solar PV systems count for less than 1% in the global share for electricity production
(see Figure 5). A recent report from European Photovoltaic Industry Association (EPIA,
2014a) shows the diverse PV diffusion patterns among different regions of the world (see
Figure 6). While some regions have a slowdown in their diffusion, the others are on the
way to achieving a rapid growth. Breaking the long-term domination of Germany, China
becomes the top market with its annual installations in 2013, followed by Japan and the
USA. Decline in annual installation in European countries was compensated with the
growth in China and Asia-pacific countries in the world. Yet, in terms of cumulative
installation capacities by 2013, Germany still tops the market with its 27% share on global
installations, doubling the followers China & Taiwan (13%) , Italy (12%) and Japan
(%10).
6 (NREL, 2014)

17
FIGURE 5. RENEWABLE ENERGY SHARE OF GLOBAL ELECTRICITY PRODUCTION7
FIGURE 6. ANNUAL INSTALLATIONS OF PV SYSTEMS8
Germany is usually viewed as the frontrunner country on the diffusion of PV systems. In
2012, solar PV systems generated almost 35% of current consumption on sunny days
(Wirth, 2013). Between 2004 and 2010, solar PV diffusion had performed the fastest
growth in Germany, far front of other renewable energy innovations. Figure 7 presents the
evolution of diffusion of solar PV systems in three market segments: small (less than 10
KWp capacity), medium (between 10 and 40 KWp capacity) and large (more than 40
KWp). In this figure, the times of implementation and amendment of German Renewable
7 Source: Ren 21 (2014, p. 25). This estimation is based on the end of 2013 as compiled from several sources as
explained in p.145 of Ren21 (2014). 8 Source: EPIA (2014a, p. 18). MEA: Middle East. APAC: Asia Pacific Countries. RoW: Rest of the world. The data for
RoW is not available for 2011 and 2012.

18
Energy Act (EEG) along with estimated time of the grid parity are also plotted. In terms of
number of installations, the small size PV systems have the largest diffusion in Germany.
FIGURE 7. NUMBERS OF YEARLY PV INSTALLATIONS IN GERMANY9
Although the PV systems achieved grid party in Germany, there has been a continuous
decrease in number of PV installations since 2011, which directly influenced the local
firms. Turnovers of many local PV firms have been decreasing, not only because of the
declined number of installations, but also because of the decreased price of PV modules.
However, the diffusion paths of solar PV installations are not the same all over the
country. Depending on the location, different diffusion trajectories can be observed. For
example, Figure 8 shows a district analysis from southern Germany. In this comparison,
Südliche Weinstrasse (a population of 108,875) has a stable growth in the total number of
installations during 2010-2012. However, Tübingen (a population of 212.800) had a
relatively rapid decrease in this period. In addition, Karlsruhe (a population of 424.510)
presented a rather slightly different pattern: sharp decrease in 2011 and stable growth in
2012. This illustrates that there might be different regional patterns of PV diffusion in
Germany.
9 The data is compiled from the Information Platform of four German Transmission Network Operators for the
Renewable Energy Sources Act (EEG) and the Combined Heat and Power Act (KWK-G)

19
FIGURE 8. NUMBER OF PHOTOVOLTAIC INSTALLATIONS IN THREE DISTRICTS10
2.3. GRID PARITY
The efficiency of the different types of solar cells is constantly improving (NREL, 2014,
2012). Moreover, from an economic perspective, the PV production cost has continuously
been decreasing. As a result of these developments, the relative economic advantage of
PV systems (as perceived by potential adopters) has been improved. Particularly in
Germany, PV systems are assumed to be at grid parity, i.e., the price of solar PV
electricity can compete with the price of conventional electricity sources (Lettner and
Auer, 2012a; Pérez et al., 2013; Spertino et al., 2014). How can the cost of solar PV
electricity be compared to the cost of conventional electricity sources? One way of doing
this comparison is based on the calculation of the levelized cost of electricity (LCOE),
€/kW. It is a calculation of the cost of electricity generation that is based on different
variables, such as the initial capital, solar radiation, costs of continuous operation, service
life time and costs of maintenance. When the LCOE of solar PV electricity is below the
price of purchasing electricity from the grid, it means that solar grid party has been
achieved in the corresponding region. The comparison of the LCOE of a PV system and
10 The data is compiled from the Information Platform of four German Transmission Network Operators for the
Renewable Energy Sources Act (EEG) and the Combined Heat and Power Act (KWK-G). The Germany map is plotted
via the QGIS 2.6.0 Brighton Software.

20
the average electricity price in Germany indicates that since the beginning of 2012 the
LCOE of a PV system has been lower than electricity retail price (Figure 9). By the end of
2012, the LCOE of a typical PV system in Germany was between 0.12 and 0.21 €/kWh,
whereas the electricity retail price was approximately 0.26 €/kWh. This fact represents a
rapid improvement in solar PV systems in comparison to May 2010. As a consequence of
this decrease of the PV LCOE and the increase of the electricity prices in Germany, the
government has been gradually reducing the feed-in tariff which was firstly introduced
through the German Renewable Act (Erneuerbare-Energien-Gesetz, EEG) in 2000. The
idea behind EEG was to accelerate cost reductions on renewable energy technologies
through economies of scale over time. It has been applied to all states in Germany,
supporting PV adopters with 10-year contracts and pays them with a cost-based price for
the kW. As a result of the rapid decrease in feed-in tariff in Germany, the adoption rate
has recently experienced some boom and bust cycles, as presented in Figure 10. The
number of installations notably increased just before the reductions of the feed-in tariff as
seen in the months of December 2009, July 2010, December 2010 or July 2011. In
contrast, since April 2012, the feed-in tariff has been diminishing gradually month-by-
month, which prevents boom and bust cycles but reveals seasonal effects (e.g., high
installations between June and October due to adequate weather conditions in the region).

21
FIGURE 9. COMPARISON OF ELECTRICITY GENERATION COSTS11
FIGURE 10. MONTHLY INSTALLATIONS VS. FEED-IN TARIFF IN GERMANY12
11 The data are compiled from different sources (Kost and Schlegl, 2010; Kost et al., 2012) and Bundesagentur. (as cited
in Karakaya et al., 2015) 12 The date are compiled from Bundesagentur and the Information Platform of four German Transmission Network
Operators for the EEG and KWK-G


23
3. DIFFUSION OF INNOVATIONS
3.1. THEORETICAL APPROACH
The theory in science answers questions as to why certain phenomenon might occur
(Berthon et al., 2002, p. 421). In social science research, an analytical theory provides
several elements, such as criteria about which are important to consider, gaps in the
existing knowledge and a source of cross fertilization of related fields (Parsons, 1938).
This chapter, therefore, aims to outline the important perspectives of related fields that are
known to be critical for understanding the dynamics of diffusion of renewable energy
innovations. Subsequently, this chapter serves as an analytical basis, i.e., so called
“theoretical lenses”, to interpret the empirical data used in this Dissertation.
Innovation was traditionally defined as setting up of a new production function, which
covers the cases of a new commodity for the opening up of new markets and new forms of
organizations (Schumpeter, 1939). The innovations are the core of technological change13
in societies. The Schumpeterian approach has been developed by several researchers,
furthering our understanding of innovation with various taxonomies. Starting from the
1960s, several contributions in innovation studies have emerged from different disciplines.
Seminal contributions have been made in the fields of economic sciences (Nelson, 1959;
Schmookler, 1966), management sciences (Burns, T., Stalker, 1961) and sociology
(Rogers, 1962), while Nelson & Winter, (1982) have been accepted as the most important
contributors in innovations studies with their book "An evolutionary Theory of Economic
Change", which combines Schumpeterian and evolutionary perspectives with implications
to innovation (see Fagerberg et al., 2012). In the 1990s new concepts and frameworks (as
well as synthetic overviews) have been introduced into the field. For example, the concept
of Porter (1990) about fostering innovation and growth has rapidly been popularized
especially by analysts and policy makers discussing the importance of location. Kline &
Rosenberg (1986) proposed a chain-linked model of innovation that triggered the
13 According to the Schumpeter, the technological change has three stages: invention, innovation and diffusion (Jaffe et
al., 2002)

24
systematic approaches and their implications that have gained more attention in the last
decade. The concept of "National Systems of Innovation" has been developed on different
perspectives and geographical levels such as sectoral innovation systems (Carlsson,
Jacobsson, Holmen, & Rickne, 2002), technological innovation systems (Malerba, 2002)
and regional innovation systems (Asheim and Coenen, 2005).
Diffusion of innovations theory (Rogers, 1962), in contrast to other conceptualisations of
innovation, is written from a sociological perspective and focuses on the process at which
innovations are diffused and adopted by individuals within a social system. It has been
studied and applied in various academic disciplines (Murray, 2009; Sriwannawit and
Sandström, 2015) including marketing (e.g., for projections of markets) and public health
(e.g., for understanding how new standards can be translated into widespread practice).
However, Rogers' approach is relatively independent in compare with other top innovation
studies' contributors (who are Nelson, Freeman, Rosenberg, Schumpeter, Porter, Griliches,
Von Hippel, Lundvall, Pavitt and Chandler according to Fagerberg et al., 2012). This
different approach can be explained with three possible factors. First, Rogers is a rural
sociologist but many other contributors in innovation studies are mainly from economics
or management sciences. Second, he analyses the adoption of innovations by demand side.
Other scholars usually focus more on the supply side mechanisms and industrial
dynamics, for instance institutional changes, market formation or entry of new firms.
Third, Rogers' theory is empirically deduced from many case studies.
Environmental innovations are the innovations that avoid or reduce environmental harms
(Beise and Rennings, 2005), i.e., the innovations that reduce the use of natural resources
and decrease the release of harmful substances (EIO, 2010). The environmental innovation
concept has been studied by a variety of scholars (e.g. Jänicke, 2008; Oltra and Saint Jean,
2009; Pujari, 2006; Rennings, 2000; Van den Bergh, 2013a). The concept covers many
technologies (e.g., wind energy systems, algae biodiesel), organizational practices (e.g.,
pollution prevention schemes) and services (e.g., car sharing). Environmental innovation
activities are usually driven forward or hampered by various factors both internal and
external to company, among others: economic and financial factors (e.g., pricing, market
position, access to capital, demand) and policy framework (including environmental and
innovation polices, taxes, standards and norms) (EIO, 2011). Yet, policy makers also have
paid much attention to environmental innovations. For example in European Union (EU),
environmental innovations are one of the most crucial aspects of Europe 2020 strategy

25
(EIO, 2010). With environmental innovations, the EU aims to achieve two important
goals: a resource-efficient Europe and an industrial policy based on green growth. It is
assumed that the emergence of environmental innovations will ensure future employment,
contribute to economic growth in Europe and respond to today’s major societal and
environmental challenges (ETAP, 2010).
Renewable energy innovations are typical examples of environmental innovations (Huber,
2008, p. 361). Renewable energy innovation is any renewable energy related idea, object
or practice that is perceived as new by the adoption unit. The term “renewable energy
innovation” is often used by scholars studying the renewable energy technologies, such as
solar PV systems, wind power, biomass and solar thermal (e.g. de Araújo and de Freitas,
2008; Huijben and Verbong, 2013; Mallett, 2007; Wüstenhagen et al., 2007). Renewable
energy innovations, and their diffusion, bring some particular aspects to the debate.
Wüstenhagen et al. (2007) analyze these aspects in three dimensions. Firstly, for the
adoption of renewable energy innovations, more than one decision-maker approval might
need to be taken. For example, this is a typical case of multi-family residential buildings
willing to adopt solar PV systems. Secondly, the adoption of renewable energy
innovations have a visual impact on both the adopters and non-adopters. This is mainly
because the energy production usually happens where the energy users live. However, for
conventional electricity sources such as nuclear or coal, the production units are not easily
visible to energy users. Thirdly, renewable energy innovations have high short-term costs.
The term “diffusion” lies on the core of this Dissertation, and correspondingly in all
analyses. Diffusion is the process by which an innovation is disseminated amongst
potential adopters (Teece, 1980, p. 464). It has been popularized since the seminal work of
Rogers (1962), who is accepted as one of the most well-known scholars of innovation
studies (see Fagerberg et al., 2012). In general, the development and diffusion of
innovations cannot be planned. It is complex, uncertain and subject to changes of many
sorts (Kline and Rosenberg, 1986). Some innovations require a lengthy period to the time
they are adopted even though the obvious advantages (Rogers, 2003). History is full of
examples in which innovations were not been embraced despite their clear benefits or the
adoption period took many years (e.g., electrical cars). Even when it comes to
environmental innovations, which the EU promotes, there is a lot to be desired for their
rapid diffusion. These kinds of adoption problems, which have occurred or may occur in
future, could de-motivate potential innovative companies, mainly the small and medium

26
ones (SME). The results of Eurobarometer survey (EC, 2010) confirms that European
companies think that two of the most significant barriers to environmental innovations are
directly related to adoption rate of their products: uncertain demand from the market and
uncertain return on investment.
3.2. STATE-OF THE ART
This sub-chapter includes two research state-of the art literature reviews. These reviews,
which are about eco-innovations in general and solar PV systems in particular, are
conducted through systematic literature review approach (see Figure 11). Systematic
literature reviews are scientific methodologies that are able to limit bias to systemic
assembly, critical appraisal, and the synthesis of all relevant studies on a specific topic
(Cook et al., 1995, p. 167). According to Cook et al. (1997), systematic literature reviews
distinguish from traditional narrative reviews by adopting a replicable and detailed
methodology (as cited in Tranfield et al., 2003, p. 209). Recently, systematic literature
reviews has become a fundamental scientific activity, for example, as a common part of
PhD dissertations or, even sometimes, the whole dissertation itself (Daigneault et al.,
2012).

27
FIGURE 11. THE COMPARISON OF TWO LITERATURE REVIEWS
The first systematic literature review focuses on the emerging field of diffusion of
environmental innovations. It maps the scientific body, identifies the core contributors and
discusses the main research streams. It is based on a review of all kind of publications
(from 1990 to 2012) of Google Scholar Database, which is a freely accessible scholarly
web search engine that includes full-text journal articles, technical reports, preprints,
theses, books, and other scholarly documents (Rita Vine, 2006). Although this database
has recently been criticized by many scholars because of its shortcomings on bibliometric
purposes (Aguillo, 2011; Jacsó, 2011), it is used for bibliometric studies mainly because
of its broader coverage. Due to its comprehensive citation coverage, the citation numbers
of Google Scholar are usually around four times higher than ISI Web of Knowledge. For
example, the study of Jaffe and Palmer (1997) had a total citation of 142 in ISI Web of
Knowledge and 589 in Google Scholar; the study of Nill and Kemp (2009) had a total
citation of 36 in ISI Web of Knowledge and 113 in Google Scholar.
The identification of keywords was a challenging step. There are many synonyms that
refer to the notion “diffusion of eco-innovations”. To address this, the synonyms of both
“diffusion” and “eco-innovations” are separately identified to create multiple genitive
constructions. Firstly, “adoption” is identified as the only synonym of diffusion due to the
fact that these two terms are traditionally studied together (Halila, 2007; Rogers, 2003;

28
Surinach et al., 2009). The only difference is that adoption refers to a process at the
individual level whereas the process of diffusion occurs in society. Secondly,
“environmental innovations”, “ecological innovations”, “green innovations” and
“sustainable innovations” are taken as synonyms to “eco-innovations” as suggested by
Schiederig, Tietze, & Herstatt (2012). According to these premises, the genitive
constructions of the synonyms of the diffusion and eco-innovations were created as 40
variations (see Table 2). This approach limits the database and excludes the studies that do
not include any of these 40 keywords. Therefore, the studies that about only one type of
eco-innovations (e.g. solar panels, green textile or photovoltaic technology) would not
appear in the database unless they have one of these 40 keywords in their text. In this
review, the extracted publications were analysed through two-level analysis. The first-
level analysis is based on the information of the authors, journal names, publication years
and citation frequency. The second-level analysis focuses on the identification of the core
disciplines and research streams based on the mostly cited articles. The second-level
results of this first review are presented in sub-chapter 3.2.1.14
14 The results of first-level analysis are briefly presented in this Thesis. For further details on this, please see Karakaya et
al. (2014).
29
TABLE 2. KEYWORDS USED FOR COMPILING THE DATABASE FROM GOOGLE SCHOLAR.
Diffusion Category Adoption Category
Eco-Innovation
notion
Diffusion of Eco-innovation Adoption of Eco-innovation
Diffusion of Eco-innovations Adoption of Eco-innovations
Eco-innovation Diffusion Eco-innovation Adoption
Eco-innovations Diffusion Eco-innovations Adoption
Ecological
Innovation
notion
Diffusion of Ecological Innovation Adoption of Ecological Innovation
Diffusion of Ecological Innovations Adoption of Ecological Innovations
Ecological Innovation Diffusion Ecological Innovation Adoption
Ecological Innovations Diffusion Ecological Innovations Adoption
Green
Innovation
notion
Diffusion of Green Innovation Adoption of Green Innovation
Diffusion of Green Innovations Adoption of Green Innovations
Green Innovation Diffusion Green Innovation Adoption
Green Innovations Diffusion Green Innovations Adoption
Sustainable
Innovation
notion
Diffusion of Sustainable Innovation Adoption of Sustainable Innovation
Diffusion of Sustainable Innovations Adoption of Sustainable Innovations
Sustainable Innovation Diffusion Sustainable Innovation Adoption
Sustainable Innovations Diffusion Sustainable Innovations Adoption
Environmental
Innovation
notion
Diffusion of Environmental Innovation Adoption of Environmental Innovation
Diffusion of Environmental Innovations Adoption of Environmental Innovations
Environmental Innovation Diffusion Environmental Innovation Adoption
Environmental Innovations Diffusion Environmental Innovations Adoption
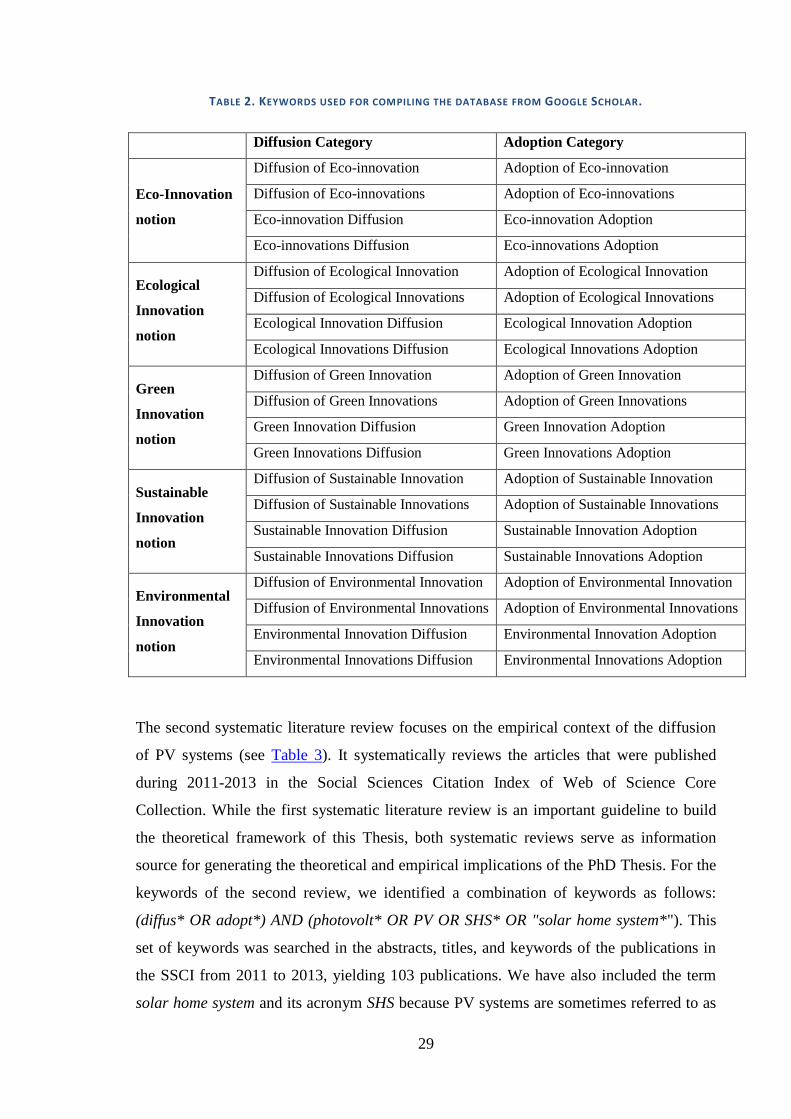
The second systematic literature review focuses on the empirical context of the diffusion
of PV systems (see Table 3). It systematically reviews the articles that were published
during 2011-2013 in the Social Sciences Citation Index of Web of Science Core
Collection. While the first systematic literature review is an important guideline to build
the theoretical framework of this Thesis, both systematic reviews serve as information
source for generating the theoretical and empirical implications of the PhD Thesis. For the
keywords of the second review, we identified a combination of keywords as follows:
(diffus* OR adopt*) AND (photovolt* OR PV OR SHS* OR "solar home system*"). This
set of keywords was searched in the abstracts, titles, and keywords of the publications in
the SSCI from 2011 to 2013, yielding 103 publications. We have also included the term
solar home system and its acronym SHS because PV systems are sometimes referred to as

30
solar home systems, especially in rural contexts. The core results of the second review are
presented in sub-chapter 3.2.2. In addition, the rest of the literature which focuses on the
case of solar PV systems in Germany, but not mentioned in systematic literature reviews,
is outlined in sub-chapter 3.2.3.

31
TABLE 3. OVERVIEW OF REVIEWED PUBLICATIONS BY COUNTRY15
Category Country Studied by
Low-income
economies
Bangladesh (Komatsu et al., 2011; Palit, 2013; Pode, 2013)
Cambodia (Pode, 2013)
Ethiopia (Müggenburg et al., 2012; Pode, 2013)
Kenya (Bawakyillenuo, 2012; Lay et al., 2013; Ondraczek,
2013; Pode, 2013)
Nepal (Mainali and Silveira, 2011; Palit, 2013)
Tanzania (Ondraczek, 2013; Pode, 2013)
Zimbabwe (Bawakyillenuo, 2012)
Lower-middle-
income
economies
Bolivia (Pansera, 2012)
Ghana (Bawakyillenuo, 2012; Pode, 2013)
India (Palit, 2013; Pode, 2013)
Indonesia (Blum et al., 2013; Pode, 2013)
Lao PDR (Pode, 2013)
Nicaragua (Rebane and Barham, 2011)
Senegal (Thiam, 2011)
Sri Lanka (Palit, 2013)
Upper-middle-
income
economies
China (D’Agostino et al., 2011; Yuan et al., 2011)
High-income
economies
Austria (Brudermann et al., 2013; Koinegg et al., 2013)
Canada (Islam and Meade, 2013)
Germany (Huenteler et al., 2012)
Greece (Karteris and Papadopoulos, 2013)
Hong Kong (Zhang et al., 2012)
Italy (Ameli and Kammen, 2012)
Japan (Huenteler et al., 2012; Vasseur et al., 2013; Zhang et
al., 2011)
South Korea (Jeong, 2013)
Spain (Movilla et al., 2013)
The
Netherlands (Vasseur et al., 2013)
The UK (Gooding et al., 2013)
The US
(Drury et al., 2012; Gaul and Carley, 2012; Kwan,
2012; Rai and Robinson, 2013; Sarzynski et al., 2012;
Zhai and Williams, 2012; Zhai, 2013)
15 In 2013, the World Bank categorized countries by GNI per capita. This income categorization is as follows: low
income ($1,035 or less), lower middle income ($1,036 to $4,085) upper middle income ($4,086 to $12,615) and high
income ($12,616 or more) (WB, 2014).

32
3.2.1. ECO-INNOVATIONS
“Diffusion of eco-innovations” has recently become a common term in different scientific
communities. In the period 1990-2012, the number of publications that include the
synonyms of “diffusion of eco-innovations” reached a total of 1024 publications. Figure
12 shows that very little research on diffusion of eco-innovations was conducted in the last
decade of the last century. However, since 2000 the term has been used widely. Starting
from 2006 the relevant articles have strongly grown, as evidenced by 36% of these
publications were published in the period of 2008-2011. Furthermore, yearly publications
in the literature represent a growth of 64% from 2010 to 2011. However, and surprisingly,
only 18% of these publications cited Rogers (183 of 1024 publications). This trend was in
a similar manner in the last years: 24%, 14% and 22% of yearly publications in 2009,
2010 and 2011 cited Rogers respectively.
FIGURE 12. THE EVOLUTION OF RESEARCH ARTICLES RELATED TO "DIFFUSION OF ECO-INNOVATIONS"
The studies on diffusion of eco-innovations have particular research focuses on different
topics, such as the impact of environmental regulations on firm’s performance (Jaffe and
Palmer, 1997), performance measurement of environmental supply chain management
(Hervani et al., 2005) or impact of corporate social performance on firm financial
performance (Hull and Rothenberg, 2008). That said, related to diffusion of eco-
innovations, it is possible to identify some interdisciplinary research streams within three
disciplines (economics, sociology and management) and two traditional research fields
(marketing and agent based modeling).
0
20
40
60
80
100
120
140
160
180
1990
1992
1994
1996
1998
2000
2002
2004
2006
2008
2010
2012
Years
Nu
mb
er
of
Pu
bli
cati
on
s
Total Publications
that use the term
"Diffusion of eco-
innovations" and its
synonymsThose of that refer to
works of Everet
Rogers
33
Economics
The role of innovation in economic and social change is one the main focuses of
innovation studies, and it is especially analyzed by scholars with a background in
economics (Fagerberg et al., 2012). However, from an economic perspective, theoretical
and methodological approaches to understand eco-innovations are diverse: e.g., innovation
economics, environmental economics, ecological modernization, sustainable transitions
and lead markets. Innovation economics focus on entrepreneurship and innovations. This
research stream often studies the positive spillovers of both firms’ R&D activities and
diffusion phase of innovation (Rennings, 2000, p. 325). The environmental economics is
concerned with environmental and economical issues that are related to governmental
policies. The approach of ecological modernization (Jänicke, 2008) focuses on innovation
oriented environmental policy (regulations, incentives, policies, actors, etc.) and the
supply-side driving forces of diffusion of eco-innovations with the underpinnings of
sociological theory. The research stream of sustainability transitions focuses on long-term,
multi-dimensional and fundamental transformation processes through which established
socio-technical systems (sectors like energy supply, water supply, or transportation) shift
to more sustainable modes of production and consumption (Markard et al., 2012).
Sustainability transitions are about interactions between not only technology, policy and
economics but also culture and public opinion (Geels, 2011); therefore sustainability
transition can provide insights about the diffusion process of eco-innovations. Finally, the
lead market model focuses on the countries that are first in adopting an internationally
successful innovations and it can be applied for understanding the link between strict
regulation and creation of lead markets (Beise and Rennings, 2005). It potentially gives
insights about the dynamics of international diffusion of eco-innovations.
Sociology
The theory of diffusion of innovations (Rogers, 2003) might shed light on understanding
the social norms of adopters and the social values of societies affecting the diffusion of
eco-innovations. That said, this theory is not necessarily used by many scholars. There are
several studies on eco-innovations which are based on a variety of sociological
approaches. For example, the study of Spaargaren (2003) introduces an interesting
approach from environmental social sciences. This study brings the issues of sustainable
consumption and lifestyles by using the social practices model of sociology. The proposed

34
model indicates that diffusion of eco-innovations through citizen-consumers can be
increased when daily routines (clothing, food, shelter, travel, sport, and leisure) are taken
as a starting point for policymaking. On the other hand, the study of Ozaki (2011)
combines the theories of diffusion of innovations, cognitive and normative behaviour, and
consumption in order to understand the motivation factors of eco-innovation consumers by
focusing on the five factors: perceived benefits, social influence, perceived compatibility,
controllability and perceived uncertainty.
Management
The diffusion term in management of innovation is usually used for diffusion of
environmental innovations within the organizations, especially for environment friendly
practices. The adoption of Environmental Management Systems (EMS), a total quality
approach on management of organization's environmental programs, has taken much
attention of scholars. On the one hand, Florida and Davison (2001) discuss the factors that
make firms to adopt EMS, and Frondel et al. (2008a) research on the role of EMS for the
adoption of technical eco-innovations in firms. On the other hand, Wagner (2008) focuses
on the impact of EMS and environmental managerial activities on the probability of firms
to carry out eco-innovations.
The field of research in entrepreneurship, relevant for the management discipline, also
contributes the understanding for eco-innovations. In this field, the study of Hockerts and
Wüstenhagen (2010) reveals the relation between firm size and diffusion of eco-
innovations, theorizing the interplay between incumbents and new entrants.
Marketing
After the seminal work of Bass (1969), that presented the first purchase growth of a new
durable product in the market, the field of marketing has embraced a common research
tradition for diffusion of innovations. However, the study of Ottman et al., (2006) is one of
the few studies that focus on the concept of diffusion of eco-innovations. These authors
discuss on improved environmental quality and customer satisfaction in the concept of
green marketing. They indicate that three green marketing principles are important to
make green products desirable for consumers. These are consumer value positioning,
calibration of consumer knowledge, and credibility of product claims.

35
Agent Based Modeling
Agent based models refer to the models which consist of a set of agents that encapsulate
the behaviours of the various individuals that make up the system (Parunak and Savit,
1998). This research tradition, within the growing computational power, has been
increasingly applied to social and economic problems which were previously modeled
with nonlinear differential equations (Rahmandad and Sterman, 2008). Evolutionary
economics’ principles can also be formalized in the framework of agent based modeling as
well (Faber and Frenken, 2009).
There are many studies on agent based modeling of diffusion of eco-innovations. For
example, the study of Schwarz and Ernst (2009) is an empirical approach on agent-based
modeling of diffusion of environmental innovations. The implementation of this model is
based on differentiating individuals, communication, innovation characteristics and
decision algorithms. The study of Barthel et al. (2008) makes use of a multi-actor
simulation framework by simulating decision-making process of the relevant actors, while
Cantono and Silverberg (2009) develop a model of innovation diffusion that combines
contagion among consumers with heterogeneity of agents.
3.2.2. BARRIERS TO DIFFUSION OF SOLAR PV SYSTEMS
The barriers to the diffusion of solar PV systems could be categorized in four dimensions:
sociotechnical, management, economic and policy. As is widely known in diffusion
literature (e.g., Rogers, 2003), the adoption of innovations, such as renewable energy
technologies, is a complex process with several connected factors. Therefore, the
dimensions of these barriers are also interrelated and our categorization does not aim at a
rigid taxonomy.
Sociotechnical barriers
The quality of PV systems is of vital importance for adoption. It can be influenced by not
only the local conditions of the user’s environment (Müggenburg et al., 2012) but also the
political and financial arrangements (Palit, 2013) that may change from country to
country. A concrete example of such a phenomenon is given by Palit (2013). He mentions
that Bangladesh and India have better quality standards for PV systems, especially for
battery performance, than Sri Lanka. In China, there is a high level of dissatisfaction with

36
the low performance of SHS. Although such performance may be caused by not only
technical functionality but also improper usage, the dissatisfaction works against other
potential adopters purchasing PV systems. In addition, damaged PV systems were
common, which is partly due to having repair locations too far from the adopters
(D’Agostino et al., 2011). In Ethiopia, there is growing skepticism toward products
manufactured in Asia, especially those from China. Customers mistrust the goods and do
not want to purchase them. Instead, they prefer other products, even with a higher price
(Müggenburg et al., 2012).
The lack of adequate knowledge among both adopters and non-adopters is a crucial
barrier. Such lack of knowledge by adopters may result in improper usage and inability to
maintain the systems, as shown in China. This may create a negative perception and
prevent potential customers making a decision to adopt the systems (D’Agostino et al.,
2011). In the case of Nicaragua, rural inhabitants know too little about PV systems, which
can be one of the barriers for adoption (Rebane and Barham, 2011). It has also been shown
in previous research that the diffusion of new technologies in rural communities requires
more effort in tailoring the information and educating people (Sriwannawit, 2012). In
another case in the US, there is a lack of trust in the information that is widely and
publicly available among some adopters. They feel uncertain about technology
performance and lack information that is relevant to their individual cases (Rai and
Robinson, 2013). A study in Austria (Koinegg et al., 2013) also revealed that lack of
knowledge is not only a matter of adopter-side but also the supply-side. They argue that
architects and planners often have insufficient knowledge about the advantages of building
integrated PV systems. This is the reason why they do not offer such systems to the
potential adopters when planning a new building.
The perception of adopters has a large impact on their decision whether to adopt a new
technology or not. This is because the way that adopters perceive the complexity of
technology can impact their decision on adoption (Davis, 1989; Venkatesh, 2000). Several
studies investigated the diffusion process from the end-user’s point of view. A study in the
US showed that the residents were reluctant to adopt PV systems because of technology
risk and complexity. These barriers are, however, reduced when third-party ownership is
implemented (Drury et al., 2012). For areas that are already connected to the grid, the
perceived maintenance requirement can also be a barrier to adoption. In this case, the
customers have a choice to use electricity from the grid, which would not impose on them

37
any responsibility to operate and maintain the technology, unlike having their own PV
panels (Zhai and Williams, 2012). A survey study in China (Yuan et al., 2011) indicated
that the respondents perceive PV systems as having a low level of application. This can be
related to the lack of technology awareness. Some users are also concerned about the
complexity of the system, technological maturity, durability, efficiency, safety, and
stability. In addition, there are some attributes of PV systems that are perceived negatively
by the adopters. These are, for example, low battery storage and low power capacity.
Solar exposure is a basic requirement for functioning PV systems. Because the solar
exposure depends on the geographic location, so does the competitiveness of PV systems.
For example, the US energy portfolio varies across the country, making solar PV systems
more technically feasible in some particular areas. This is due to large variation in climatic
condition because the US covers a huge geographic area (Sarzynski et al., 2012). In the
areas without other sources of electricity in Ethiopia, adopter’s fear of non-functional
systems during the rainy season is also a barrier preventing their purchase (Müggenburg et
al., 2012). In some areas, PV systems face challenges from other competing technologies
that are more suitable to their geography. A study in China mentioned that the increasing
access to hydropower, as a means to provide electricity access in rural areas, has a
negative influence on the adoption of SHS (D’Agostino et al., 2011).
Society specific factors can also have an impact on the adoption. A comparative study
between Kenya and Tanzania by Ondraczek (2013) is an example of such a phenomenon.
The lack of awareness among users and other stakeholders in Tanzania is one of the
barriers to adoption. This lack of awareness is partly because of the geographical distance
from big cities to rural villages, which makes firms less willing or unable to reach the
market. Moreover, compared with the neighboring Kenyans, Tanzanians tend to be more
reluctant and skeptical toward new technologies. The author further explained that
education is another contributing factor, hindering the adoption of new technologies.
Because of its socialist history, Tanzania is assumed to lack an entrepreneurial culture.
There is also high complexity to doing business in Tanzania. In China (Yuan et al., 2011),
the lack of public awareness is apparent as a barrier to adoption. The Chinese are more
aware of solar water-heater technology than solar PV technology. This affects their
decision making on the adoption of PV systems in a negative way.

38
The architectural dimension of the areas is also an important factor that can become a
barrier to adoption. For urban areas like Hong Kong, a key barrier is an inadequate
installation space. PV panels need to be angled toward the right direction to maximize
solar exposure. For rooftop integration in Hong Kong, the surface is simply too limited in
old high-rise buildings. New buildings can, however, be designed to integrate PV systems
in their structure to maximize the installation space (Zhang et al., 2012). The physical
aspect of the city in terms of local building stock also has an impact on how much
electricity can be generated from rooftop PV systems. In several Scottish cities, tenements
are the preferred type of housing. The limited roof space on tenements results in less
electricity output compared with the output from cities that have large properties. This is a
limitation that is difficult to address by a policy mechanism (Gooding et al., 2013).
In the case of Bolivia as studied by Pansera (2012), the institutional dimension has been
one of the key barriers for rural applications. Bolivia relies substantially on foreign
financial aid. The country cannot easily design and execute renewable energy policy
without international cooperation. However, despite the strong involvement, the
international actors pose limitations. First of all, they lack the methodology to identify
local needs. They also lack technical, human, and financial resources to tackle big projects
in rural areas, which means that they are unable to achieve high impact. On the other hand,
the private sector has little interest in this market. Missing a systematic vision of the local
situation, these foreign actors want to implement one solution in all contexts, which is not
possible. In several cases, the international counterparts also reveal political vested
interests, e.g., establishing their products in a new market or acquiring privileged access to
local natural resources. Moreover, local education, i.e., university research, is neglected,
which prevents local capability building. In the case of Senegal studied by Thiam (2011),
the institutional dimension has also been identified as a barrier. Institutional reliability can
encourage or discourage private sector involvement to create dynamics for them to utilize
skills and knowledge in this market. The institutions also help increasing collaboration
among related actors to work together to achieve larger diffusion. In Senegal, this is not
yet the case.
Another barrier can arise from the applicability of PV technology to individual cases. One
study conducted in Ghana showed that the capacities of the system are too high for the
affordability of target adopters. Only high wattage systems are available in the market and
they are sold only as a whole package. This is too costly for low-income adopters

39
(Bawakyillenuo, 2012). In the lower-income markets, it has been shown that repackaging
the products in small portions can facilitate the sale because it matches with their
affordability (Prahalad, 2010).
Without demand, diffusion will be impeded. In some remote areas, lack of demand for
electricity is a barrier to the adoption of PV systems. Here, we distinguish the reasons for
the lack of demand into two types. First, it is due to the lack of electricity-related
activities. In the low-income markets, some people have recently started to use household
electrical appliances. For example, in the case of Tanzania, TV signals came rather late
(Ondraczek, 2013). In Ethiopia, there are not many additional activities during night time
that its inhabitants can do with the help of electricity access because most people are
illiterate (Müggenburg et al., 2012). Second, it is due to the lack of customer base. In
Tanzania, the market lacks customers from the rural middle and upper class who have
purchasing power for PV systems and at the same time need electricity (Ondraczek, 2013).
Without demand, the market cannot grow. In addition, lack of demand may arise from
different demographic factors. Some studies showed that low education levels, which can
be correlated with income level (Lay et al., 2013), and low purchasing power, which can
be correlated with age groups (Kwan, 2012), negatively influence the adoption of PV
systems.
Management barriers
Insufficient and inappropriate management is one of the main barriers in the diffusion of
new technology, not least for PV systems, especially when they are used in rural contexts.
One of the main management barriers is the inappropriate company business portfolio for
the target market. When a PV system is utilized to supply electricity access in rural areas
in low-income economies, different business strategies should be implemented (see e.g.,
Palit, 2013; Pode, 2013) compared with the high-income economies where it is often used
as an alternative power supply. In addition, implementing similar business models as for
urban usage is not applicable in rural settings because of several conditions that
differentiate this market from the higher income adopters (Prahalad, 2010). Appropriate
financial schemes are required for the low-income markets. These are, for example, fee-
for-service and microcredit (Pode, 2013). Financial schemes are important, as discussed
previosly, and the companies should consider such schemes when entering the PV market.
In addition, the study by Koinegg et al. (2013) also showed that effective and appropriate
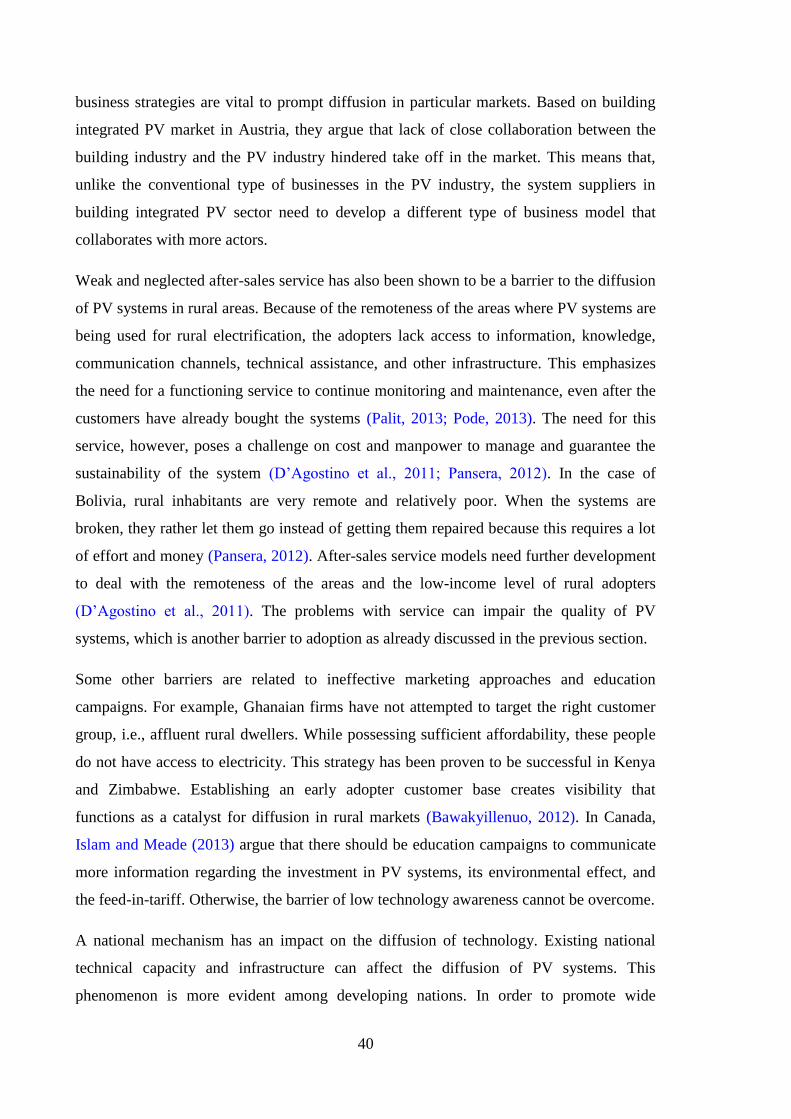
40
business strategies are vital to prompt diffusion in particular markets. Based on building
integrated PV market in Austria, they argue that lack of close collaboration between the
building industry and the PV industry hindered take off in the market. This means that,
unlike the conventional type of businesses in the PV industry, the system suppliers in
building integrated PV sector need to develop a different type of business model that
collaborates with more actors.
Weak and neglected after-sales service has also been shown to be a barrier to the diffusion
of PV systems in rural areas. Because of the remoteness of the areas where PV systems are
being used for rural electrification, the adopters lack access to information, knowledge,
communication channels, technical assistance, and other infrastructure. This emphasizes
the need for a functioning service to continue monitoring and maintenance, even after the
customers have already bought the systems (Palit, 2013; Pode, 2013). The need for this
service, however, poses a challenge on cost and manpower to manage and guarantee the
sustainability of the system (D’Agostino et al., 2011; Pansera, 2012). In the case of
Bolivia, rural inhabitants are very remote and relatively poor. When the systems are
broken, they rather let them go instead of getting them repaired because this requires a lot
of effort and money (Pansera, 2012). After-sales service models need further development
to deal with the remoteness of the areas and the low-income level of rural adopters
(D’Agostino et al., 2011). The problems with service can impair the quality of PV
systems, which is another barrier to adoption as already discussed in the previous section.
Some other barriers are related to ineffective marketing approaches and education
campaigns. For example, Ghanaian firms have not attempted to target the right customer
group, i.e., affluent rural dwellers. While possessing sufficient affordability, these people
do not have access to electricity. This strategy has been proven to be successful in Kenya
and Zimbabwe. Establishing an early adopter customer base creates visibility that
functions as a catalyst for diffusion in rural markets (Bawakyillenuo, 2012). In Canada,
Islam and Meade (2013) argue that there should be education campaigns to communicate
more information regarding the investment in PV systems, its environmental effect, and
the feed-in-tariff. Otherwise, the barrier of low technology awareness cannot be overcome.
A national mechanism has an impact on the diffusion of technology. Existing national
technical capacity and infrastructure can affect the diffusion of PV systems. This
phenomenon is more evident among developing nations. In order to promote wide

41
adoption, countries need to build technical capacity. In comparison with Kenya and
Zimbabwe, Ghana has fewer PV companies and technicians. There are also fewer
subsidiary institutions to support the PV industry, which impedes adoption of the
technology (Bawakyillenuo, 2012). In Tanzania, a national supply chain is difficult to
undertake because of the inadequate transport infrastructure. This leaves remote areas
underserved and the PV market concentrates around big cities (Ondraczek, 2013). A study
comparing Japan and the Netherlands by Vasseur et al. (2013) showed that Japan has a
better technological innovation system to support the PV industry. In the Dutch case, there
is a lack of collaboration and knowledge exchange between researchers and policy makers
with adopters. The Dutch case also lacks human and financial resources to stimulate the
PV market. Lastly, Thiam (2011) argues that in the electricity market, fossil fuels are
much more mature than PV technology. This prevents PV systems from being an
attractive choice for customers. However, renewable energy tariffs that are set by the
government can help in overcoming this immature market barrier. This national level of
the barrier is highly associated with policy aspects that we discuss further under in the
sub-section of policy barriers.
Economic barriers
The adoption of PV systems faces several economic barriers. These barriers can be in
different forms, based on both time and location. As is known in the literature on
innovations, the cost of an innovation usually decreases with time (e.g., Spence, 1981) and
can vary depending on the location (Karakaya et al., 2014b).
Economic barriers are usually related to the high cost of solar PV modules. The diffusion
of PV systems is also affected by the cost of other energy sources in the region (Sarzynski
et al., 2012) because the potential adopters might have to choose between PV systems and
conventional sources of energy. If the costs of competing sources are low, these can
constitute a barrier to PV adoption. The lower the installation cost of PV systems, the
more likely that people will adopt them. As a result, high costs for investment in PV
systems are often perceived as a barrier to adoption, e.g., in China (Yuan et al., 2011) and
Japan (Zhang et al., 2011). The high costs of PV installation are mentioned in many
studies that are based in several countries, such as South Korea, Greece, and the US (Gaul
and Carley, 2012; Jeong, 2013; Karteris and Papadopoulos, 2013; Sarzynski et al., 2012).
Examples are spread over both off-grid, e.g., in Ethiopia (Müggenburg et al., 2012) and

42
Senegal (Thiam, 2011) and on-grid applications, e.g., in Italy (Ameli and Kammen, 2012)
and the US (Zhai and Williams, 2012). These discussions also include third-party owners
(Drury et al., 2012). In addition, the perception on the high cost of PV systems can vary.
Koinegg et al. (2013) argue that the perceived cost of PV systems can be a barrier to
adoption. For building integrated PV systems, the cost is not necessarily as high as
commonly perceived.
The study by Karteris and Papadopoulos (2013) shows how the barriers can be bound to
the particular local situation. Based on the Greek case under economic crisis, the authors
mention the unwillingness of banks to fund medium- or long-term investments, including
investments for PV systems. In addition, the shrinking economy results in reducing
electricity demand and reducing interest in PV systems. A study in Ghana
(Bawakyillenuo, 2012) also revealed the importance of the local context on understanding
the barriers. The political instability in Ghana, which lasted over a period of several
decades, resulted in turbulent economic growth. In 1966, the military government expelled
most foreign nationals who worked in the retail business. This imposed insecurity for
foreigners. The situation did not create an attractive environment for foreign direct
investments in PV technology, preventing the fostering of PV systems in the Ghanaian
market (Bawakyillenuo, 2012). A study by Pansera (2012) also emphasized the
importance of the local situation. In rural areas of Bolivia, people cannot financially afford
to fix the components of PV systems if needed. This means that the economic cost of
maintenance of the PV technology can also be a barrier to the sustainability of adoption,
especially because of poverty.
Based on the cases of off-grid systems in Kenya and Tanzania, Ondraczek (2013)
analyzed the residential SHS applications with a minor reference to other types such as
small-scale commercial applications (including kiosk or mobile phone) and social
institutions. In such a context, he conceptualized low purchasing power as a barrier to
adoption. Based on several developing countries in Asia and Sub-Saharan Africa, Pode
(2013) emphasized economic affordability as a barrier to the diffusion of SHS in rural
areas. The author incorporated this barrier in terms of high total cost, high up-front price,
and payment inflexibility. In line with Pode (2013), Lay et al. (2013) identified the low
income level of households to be a barrier for the adoption of SHS in Kenya. Moreover, a
study by Komatsu et al. (2011) indicated that income alone cannot explain the SHS

43
adoption in Bangladesh. In this study, they emphasize that non-income factors can also be
crucial for the households’ decision making.
The study by Bawakyillenuo (2012) focused on the diffusion of PV systems in Kenya and
Zimbabwe and aimed to deduce policy recommendations for the Ghanaian case. As a
synopsis of such a comparison, the lack of international donor funding for PV systems
seems to be a barrier for diffusion to take off. In this manner, Palit (2013) incorporated the
lack of suitable financing mechanism as the most significant barrier, based on a
comparative study of off-grid systems in several South Asian countries. In the case of
Hong Kong for both on- and off-grid systems, Zhang et al. (2012) also mentioned the high
initial costs, high repair costs, and long payback period as barriers to adoption.
D’Agostino et al. (2011) discussed China’s Renewable Energy Development Project for
SHS. They mention the inadequate government subsidy and the mismatch between
consumer demand and certification program. In the case of off-grid systems in Nepal,
Mainali and Silveira (2011) discussed the large financial gap between the electrification
cost and the level that people can afford. Such a mismatch can be perceived as a barrier.
Brudermann et al. (2013) discussed the on-grid applications of PV systems in Austrian
agriculture. They identified two kinds of financial problems: the high investment needed
for PV installation and uncertainties in the funding process.
Policy barriers
In conjunction with their high price, PV systems are usually not profitable without policy
support in many countries. In this manner, policy measures are of vital importance for
rapid diffusion of environmentally friendly innovations including PV systems (e.g.,
Jacobsson and Lauber, 2006; Rennings, 2000).
At the moment, most countries have a variety of policy measures to support renewable
energies. However, in some cases, existing policy support can be removed, causing a
shock effect in the market. The case of Spain is one example of such a phenomenon.
Movilla et al. (2013) incorporated such a barrier when studying the Spanish case of
diffusion of PV systems. In a similar manner for Austria, Brudermann et al. (2013) also
mentioned the negative impact of the reduction of subsidized feed-in tariffs on adoption.
Insufficient and ineffective policy support is often mentioned as a barrier in several studies
in different contexts, e.g., in the Netherlands (Vasseur et al., 2013) and the US (Kwan,

44
2012; Zhai, 2013). For example, Vasseur et al. (2013) indicate the influence of
inconsistent national subsidy schemes in the Netherlands, which can discourage
entrepreneurs from investing in PV systems. In the South Korean case of micro-generation
as studied by Jeong (2013), policy support also exists but some potential adopters still do
not want to install PV systems. This is because the benefits of adopting PV systems are
not more than the costs. In this case, the potential adopters prefer direct subsidies instead
of low-interest loans. Such a mismatch between demand and policy measures can also be
observed in the case of some UK cities, where the policy measures do not correspond to
the socioeconomic factors (Gooding et al., 2013). Huenteler et al. (2012) analyzed market
development paths in Japan and Germany and subsequently deduced policy
recommendations for Japan. They argue that, for an effective renewable energy policy, the
government should reduce the impact of industry interest on regulatory structure because
it can impede the diffusion process. In this diverse discussion, they also mention three
important barriers: non-institutionalizing on feed-in tariff revision, challenges on
overcoming bureaucratic boundaries, and difficulties in establishing a well-coordinated
policy mix. Such insufficient feed-in tariff schemes are also mentioned in the study by
Karteris and Papadopoulos (2013), which is based on on-grid systems in Greece. In the
same manner, the type of policy is also crucial. For example, Sarzynski et al. (2012)
demonstrated that those states offering cash incentives as policy support experienced
faster diffusion of grid-tied PV technology than the states without cash incentives. With a
strong focus on the solar renewable electricity certificate market, Gaul and Carley (2012)
analyzed the case of North Carolina in the US and deduced lessons from this case. They
mention the lack of transparency in the certificates, which can be incorporated as a barrier
to the adoption of PV systems. In another study (D’Agostino et al., 2011), the negative
influence of insufficient subsidies was also mentioned, highlighting the mismatch between
consumer demand and certification program for SHS in China.
Three studies (Brudermann et al., 2013; Pansera, 2012; Zhang et al., 2012) pay attention to
the importance of cooperation and participation of the stakeholders in energy policy
development. Based on the case of Hong Kong for both on- and off-grid systems, Zhang et
al. (2012) incorporated the lack of participation of stakeholders/community in energy
policy planning and lack of incentives to support the adoption as important barriers. In the
same manner, Brudermann et al. (2013) emphasized the negative effects of non-
cooperative building experts, issues with building permits, and the decision process in

45
regional governments, which takes too much time for grant notification. In addition,
Pansera (2012) conceptualized the lack of innovation policy strategy as a barrier in Bolivia
and suggested a better coordination between stakeholders at the national level.
Although some policies in low-income economies target off-grid applications, some
potential adopters still prefer to wait for the grid extension rather than adopting off-grid
PV systems. This means that adopter’s future expectations can become a barrier in some
cases. This was observed by Bawakyillenuo (2012), who analyzed the case of Ghana in
comparison with Kenya and Zimbabwe. However, Lay et al. (2013) found that grid
extension does not necessarily prevent the adoption of SHS in Kenya. This is because SHS
can be sometimes considered as a complementary energy source.
In some cases, policy support for other sources of energy production can be a barrier to the
adoption of PV systems. An example of such a phenomenon can be seen in the study by
Blum et al. (2013). In this study, they analyzed the cost competitiveness of renewable
energy technologies in Indonesia, mentioning that fossil fuel subsidies make a PV system
less competitive. As a consequence, there is a lack of private investment in the PV sector.
3.2.3. THE GERMAN CASE
The drivers, barriers and challenges of the diffusion of PV systems in Germany have been
extensively discussed in the literature. Early studies focused on the institutional and
political challenges behind the diffusion that had occurred before 2004, the year the
German National Renewable Energy Act (EEG) was amended. Jacobsson and Johnson
(2000) developed an analytical framework examining the diffusion of renewable energy
technologies, based on illustrative examples from Sweden and Germany. From a
technological system perspective, they pointed out the importance of actors, networks and
institutions on the successful transition to renewable energy technologies. In a later study,
Jacobsson and Bergek (2004) also explained the success and failures in such transitions,
analyzing the diffusion of renewable energy sources in Netherlands, Sweden and
Germany. They identified the three major challenges that policy makers faced: difficulties
in foreseeing the outcome of policy intervention; the long time scale of the diffusion
process; and the political struggle to overcome the opposition from incumbent actors.
Another study, focusing only on the German case (Jacobsson and Lauber, 2006),
described the formation of political support for renewable energies as a “battle over

46
institutions”. In this case, the regulatory frameworks supporting wind energy and PV
systems in Germany faced the opposition from both coal and nuclear interests.
Later studies have discussed some new aspects on the PV market in Germany. On the one
hand, Frondel et al. (2008b) criticized the feed-in-tariff scheme of the EEG, pointing out
the inefficiency of this scheme on greenhouse gas abatement. Rather than supporting the
adopters of PV systems with the feed-in-tariff, they instead recommended policy makers
support the PV panels’ production. On the other hand, Laird and Stefes (2009) discussed
the German EEG as a role model for the USA. They identified the decades-long
substantial political change as a driving factor on diffusion of PV systems, putting much
stress on the positive effect of historical contingencies for the German success. In
addition, Dewald and Truffer (2011) explained the importance of substructures in the
market, identifying the different market segments of PV systems showing various patterns
of diffusion. In addition, Leepa and Unfried (2013) studied the effects of feed-in tariff
adjustments on diffusion of PV systems in Germany. They had two main conclusions.
First, they argued that the feed-in tariff in Germany, which declined from 0.39 €/Kwh in
2009 to 0.22 €/Kwh in the early 2012, still supported the diffusion. Second, in order to
meet governmental targets in future, the authors recommended alternative ways of
adjustments regarding the feed-in tariff.
3.3. THE MULTI-LEVEL PERSPECTIVE
3.3.1. MICRO LEVEL DIFFUSION
Micro level of diffusion happens at adopter level. Adopters are the individuals or other
units of adoption that make the decision to adopt the innovation (Rogers, 2003). Any
individual can be a potential adopter, however, not all potential adopters necessarily
decide to embrace the innovation at any certain point of time. The diffusion rate of
innovations, which is the ratio of current number of adoptions to the total number of
potential adoptions, is mainly based on the attributes of an innovation as perceived by
potential adopters. Rogers (2003) deduces these attributes to relative advantage (the
degree to which an innovation is perceived to be better than the other), compatibility (the
degree to which an innovation is perceived as being consistent with the existing values),
complexity (the degree to which an innovation is perceived as being relatively difficult to
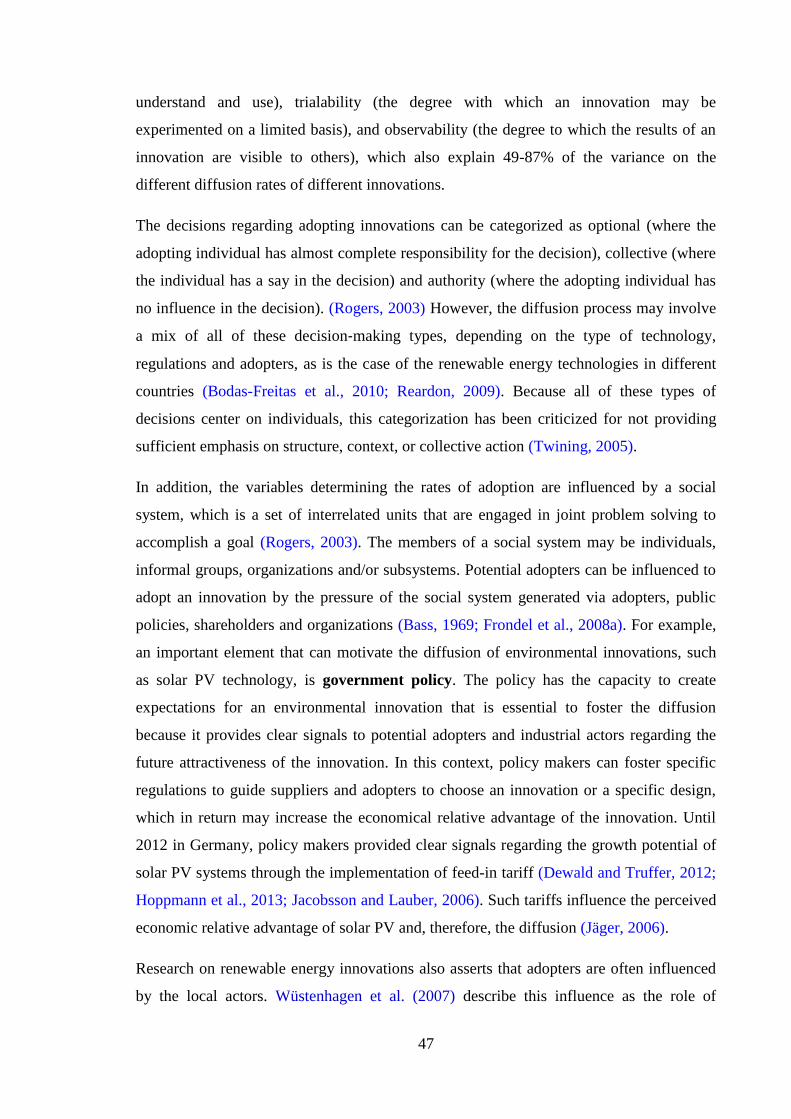
47
understand and use), trialability (the degree with which an innovation may be
experimented on a limited basis), and observability (the degree to which the results of an
innovation are visible to others), which also explain 49-87% of the variance on the
different diffusion rates of different innovations.
The decisions regarding adopting innovations can be categorized as optional (where the
adopting individual has almost complete responsibility for the decision), collective (where
the individual has a say in the decision) and authority (where the adopting individual has
no influence in the decision). (Rogers, 2003) However, the diffusion process may involve
a mix of all of these decision‐making types, depending on the type of technology,
regulations and adopters, as is the case of the renewable energy technologies in different
countries (Bodas-Freitas et al., 2010; Reardon, 2009). Because all of these types of
decisions center on individuals, this categorization has been criticized for not providing
sufficient emphasis on structure, context, or collective action (Twining, 2005).
In addition, the variables determining the rates of adoption are influenced by a social
system, which is a set of interrelated units that are engaged in joint problem solving to
accomplish a goal (Rogers, 2003). The members of a social system may be individuals,
informal groups, organizations and/or subsystems. Potential adopters can be influenced to
adopt an innovation by the pressure of the social system generated via adopters, public
policies, shareholders and organizations (Bass, 1969; Frondel et al., 2008a). For example,
an important element that can motivate the diffusion of environmental innovations, such
as solar PV technology, is government policy. The policy has the capacity to create
expectations for an environmental innovation that is essential to foster the diffusion
because it provides clear signals to potential adopters and industrial actors regarding the
future attractiveness of the innovation. In this context, policy makers can foster specific
regulations to guide suppliers and adopters to choose an innovation or a specific design,
which in return may increase the economical relative advantage of the innovation. Until
2012 in Germany, policy makers provided clear signals regarding the growth potential of
solar PV systems through the implementation of feed-in tariff (Dewald and Truffer, 2012;
Hoppmann et al., 2013; Jacobsson and Lauber, 2006). Such tariffs influence the perceived
economic relative advantage of solar PV and, therefore, the diffusion (Jäger, 2006).
Research on renewable energy innovations also asserts that adopters are often influenced
by the local actors. Wüstenhagen et al. (2007) describe this influence as the role of

48
technology cooperation on the diffusion, at which several actors (technicians, industry
representatives, local companies etc.) take an active role in eliciting the adoption. This
actors, in general, corresponds to what Rogers (2003) conceptualize as the efforts of
change agents. A change agent is an individual (or institution) that influences the
decisions of potential adopters in a desirable direction. In the case of renewable energy
innovation, the studies on the PV systems in Germany (Dewald, 2008) and wood-fuelled
heating systems in Austria (Madlener, 2007) have revealed that there is a vast variety of
change agents, which depends on the space-specific context and particular innovation.
The adoption of renewable energy is also boosted by the adoption of previous adopters,
i.e., peer effects. In general, potential adopters are often influenced by what they see and
hear from their peers. The peer effects has received a lot of attention from scholars
analyzing the academic and health practices (e.g. Trogdon et al., 2008; Zimmerman,
2003). In the case diffusion of PV systems, several scholars (e.g. Bollinger and
Gillingham, 2012; Graziano and Gillingham, 2014; Müller and Rode, 2013) have also
asserted that the peers, who have already adopted the PV systems in the same
neighborhood, increase the diffusion rate among potential adopters. This resonates quiet
well with the recent work of Pentland (2014) on social physics. He emphasizes that
innovations and good ideas spread faster if the peers have regular physical, e.g. face-to-
face, interactions. In a well-connected global world, although the potential PV adopters
might have tight virtual connections with their peers from other regions, the most of
physical interactions takes place in the local neighborhoods. As Graziano and Gillingham
(2014) also argue, such spatial dimension is especially critical for innovations that have
both private and public good characteristics, e.g. solar PV systems.

49
Some empirical studies have emerged and have focused on understanding the adopter-
specific factors that influence the diffusion rate of solar PV systems. These factors could
be endogenous, originating internally from the adopters, or exogenous, originating
externally (e.g. from the climatic and physical conditions), or sometimes a mix of both
types. Several scholars conceptualized such factors through a variety of constructs: desire
to be independent from the electricity supplier, familiarity with the technology, religion,
education, housing investment of per capita, income level, climatic conditions, limited
roof space and environmental problem awareness (Balcombe et al., 2014; Jäger, 2006;
McEachern and Hanson, 2008; Peter et al., 2002; Zhang et al., 2012, 2011).
3.3.2. BUSINESS MODELS
Penrose (2009, p. 12), in her seminal work, defines the primary economic function of an
industrial firm as “making use of productive resources for the purpose of supplying goods
and services to the economy in accordance with plans developed and put into effect within
the firm”. In the renewable energy sector, the activities of firms not only result in
supplying goods and services but also in the creation of new knowledge and the
development of different types of designs (Jacobsson and Bergek, 2004). The firms are
important stakeholders in the development of renewable energy policies, and therefore,
they try to influence the political decisions about the design of financial support systems
and the grid access (Wüstenhagen et al., 2007, p. 2686). For example, in Germany, the
energy utility firms are well- known for their effective lobbying strategies for renewable
energy, such as, regular and personal maintenance of contact to politicians and forming a
policy network through associations (Sühlsen and Hisschemöller, 2014).
For the micro level analysis of diffusion, firms could be conceptualized as change agents,
which influence the opinion of potential adopters. For the meso level analysis, firms could
be conceptualized as actors or complementary inputs. Whether the analysis is at micro or
meso level, local solar firms are often identified as important drivers of the diffusion of
solar PV systems. For example, in the case of PV systems in Germany, Dewald and
Truffer (2012) identified that local solar firms stimulated rapid diffusion and market
formation. They argued that the successful diffusion is not only driven by the strong
policy support and favorable geophysical conditions, but also by the market formation
activities of local solar firms. This is in line with the study of Fabrizio and Hawn (2013)
which analyzed the role of local solar companies in the USA. Conceptualizing the local

50
firms as complementary inputs, they identified that local firms do function as important
drivers of diffusion of PV systems.
In the renewable energy research, there is a growing interest in understanding the business
models of the firms. A business model is the story of how the firm work and conduct
business (Magretta, 2002, p. 4), explaining how a firm creates economic value
(Chesbrough and Rosenbloom, 2002). The model might evolve over time and can be
described though the factors related to offering, market, strategy, internal capability,
competition and investor (Morris et al., 2005). Table 4 presents these factors and the
corresponding questions.
TABLE 4. BUSINESS MODEL COMPONENTS16
Component Questions that underlie a business model
1. Factors related the
offering
How do we create value?
2. Market factors Who do we create value for?
3. Internal capability
factors
What is our source of competence?
4. Competitive strategy
factors
How do we competitively position ourselves?
5. Economic factors How we make money?
6. Personal/investor factors What are our time, scope, and size ambitious?
The factors related to the offering describe the scope of the product or service offered by
the company. This addresses the value proposition and creation. The value can be in
different forms, including economic or social (Zott et al., 2011, p. 1029). Market factors
are related to the scope of the market within whihc the company competes; as well as the
nature and geographic dispersion of the customers (Morris et al., 2005). The business
model of a company focuses on a specified market segment or a group of customers
(Chesbrough and Rosenbloom, 2002). Internal capability factors are the source of
competence, which can come from various aspects such as production, selling, marketing,
supply chain management or creative capability (Morris et al., 2005). Competitive
16 (from Morris et al., 2005)

51
strategy factors formulate how the firm gains advantage over rival companies. For
example, competitive advantage can be gained by managing environmental innovations
(Shrivastava, 1995). Economic factors provide the logic behind earning profits. The
business model estimates the profit potential of the offering, based on value chain
(Chesbrough and Rosenbloom, 2002). Personal/investor factors are based on the
investment model of the company. Morris et al. (Morris et al., 2005) give some examples
of such models, including the subsistence model, aiming to meet basic standards to
survive; the income model, restricted by a stable income stream; the growth model,
targeting re-investment and growth; and finally, the speculative model, with the goal of
demonstrating of venture potential and selling out.
The research on product life cycle (see e.g. Anderson and Zeithaml, 1984; Rink and Swan,
1979) and, more recently, business model innovation (e.g. Chesbrough, 2010; Markides,
2013; Sosna et al., 2010; Trimi and Berbegal-Mirabent, 2012) sheds light on why and how
the firms change their business strategies and models. Underpinned by the dynamics of
diffusion patterns, the research on product life cycle (see Day, 1981; Rink and Swan,
1979) explains the interrelation between temporal stages on the sales revenues of
companies and the change in business strategies. In line with the s-curve of diffusion, the
temporal stages of the life-cycle of a product have often been identified as introduction,
growth, maturity and decline (e.g., Anderson and Zeithaml, 1984). At the declining stage,
companies face declining revenues, and the functional focus of companies moves from
marketing/logistics to finance (Hofer, 1975). However, such decline can sometimes result
in re-incline (Rink and Swan, 1979, p. 222). Both decline and incline often induces
companies to revise their business strategies (Anderson and Zeithaml, 1984).
In the context of renewable energy sector, Wüstenhagen and Menichetti (2012) argue that,
the firms are more likely to be influenced by the unexpected risks and opportunities
created by policy makers. Empirical studies on energy policy have analyzed the business
models in different sectors, e.g. in solar thermal energy (e.g. Okkonen and Suhonen,
2010), electrical cars (e.g. Kley et al., 2011), algae biofuel (e.g. Nair and Paulose, 2014)
and biomass heat and power (e.g. Pantaleo et al., 2014). Some other studies have also
analyzed the case of solar PV systems. For example, Loock (2012) studied the business
model preferences of 249 investment managers for renewable energy innovations,
including solar PV systems. This study argued that service-centered business models are
more favorable among investment managers. Huijben and Verbong (2013) studied the PV
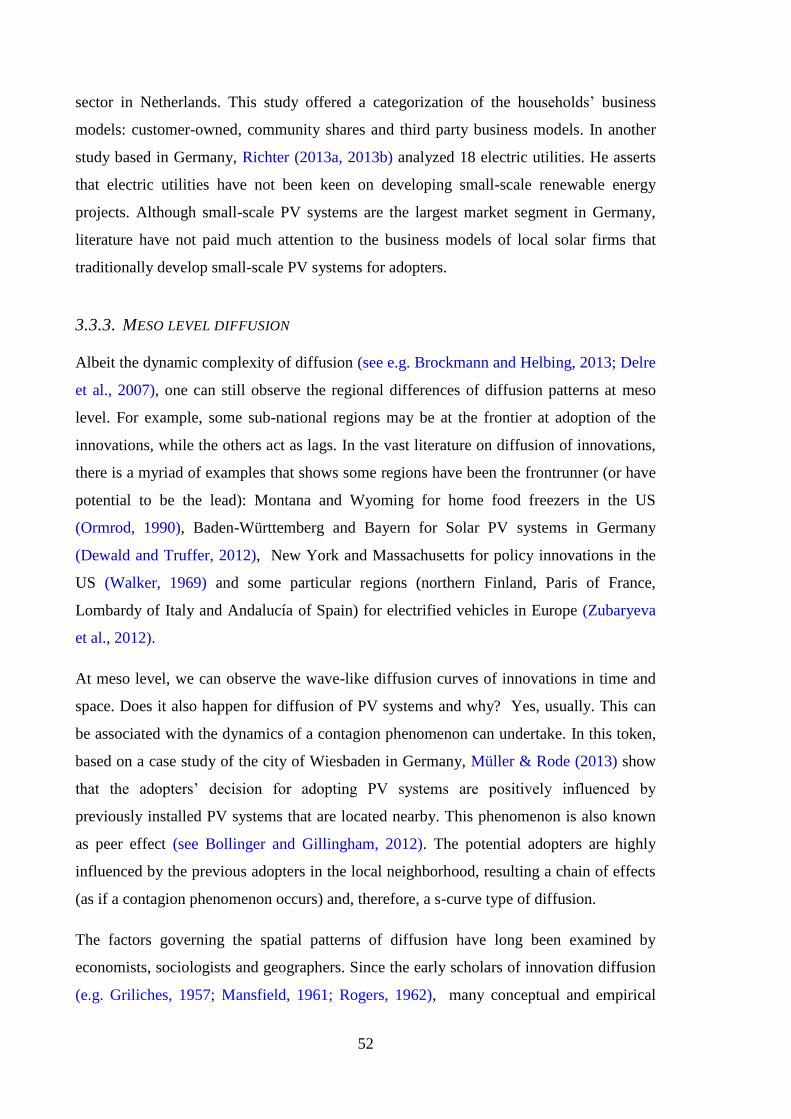
52
sector in Netherlands. This study offered a categorization of the households’ business
models: customer-owned, community shares and third party business models. In another
study based in Germany, Richter (2013a, 2013b) analyzed 18 electric utilities. He asserts
that electric utilities have not been keen on developing small-scale renewable energy
projects. Although small-scale PV systems are the largest market segment in Germany,
literature have not paid much attention to the business models of local solar firms that
traditionally develop small-scale PV systems for adopters.
3.3.3. MESO LEVEL DIFFUSION
Albeit the dynamic complexity of diffusion (see e.g. Brockmann and Helbing, 2013; Delre
et al., 2007), one can still observe the regional differences of diffusion patterns at meso
level. For example, some sub-national regions may be at the frontier at adoption of the
innovations, while the others act as lags. In the vast literature on diffusion of innovations,
there is a myriad of examples that shows some regions have been the frontrunner (or have
potential to be the lead): Montana and Wyoming for home food freezers in the US
(Ormrod, 1990), Baden-Württemberg and Bayern for Solar PV systems in Germany
(Dewald and Truffer, 2012), New York and Massachusetts for policy innovations in the
US (Walker, 1969) and some particular regions (northern Finland, Paris of France,
Lombardy of Italy and Andalucía of Spain) for electrified vehicles in Europe (Zubaryeva
et al., 2012).
At meso level, we can observe the wave-like diffusion curves of innovations in time and
space. Does it also happen for diffusion of PV systems and why? Yes, usually. This can
be associated with the dynamics of a contagion phenomenon can undertake. In this token,
based on a case study of the city of Wiesbaden in Germany, Müller & Rode (2013) show
that the adopters’ decision for adopting PV systems are positively influenced by
previously installed PV systems that are located nearby. This phenomenon is also known
as peer effect (see Bollinger and Gillingham, 2012). The potential adopters are highly
influenced by the previous adopters in the local neighborhood, resulting a chain of effects
(as if a contagion phenomenon occurs) and, therefore, a s-curve type of diffusion.
The factors governing the spatial patterns of diffusion have long been examined by
economists, sociologists and geographers. Since the early scholars of innovation diffusion
(e.g. Griliches, 1957; Mansfield, 1961; Rogers, 1962), many conceptual and empirical

53
studies have examined not only the role of spatiotemporal variables in influencing the
wavelike patterns of diffusion (e.g. Berger, 2001; Graziano and Gillingham, 2014;
Hägerstrand, 1967; Haynes et al., 1977) but also the complex dynamics of diffusion in
multi-scale networks (Brockmann and Helbing, 2013; Delre et al., 2007). Albeit the
dynamic complexity of diffusion (see e.g. Brockmann and Helbing, 2013; Delre et al.,
2007), one can still observe the regional differences of diffusion patterns at the sub-
national level. For example, some sub-national regions may be at the frontier at adoption
of the innovations, while the others act as lags. In the vast literature on diffusion of
innovations, there is a myriad of examples that shows some regions have been the
frontrunner (or have potential to be the lead): Montana and Wyoming for home food
freezers in the US (Ormrod, 1990), Baden-Württemberg and Bayern for Solar PV systems
in Germany (Dewald and Truffer, 2012), New York and Massachusetts for policy
innovations in the US (Walker, 1969) and a few regions (northern Finland, Paris of
France, Lombardy of Italy and Andalucía of Spain) for electrified vehicles in Europe
(Zubaryeva et al., 2012).
Recent literature on sustainable transitions, which analyze the systematic shifts for the
adoption of environmental innovations in a variety of areas including renewable energy,
has paid attention to the importance of sub-national regions and spatial dimension. For
example, Coenen et al. (2012) criticize the majority of previous literature for being unable
to reflect on the space-specific contexts. In the same line, Truffer and Coenen (2012)
argue that there is a lack of regional studies on sustainable transitions. In order to fill this
gap, they extend an invitation for research on cities and regions. Addressing this need,
some recent studies shed light the understanding of space on sustainable transition, with a
special focus on the actors, networks and institutions (e.g. Binz et al., 2014; Smith et al.,
2014). However, little systematic attention has been paid to the demand side of sustainable
transitions, i.e., diffusion dynamics at sub-national level.
Beise’s (2004, 2001) lead market model is one of the most comprehensive concepts,
shedding light on the role of demand-side factors on diffusion of environmental
innovations (see Quitzow et al., 2014). Anchored in the demand advantage of Porter’s
(1990) diamond model, the lead market concept deduces the international diffusion of
innovations to the five interrelated innovation-specific attributes of regions: cost
advantage (factors related to price decreases), demand advantage (conditions related to
anticipation of the benefit of an innovation), transfer advantage (conditions that increase

54
the perceived benefit of innovation by foreigners), export advantage (factors that support
the inclusion of foreign demand preferences) and market structure advantage (conditions
that increase the level of competition) (Beise, 2001, p. 85). Yet, the model has been used
in a lot of conceptual and empirical studies, analyzing the global diffusion of innovations,
traditionally at the country-level (e.g. Beise and Rennings, 2005; Cleff et al., 2009;
Horbach et al., 2014; Jacob et al., 2005; Tiwari and Herstatt, 2012; Walz and Köhler,
2014). However, as Beise (2001, pp. 125–126) already outlines, lead markets can be sub-
national regions. Beise (2004, 2001) argues that if particular regions, that have higher
advantages in these five attributes, adopt an innovation, the diffusion can spread to other
regions rapidly (see Figure 13).
FIGURE 13. PENETRATION RATE IN PERCENT17
The first of these attributes is cost advantage, which is mostly based on economies of
scale through mass production (Beise, 2004). The cost of an innovation can vary in a
country depending on local characteristics such as transportation infrastructure,
availability of suppliers, natural resources, regional policies or availability of
complementary goods. For example in Egypt, southern coastal region has the lowest costs
of electricity delivered by an off-grid PV (Szabó et al., 2011). In the USA, the lowest
levelized cost of wind energy is in the Midwest region (Lazard, 2013). In some cases,
spatial characteristics implicitly influence the relative affordability of an innovation. A
case in point is the adoption rate of residential air conditioning, which depends also on the
17 (adopted from Beise 2004)
lead market
lag markets
lag markets
Pen
etra
tio
n R
ate
in P
erce
nt
t t
lead marketlead market
lag markets lag markets
Pen
etra
tio
n S
pee
d

55
electricity price which can vary from state to state in a country (Ormrod, 1990). The cost
advantage can be one of the most important spatial lead market attributes, as adopters’
decisions can be often based on economic affordability (Rogers, 2003).
The second attribute is demand advantage which relates to local factors that increase the
demand for adopting a particular innovation. Demand advantage could vary among sub-
national regions. A good example is the airline industry, where the demand for air
transport significantly depends on the spatial area (Graham, 1998). Another example is the
demand for higher education; at which decision of prospective students depend on spatial
factors, e.g., distance to university (Sá et al., 2004). Income level is usually a good
predictor for which sub-national regions might have more demand advantage (Beise,
2004). For example, some particular sub-national regions in Europe, e.g., cities of London,
Madrid, Berlin and Rome, have more potential to adopt electrified vehicles because of,
among many others, the high GDP per capita in these cities (Zubaryeva et al., 2012).
The third attribute is transfer advantage, which is described as the ability of a country to
shape the preferences of other countries (Beise, 2004). Transfer advantage could be space-
dependent as diffusion of innovations depends on the intensity of communication between
spatial areas (Hägerstrand, 1967). Transfer advantage is also related to observability, the
degree to which results of an innovation is visible to others (Rogers, 2003) and so called
“demonstration effect” (Kalish et al., 1995). The rate of diffusion of an innovation
increases when the benefits of it are easier to see. Reputable adopters or markets, that
adopt the innovation at initial phase, create credibility for the innovation and reduce the
risk of adoption for laggards and lag markets (Beise and Cleff, 2004; Rogers, 1962). For
example, Facebook has been adopted initially in the Ivy League universities, eight elite
institutions in the Northeast region of the US, before it spreads in the US and then
worldwide.
The fourth attribute is export advantage which is traditionally explained by three factors:
similarities between local market conditions, export experience of local firms and demand
push (Beise and Rennings, 2005; Beise, 2004). First, diffusion is importantly influenced
by cultural similarities (Strang and Meyer, 1993). Innovations are easier to export from
one spatial area to another if these spatial areas are similar. Second, export experience of
companies varies from local area to local area as well. For example in Germany, export
quota vary from 16% to 45% depending on the region, where Saarland region has the

56
highest export quota (SLBW, 2013). Third, local adopters can be more sensitive to global
problems than potential adopters in other spatial regions. This kind of spatial demand push
can trigger the local companies and potential adopters to meet global challenges ahead to
companies and potential adopters in other regions.
The fifth attribute is market structure, which is mainly associated with competition.
Porter (1990) indicates that national competitive advantage arises from competition in
internal market. From a spatial perspective, the role of spatial location is vital for
competitive advantage (Porter, 2000) and market formation dynamics (Dewald and
Truffer, 2012). The spatial forms of technological specialization and comparative
advantages are often originated from sub-national formations such as regions and clusters
(Morgan, 2004). Spatial proximity of actors is important to form cooperation for
innovation (Asheim and Gertler, 2005). The companies located in competitive markets
are under pressure to develop market-oriented innovations. Google for example, one of the
largest companies in global internet industry, is located in Silicon Valley on the south of
San Francisco Bay Area in the US, a leading geographic hub for high-tech innovation.
3.3.4. MODELING
Diffusion models have been used to capture life-cycle dynamics of a new product and they
traditionally have been applied to forecast (to predict) the demand for a new product at
meso level (Mahajan et al., 2000). The wealth of research on modeling diffusion of
innovations has been impressive and it confirms its continuing importance as a research
topic (see e.g. Kiesling et al., 2011; Meade and Islam, 2006, 1998). However after the
enhanced penetration of communication and other technological innovations, research in
diffusion modeling will have to expand its horizons in order to remain timely and abreast
of market trends (Peres et al., 2010).
The available models can be categorized into two main groups as "differential equation
models" and "agent based models" (similar to Rahmandad and Sterman, 2008). The term
"differential equation models" refers to traditional models of innovation diffusion which
provides an empirical generalization which is usually based on an aggregation at the
cumulative market level. Agent Based models refer to the models which consist of a set of
agents that encapsulate the behaviours of the various individuals that make up the system
by emulating these behaviours (Parunak and Savit, 1998). In differential equation models,

57
the path of the cumulative adoption of an innovation between introduction and saturation
is usually modeled by an S-curve based on Rogers' theory. The pioneer s-shaped diffusion
models (what I call them differential equation models) are those of Fourt and Woodlock
(1960), Mansfield (1961) and Bass (1969) (as cited in Meade and Islam, 2006). One of the
most used diffusion models in the literature and by the companies has been the Bass
model. Bass (1969) presented the first purchase growth of a new durable product in the
market. This model suggests that individuals are influenced by a desire to innovate and by
a need to imitate others in the population. After the Bass model, there have been many
others published. Some of them are based on different mathematical equations while some
proposed modifications on Bass model.
Agent based modeling has been increasingly applied to social, and economic problems
previously modeled with nonlinear differential equations (Rahmandad and Sterman,
2008). This method is rooted from complexity theory. It indicates that phenomena at the
macro level can be understood as emerging from interactions between individuals at the
micro level: and macro phenomena affect the behavioral context at the micro level
(Garcia and Jager, 2011).In innovation diffusion field, agent based models describes the
market as a collection of individual elements (so called agents) interacting with each other
through connections (Peres et al., 2010). These models have been increasingly adopted in
diffusion research in recent years in order to overcome the limitations of traditional
aggregate models. Kiesling et al. (2011) explains that agent based models´ ability to model
complex phenomena in a socio-economic system (e.g., the diffusion of innovations) is one
of the most important reasons why agent based models have gained momentum in recent
years. However in the literature, there was a limited use of diffusion models in
environmental innovations, especially in renewable energy technology analysis (Rao and
Kishore, 2010).
The diffusion of PV systems has been modeled from various theoretical perspectives
through a variety of methods. The study of Mesak and Coleman (1992) appears as one of
the first contributions of this phenomenon. They extended the model of Bass (1969) in
order to forecast the PV systems’ diffusion for the residential sector in Kuwait. Their
study addressed the link between the government subsidies and the PV systems’ diffusion.
Assuming that diffusion of PV systems is based on price evolution, Luque (2001)
combined the learning curve approach (Yelle, 1979) with a demand elasticity model. As a
result, he forecasted both the market and price evolution of PV systems. Learning curve

58
approach was also used by Masini and Frankl (2002). They simulated the diffusion of PV
systems in 5 southern Europe countries under different scenarios. Watanabe and Asgari
(2004) attempted to link the dynamic behavior of learning coefficient with that of
innovation diffusion. They developed a mathematical formulation of the logistic growth
function which incorporates the innovation diffusion and its carrying capacity. The model
was applied to the Japanese case of PV systems from 1986 to 2000.
Kobos et al (2006) extended the debate by combining the frameworks of learning by doing
and learning by searching. Based on the estimation of the cost curves and learning
elasticity through regression analysis, they examined experience curve analysis of wind
energy and PV systems under several scenarios. Based on the well-known Bass model
(Bass, 1969) and the extension of it (Bass et al., 1994), Guidolin and Mortarino (2010)
forecasted the diffusion patterns of PV systems in several countries. Their paper showed
the important differences among studied countries, presenting the different stages of the
diffusion process. However, the comparison between the forecasted values of this study
and what happened in reality indicates a big mismatch, e.g., in the case of Germany.
Since 2011, the number of studies addressing the modeling diffusion of PV systems has
rapidly increased. This is probably, among others, due to the increasing available
empirical data. For example, Popp et al. (2011) studied the relationship between global
technology stock influence the diffusion of renewable energy technologies such as PV
systems. They explained the investment per capita in capacity of installed renewable
energy through a statistical fixed effects model. Although many scholars used a
downscaled unit of analysis at regional or local level (Gooding et al., 2013; Higgins et al.,
2014; Kwan, 2012), how spatial differences can affect the two dimensional diffusion paths
have not been addressed yet.
59
4. METHODOLOGY
“Energy studies must become more socially oriented, interdisciplinary and
heterogeneous. Problem-focused research activities that centre on both physical and
social processes, include diverse actors and mix qualitative and quantitative methods,
have a better chance of achieving analytic excellence and social impact (Sovacool,
2014b, p. 530)”
This PhD Dissertation is based on multi-methodological approach. Anchored in a case
study method (sub-chapter 4.1), the micro and firm level analyses are conducted. For the
meso level analysis and modeling perspective, an indicator-based approach (sub-chapter
4.2) and finite element method (sub-chapter 4.3) have been respectively chosen. Beyond
these three methods, there have been also two literature reviews, methodological aspects
of which are previously explained in sub-chapter 3.2.
4.1. CASE STUDY APPROACH
Case study method is traditionally used for various purposes, such as providing
description, testing theory or generating theory (Eisenhardt, 1989), and the method is
common in energy research (see e.g., Cagno et al., 2015; Darmani, 2015). The case studies
should not only address theory, but also provide real world examples in a new way
(Siggelkow, 2007). In this Dissertation, the case study method is used in order to provide
an in-depth description of the diffusion of solar PV systems at grid parity, a rather under-
researched phenomenon. When there is lack of previous research, a case study approach is
appropriate for exploring a contemporary phenomenon, gaining a holistic view of complex
instances through observation and searching for patterns (Yin, 2011). The strength of case
study lies in its approach to develop empirically collected and context dependent
knowledge with “multiple wealth of details” (Flyvbjerg, 2006; Lincoln and Guba, 2009;
Stake, 2000).

60
4.1.1. EMPIRICAL CONTEXT
The case study approach is based on the findings of a study conducted in a town called
Rottenburg am Neckar (a town with 43000 inhabitants) in Tübingen. It focuses on a local
solar firm, which is called Hartmann Energitechnik GmBH (HET). As shown in Figure
14 and Figure 15, it is located in a rural area in Southern Germany, near a village of
Oberndorf in Rottenburg Am Neckar.
FIGURE 14- THE LOCATION OF HET18
18 The map represents the 5-digit zip code areas of Germany. The map is generated via the QGIS Desktop 2.6 software,
based on the data GADM database (www.gadm.org), version 2.0, December 2011.
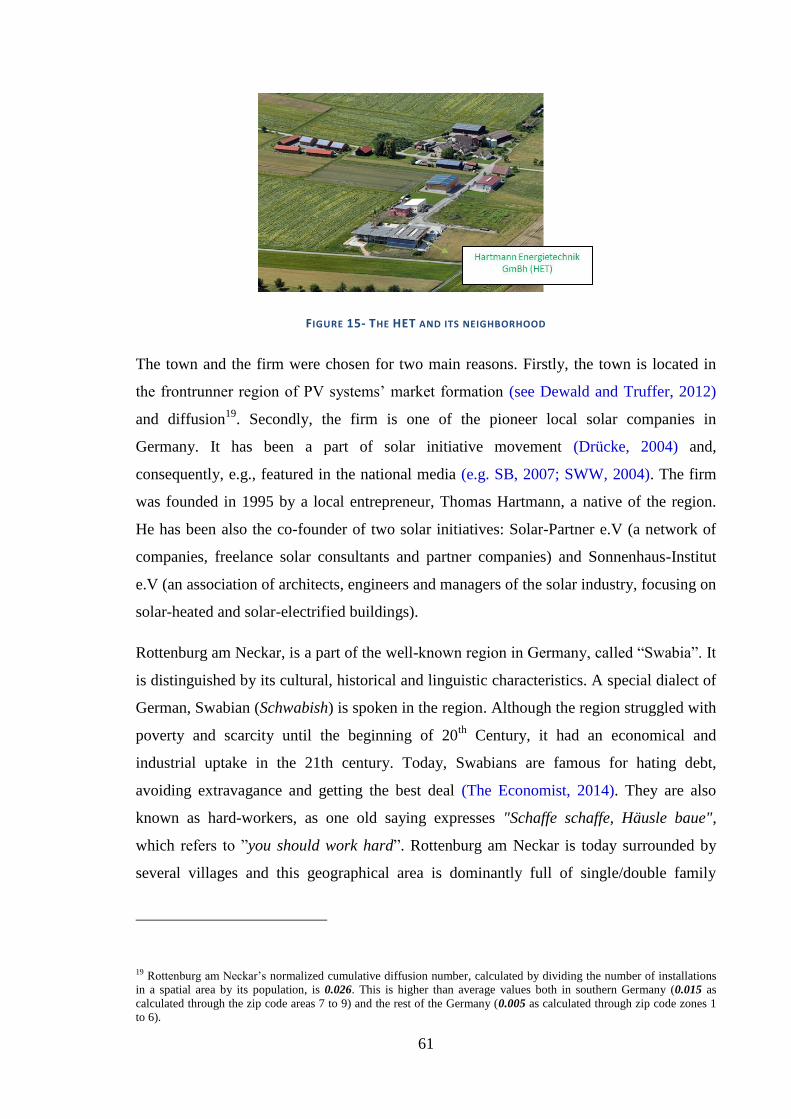
61
FIGURE 15- THE HET AND ITS NEIGHBORHOOD
The town and the firm were chosen for two main reasons. Firstly, the town is located in
the frontrunner region of PV systems’ market formation (see Dewald and Truffer, 2012)
and diffusion19
. Secondly, the firm is one of the pioneer local solar companies in
Germany. It has been a part of solar initiative movement (Drücke, 2004) and,
consequently, e.g., featured in the national media (e.g. SB, 2007; SWW, 2004). The firm
was founded in 1995 by a local entrepreneur, Thomas Hartmann, a native of the region.
He has been also the co-founder of two solar initiatives: Solar-Partner e.V (a network of
companies, freelance solar consultants and partner companies) and Sonnenhaus-Institut
e.V (an association of architects, engineers and managers of the solar industry, focusing on
solar-heated and solar-electrified buildings).
Rottenburg am Neckar, is a part of the well-known region in Germany, called “Swabia”. It
is distinguished by its cultural, historical and linguistic characteristics. A special dialect of
German, Swabian (Schwabish) is spoken in the region. Although the region struggled with
poverty and scarcity until the beginning of 20th
Century, it had an economical and
industrial uptake in the 21th century. Today, Swabians are famous for hating debt,
avoiding extravagance and getting the best deal (The Economist, 2014). They are also
known as hard-workers, as one old saying expresses "Schaffe schaffe, Häusle baue",
which refers to ”you should work hard”. Rottenburg am Neckar is today surrounded by
several villages and this geographical area is dominantly full of single/double family
19 Rottenburg am Neckar’s normalized cumulative diffusion number, calculated by dividing the number of installations
in a spatial area by its population, is 0.026. This is higher than average values both in southern Germany (0.015 as
calculated through the zip code areas 7 to 9) and the rest of the Germany (0.005 as calculated through zip code zones 1
to 6).

62
houses rather than multi-family apartments. There are many farmers in the surroundings;
living as single families with a relatively large lands.
Hartmann Energietechnik GmbH
Hartmann Energietechnik GmbH (HET) was founded in 1995 in the village of Oberndorf
in Rottenburg am Neckar by Thomas Hartmann, a local entrepreneur (according to the
definition of Michelacci and Silva, 2007). HET is located in the so called “Solar-Center”
and offers solar PV, solar thermal and biomass boilers for the citizens in the
neighborhood, in partnership with two regional associations: Solar-Partner e.V. and
Sonnenhaus-Institut e.V.. In the PV branch, the main activities of HET are focused on the
promotion, consulting, conceptual designing, assembling and installation. HET offers a
wide range of solutions, depending on the needs and preferences of potential PV adopters:
various montage systems and alternative concepts. In 2012, HET´s sales volume was
approximately 3 million Euros. In the same year, the PV solutions offered by HET was
adopted not only in Rottenburg am Neckar (30% of adoptions) but also in other
neighborhoods in a radius of up to 50 km. HET shared around an average of 10% of the
PV market in the neighboring towns with respect to the installation numbers.
HET history goes back to 1993, when T. Hartmann obtained his first solar collector
training for solar thermal systems. In the late 1990s, inspired by an Austrian model, HET
installed many different solar systems, participated in different exhibitions and co-founded
the association Solar-Partner e.V, a network of heating and solar specialist companies,
freelance solar consultants and partner companies in Bavaria and Baden-Württemberg.
The installation of the solar thermal for the sport hall in the village of Oberndorf was one
of milestones of HET, by which the company achieved visibility and recognition in the
neighborhood.
Since the introduction of the feed-in tariff for PV in Germany in 2000 by the federal
government, HET focused more on the PV systems, installing many systems in the
neighborhood (e.g., for the church and the bishop’s house in 2002). In the beginning of
2000s, the efforts of HET received much attention from the government as well. In 2001,
HET was visited by the Mayor of Rottenburg am Neckar and a member of German
parliament, and in 2002, HET was visited by a minister of the regional government to
have solar-walks and become informed about the diffusion of solar systems in the region.

63
In 2004, HET co-founded the association of Sonnenhaus-Institut e.V., an association that
brings architects, engineers and managers of the solar industry together with the goal of
sustainable development and distribution of construction and heating techniques for
largely solar-heated buildings. In 2006, as a pilot project of the association, Solar-Center
was built with PV systems of a capacity of 60-kWp on the roof and 150 square meters of
solar thermal on the façade that provide 80% of the energy by itself.
HET’s relationship with potential adopters is based on the facilities in the “Solar-Center”
and the monthly “Solar-walks”. The Solar-Center is a transparent place where the
potential adopters can see any part of the facilities (assembly hall, design unit, and
exhibition part) and become informed about PV solutions. The Solar-Center also serves as
a meeting place for seminars, construction courses, open-doors day and guided tours about
solar PV, solar thermal and biomass. In addition, interested potential adopters can request
a personal visit by T. Hartmann to their houses to discuss the best option. “Solar-walks”
are regular 3-4 hours exhibition tours in the village of Oberndorf, guided by T. Hartmann,
where PV systems that HET installed are described and discussed. Anyone who is
interested can join these solar-walks and learn about different PV concepts on the field.
Since 2001, solar-walks have been organized every month, and during this time, it has
never failed. The visitors of these solar-walks have not been only limited to the region, as
there have been many amateur and professional guests from all over the world, such as
USA, Japan and Sri Lanka.
4.1.2. DATA COLLECTION AND ANALYSIS
The data, which were collected during the case study from December 2012 to March 2013,
include 18 semi-structured interviews, approximately 600 hours of observation and the
internal data of the company. The interviews, the duration of which varied between ten
min to one hour, were conducted with Thomas Hartmann, the employees in the firm, the
directors of four other partner local solar firms and the adopters of PV systems. Such
diversity in interviewees gave a holistic view to understand the diffusion of PV systems at
grid parity both from adopter’s perspective and firm’s perspective. The interviews were
conducted at various locations: the firm, the houses of adopters and a regional workshop.
Following a semi-structured interview approach, the interviewer had the freedom to add
new questions, based on the flow of the discussions during interviews. Except in one
instance, the language of the interviews was German. All interviews were electronically

64
recorded. The observations took place both in the firm and in the town. The observations
in the firm were conducted through an average of nine hours/weekday presence for three
months. As a participant observer (Atkinson and Hammersley, 1994), all of the formal and
informal gatherings of the company was attended. In addition, several ongoing PV
installations projects were monitored on the site and a 2-day regional workshop (of 150
participants) was actively attended. The internal data include not only various documents
such as internal agreements, technical and feasibility reports of each PV installation and
the documentation of each project, but also the sales database of HET. Data were analyzed
throughout and after the fieldwork. With an insider-outsider team research approach
(Bartunek and Louis, 1996) and data triangulation with multiple source of evidence (Yin,
2003), the subjectivity was aimed to be avoided. To empirically validate the results, the
findings were presented for the firm, both in an internal meeting and, on a later phase, in a
written form.
4.2. INDICATOR-BASED APPROACH
The indicator-based approach consists of three steps: identification of relevant variables
for PV context, assessment of lead market attributes at sub-national level and diffusion
curve analysis.
1) Following the methodological approaches in relevant literature (e.g. Beise and
Cleff, 2004; Beise and Rennings, 2005; Horbach et al., 2014), in the first part, the
results of the case study is triangulated with a literature review. As a result, a set of
indicators are identified.
2) The second step assesses the lead market attributes at sub-national level. In order
to tackle this, several indicators, which were identified in the previous step, were
then retrieved from Federal and Regional Statistical Offices of Germany (SABL,
2013; SLBW, 2013) and the other studies (Berthold et al., 2009; Diekmann et al.,
2012; Drücke, 2004; Kost et al., 2013). Each indicator is categorized according to
the five attributes of the lead market model and mapped spatially via QGIS 2.0.1
Software, which is an open source geographic information systems (GIS) program
that provides spatial data analysis. In the end, the indicators are aggregated using a
simple method (similar to Beise and Cleff, 2004).

65
3) Existence of lead markets can be formally identified by gathering data on
innovation´s diffusion curves (Beise, 2004; p. 1013). Higher than usual penetration
rate in particular spatial areas is a sign that a lead market exist. In our study, the
data for plotting spatial diffusion curves is gathered from the Information Platform
of four German Transmission Network Operators for the Renewable Energy
Sources Act (EEG) and the Combined Heat and Power Act (KWK-G). The data
has two dimensions: time and space (i.e., it is spatiotemporal). In terms of time, the
unit of analysis is year and time span is from 2000 to 2012. For the spatial
dimension, the boundary is Germany and the unit of analysis is zip code areas
defined by Deutsche Post AG, the main postal service provider in Germany (see
Figure 16).
FIGURE 16. GEOGRAPHIC ZIP CODE AREAS AND STATES IN GERMANY

66
The advantage of using zip code zones is to have relevantly uniform distribution of
population and area for each geographic zone, which is a common practice in economic
geography studies. The dependent variable, which is time and space dependent, is the
number of small scale PV installations rather than capacity of installations. The
penetration rate of PV diffusion cannot precisely be calculated as we do not know what is
the highest possible number of installations given that PV can be installed not only on
rooftops but also on façades or gardens. Therefore, we use a normalized cumulative
diffusion number to represent the penetration rate. It is calculated by dividing the
number of installations in a spatial area by its population , and multiplied by
100.
While the results of first step are more related to methodological aspects, the outcome of
the second and third steps develops the answers of RQ3 of this Thesis. Therefore, the
results of the first step are presented in the following sub-chapter 4.2.1 and the results of
other two steps are discussed in sub-chapter 5.3.
4.2.1. IDENTIFICATION OF INDICATORS
The overview of indicators that approximate the lead market attributes for diffusion of
small scale PV in Germany is presented in Table 5. These indicators can be applied not
only at sub-national level but also at the national level (if necessary). Although the five
lead market attributes are innovation-specific (Beise, 2001), the corresponding indicators
for export and transfer advantage are not available at the specific innovation level (see
Walz and Köhler, 2014, p. 36).

67
TABLE 5. A SYSTEM OF INDICATORS THAT PROXY LEAD MARKET ATTRIBUTES FOR PV
Lead Market
Attributes
Available Indicators as Proxy
Cost Advantage [1/LCOE] 1/Levelized cost of electricity from PV (a)
, 2012
(kWp/€)
Demand Advantage [Green] Green Party Support (b)
, 2009 (%)
[Employment] Employment Rate (b)
, 2010 (%)
[Housing] House/apartment Ratio (b)
, 2011 (%)
Transfer Advantage [R&D] R&D Expenditure Index (c)
, 2009
[Patent] Patent applications for renewable energy technologies
per 100 thousand capita (e)
, 2008-2011
[Demonstration] Number of demonstration projects funded by
DBU (normalized with population ratio) (d)
, 2001 (%)
Export Advantage [Foreigners] Ratio of foreigners in population (b)
, 2012 (%)
[Export] Export Quota (f)
, 2012 (%)
Market Structure
Advantage
[Initiatives] Number of Solar Initiatives (normalized with
population ratio) (d)
, 2004 (%)
Sources:
(a) Kost et al., (2013)
(b) Statistische Ämter des Bundes und der Länder (SABL, 2013)
(c) Berthold et al., (2009)
(d) Drücke (2004)
(e) Diekmann et al., (2012)
f) Statistisches Landesamt Baden-Württemberg (SLBW, 2013)
Cost advantage
Cost advantage of PV diffusion is traditionally measured by levelized cost of electricity
(LCOE) (e.g. Branker et al., 2011; Lettner and Auer, 2012). It is an indicator that
expresses the cost of electricity generation over the years. LCOE is based on the initial
capital, solar radiation, continuous operation costs, service life time and costs of
maintenance. As solar radiation and the complementary goods´ costs vary between
geographic zones so do LCOE for PV. Although the calculation of LCOE is disputed in

68
literature (as explained by Munoz et al., 2014), LCOE is sufficient enough to represent
the relative cost competitiveness for PV (e.g. see Reichelstein and Yorston, 2013). Our
case study also confirms that if the space-specific LCOE of PV is relatively cheaper than
the retail electricity prices per kW, there is more likelihood for the adoption. Potential
adopters are usually informed about such financial aspects by the system suppliers before
the adoption takes places. Therefore, we use the inverse of LCOE [1/LCOE]. Increasing
[1/LCOE] results in increasing cost advantage, and therefore, increasing adoption rate.
Demand advantage
The two important factors that may influence the demand advantage are socioeconomic
status (McEachern and Hanson, 2008; Zhang et al., 2011) and environmental awareness
(Jäger, 2006; Zhang et al., 2011). The former has a strong correlation with employment
rate (Bartley and Owen, 1996) and the latter can be associated with green party support (as
observed in the case study). Therefore, we choose employment rate [Employment] and the
support for green party (Alliance '90/the Greens) [Green] as indicators. Increasing
employment rate and green party support are expected to result in increasing demand
advantage.
In addition, our case study reveals that the entity of decision makers is also an important
factor on adoption. Following the Rogers’ (2003) categorization about decisions on
adoption, we expect that optional decisions (e.g., the case of single-family houses where
the adopting individual has almost complete responsibility for the decision) are much
easier to take rather than collective decisions (e.g., the case of multi-family apartments
where the individual has only a say in the decision). Members of multi-family apartments
are less likely to take the decision in favor of the PV adoption, as it requires the approval
of each family in the apartment. Therefore, we also use an additional indicator for demand
advantage, which is house/apartment ratio [Housing]. It expresses the ratio of single and
double family houses to the total number of houses at sub-national level.
Transfer advantage
Transfer advantage relates to the ability of a region to shape the preferences of other
regions. We use three indicators to proxy the transfer advantage at sub-national scale.
These are research & development expenditure index [R&D], patent applications for
renewable energy technologies per 100 thousand capita [Patent] and number of

69
demonstration projects (normalized with population ratio) funded by DBU, German
Federal Environmental Foundation [Demonstration]. R&D expenditure and patents are
common to be used for approximating the transfer advantages of lead markets (see e.g.
Beise and Rennings, 2005; Horbach et al., 2014; Köhler et al., 2014). Moreover, transfer
advantage builds also on the demonstration effect (Beise, 2004), which can be, for
example, approximated by the church rooftops project of DBU from 1999 to 2001. This
project aimed to support PV installations for churches’ rooftops. The case study in
Rottenburg am Neckar also confirmed that PV installations at public places, such as
schools or churches, have resulted in increasing perceived observability of PV.
Export advantage
We use two indicators to approximate the export advantage of a lead market at sub-
national level. The first one is the export quota [Export]. Higher export quota expresses
the higher export advantage of a region (Beise, 2004; Köhler et al., 2014). The second
indicator is the ratio of foreigners in population at sub-national scale [Foreigners]. Higher
interaction between the adopters in potential lead market and lag markets drives the
diffusion (Beise and Cleff, 2004; Beise, 2001). Yet, regions with high foreign population
enjoy an export advantage since they have more interaction with other regions
Market structure advantage
Local solar initiatives played a vital role for market formation at sub-national scale and a
successful growth of diffusion of PV in Germany (Dewald and Truffer, 2012). The
number of these initiatives were already over 200 by 2004 (Drücke, 2004). As the solar
initiatives were central intermediary actors for market formation, supporting especially
small scale PV diffusion (Dewald and Truffer, 2012), we use the number of solar
initiatives (normalized with population ratio) [Initiatives] as an indicator, approximating
the market structure advantage. One of these solar initiatives was the Solar Partner e.V,
co-founded by Hartman Energietechnik GmbH. Both adopters and members of Solar
Partner e.V indicate that the activities of this initiative have stimulated the diffusion of
PV, serving as a platform to share the good practices and support market formation.

70
4.3. FINITE ELEMENT METHOD
The research, that applied the Finite Element Model in social science related fields, has
flourished in the 1990s20
. These studies can be categorized under three groups. The first
category is about Economic Geography. This stream is dominated by the studies from
transportation research. The second field is related to the Finance, with a particular
emphasis on American and European options pricing. The studies on implementing Finite
Element Model in option pricing appeared in the early 2000s (e.g., Allegretto et al., 2001;
Tomas and Yalamanchili, 2001) and have been increasing recently. Lastly, the third
category consisted studies from various topics, including economic growth models (e.g.,
Cao-Alvira, 2011) and cash management optimization (e.g., Baccarin, 2009). In all three
categories, most of the studies focus on methodological and modeling aspects, such as
optimization, improvement and extension of applied models with Finite Element Method
(e.g. Angermann and Wang, 2007 in option pricing; Ho et al., 2006 in transportation
systems in a city).
Finite Element Models usually start with a continuum problem and a numerical model, an
example of which is illustrated in Figure 17. Then, one part of the model carries out
domain discretization, i.e., meshing, and the other deals with discretization of the equation
in respect to both spatial and temporal dimensions. In the end, the model is solved with a
numerical software tool, which typically contains three parts: preprocessing, the main
processing and post processing. The results are typically tested both for accuracy and
convergence.
20 E.g. the studies have appeared in a variety of journals from different fields. Some examples are the Annals of Regional
Science (Wong and Sun, 2001; Wong et al., 2006), an international journal of urban, regional and environmental studies;
Computational Economics (Cao-Alvira, 2010, 2011; Shinohara and Okuda, 2010), a journal dedicated to the interface of
computer science, economics and management science; Transportation Research Part B- Methodological (Ho et al.,
2006; Jiang et al., 2011; Wong, 1998; Yang et al., 1994), a journal presenting methodological aspects applied in
transportation systems; and Management Science (Ben-Ameur et al., 2002), a journal that publishes on the practice of
management.

71
FIGURE 17- TYPICAL IMPLEMENTATION STEPS FOR FINITE ELEMENT MODEL21
The continuum problem and mathematical model can vary, based on the studied
phenomena. There are different continuum problems considered. For example, Ho and
Wong (2007) study a continuum problem of the macro role for the interacting housing and
travel patterns in both land-use and transportation system; Wong et al., (2006) considers a
continuum traffic equilibrium problem in a city with several competing facilities; and
Shinohara and Okuda (2010) study continuum innovation diffusion via an analogy with
natural physical phenomena. Some studies deal with a minimization problem while others
caries out a maximization problem. In general, the prediction of customer behavior is the
focal point of most of the mathematical models that are applied in these studies.
The domains, which are subject to discretization, are usually chosen as a whole region of a
city (e.g., Wong et al., 2004) or a country (e.g., Shinohara and Okuda, 2010). The selected
domains are typically meshed with a set of three-node linear triangular finite elements.
The studied variables, such as diffusion rate or traffic density, can be then mapped on
these meshed domains. This enables a deeper understanding on the studied phenomena,
such as pinpointing the sources of diffusion of innovations or the congested roads.
After finite element discretization, the solutions of are calculated by a software, which
also offers accuracy and convergence analysis for real-world applications. Accuracy in
21 (adopted from Lewis et al., 2004)
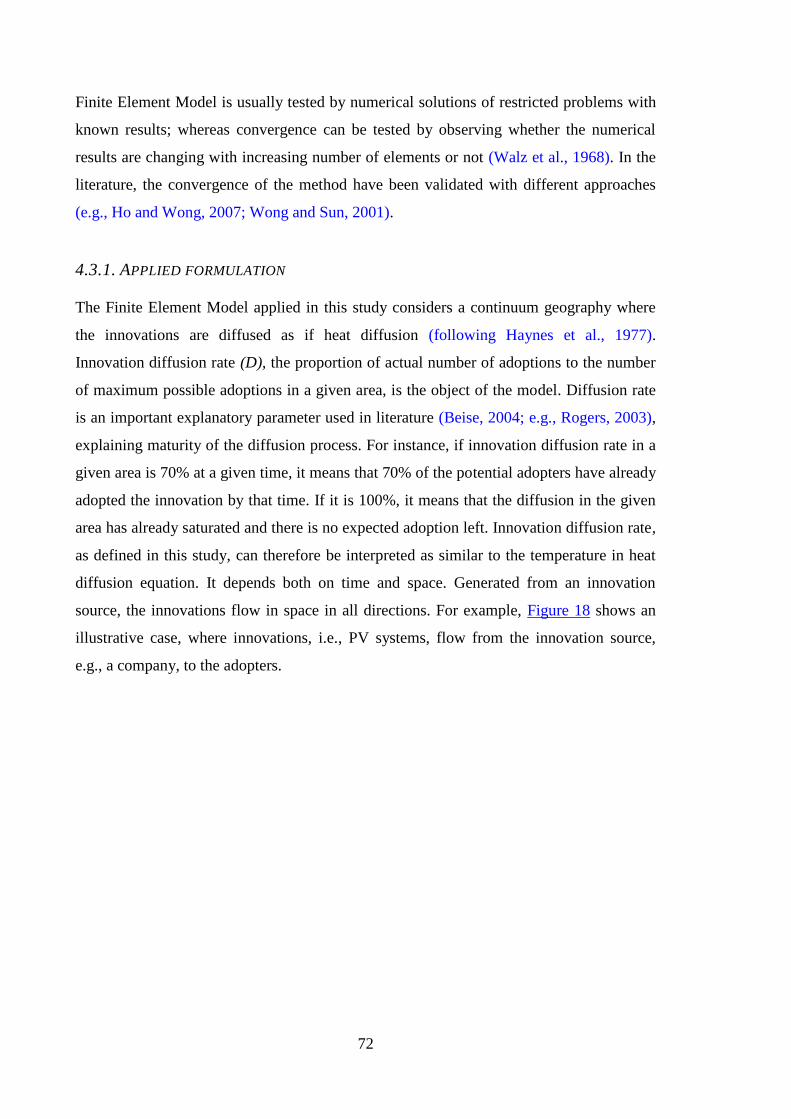
72
Finite Element Model is usually tested by numerical solutions of restricted problems with
known results; whereas convergence can be tested by observing whether the numerical
results are changing with increasing number of elements or not (Walz et al., 1968). In the
literature, the convergence of the method have been validated with different approaches
(e.g., Ho and Wong, 2007; Wong and Sun, 2001).
4.3.1. APPLIED FORMULATION
The Finite Element Model applied in this study considers a continuum geography where
the innovations are diffused as if heat diffusion (following Haynes et al., 1977).
Innovation diffusion rate (D), the proportion of actual number of adoptions to the number
of maximum possible adoptions in a given area, is the object of the model. Diffusion rate
is an important explanatory parameter used in literature (Beise, 2004; e.g., Rogers, 2003),
explaining maturity of the diffusion process. For instance, if innovation diffusion rate in a
given area is 70% at a given time, it means that 70% of the potential adopters have already
adopted the innovation by that time. If it is 100%, it means that the diffusion in the given
area has already saturated and there is no expected adoption left. Innovation diffusion rate,
as defined in this study, can therefore be interpreted as similar to the temperature in heat
diffusion equation. It depends both on time and space. Generated from an innovation
source, the innovations flow in space in all directions. For example, Figure 18 shows an
illustrative case, where innovations, i.e., PV systems, flow from the innovation source,
e.g., a company, to the adopters.

73
FIGURE 18- THE ILLUSTRATION OF FLOW IN INNOVATIONS IN SPACE
The innovation flow, or in other words, innovation flux (q) can be formulated as similar to
the fundamental rule for flow of heat energy.
where c can be called as innovation diffusivity22
. This rule indicates that innovation flux
(q) is proportional to the negative innovation rate across the space. With the
transformation of this equation, the governing equation on the diffusion rate (D) can be
derived as the following.
where t is time. The x and y are the coordinates of the location in spatial dimension. The
derivation of such formulation, which is based on of the model of Haynes et al., (1977),
can also be seen in the study of Shinohara and Okuda (2010). It is also similar to the
formulation of Morrill (1970), that describes the innovation diffusion as if a wave
propagation. Such mathematical models assume that the innovation will diffuse from the
source to the adopters.
For the application of the Finite Element Model, a case of a solar company, called HET, is
considered. The HET´s target market includes mainly 10 zip codes in southern Germany
22 Innovation diffusivity value can also be interpreted as a combination of the coefficient of innovation and the
coefficient of imitation in Bass model (Bass, 1969). In addition, it can be interpreted as a joint representative of demand-
side factors.
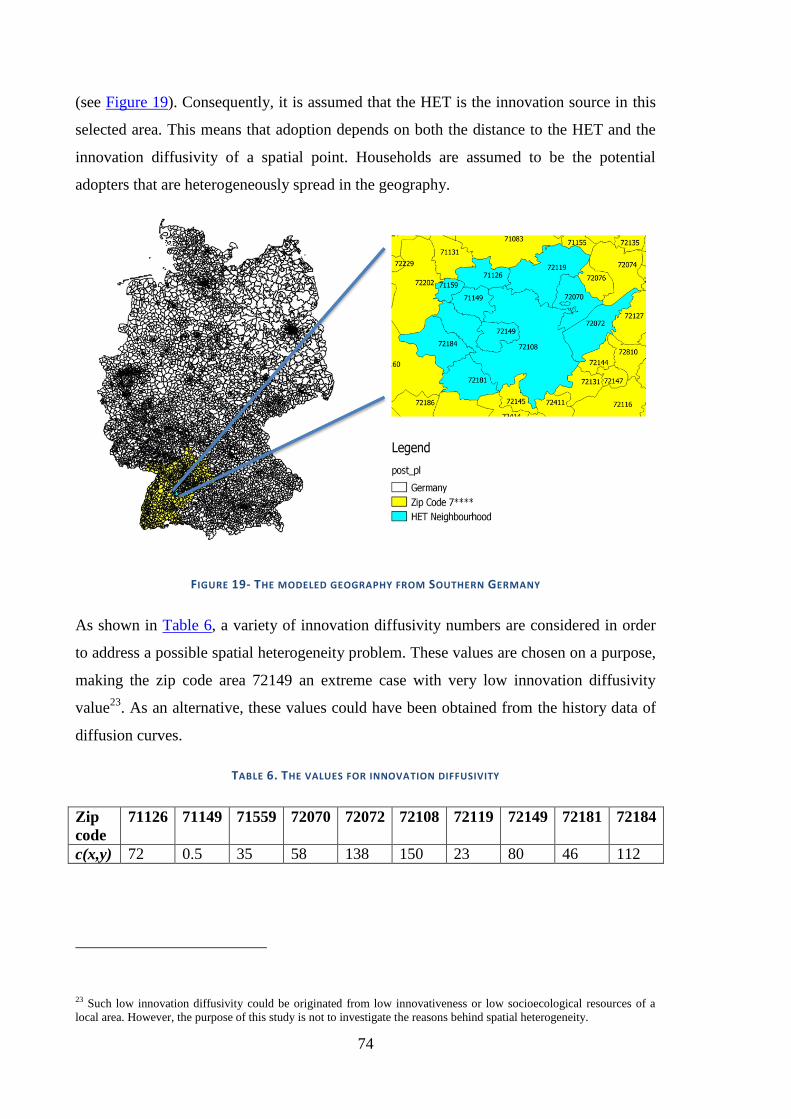
74
(see Figure 19). Consequently, it is assumed that the HET is the innovation source in this
selected area. This means that adoption depends on both the distance to the HET and the
innovation diffusivity of a spatial point. Households are assumed to be the potential
adopters that are heterogeneously spread in the geography.
FIGURE 19- THE MODELED GEOGRAPHY FROM SOUTHERN GERMANY
As shown in Table 6, a variety of innovation diffusivity numbers are considered in order
to address a possible spatial heterogeneity problem. These values are chosen on a purpose,
making the zip code area 72149 an extreme case with very low innovation diffusivity
value23
. As an alternative, these values could have been obtained from the history data of
diffusion curves.
TABLE 6. THE VALUES FOR INNOVATION DIFFUSIVITY
Zip
code
71126 71149 71559 72070 72072 72108 72119 72149 72181 72184
c(x,y) 72 0.5 35 58 138 150 23 80 46 112
23 Such low innovation diffusivity could be originated from low innovativeness or low socioecological resources of a
local area. However, the purpose of this study is not to investigate the reasons behind spatial heterogeneity.

75
To solve the mathematical equation, both domain and mathematical equation are meshed
by ABAQUS software (Abaqus, 2013). This computational mesh on approximated
geographic is shown in Figure 20. The HET is located between zip code areas 72108 and
72119.
FIGURE 20- THE COMPUTATIONAL MESH ON APPROXIMATED GEOGRAPHIC
The type of the elements used for computational mesh is 4-node linear quadrilateral. The
total number of elements is 752. The solution of the model is based on a 13-year
calculation. As boundary condition, the location of the HET is assumed to have 100%
diffusion rate during the whole time period. The reason behind this assumption lies on the
fact that HET consists of only one building which has already adopted a PV system.


77
5. RESULTS AND DISCUSSIONS
5.1. MICRO LEVEL ANALYSIS
The first research question of this Thesis was: Why and how do the PV systems at grid
parity get adopted at micro level? In order to answer this research question, we analyze the
case in Rottenburg am Neckar in 2012. This case has some particular characteristics. First,
the case company (Hartmann Energietechnik GmbH, i.e., HET) is a pioneer local solar
company in the region with a strong network with other local solar companies and
adopters. Second, the year 2012 was the time when the feed-in tariff drastically
diminished.
“Hartmann Energietechnik GmbH is a local installation company, well-known in
the region. There are many references in the area, and Mr. Hartmann is a very
well-known guy…” (P.M., PV Adopter, 21.12.2012).
“2012 was catastrophic bad year - Solid cut in the feed-in tariff.” (G.W., Director
of a partner firm in HET network, 07.12.2012).
To understand why and how do the PV systems at grid parity get adopted at micro level,
we separate the analysis into three parts associating with the role of policy measures, local
solar companies and adopters.
5.1.1. POLICY MEASURES
Germany is expected to achieve the National Renewable Energy Action Plan Target for
PV for 2020 at an earlier stage than planned, sometime between 2016 and 2020 (EPIA,
2013). This is the impact of the strong policy support that resulted in the rapid growth of
the PV market in 2000s. During this period, the cost covering feed-in tariff was the main
factor that policy makers implemented to foster market formation and PV diffusion
(Dewald and Truffer, 2012). As expected, this case study reveals that feed-in tariff is no
longer the most important motivation to adopt PV. This change is a consequence of PV
systems achieving grid parity in 2012 and the reduced feed-in tariff, which pays less than
the average electricity retail price. Although solar PV is supposed to be advantageous

78
compared to other electricity sources due to the grid parity, the interviewed managers said
that reduction in feed-in tariff was the reason why adoption rate of PV in Southern
Germany reduced in 2012 in comparison to 201124
.
In 2012, the role of policy became more “indirect” than previous years. There is clear
evidence in the case study that policy makers, together with other actors, created a
negative expectation about the electricity prices in future. This legitimization motivated
some households to adopt solar PV systems. Policy measures determine the rules for
calculating the EEG levy (the portion of the electricity price that must be paid by the end
user to support renewable energy) and other types of taxes, which partly sets the electricity
price in the market (Wirth, 2013). In the case study, respondents from both supply and
demand side report the importance of the negative future expectations on the adoption
decision.
“The people in their 30s are afraid of high electricity costs and how to manage
it…” (G.W., Director of a partner firm in HET network, 07.12.2012).
“Electricity will be more expensive in the coming years… then I said I just do not
want to pay much. I would also have advantages (of it).” (F.Z., PV adopter,
24.01.2013).
“We wanted to invest in PV because of the economical and global situation that
we don’t know which way we are going.” (P.M., PV Adopter, 21.12.2012).
Policy makers can influence which conceptual design will become the dominant design
(Utterback, 1994) or disruptive innovation (Christensen, 1997) of PV systems. The
respondents frequently discussed self-consumption, a concept based on an additional
battery system and self-usage of PV electricity. Whether more people will be motivated to
adopt self-consumption concept, depends on economic relative advantage of it, which is
partially shaped by decreasing the feed-in tariff and increasing electricity prices:
“I believe that the PV (diffusion) will grow even though the policy support and
feed-in tariff decrease (…). Now we have feed-in tariff less than what we pay for
electricity, it is 10 cents less ... This low feed-in tariff means that the self-power
24 In Rottenburg am Neckar the number of PV installations in 2012 was 85% of the installations in 2011.

79
consumption is becoming increasingly important when people are increasingly
afraid and further consider self-power consumption...” (G.W., Director of a
partner firm in HET network, 07.12.2012).
Interestingly, corresponding to this tendency, a program to promote small scale storage
batteries for photovoltaic systems has recently started to be subsidized for those that have
been installed after 31st December 2012. The official information was released in April
2013. According to this new subsidy program, the concept of self-consumption PV
systems became more advantageous than any other concept possible (IMS Research,
2013). We could also argue that this new subsidy scheme for solar batteries (direction of
search) may develop positive externalities by the entry of new firms and the creation of a
sub-market. In the field study, we observed (e.g., in the 2-day long annual meeting) that
the Solar Partner e.V. association collaborated with a new solar battery firm to discuss
how to integrate PV systems with battery systems. However, the other functional PV
concepts still remain niche markets. Two examples of these niche markets are building-
integrated photovoltaic systems (a concept in which PV systems are used instead of
roofing material) and façade systems (using PV systems on facades):
“Building-integrated photovoltaic technology is very expensive, very expensive!
You can see it only in France because building-integrated PV systems are there (in
France) subsidized. Building-integrated PV architecture is beautiful, no question,
much nicer than seal down there, which is set up so artificially. It is just a question
of whether the customer can afford it or not.” (G.W., Director of a partner firm in
HET network, 07.12.2012).
Regarding the social acceptance of PV systems (Jäger, 2006), observations in the field
study indicate that policy discussions on renewable energy system is a hot topic in mass
media channels. These discussions even reach the young generations through different
communication channels. One of the respondent´s children reported that the use of
renewable energy systems is such an important topic that they comment and discuss such
systems in primary schools. Theoretically, this importance is related to two of the
perceived attributes of the innovation: compatibility and complexity. Because renewable
energy systems are designated as the key tool for the future of the German electricity
supply by policy makers, the on-going discussions of PV systems decreases PV´s
perceived complexity and makes them compatible with socio-cultural values.

80
5.1.2. ADOPTERS
In line with recent literature (Balcombe et al., 2014, 2013), there is an evidence in the case
study that the contribution to an improved natural environment and the ability to gain
independence from electricity suppliers are important adopter motivations. In particular,
the desire to be independent from electricity suppliers has increased recently because of
the increasing electricity prices. In addition, respondents indicated that PV is often
perceived as an “investment” alternative to other traditional investment options.
“Electricity prices are getting expensive. If you currently have money in the bank,
you have interest rate of about 1 percent ... With a photovoltaic system you can
financially be satisfied…” (B.U., PV adopter, 15.01.2013).
“In the back of my head, I would prefer to be completely self-sufficient and if we
could (in our current new house) make everything for ourselves and would not
need public electricity.” (C.W., PV adopter, 29.01.2013).
“(My motives were) on the one side to make an investment and on the other side to
be environmental friendly, i.e., how I can protect my environment. Then, I thought,
yes, I make PV system on it (the roof).” (F.E., PV adopter, 01.02.2013).
Adopters frequently recognized the impact of their peers upon the adoption rate of PV at
the local, regional, and global levels. At the local level, in line with the literature on peer
effects (Bollinger and Gillingham, 2012; Rode and Weber, 2012), the field study confirms
that there is a positive influence of previously installed PV systems located nearby on the
adoption rate of PV. Peer effects in neighborhoods decrease the perceived complexity for
potential adopters and increase the perceived compatibility with the social norms:
“Several reasons available (for adopting PV). One reason is that we are living in
Tübingen… There are a lot of buildings which have PV systems on the roof…”
(P.M., PV adopter, 21.12.2012).
“Since solar systems were actually built more and more, I have been thinking
about building a house and equip it with a PV system, (since) 10 years.” (H.R., PV
adopter, 23.01.2013).
Finally, corresponding to the regional and global levels, the respondents emphasized that
there was an indirect impact of the Fukushima disaster in Japan (2011), followed by the

81
protests against nuclear power in Germany (2011-2012) and the Stuttgart 21 Project (an
urban development project in Stuttgart, which was protested based on economic and
environmental concerns on 2009-2011). All of these types of protests had an impact on the
decision by the policy makers (on May 2011) to shut down all nuclear reactors by 2022
and on the adoption of the new Act on Granting Priority to Renewable energy sources
(EEG 2012 on June 2011). This reaction to protests is an interesting illustration that
adopters, as change agents, can influence the policy decision and therefore influence the
adoption rate of a technology in society.
5.1.3. LOCAL SOLAR COMPANIES
Local solar companies offer and install complete PV systems to adopters and act as change
agents, thus making them vital in the adopters’ decision process. Corresponding to earlier
research (Reardon, 2009; Bodas-Freitas et al., 2010), a mix of all decision types were
reported in the field study: “optional decision”, in which the location of PV system
installation belongs to the adopter; “collective decision”, in which multiple adopters live
in a common place (e.g., apartment) and have a say in the final decision; and “authority
decision”, in which the adopter is temporarily occupying the location at which the PV
system is installed (e.g., renter). The adoption decision is unlikely to be positive if more
than one individual has a say in the decision, as in the collective decision types. However,
regardless of the type of decision, local solar companies can offer alternative PV system
solutions based on the different needs, which can affect the final decision, e.g., if a
potential adopter is building a new house, the local solar company can offer a building-
integrated PV system to reduce the amount that would have to be spent for conventional
building materials because a building integrated PV system is directly used in parts of the
building envelope (increase of the relative advantage). Here, offering the best solution that
fits the needs of the potential adopter (decreasing complexity and increasing
compatibility) is not only a typical role of an experienced local company but also a key to
motivate the adoption.
Respondents emphasized that the decision to adopt photovoltaic systems requires some
level of knowledge about the technology, operation and funding. Many studies, e.g.,
Dewald and Truffer (2011, 2012), have highlighted the importance of effective
communication and the sharing of similar background between suppliers and adopters.
This importance of effective communication is related to the variables determining the

82
adoption rate, given the fact that such effective communication minimizes the perceived
complexity via change agent efforts, such as a local solar company.
Another finding of our case study is that local solar companies are also important in
producing peer-effects. Previously, the understanding of peer-effects have been limited to
the interactions between adopters-to-adopters in the literature (Bollinger and Gillingham,
2012). The case study reveals that local solar companies may also influence the adoption
rate via the neighborhood effect on potential adopters due to image motivation. HET has
PV systems on its own roof, which is visible from the neighborhood, and offers to open its
doors of its solar center to anyone interested through its periodic solar-walks and open-
door days. These interactions improve the trialability of PV systems as perceived by
potential adopters.
“(...) we are a local company and we have many relative reference systems here in
the neighborhood, and yes I think that is well known. Plus, the combination of the
brand Thomas Hartmann has built, solar center, solar walk, that talking to
feelings, not just to purely technical side, also showing off the products. There is a
building here. That is always the most important, if one builds a place where
people can see. Not every customer care about the purely technical data, but they
want to experience.” (S.L., Solar Thermal Expert by HET, 31.01.2013).
“(Why have you chosen HET?) Because I work nearby and I always have contact
with HET.” (H.J.R., PV adopter, 29.01.2013).
5.1.4. SUMMARY OF THE FINDINGS
Why and how do the PV systems at grid parity get adopted at micro level? Primarily, the
adopters are usually motivated by financial and environmental reasons. This means that,
by adopting a PV system, the adopter believes to gain financial benefit or contribute to the
environment, and sometimes both. However, as the PV systems require a fundamental
change at adoption place (e.g., installing PV panels at the rooftop and inverter in the
house), financial and environmental motives are not enough the drive the diffusion. This
means, achieving grid parity, cannot easily boom the diffusion of solar PV systems.
Therefore, the change agents and peers, e.g., previous adopters, entrepreneurs and policy
makers, do play an important role on motivating the households for adopting solar PV
systems.

83
5.2. THE BUSINESS MODELS
The second research question of this Thesis was: How do business models of local solar
firms and the diffusion of solar PV systems at grid parity affect each other? In order to
answer this research question, we look at the business model of HET for PV systems,
which is based on developing projects of PV installations. These projects start with the
declaration of interest by potential adopters, i.e., request of quotation. When a potential
adopter, e.g., a household, declares interest, a representative of the company visits the
place on site where the PV system is planned to be installed. Depending on the
characteristics of the place and the preferences of the potential adopter, e.g., the roof
space, the sunshine potential and the budget of the potential adopter, HET drafts a project
and creates the sales quote (estimate). The sales quote shows what costs would be
involved for the prospective PV installation. If the potential adopter agrees on the sales
quote, he/she confirms this to HET. Based on this confirmation, HET then installs the PV
system on the place as planned. The system components needed for the installation are
provided by supplier companies, among others, PV module or inverter producers. In the
next sub-sections, the business model components are explained, following Morris et al.
(2005) and linking with relevant literature.
5.2.1. HOW DOES THE COMPANY CREATE VALUE FROM PV SYSTEMS?
PV system installation is not a simple task. It is bound to both adopters’ preferences and
the physical availability of the different types of places, e.g., the rooftop, garage, façade or
free-land. This means that each household needs a particular solution for installing the PV
system. In this context, HET creates value from developing projects of PV installations
that provides solutions for particular needs. Figure 21 presents some examples that HET
has installed for various needs in the neighborhood. The case of HET is an example of
product/service mix offering. In order to let the potential adopter know more about the
diverse PV applications, HET organizes monthly solar-walks since 2001. Such solar-
walks take place in the neighborhood of HET and can be attended by anybody interested.
In these three-hour walks, the attendees get the chance to visit a number of houses that
have already installed PV systems by HET. This helps the potential adopter to decide
which type of PV application is the best for their individual needs. Such close
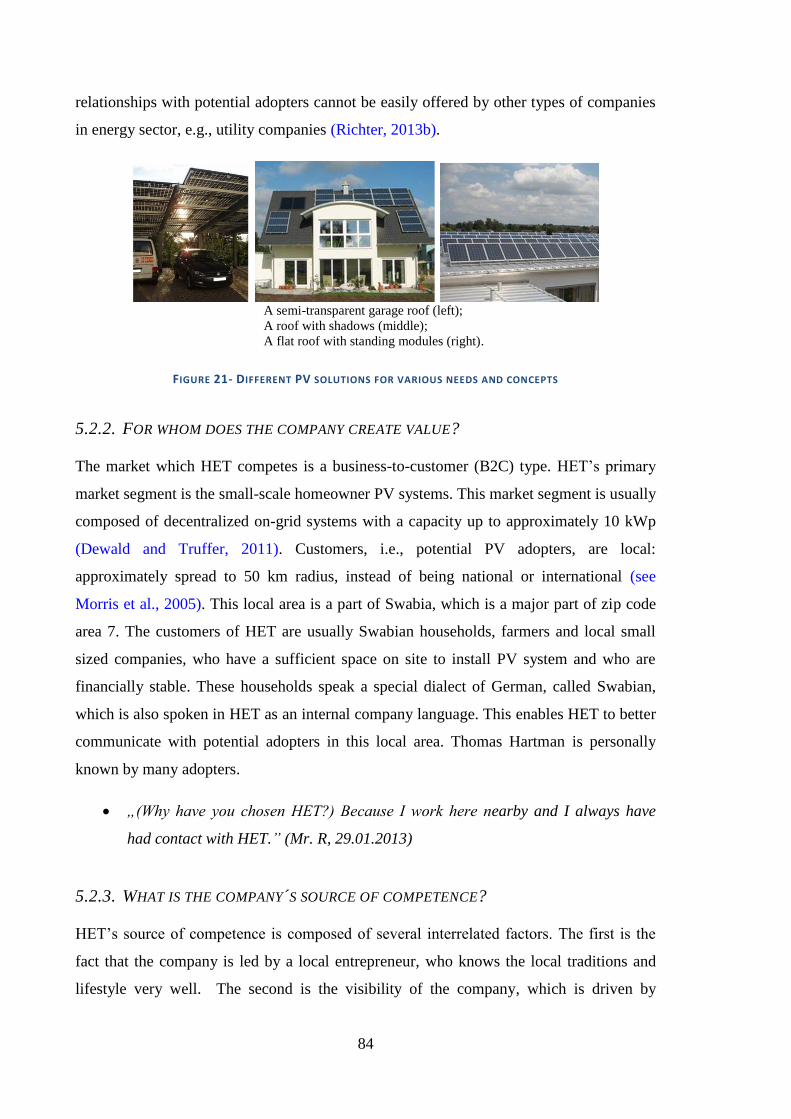
84
relationships with potential adopters cannot be easily offered by other types of companies
in energy sector, e.g., utility companies (Richter, 2013b).
A semi-transparent garage roof (left);
A roof with shadows (middle);
A flat roof with standing modules (right).
FIGURE 21- DIFFERENT PV SOLUTIONS FOR VARIOUS NEEDS AND CONCEPTS
5.2.2. FOR WHOM DOES THE COMPANY CREATE VALUE?
The market which HET competes is a business-to-customer (B2C) type. HET’s primary
market segment is the small-scale homeowner PV systems. This market segment is usually
composed of decentralized on-grid systems with a capacity up to approximately 10 kWp
(Dewald and Truffer, 2011). Customers, i.e., potential PV adopters, are local:
approximately spread to 50 km radius, instead of being national or international (see
Morris et al., 2005). This local area is a part of Swabia, which is a major part of zip code
area 7. The customers of HET are usually Swabian households, farmers and local small
sized companies, who have a sufficient space on site to install PV system and who are
financially stable. These households speak a special dialect of German, called Swabian,
which is also spoken in HET as an internal company language. This enables HET to better
communicate with potential adopters in this local area. Thomas Hartman is personally
known by many adopters.
„(Why have you chosen HET?) Because I work here nearby and I always have
had contact with HET.” (Mr. R, 29.01.2013)
5.2.3. WHAT IS THE COMPANY´S SOURCE OF COMPETENCE?
HET’s source of competence is composed of several interrelated factors. The first is the
fact that the company is led by a local entrepreneur, who knows the local traditions and
lifestyle very well. The second is the visibility of the company, which is driven by

85
complementary social activities that potential adopters can have at the company. This
includes having the opportunity to dine at the company´s restaurant where the food is
cooked by using renewable sources; participating in the monthly three-hour solar-walks
(to observe the previous projects of HET); and touring HET on its annual open-door days.
The third factor is the quality of the PV installations, mainly based on German solar
modules and inverters. In a nutshell, the competence of HET is what Morris et al. (2005)
call an intimate-customer type. As an HET engineer noted,
"Probably because we are a local company and we have many good reference
systems here in the neighborhood, and yes I think we are well known. Plus, the
combination of the brand Thomas Hartmann has built (is very important). Solar
center and solar walks talk to the feelings; they are not just about purely technical
side. This shows off the products. There is a building here. That's always the most
important thing, if one builds a place where people can see. Not every customer
care about the purely technical data, but they want to experience” (An Engineer
in HET, 31.01.2013)
5.2.4. HOW DOES THE COMPANY COMPETITIVELY POSITION ITSELF?
“I received two offers; one from Hartmann and one from other guy. I did the
comparison but I choose the one which was expensive. It is a local installation
company, well-known in the region, there are many references in the area, and he
is a very well-known guy. Go for the local1” (PV system adopter, Mr. M,
21.12.2012)
“He (Thomas Hartmann) is trustworthy. I prefer local craftsmen and German PV
modules, no imports, and for this I am willing to spend more money” (PV system
adopter, Mr. R., 23.01.2013)
HET intends to achieve an advantage over its competitors by providing local products
with a good quality service. As HET is pioneer in the region, the company has many
reference projects that instill trust in HET among adopters in terms of the quality of the
installations. Previous research based in other countries (Müggenburg et al., 2012; Palit,
2013) also argues that quality of PV systems are vital for potential adopters’ decisions.
According to one adopter,

86
“We had three companies in the race; we asked them all for an offer. We thought
we choose the company that is already well-known, which always works for
ideological reasons (environmental reasons). Other companies simply appeared
on the market in recent years, they want to sell a lot... All three were regional. We
want to buy from our local neighborhood- as much as possible- because you have
reliable people here. Many years of experience and highly trained staff were the
deciding factors for HET. HET was the most expensive, but not so much” (PV
system adopters, Mrs. W. & Mr. H., 29.01.2013)
Most adopters believe that Thomas Hartman is driven by an ecological idealism and he is
a trustworthy entrepreneur. Such trust towards local solar companies is usually associated
with the green movement, and, in particular, against nuclear power (Dewald and Truffer,
2012, p. 409). This seems to be one of the main reasons of why several potential adopters
choose HET, instead of its competitors that entered the market several years after HET,
when policy makers started to support PV installations through the EEG law in 2000s. If a
solar company was established after 2000, potential adopters often perceive it as profit-
oriented.
5.2.5. HOW DOES THE COMPANY MAKE MONEY?
Figure 22 presents a simple scheme of the value network of HET. In Germany, policy
support is not provided by subsidies but through the EEG surcharge (see H. Wirth, 2014,
p. 22). Anybody who uses electricity has to pay taxes on the EEG surcharge, which funds
the Feed-in-Tariff. As a result, the Feed-in-Tariff pays for adopters, e.g., to whom HET
installed PV system, for the electricity generated with fixed feed-in tariffs for the next 20
years from the time the PV system is connected. Such a guarantee enables potential
adopters to pay the high installations costs, which are usually passed on to local solar
companies, e.g., HET. This mechanism is similar to the end-user owned residential type in
the PV sector in the USA (see Frantzis et al., 2008, p. 10). As Dewald and Truffer (2011,
p. 292) also argues, such mechanism relies heavily on the policy support generated by the
EEG surcharge.
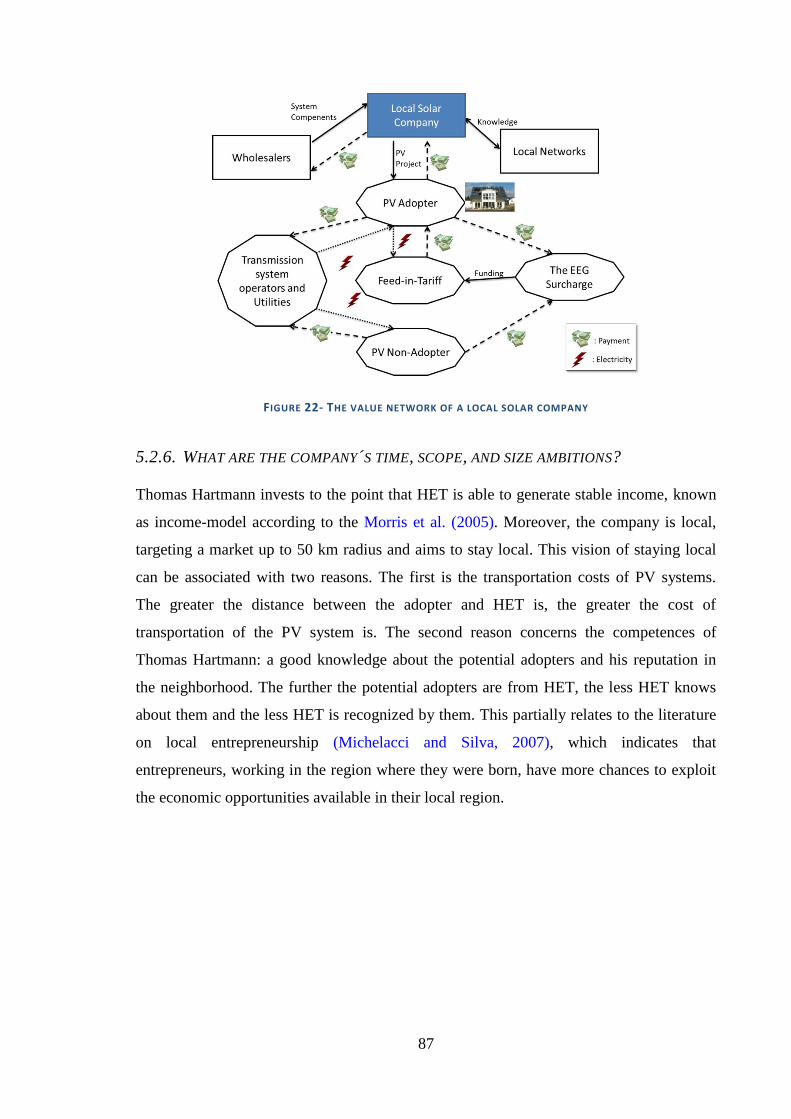
87
FIGURE 22- THE VALUE NETWORK OF A LOCAL SOLAR COMPANY
5.2.6. WHAT ARE THE COMPANY´S TIME, SCOPE, AND SIZE AMBITIONS?
Thomas Hartmann invests to the point that HET is able to generate stable income, known
as income-model according to the Morris et al. (2005). Moreover, the company is local,
targeting a market up to 50 km radius and aims to stay local. This vision of staying local
can be associated with two reasons. The first is the transportation costs of PV systems.
The greater the distance between the adopter and HET is, the greater the cost of
transportation of the PV system is. The second reason concerns the competences of
Thomas Hartmann: a good knowledge about the potential adopters and his reputation in
the neighborhood. The further the potential adopters are from HET, the less HET knows
about them and the less HET is recognized by them. This partially relates to the literature
on local entrepreneurship (Michelacci and Silva, 2007), which indicates that
entrepreneurs, working in the region where they were born, have more chances to exploit
the economic opportunities available in their local region.
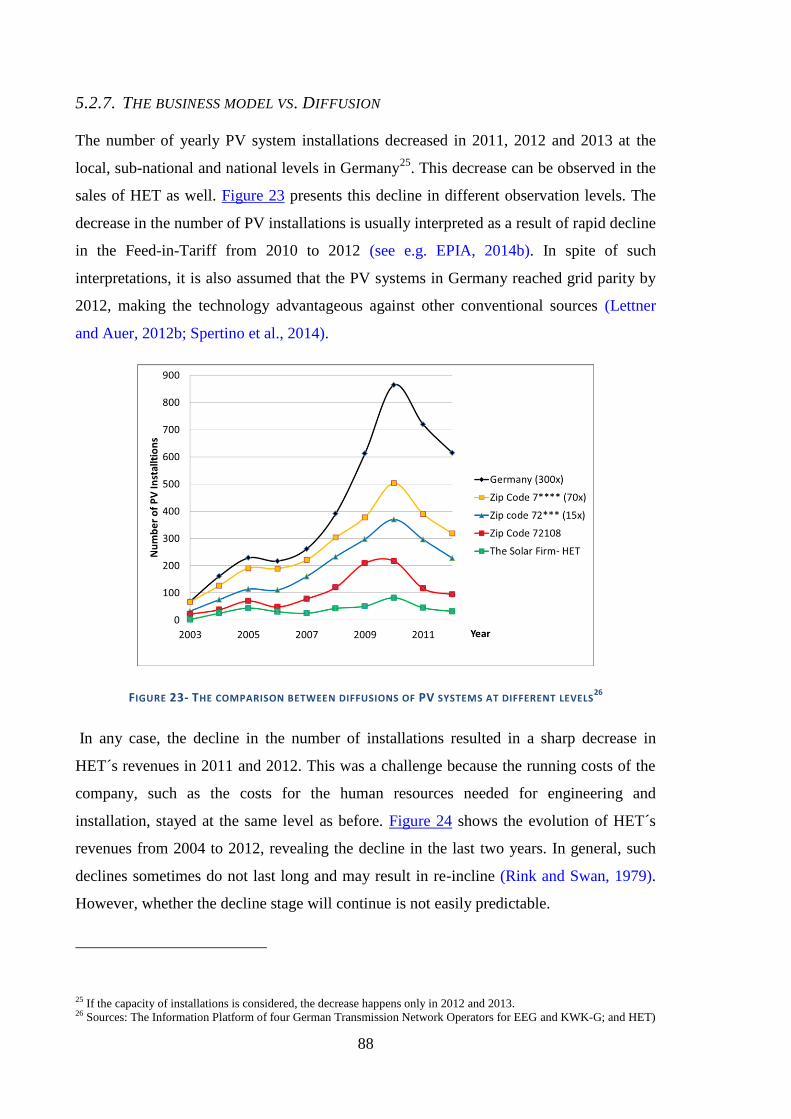
88
5.2.7. THE BUSINESS MODEL VS. DIFFUSION
The number of yearly PV system installations decreased in 2011, 2012 and 2013 at the
local, sub-national and national levels in Germany25
. This decrease can be observed in the
sales of HET as well. Figure 23 presents this decline in different observation levels. The
decrease in the number of PV installations is usually interpreted as a result of rapid decline
in the Feed-in-Tariff from 2010 to 2012 (see e.g. EPIA, 2014b). In spite of such
interpretations, it is also assumed that the PV systems in Germany reached grid parity by
2012, making the technology advantageous against other conventional sources (Lettner
and Auer, 2012b; Spertino et al., 2014).
FIGURE 23- THE COMPARISON BETWEEN DIFFUSIONS OF PV SYSTEMS AT DIFFERENT LEVELS26
In any case, the decline in the number of installations resulted in a sharp decrease in
HET´s revenues in 2011 and 2012. This was a challenge because the running costs of the
company, such as the costs for the human resources needed for engineering and
installation, stayed at the same level as before. Figure 24 shows the evolution of HET´s
revenues from 2004 to 2012, revealing the decline in the last two years. In general, such
declines sometimes do not last long and may result in re-incline (Rink and Swan, 1979).
However, whether the decline stage will continue is not easily predictable.
25 If the capacity of installations is considered, the decrease happens only in 2012 and 2013. 26 Sources: The Information Platform of four German Transmission Network Operators for EEG and KWK-G; and HET)

89
FIGURE 24- REVENUE OF HET FROM PV INSTALLATIONS AND OTHER SERVICES AND PRODUCTS27
One additional reason for the sharp decline in the revenue of HET is also decreasing
turnover per PV installation (see Figure 25). For example in 2006, the average price of a
PV system that HET installed was around 60000 Euros. This average price decreased to
around 30000 Euros in 2012, probably as a result of a learning curve effect (Spence, 1981)
on the price of system components such as solar modules (see Nemet, 2006 for other
possible reasons beyond learning curve).
27 The values are approximate.

90
FIGURE 25- THE DECLINING AVERAGE COST OF PV INSTALLATIONS28
Business model conceptualization considers the process of doing business and explains the
challenges in operationalizing the construct (Zott et al., 2011). In this context, we
recognize a critical challenge for HET. Similar to the other actors in the renewable energy
sector (Wüstenhagen and Menichetti, 2012), the challenge of HET has been bound to the
risks and opportunities, created by the policy measures. The challenge lies not only on the
decreasing revenue but also on the possible strategies to tackle this decrease. In general,
such revenue decreases, e.g., which is associated with declining adoption or costs, can be
tackled by different strategies such as launching incremental or disruptive innovations in
the market (see e.g., Christensen, 1997) or expansion into national and international
markets with the existing innovations (see e.g., Beise, 2005; Johanson, 1978)29
. The
former strategy is not easy the case of HET because the existing adopters are bound to the
20-year lasting EEG support. In addition, these adopters usually do not have extra space
left at their houses for new types of installations. The latter strategy can be a possible
option, but it contradicts HET´s desire to stay local. HET does not plan to expand its
market because its source of competence is highly associated with its local market.
28 The values are approximate. 29 Such a challenge might be also tackled by different strategies, e.g., introducing new products or services in the market.
However, we do not aim to give a full picture of all possible options that the company has considered or might consider
in the future. Instead, we exemplify only a few most relevant options.
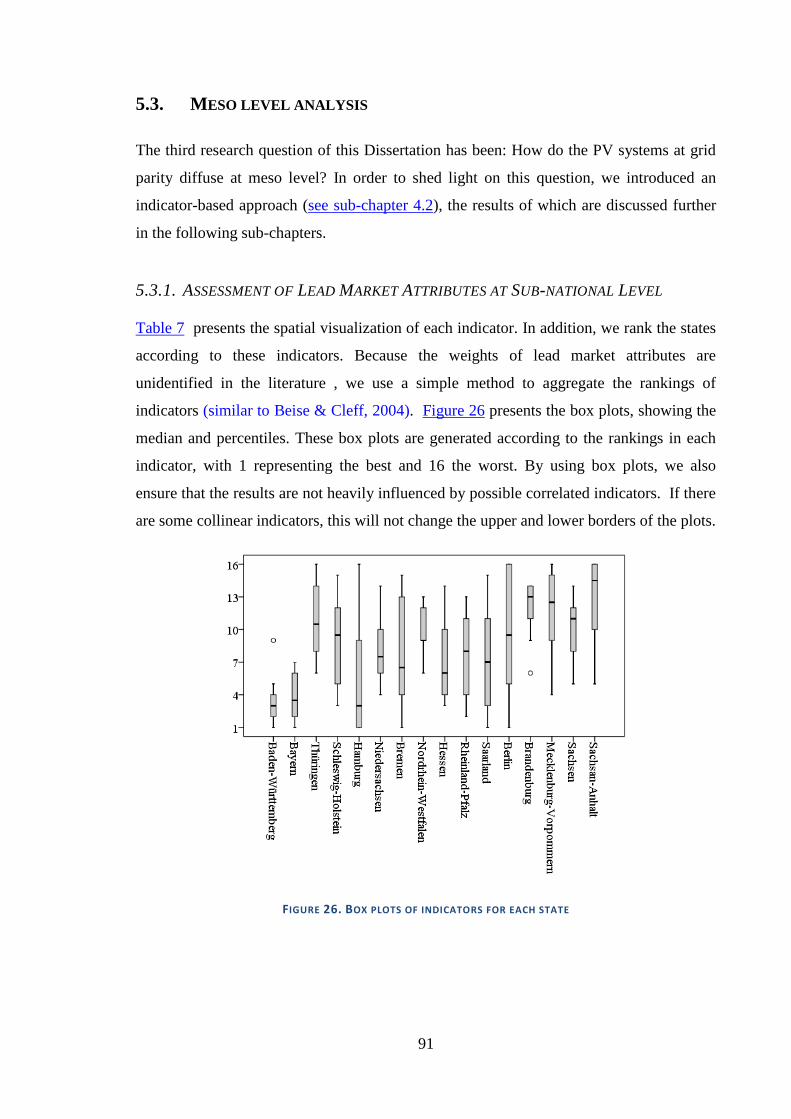
91
5.3. MESO LEVEL ANALYSIS
The third research question of this Dissertation has been: How do the PV systems at grid
parity diffuse at meso level? In order to shed light on this question, we introduced an
indicator-based approach (see sub-chapter 4.2), the results of which are discussed further
in the following sub-chapters.
5.3.1. ASSESSMENT OF LEAD MARKET ATTRIBUTES AT SUB-NATIONAL LEVEL
Table 7 presents the spatial visualization of each indicator. In addition, we rank the states
according to these indicators. Because the weights of lead market attributes are
unidentified in the literature , we use a simple method to aggregate the rankings of
indicators (similar to Beise & Cleff, 2004). Figure 26 presents the box plots, showing the
median and percentiles. These box plots are generated according to the rankings in each
indicator, with 1 representing the best and 16 the worst. By using box plots, we also
ensure that the results are not heavily influenced by possible correlated indicators. If there
are some collinear indicators, this will not change the upper and lower borders of the plots.
FIGURE 26. BOX PLOTS OF INDICATORS FOR EACH STATE

92
TABLE 7. THE SPATIAL VISUALIZATION OF THE INDICATORS FOR LEAD MARKET ATTRIBUTES
[1/L
CO
E]
(kWp/€) [Gre
en]
(%)
[Em
plo
ym
ent]
(%) [Housi
ng]
(%)
[R&
D]
(%) [Pat
ent]
(%)
[Dem
onst
rati
on]
(%) [Fore
igner
s]
(%)
[Export
] (%
)
(%) [Init
iati
ves
]
(%)

93
Baden-Württemberg and Bayern have relatively better rankings in indicators than the rest
of the states. These two states appear as the best in [1/LCOE], i.e., cost advantage,
[Employment] and [R&D] and no worse than 9th
in any indicator out of 16 states. It means
that the presence of lead markets attributes at sub-national level may be observable. The
city-states Hamburg and Bremen present an interesting example. Although any of these
city-states appear to be top in some indicators, such as [Foreigners], [Patents] or [Export],
they are both ranked worse than 12th
in other indicators, such as [1/LCOE] and [Housing].
5.3.2. SPATIAL DIFFUSION CURVE ANALYSIS
Figure 27 shows the spatial curves of small scale PV diffusion in Germany, which is
similar to the proposed pattern of Beise´s model (Beise, 2004). As predicted by the theory,
the states of Baden-Württemberg and Bayern, mainly zip code zones 7, 8 and 9, do have
not only advantages in most of the indicators, therefore, in lead market attributes, but also
higher adoption rates.
FIGURE 27. THE SPATIAL DIFFUSION PATTERN OF PV IN 10 ZIP CODE AREAS OF GERMANY
The lead market model (Beise, 2004) also assumes that lead markets have a rapid growth
in the initial phase whereas the lag markets start to catch up in the later phases; and that is
what we partially observe in the case of small scale PV market at sub-national scale. As
illustrated in Figure 28, the spatial lead market (zones from seven to nine) grew faster than

94
the spatial lag markets (zones from zero to six) between 2000, the year German
Renewable Energy Act (EEG) was implemented, and 2004, the year the first amendment
EEG was carried out. After 2004, the growth rate of spatial lag markets overtook the
spatial lead markets’.
FIGURE 28. THE GROWTH RATE FOR CUMULATIVE NUMBER OF PV INSTALLATIONS IN GERMANY
Yet, the case of Bremen and Hamburg is, again, an interesting example of which
additional insight lead market model could provide. One can easily assume that Hamburg
and Bremen do not score high in market development because of their city-state
characteristics, e.g., limited space on roofs, or the limited sunshine in the north. However,
what might be overlooked is the fact that the growth rate in lag markets, e.g., Bremen and
Hamburg, overtake the lead ones, e.g., Bayern and Baden-Wuerttemberg.
Having said all that, we are aware of that the diffusion of PV systems has neither been
saturated in the lead markets nor in the lag ones. The convergence in growth rates does not
necessarily mean that lag markets will fully catch up with the leads in the future. This is
especially important to understand for a technology like PV systems that are exposed to
the new ways of policy-intervention (e.g., new German subsidy scheme for solar battery
adopters since 2013) and technological breakthroughs, e.g., advancement of efficient solar
batteries (which are complementary to PV systems), increasing efficiency of PV systems
and the disruptive innovations on PV installation practices (see e.g. The Economist, 2015).
Such developments might revive the spatial lead markets, where the growth rates had
recently been decreasing.

95
5.3.3. NATIONAL REGULATIONS IN AN INTERNATIONAL CONTEXT
The extant literature has acknowledged the necessity of understanding not only the spatial
dimension in advancing sustainable transitions (Binz et al., 2014; Truffer and Coenen,
2012) but also the dynamics of diffusion processes for policy-driven environmental
innovations, especially in the renewable energy sector (Quitzow et al., 2014). Beise and
Rennings (2005) state that strict national policy might result in the creation of lead
markets when complemented by global diffusion of regulation and demand. This resonates
with the study of Quitzow et. al. (2014), which argues that international diffusion of
environmental innovations are bound to either diffusion of successful regulations or the
decrease of the financial costs. In the case of PV systems, the German feed-in tariff had
not diffused to other countries (in its effective form), nor had the costs of electricity
generation from PV systems been competitive until 2012. As the lead market model
implies, we assume that any region outside the lead market is potentially a lag market.
This means that in a new era when the LCOE of PV systems become financially
compatible with other sources of electricity generation in some regions (e.g. see Breyer
and Gerlach, 2013; Spertino et al., 2014) and the updated policy support schemes in
emerging countries, e.g., China (Zhang et al., 2014) , we can also observe the recent take
off, e.g., approx. since 2013, in other regions outside of Germany.
Our study acknowledges that in order to achieve National Renewable Energy Action Plans
(NREAPs), which are heterogeneous among countries (see e.g. Beurskens et al., 2011), it
is important to understand the underlying regional dynamics of diffusion. The PV systems
in Germany is expected to achieve the NREAP for 2020 earlier than planned (EPIA,
2013). The German case is an illustrative example of how national-wide regulations
induce sub-national lead markets which consequently results in national diffusion. As the
German EEG was able to drive the diffusion of photovoltaic diffusion in a particular sub-
national region that has innovation-specific lead market attributes, which are Baden
Württemberg and Bayern, the diffusion in other regions has incrementally followed the
lead ones. This can be important to understand for policymakers as similar developments
might occur for environmental innovations in other countries. When developing national
policies, it is essential to assess the lead market potential of sub-national regions, and,
consequently, develop regulations responding to the demand of the potential lead market.

96
5.4. MATHEMATICAL MODEL
The fourth research question of this thesis has been: How can the diffusion of solar PV
systems be better forecasted at meso level? Keeping this in mind, I propose a finite
element method to forecast the solar PV systems (see chapter 4.3 for method details).
Through this method, the governing equation on the diffusion rate (D) has been solved at
43 incremental time steps through the ABAQUS software (Abaqus, 2013). This
calculation lasted for 35 seconds30
. Based on this solution, it is possible to obtain the
values of diffusion rate (D) for any spatial point in any given time. For example, the
diffusion rate in each spatial location after 13 years of diffusion is plotted as a counter map
in Figure 29. The red color accounts for 100% diffusion rate, while blue color indicates for
around 9% diffusion rate. The HET is located on the red area and that is why this area has
100% diffusion ratio. The zip code area 72149, which has the lowest innovation
diffusivity, has also accounts for the lowest diffusion ratio after 13 years. In line with the
literature (see e.g. Morrill, 1970; Rogers, 2003), not only the distances between potential
adopter and innovation source but also innovation diffusivity seem to be decisive for the
heterogeneous diffusion rate that is spread in the given geography.
In order to see the differences on diffusion patterns on different spatial points, the 5
locations, namely as A, B, C, D and E (as shown in Figure 29), are additionally analyzed.
The resultant curves present the evolutions of diffusion rate (D) on given points as
illustrated in Figure 30. The curves have a typical s-shape as studied by literature (Bass,
1969; Rogers, 1962), showing that the selected locations are at a variety of stages of
diffusion process. If a location is nearer to the HET, it is most likely to have a rapid
diffusion. However, the diffusion is also bound to the innovation diffusivity. For example,
the location B has a slower diffusion than the location A, although the location B is closer
to the HET than the location A is. This can be explained due to the fact that location B has
lower innovation diffusivity value than the location A does.
30 Such calculation is almost impossible to conduct without a computational software
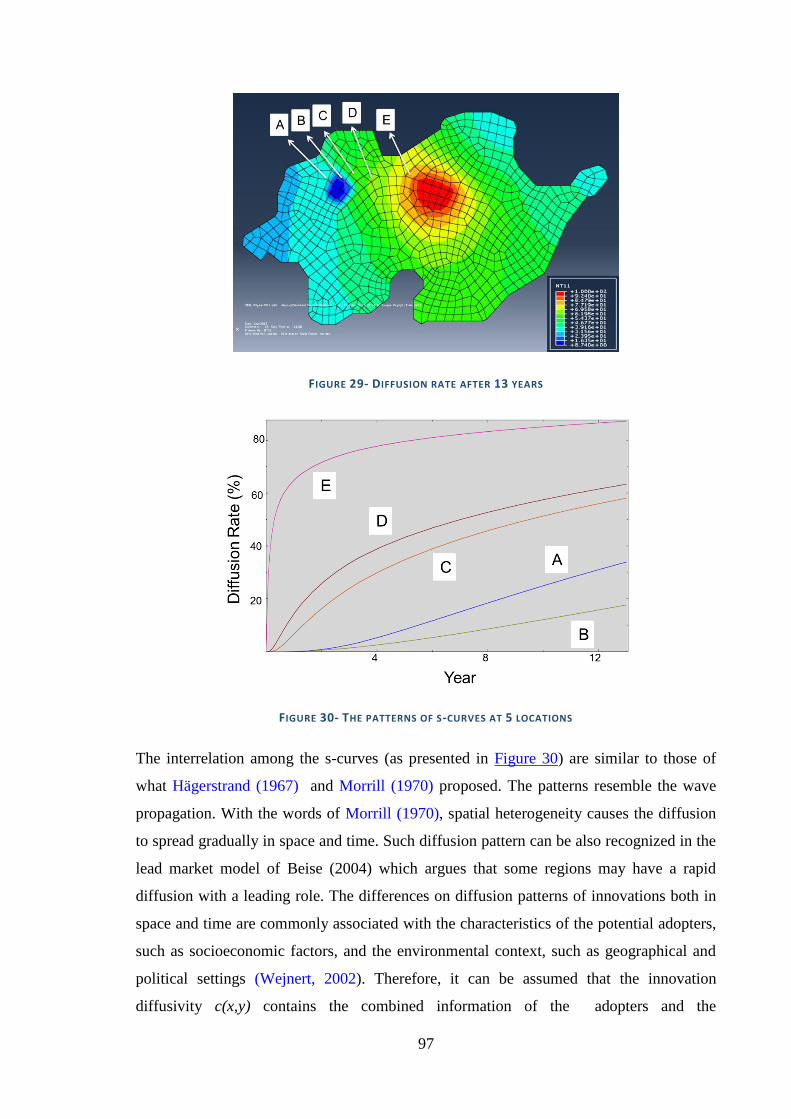
97
FIGURE 29- DIFFUSION RATE AFTER 13 YEARS
FIGURE 30- THE PATTERNS OF S-CURVES AT 5 LOCATIONS
The interrelation among the s-curves (as presented in Figure 30) are similar to those of
what Hägerstrand (1967) and Morrill (1970) proposed. The patterns resemble the wave
propagation. With the words of Morrill (1970), spatial heterogeneity causes the diffusion
to spread gradually in space and time. Such diffusion pattern can be also recognized in the
lead market model of Beise (2004) which argues that some regions may have a rapid
diffusion with a leading role. The differences on diffusion patterns of innovations both in
space and time are commonly associated with the characteristics of the potential adopters,
such as socioeconomic factors, and the environmental context, such as geographical and
political settings (Wejnert, 2002). Therefore, it can be assumed that the innovation
diffusivity c(x,y) contains the combined information of the adopters and the
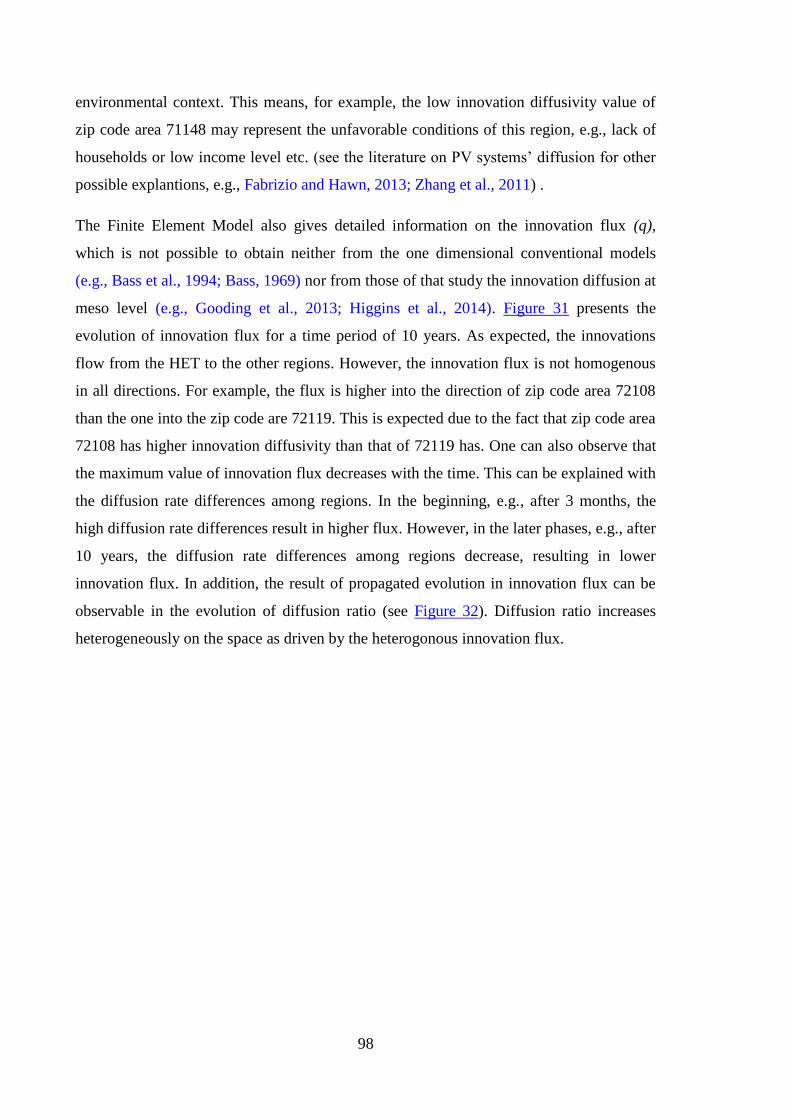
98
environmental context. This means, for example, the low innovation diffusivity value of
zip code area 71148 may represent the unfavorable conditions of this region, e.g., lack of
households or low income level etc. (see the literature on PV systems’ diffusion for other
possible explantions, e.g., Fabrizio and Hawn, 2013; Zhang et al., 2011) .
The Finite Element Model also gives detailed information on the innovation flux (q),
which is not possible to obtain neither from the one dimensional conventional models
(e.g., Bass et al., 1994; Bass, 1969) nor from those of that study the innovation diffusion at
meso level (e.g., Gooding et al., 2013; Higgins et al., 2014). Figure 31 presents the
evolution of innovation flux for a time period of 10 years. As expected, the innovations
flow from the HET to the other regions. However, the innovation flux is not homogenous
in all directions. For example, the flux is higher into the direction of zip code area 72108
than the one into the zip code are 72119. This is expected due to the fact that zip code area
72108 has higher innovation diffusivity than that of 72119 has. One can also observe that
the maximum value of innovation flux decreases with the time. This can be explained with
the diffusion rate differences among regions. In the beginning, e.g., after 3 months, the
high diffusion rate differences result in higher flux. However, in the later phases, e.g., after
10 years, the diffusion rate differences among regions decrease, resulting in lower
innovation flux. In addition, the result of propagated evolution in innovation flux can be
observable in the evolution of diffusion ratio (see Figure 32). Diffusion ratio increases
heterogeneously on the space as driven by the heterogonous innovation flux.

99
FIGURE 31- INNOVATION FLUX AFTER 3 MONTHS, 4 YEARS, 7 YEARS AND 10 YEARS
FIGURE 32- DIFFUSION RATIO AFTER 3 MONTHS, 4 YEARS, 7 YEARS AND 10 YEARS
The findings of the Finite Element Model on the case of PV systems´ diffusion have
important implications for scholars who seek to study the diffusion of innovations as a
space-time process. The Finite Element Model applied in this Thesis presents a
comprehensive explanation on the spatial patterns of the diffusion. In addition, the model
serves as a powerful method to solve the partial differential equations which have infinite
number of unknowns. This means that the Finite Element Models can be also easily
applicable to the other mathematical formulations of innovation diffusion that are based on
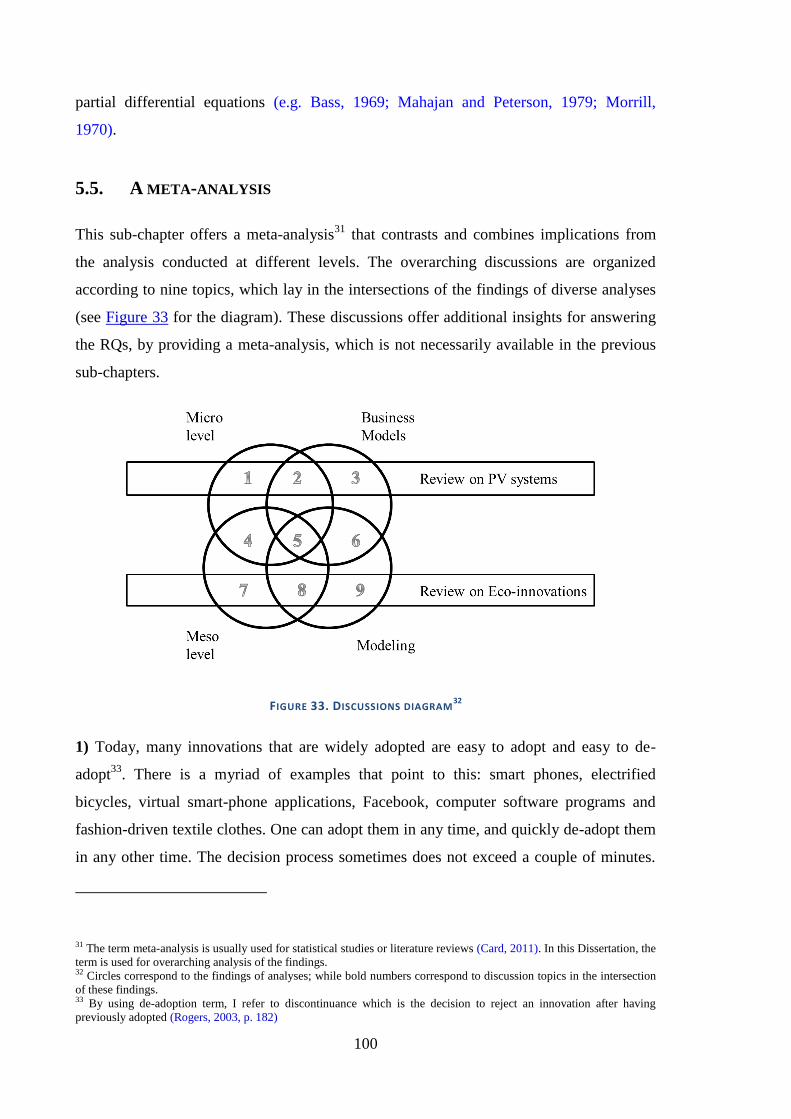
100
partial differential equations (e.g. Bass, 1969; Mahajan and Peterson, 1979; Morrill,
1970).
5.5. A META-ANALYSIS
This sub-chapter offers a meta-analysis31
that contrasts and combines implications from
the analysis conducted at different levels. The overarching discussions are organized
according to nine topics, which lay in the intersections of the findings of diverse analyses
(see Figure 33 for the diagram). These discussions offer additional insights for answering
the RQs, by providing a meta-analysis, which is not necessarily available in the previous
sub-chapters.
FIGURE 33. DISCUSSIONS DIAGRAM32
1) Today, many innovations that are widely adopted are easy to adopt and easy to de-
adopt33
. There is a myriad of examples that point to this: smart phones, electrified
bicycles, virtual smart-phone applications, Facebook, computer software programs and
fashion-driven textile clothes. One can adopt them in any time, and quickly de-adopt them
in any other time. The decision process sometimes does not exceed a couple of minutes.
31 The term meta-analysis is usually used for statistical studies or literature reviews (Card, 2011). In this Dissertation, the
term is used for overarching analysis of the findings. 32 Circles correspond to the findings of analyses; while bold numbers correspond to discussion topics in the intersection
of these findings. 33 By using de-adoption term, I refer to discontinuance which is the decision to reject an innovation after having
previously adopted (Rogers, 2003, p. 182)

101
They do not also have any long-term remaining and visible consequences on the adoption
units. When de-adoption occurs, the main consequences of the adoption quickly disappear.
However, solar PV systems present particular differences from such kinds of innovations
that influence the perception of potential adopters and, consequently, the diffusion
process. One cannot easily adopt solar PV systems; nor in 5 minutes neither in 1 day. In
the high-income economy context, solar PV systems need a relatively high financial
investment by the adopter unit, e.g., twenty-thousand Euros (€) for a small single-family
house in Germany by 2013, and have long-term effects on the adoption units. By adopting
the PV systems and benefiting from the feed-in tariff, the adopter makes a tacit agreement
that binds him/her/them for the next 10 years. Once the adoption takes place, the PV
adopter cannot easily de-adopt it anymore, at least in a short-term time. It is because the
financial benefits of adopting PV systems appear in long-term; and adopters naturally
prefer to wait for years to receive these benefits. In the context of low-income economies,
adopting solar PV systems usually means “electrification”. The potential adopters are
often those who had been used to live without electrification. Adopting a PV system do
change the lifestyle, e.g., they can use mobile phones and charge them with the electricity
generated by the PV systems or read a book under a lamp, electricity of which is generated
by the PV system. In both contexts, adopting a PV system become easily visible by
others, making it a symbol of lifestyle and, sometimes, social status. Adoption has long-
terms benefits for adopters in both low-income and high-income economies. Therefore, in
a nutshell, “solar PV systems are neither easy to adopt nor easy to de-adopt”.
2) In general, it seems that several supply and demand side factors might affect each other.
For example, the production choice of the firms affects what customers buy in the market,
or the vice-versa: what customers buy in the market affects the production choice of the
firms. On the one hand, one can easily observe correlation between events but it does not
necessarily mean causality. On the other hand, one can also observe several versatile
causalities between several sets of events. One way of understanding the relation between
events could be, to some extent, conducting in-depth studies. In the case of Rottenburg am
Neckar, the relation between the activities of the solar firm and the diffusion of PV
systems seem to have influenced each other. The solar firm influences the potential
adopters in favor of adoption of solar PV systems, resulting in a direct effect on the local
diffusion. However, the wide adoption of solar PV systems (driven by many other local
solar companies all over the country) leads to price reductions on solar PV panels and

102
their installations (due to economies of scale). Consequently, the reduced prices result in
decline on the turnovers of solar local companies- giving rise to business model
challenges. Although this has a context limited basis, i.e., Germany, the review on PV
systems (sub-chapter 3.2.2) presents that local firms or other bodies of intermediaries, are
important drivers of the diffusion in other countries as well. Therefore, such challenges
(and versatile interplays) might occur in other contexts, including both low and high
income level economies.
3) Nowadays, many internationally adopted innovations have been built upon the
international diffusion of their standardized complementary innovations. For example, the
international diffusion of high quality bike tires have built upon the wide international
diffusion of standardized bicycles. If an individual does not have one of those bicycles,
there is no way that can lead to adoption of a high quality tire. However, it is not the case
for for small scale PV systems. It is mainly because there is no standardized way of
housing around the world. In some regions, households do have proper spaces for the
installation of solar PV systems, while in some others, they do not. This raises an
important contrast between the firms’ business models located in different parts of the
world. For example, in low-income economies, after-sale services can be an important part
of firms’ businesses- mainly due to poor maintenance standards. However, in high-income
economies, developing building integrated PV solutions can be more suitable to be
offered, as the potential adopters might be more willing to pay more for aesthetical
reasons.
4) Comparing the motives for diffusion of PV systems at adopter level and the attributes
of leading regions, one can observe some similar dynamics. Some individuals –with
certain characteristics- might adopt the PV systems at an earlier phase than others and can
motivate their peers in the neighborhood for the adoption of PV systems, i.e. peer effects
(Bollinger and Gillingham, 2012). In the same token, some regions- if they have the lead
market attributes- might have some leading effects on other regions, i.e., lead market
hypothesis (Beise, 2001). When these different observation levels could be combined, one
can analyze the cascading effects among the levels. Adoption takes place at adopters’
level, but the diffusion occurs at the regional and national level. If the early adopters of an
innovation do affect their peers and the pioneer regions do affect other regions (in favor of
the adoption of an innovation), diffusion can outreach to national and global levels.

103
5) It is a hard task to forecast the behavior of individual adopters or firms. Although two
potential adopters in the same neighborhood seem to be similar, one can adopt the
innovation while the other not. In the same token, two firms in the same sector may seem
to have similar business models. However, one can have an incline in the revenue, while
the other can have a decline. That said, if the observation is conducted at a system level,
e.g., regional level, one can have some analytical basis to model and forecast the systemic
behaviors e.g., diffusion of innovations. The regional trends become observable and
forecasting, based on the historical data, can be possible.
6) The well-known Bass (1969) model has been used by firms to develop marketing
strategies for decades. Similarly, one can use the finite element model. For example, by
using the spatiotemporal historical diffusion data through a finite element model, firms
can forecast the declines and inclines in specific regions and develop strategies to harvest
the maximum out of such diffusion trends. This is specifically important for the cases, at
which the spatial proximity matters. For example, in the case of Hartmann Energietechnik
GmbH, the firm offers installation services for the potential PV adopters. It means that the
firm needs to transport the PV panels to the households when the installation takes places.
The more the potential adopter is far from the firm, the more costly the PV system is to be
transported. This means that, if a firm is able to forecast the spatial trends of diffusion, the
firm can optimize its strategy in a way that it can harvest the increase of diffusion rate in
some far regions but, at the same time, keep the transportation cost as low as possible. One
possible way of doing this could be setting up new branches of the firm at high-growing
regions which might be located far away.
7) Sustainable energy transition is a complex process and designing policies to enforce
this transition is challenging. It has multi-dimensional aspects, e.g., management,
economics, sociology and marketing (see sub-chapter 3.2.1). Yet, one of the key
approaches to design effective policy measures could be lying on the better understanding
of the regional dynamics. The countries lagging in such transitions could design measures
that fit well to the potential regional lead market of the respective countries, instead of
transferring other policy measures from foreign countries. In such way, lead regions of
diffusion can be induced and, subsequently, the national adoption can be driven by the
lead region- as it happened in the case of diffusion of solar PV systems in Germany (as
argued in sub-chapter 5.3).

104
8) Climate change is a global issue. Reducing the emissions in some particular countries
do not necessarily lead to stopping the climate change. For example, in the energy sector,
a wide diffusion of renewable energy technologies in particular countries might
surprisingly give a rise to reduction on the prices of fossil fuels (because of lack of
demand in the countries that do not need any more fossil fuels), which can result in more
use of those fuels in other countries, accelerating the climate change. Therefore, diffusion
of renewable innovations should have a global outreach. This has already been addressed
in the literature on international diffusion of environmental innovations, particularly
trough the lead market concept. That said, if an immediate action is needed to be taken
against the climate change, one can be interested to be able to forecast the diffusion
patterns. In this token, the leading roles of regions (the regions that has the five lead
market attributes as proposed in the indicator-based analysis) on the global diffusion of
innovations could be modeled and forecasted with advanced methods such as finite
element method.
9) The strong similarities between how salt diffuse in water and how innovations or
diseases diffuse in societies attracted many scholars to model the diffusion of innovations
through a variety of approaches inspired by natural sciences. However, the social
processes are complex and it is hard to measure the micro characteristics of societies that
mind hinder or drive the diffusion of innovations. In case of environmental technologies,
not many innovations have been able to diffuse to a larger extent. Yet, many scholars have
recently attempted to model and forecast the diffusion of environmental innovations
through agent based models (see e.g., the findings of literature review, sub-chapter 3.2.1).
Finite element analysis, by using the historical data on the micro level, is just another
alternative method to tackle the modeling issues. The method can successfully model the
diffusion of salt in water in time and space because we can precisely know the micro
characteristics of the water used in the respective experiment. So why not the diffusion of
innovations? The only need might be the big data collected at micro-level.

105
6. CONCLUSIONS, CONTRIBUTIONS AND
LIMITATIONS
6.1. THEORETICAL IMPLICATIONS AND CONTRIBUTIONS
6.1.1. GRID PARITY: A DISILLUSION?
The literature on environmental and renewable energy innovations has assumed that the
high cost has been the main barrier for the wide adoption of such innovations (e.g.
Jacobsson and Johnson, 2000; Lund, 2011; Painuly, 2001). There has been a great hope
that achieving the grid parity for renewable energy innovations, or cost competiveness of
environmental innovations in general, would boost the diffusion. A recent study by Munoz
et al. (2014), based on a discourse analysis of the literature, also shows that the majority of
scholars claims that achieving the grid parity is either one or the key milestone(s) of the
diffusion of solar PV systems. However, a few scholars, e.g., Yang (2010) (as cited in
Munoz et al., 2014), expected that grid parity would not necessarily guarantee the wide
adoption of solar PV systems.
To my knowledge, there has not been any study conducting an in-depth analysis of
diffusion of solar PV systems at grid parity to date. The micro analysis of this
Dissertation, therefore, represents the first in-depth attempt that falls into this highly
debated gap in the literature. This analysis illustrates that achieving grid parity has not
necessarily boosted the diffusion of renewable energy innovations, in particular that of the
small scale solar PV systems. This is also in line with the primary finding of the literature
review on PV systems (sub-chapter 3.2.2), which focuses on the barriers to the adoption of
PV systems. This review shows that cost and price related barriers have been only a little
part of the big picture. Most of the barriers, that hinders the wide adoption of solar PV
systems, have been related to the socio-technical, political and managerial dimensions.
Therefore, I can argue that grid party has not boosted the diffusion and neither will it
easily boost the diffusion in the future. This can be a bad news for those who expected
much from the grid parity.
106
6.1.2. LOCAL FIRMS: DRIVERS OR VICTIMS?
In regard to the firms, Penrose (2009, p. 4) suggests that, “a comprehensive theory should
take account of not only the sequence of changes created by a firm’s own activities but
also the effect of changes that are external to the firm and lie beyond its control”. In this
token, business model analysis of this Thesis illustrates both the firm’s activities and the
effect of external changes. These external changes have been the reduction of turnover per
PV project, the decline in diffusion (dynamics of which is evident in the indicator-based
analysis) and decrease in feed-in tariff. All these external factors consequently resulted in
a rapid decline in the revenue of the solar firm and stimulated a business model challenge.
However, as the case study conducted in this Thesis, in line with other scholars (Dewald
and Truffer, 2012; Fabrizio and Hawn, 2013), argue that, local solar firms are the
important drivers of the diffusion, acting as intermediaries among the technology, policy
makers and the adopters. This means that, if the local solar fails to survive, so does the
diffusion. Nevertheless, I can argue that a local actor, which has driven the diffusion, can
also become a victim of the high diffusion rate.
6.1.3. LEAD AND LAG REGIONS
In line with the findings of other scholars (e.g. Fabrizio and Hawn, 2013), indicator-based
analysis confirms that country-level policies do not influence the diffusion of innovations
in the same manner in all sub-national regions. Extending this argument, this analysis also
makes an important empirical contribution to the literature. It argues that, if a national
policy can drive the diffusion of an innovation in a particular sub-national region that has
the lead market attributes, the diffusion in other regions will follow up subsequently.
Therefore, the findings of indicator-based analysis, which is partially anchored in the
findings of case study method, represents a novel context-only extension of the lead
market concept (Beise, 2004, 2001) by applying it at the sub-national level. This is an
important contribution to the literature, given the fact that all previous studies on lead
market concept had been applied to the diffusion of innovations –only- at the national
level.

107
6.2. METHODOLOGICAL IMPLICATIONS AND CONTRIBUTIONS
6.2.1. PLAYING WITH MATH: HOW TO COUNT THE DIFFUSION RATE?
In the majority of the innovation literature (e.g. Bass, 1969; Griliches, 1957; Hägerstrand,
1967; Rogers, 2003), the diffusion rate is calculated through on a simple rule: if a potential
adopter has adopted the innovation, it counted for 1. However, diffusion research on
renewable energy innovations, in this case it is the solar PV system, traditionally has a
different approach when evaluating the diffusion. For calculating the diffusion rate, the
scholars usually have focused on the capacity of electricity generated through installations,
instead of the number of installations (see e.g. Dewald and Truffer, 2012; Guidolin and
Mortarino, 2010). However, this might lead to a misunderstanding on whether the
diffusion is increasing or decreasing. For example from 2010 to 2011 in Germany, there
was an increase in the total capacity of PV installations, while corresponding a decrease of
number of installations. In the case study of this Dissertation, we intentionally used the
number of installations for diffusion evaluation, and we hope that this will become a
common standard for future diffusion studies on renewable energy. Otherwise, the
continuous increase of capacity of PV systems might create a misleading bubble on the
calculation of diffusion rates. For example, in order to calculate the diffusion rate of
electrical cars, no one calculate the sum of the power capacity of all adopted cars. Instead,
the scholars calculate the number of adoptions. Why not to do the same for solar PV
systems? The adoption number of PV installations does tell about diffusion rate, while the
capacity of installations does tell about something else, i.e., technology efficiency.
6.2.2. FINITE ELEMENT METHOD: IN AN NEW ERA OF BIG DATA
Theories on social patterns of organizations and societies have been rooted several
decades ago (e.g. Durkheim, 1933; Marx, 1954; Weber, 1922). However, neither the
pioneers nor the followers had an access to the big data- the newly ubiquitous digital data
that is available now about all aspects of human experiences (Pentland, 2014). Today, for
example, we can precisely know the location of many individuals through global
positioning system (GPS) during 24 hours per day. In similar, we can have an access the
detailed information of diffusion of a variety of innovations through public and private
databases. Consequently, leveraging the big data with high computational power, social
sciences (including economics and management) have tremendously been advancing (e.g.

108
Brockmann and Helbing, 2013; Mani et al., 2013; Pentland, 2013, 2012). In the same
token, the mathematical model applied in this dissertation, using today´s high
computational power, presents an application of the finite element method, which has
traditionally been used in engineering disciplines. If there is access to the big data, the
model might serve as a powerful method for solving the partial differential equations
describing the social phenomena. For instance, in the case of solar PV systems in
Germany, there is a public database on the information of PV adopters, e.g., revealing the
information on precise adoption time, the precise location of adoption and the capacity of
installations- which indeed motivated the development of finite element model.
6.3. POLICY IMPLICATIONS
6.3.1. IGNORE THE LAG REGIONS
How can policy makers promote the diffusion of environmentally friendly innovations?
This question has been addressed in the literature for a long time. When it comes to the
sub-national dynamics, this Dissertation argues that developing sub-national policies (e.g.
as suggested by Fabrizio and Hawn, 2013; Zhang et al., 2011) is not only the effective
way to drive the diffusion of environmental innovations. The results of indicator-based
analysis, conducted in this Dissertation, argue that policy makers might also choose to
develop a national measure that fits the lead sub-national region and, consequently, drive
diffusion in the national level in a progressive manner. This means that if a national policy
is able to drive the diffusion of an environmental innovation in a particular sub-national
region that has lead market attributes (advantages on demand, transfer, export, market
structure and cost), the diffusion in other regions will follow the lead up. Therefore, by
being respondent to the lead market’s demand (and ignorant to the lag market’s), policy
makers can foster and drive national adoption innovations. Therefore, I argue that
policymakers should not be worried about the lagging regions in the early phases of
diffusion. If the diffusion of an innovation in a region with lead market attributes can be
boosted, the lag regions are likely to catch up.
6.3.2. LOCAL FIRMS: ON THE EDGE OF A CLIFF?
Business model analysis, conducted in this Dissertation, argues that local companies,
which act as important sources to motivate the potential adopters, have a business model

109
challenge due to new conditions in the market. Given that cost competiveness of
renewable energy innovations, i.e., grid parity, does not fully foster the wide diffusion,
policymakers might need to consider new policy measures to support local companies. As
the results of the micro analysis indicate that the policy measures are unlikely to have the
expected impact without local solar companies, survival of such companies is critical for
the wide adoption of PV systems. Therefore, I argue that, if the local firms are on the edge
of a cliff (as seen in business model analysis), it means the diffusion of PV systems is on
the edge of a cliff as well. Given that diffusion of solar PV systems has a limited outreach,
even in the most developed market, i.e., Germany, I recommend policymakers to support
the local drivers of diffusion, i.e., local solar firms, which help potential adopters to
understand the benefits of adopting solar PV systems. Otherwise, potential adopters’
negative perceptions on the PV technology (e.g., related to the complexity, trialabilty,
compatibility and relative advantage) - that might hinder the diffusion- cannot be easily
overcome.
6.4. LIMITATIONS AND FUTURE RESEARCH
Given the multi dimensions of the diffusion of PV systems, there are some limitations to
this study, which could motivate to open new avenues for future research. The case study,
conducted in this Thesis, is based on an illustrative case and has some limitations. For
instance, it is only based on a single-case study. However, as argued by Flyvbjerg (2006)
single-case studies can contribute to the collective process of knowledge accumulation in a
particular field that lies among several fields, e.g., energy research and social science. In
addition, the diffusion of PV systems in Germany has been highly influenced by its
particular conditions, e.g., the German feed-in tariff. Therefore, the results of case study
might not easily be transferable to other national markets. However, similar processes are
likely to occur in lag countries where the diffusion might take off recently. Nevertheless,
as with other renewable energy related case studies that focus on particular regions (e.g.,
Darmani et al., 2015; Eder et al., 2015; Sriwannawit and Laestadius, 2013), I also believe
that the case study of this Dissertation can provide empirical insights that can be used as a
basis for future research.
There have also been some more methodological limitations. In the indicator-based
approach, finding the indicators and aggregating them was a challenge. The data for some
110
indicators were not available to collect. For the finite element method, not all the data used
for the modeling was empirically collected. This could be easily overcome by using the
historical s-curve data in future studies. Moreover, the literature reviews (sub-chapters
3.2.1-2) may lack some important keywords to be used for generating the databases. For
example, the terms “acceptance” and “deployment” miss in the sets of keywords in both
studies. Nevertheless, one can argue that these terms do not necessarily correspond to the
diffusion process. That said, including these terms might be useful to expand the scope of
future studies in similar contexts.
Moreover, several topics, which were beyond the scope of this Thesis, appears to be
promising for future research. Firstly, the influence of the recent German policy support
for solar batteries (implemented in 2013) on the adoption of PV systems should be studied
further. Solar batteries let the households to store the electricity they generated. It means
that they will necessarily need to supply the electricity to the grid. Instead, they can store
during the day (when the sun is shining) and use it during the night. Secondly, the future
studies could also investigate the barriers to the adoption of a variety of PV systems’
concepts, e.g., building integrated systems, particularly in times of grid parity. To do this,
several factors can be important to be considered: socio-technical, managerial, policy and
economic factors (as suggested by the literature review, see sub-chapter 3.2.2). Thirdly,
further research can also further develop the indicators used for lead market attributes of
PV at sub-national level. Moreover, scaling down the unit of observation can provide new
insights. Fourthly, studying the role of cost competiveness for environmental innovations
can be a promising future research area. As happened in the case of PV systems in
Germany, reaching cost competiveness does not boost the diffusion, against the
expectations of many scholars. Fifthly, finite element model is a promising starting point
for more detailed and advanced investigations in the future, including the modeling the
diffusion of environmental innovations through analyzing the big data. Sixthly, towards
energy transitions to decentralized energy solutions, adopters are supposed to, as first step,
discontinue using conventional electricity sources (in high-income economies) or
discontinue living without electrification (in low-income economies) (see sub-chapters
3.2.2, and 5.1.). However in energy research, surprisingly, less attention has been paid to
the discontinuance. This topic could be a promising future research area. Seventhly, the
case study in Rottenburg am Neckar also provided additional perspectives about other
technologies that could have competed with solar PV- which go beyond the scope of this

111
Dissertation. One example is the solar thermal systems. The diffusion competition
between solar PV systems and other alternatives could be an interesting future research
topic. Number of yearly solar thermal installations was around 15k in Germany, whereas it
was 18k for PV in 2012. The case study showed that adopters usually decide between
solar PV systems and solar thermal systems. In some cases, they decide to adopt both, e.g.,
PV for half of the roof and solar thermal for the other half. However in some cases, they
choose either of them. According to the number of yearly installations, the time period that
PV had the highest growth corresponds to the time period that solar thermal had the
sharpest decline. From 2008 to 2010, the number of yearly installations of PV has
increased 120%, whereas the number of yearly installations of solar thermal decreased
45% as the sharpest decline in its history. This contradiction supports the argument that
PV and solar thermal compete with each other, at least to get a place in the roof as the
capacity of a roof is often limited. As Thomas Hartmann already questioned in one of the
interviews: “To whom belongs the roof? To PV Systems or to Solar Thermal Systems?”.
Eighthly, given the Germany’s ambitious target to double its energy production from
renewable energy sources in the next 15 years (BDEW, 2014), further research might
investigate how policy measures could support local solar companies, which are used to be
the local drivers of the diffusion. Therefore, further research on local solar companies’
business models could help them to respond to the challenges of decline in an effective
way. In this context, the literature on business model innovation (e.g. Chesbrough, 2010;
Sosna et al., 2010), including the energy related empirical cases of it (Christensen et al.,
2012; e.g. Richter, 2013a, 2013b), and local entrepreneurship (Julien, 2007; e.g.
Michelacci and Silva, 2007) could be complementary to further understand such
phenomenon. Last but not least, the interlinks among the micro, meso and macro levels of
diffusion could be studied further. For example, the future research can focus on how the
macro level diffusion can influence the micro and meso level of diffusion, and the vice-
versa.
6.5. CONCLUSIONS
Conceptualizing the solar PV systems as innovations, this Dissertation has tried to
contribute on both innovation studies and renewable energy research. This has been done
through five synchronized steps. Firstly, -anchored in two literature reviews- it tried to
shed light on the accumulated knowledge of diffusion of solar PV systems and

112
environmental innovations. Secondly, at micro level, it explored the diffusion dynamics of
a unique local case in southern Germany. Thirdly, at firm level, it illustrated a business
model challenge of a leading local solar company in the same region. Fourthly, at meso
level, it explored how leading regions might affect the lagging ones and how it can be
mathematically modeled. Finally, a meta-analysis of the findings previous steps has been
conducted and, than, implications for theory and practice have been discussed.
Among all the contributions discussed in previous (sub-) chapters, two contributions of
this Thesis can be particularly interesting for a broader audience from economics,
geography and management disciplines. Firstly, the Thesis provides in depth-analysis of a
case of environmental technology which has achieved the cost competitiveness (to some
extent). The results of this case are against the arguments that achieving cost
competitiveness would boost the diffusion of environmental innovations such as
renewable energy technologies. Second, albeit the complexity of diffusion dynamics in the
well-connected world of today, the Thesis presents an empirical evidence for the existence
of regional patterns – that can give a rise to our understanding on how particular sub-
national regions lead the rest. This can be perceived as against the claims that today’s high
mobility of individuals and high-connectivity of distanced-regions will diminish the major
effects of spatial proximity on diffusion of innovations.

113
7. APPENDIX
7.1. LIST OF PUBLICATIONS
7.1.1. INTERNATIONAL PEER-REVIEWED ARTICLES IN JCR
Karakaya, E., Nuur, C., & Hidalgo, A. (2016). Business model challenge: Lessons
from a local solar company. Renewable Energy, 85, 1026–1035.
Karakaya, E., & Sriwannawit, P. (2015). Barriers to the adoption of photovoltaic
systems: The state of the art. Renewable and Sustainable Energy Reviews, 49, 60–
66.
Karakaya, E., Hidalgo, A., & Nuur, C. (2015). Motivators for adoption of
photovoltaic systems at grid parity: A case study from Southern Germany.
Renewable and Sustainable Energy Reviews, 43, 1090-1098.
Karakaya, E., Hidalgo, A., & Nuur, C. (2014). Diffusion of eco-innovations: A
review. Renewable and Sustainable Energy Reviews, 33, 392-399
7.1.2. INTERNATIONAL CONFERENCES
Karakaya, E., Nuur, C., & Hidalgo. A. (2014). Business model challenge at
decline: Learnings from a local solar company. EDIM Conference, Milan, Italy
Karakaya, E., Nuur, C., Breitschopf, B., & Hidalgo, A. (2014). Spatial lead
markets at sub-national level. DRUID Society Conference, Copenhagen, Denmark.
Karakaya, E. (2014).Finite Element Model: An Application to Diffusion of
Photovoltaic Systems. EDIM Conference, Milan, Italy.

114
Karakaya, E., Hidalgo, A., & Nuur, C. (2013). Diffusion of Eco-Innovations:
Exploring the Literature. The 22nd International Conference on Management of
Technology (IAMOT), Porto Alegre, Brazil.
Karakaya, E., Hidalgo, A., & Nuur, C. (2013). Modelling the Diffusion of
Photovoltaic: Concepts and Applications. The 22nd International Conference on
Management of Technology (IAMOT), Porto Alegre, Brazil.
Karakaya, E., Hidalgo, A., & Nuur, C. (2013). Diffusion of Photovoltaic: Policy
vs. Adopters. The Eu-Spri Conference, Madrid, Spain.
115
8. REFERENCES
Abaqus, 2013. Abaqus/CAE Student Edition 6.13.
Allegretto, W., Lin, Y., Yang, H., 2001. A fast and highly accurate numerical method for the
evaluation of American options. Dyn. Contin. Discret. Impuls. Syst. 465.
Ameli, N., Kammen, D.M., 2012. Clean energy deployment: Addressing financing cost. Environ.
Res. Lett. 7, 034008. doi:10.1088/1748-9326/7/3/034008
Anderson, C., Zeithaml, C., 1984. Stage of the product life cycle, business strategy, and business
performance. Acad. Manag. J. 27, 5–24.
Angermann, L., Wang, S., 2007. Convergence of a fitted finite volume method for the penalized
Black–Scholes equation governing European and American Option pricing. Numer. Math.
106, 1–40. doi:10.1007/s00211-006-0057-7
Asheim, B., Gertler, M.S., 2005. The Geography of Innovation: Regional Innovation Systems, in:
Jan Fagerberg, David C. Mowery, R.R.N. (Ed.), The Oxford Handbook of Innovation.
Oxford University Press, pp. 291 – 317.
Asheim, B.T., Coenen, L., 2005. Knowledge bases and regional innovation systems: Comparing
Nordic clusters. Res. Policy 34, 1173–1190. doi:10.1016/j.respol.2005.03.013
Atkinson, P., Hammersley, M., 1994. Ethnography and participant observation, in: Denzin, N.K.,
Lincoln, Y.S. (Eds.), Handbook of Qualitative Research.
Baccarin, S., 2009. Optimal impulse control for a multidimensional cash management system with
generalized cost functions. Eur. J. Oper. Res. 196, 198–206. doi:10.1016/j.ejor.2008.02.040
Bain, A., 1963. The growth of demand for new commodities. J. R. Stat. Soc. 126, 285–299.
Balcombe, P., Rigby, D., Azapagic, A., 2013. Motivations and barriers associated with adopting
microgeneration energy technologies in the UK. Renew. Sustain. Energy Rev. 22, 655–666.
doi:10.1016/j.rser.2013.02.012
Balcombe, P., Rigby, D., Azapagic, A., 2014. Investigating the importance of motivations and
barriers related to microgeneration uptake in the UK. Appl. Energy 130, 403–418.
doi:10.1016/j.apenergy.2014.05.047
Barthel, R., Janisch, S., Schwarz, N., Trifkovic, a, Nickel, D., Schulz, C., Mauser, W., 2008. An
integrated modelling framework for simulating regional-scale actor responses to global
change in the water domain. Environ. Model. Softw. 23, 1095–1121.
doi:10.1016/j.envsoft.2008.02.004
Bartley, M., Owen, C., 1996. Relation between socioeconomic status, employment, and health
during economic change, 1973-93. Br. Med. J. 445–449.
116
Bartunek, J.M., Louis, M.., 1996. Insider/Outsider Team Research. Sage. Thousand Oaks (CA).
Bass, F., Krishnan, T., Jain, D., 1994. Why the Bass model fits without decision variables. Mark.
Sci. 13, 203–223.
Bass, F.M., 1969. A new product growth for model consumer durables. Manage. Sci. 15, 215–227.
Bawakyillenuo, S., 2012. Deconstructing the dichotomies of solar photovoltaic (PV) dissemination
trajectories in Ghana, Kenya and Zimbabwe from the 1960s to 2007. Energy Policy 49, 410–
421. doi:10.1016/j.enpol.2012.06.042
BDEW, 2014. Energie-Info Erneuerbare Energien und das EEG : Zahlen , Fakten , Grafiken,
BDEW Bundesverband der Energie- und Wasserwirtschaft e.V. BDEW Bundesverband der
Energie- und Wasserwirtschaft e.V.
Beise, M., 2001. Lead Markets, Country-Specific Succes Factors of Global Diffuison of
Innovations. ZEW Economic Studies.
Beise, M., 2004. Lead markets: country-specific drivers of the global diffusion of innovations.
Res. Policy 33, 997–1018. doi:10.1016/j.respol.2004.03.003
Beise, M., 2005. Lead markets, innovation differentials and growth. Int. Econ. Econ. Policy 1,
305–328. doi:10.1007/s10368-004-0013-x
Beise, M., Cleff, T., 2004. Assessing the lead market potential of countries for innovation projects.
J. Int. Manag. 10, 453–477. doi:10.1016/j.intman.2004.08.003
Beise, M., Rennings, K., 2005. Lead markets and regulation: a framework for analyzing the
international diffusion of environmental innovations. Ecol. Econ. 52, 5–17.
doi:10.1016/j.ecolecon.2004.06.007
Ben-Ameur, H., Breton, M., L’Ecuyer, P., 2002. A dynamic programming procedure for pricing
American-style Asian options. Manage. Sci. 48, 625–643.
Berger, T., 2001. Agent-based spatial models applied to agriculture: a simulation tool for
technology diffusion, resource use changes and policy analysis. Agric. Econ. 25, 245–260.
doi:10.1111/j.1574-0862.2001.tb00205.x
Berthold, N., Kögel, D., Kullas, M., 2009. Die Bundesländer im Innovationswettbewerb.
Bertelsmann Stift.
Berthon, P., Pitt, L., Ewing, M., Carr, C., 2002. Potential research space in MIS: A framework for
envisioning and evaluating research replication, extension, and generation. Inf. Syst. Res. 13,
416–427.
Beurskens, L., Hekkenberg, M., Vethman, P., 2011. Renewable energy projections as published in
the national renewable energy action plans of the European member states. Eur. Environ.
Agency.
Binz, C., Truffer, B., Coenen, L., 2014. Why space matters in technological innovation systems—
Mapping global knowledge dynamics of membrane bioreactor technology. Res. Policy 43,
138–155. doi:10.1016/j.respol.2013.07.002

117
Blum, N.U., Sryantoro Wakeling, R., Schmidt, T.S., 2013. Rural electrification through village
grids—Assessing the cost competitiveness of isolated renewable energy technologies in
Indonesia. Renew. Sustain. Energy Rev. 22, 482–496. doi:10.1016/j.rser.2013.01.049
Bodas-Freitas, I., Dantas, E., Iizuka, M., 2010. The global institutional frameworks and the
diffusion of renewable energy technologies in the BRICS countries.
Bollinger, B., Gillingham, K., 2012. Peer Effects in the Diffusion of Solar Photovoltaic Panels.
Mark. Sci. 31, 900–912.
Branker, K., Pathak, M.J.M., Pearce, J.M., 2011. A review of solar photovoltaic levelized cost of
electricity. Renew. Sustain. Energy Rev. 15, 4470–4482. doi:10.1016/j.rser.2011.07.104
Breyer, C., Gerlach, A., 2013. Global overview on grid parity. Prog. photovoltaics Res. Appl. 21,
121–136. doi:10.1002/pip
Brockmann, D., Helbing, D., 2013. The hidden geometry of complex, network-driven contagion
phenomena. Science (80-. ). 342, 1337–42. doi:10.1126/science.1245200
Brown, L., 1975. The market and infrastructure context of adoption: a spatial perspective on the
diffusion of innovation. Econ. Geogr. 51.
Brudermann, T., Reinsberger, K., Orthofer, A., Kislinger, M., Posch, A., 2013. Photovoltaics in
agriculture: A case study on decision making of farmers. Energy Policy 61, 96–103.
doi:10.1016/j.enpol.2013.06.081
Burns, T., Stalker, G.M., 1961. The Management of Innovation. Tavistock, London.
Cagno, E., Ramirez-Portilla, A., Trianni, A., 2015. Linking energy efficiency and innovation
practices: Empirical evidence from the foundry sector. Energy Policy 83, 240–256.
doi:10.1016/j.enpol.2015.02.023
Cantono, S., Silverberg, G., 2009. A percolation model of eco-innovation diffusion: The
relationship between diffusion, learning economies and subsidies. Technol. Forecast. Soc.
Change 76, 487–496. doi:10.1016/j.techfore.2008.04.010
Cao-Alvira, J., 2010. Finite elements in the presence of occasionally binding constraints. Comput.
Econ. 355–370. doi:10.1007/s10614-010-9203-5
Cao-Alvira, J.J., 2011. Velocity Volatility Assessment of Monetary Shocks on Cash-in-Advance
Economies. Comput. Econ. 40, 293–311. doi:10.1007/s10614-011-9292-9
Card, N.A., 2011. Applied meta-analysis for social science research. guilford Press.
Carlsson, B., Jacobsson, S., Holmen, M., Annika, R., 2002. Innovation systems: analytical and
methodological issues. Res. Policy 31, 233–245.
Chesbrough, H., 2010. Business Model Innovation: Opportunities and Barriers. Long Range
Plann. 43, 354–363. doi:10.1016/j.lrp.2009.07.010
Chesbrough, H., Rosenbloom, R., 2002. The role of the business model in capturing value from
innovation: evidence from Xerox Corporation’s technology spin-off companies. Ind. Corp.
Chang. 11, 529–555.

118
Christensen, C.M., 1997. The Innovator’s Dilemma: When New Technologies Cause Great Firms
to Fail. Harvard Business School Press, Cambridge, MA.
Christensen, T.B., Wells, P., Cipcigan, L., 2012. Can innovative business models overcome
resistance to electric vehicles? Better Place and battery electric cars in Denmark. Energy
Policy 48, 498–505. doi:10.1016/j.enpol.2012.05.054
Cleff, T., Grimpe, C., Rammer, C., 2009. Demand-oriented innovation strategy in the European
energy production sector. Int. J. Energy Sect. Manag. 3, 108–130.
doi:10.1108/17506220910970542
Coenen, L., Benneworth, P., Truffer, B., 2012. Toward a spatial perspective on sustainability
transitions. Res. Policy 41, 968–979. doi:10.1016/j.respol.2012.02.014
Cook, D.J., Mulrow, C.D., Haynes, R.B., 1997. Systematic reviews: synthesis of best evidence for
clinical decisions. Ann Intern Med 126, 376–380.
Cook, D.J., Sackett, D.I., Spitzer, W.O., 1995. Methodological Guidelines for systematic reviews
of randomized control trials in health care from the postdam consultation on meta-analyisis.
J. Clin. Epidemology 48, 167–171.
Cooke, P., Morgan, K., 1998. The associational economy: firms, regions, and innovation, OUP
Catalogue. Oxford University Press. doi:10.1093/acprof
D’Agostino, A.L., Sovacool, B.K., Bambawale, M.J., 2011. And then what happened? A
retrospective appraisal of China’s Renewable Energy Development Project (REDP). Renew.
Energy 36, 3154–3165. doi:10.1016/j.renene.2011.03.017
Da Graça Carvalho, M., Bonifacio, M., Dechamps, P., 2011. Building a low carbon society.
Energy 36, 1842–1847. doi:10.1016/j.energy.2010.09.030
Daigneault, P.-M., Jacob, S., Ouimet, M., 2012. Using systematic review methods within a Ph.D.
dissertation in political science: challenges and lessons learned from practice. Int. J. Soc. Res.
Methodol. 1–17. doi:10.1080/13645579.2012.730704
Darmani, A., 2015. Renewable electricity generation and investors’ dynamic capabilities: A cross-
sector analysis of investment path choices. Util. Policy In press.
Darmani, A., Arvidsson, N., Hidalgo, A., 2015. Do the strategic decisions of multinational energy
companies differ in divergent market contexts? An exploratory study. Energy Res. Soc. Sci.
In press.
Darmani, A., Arvidsson, N., Hidalgo, A., Albors, J., 2014. What drives the development of
renewable energy technologies? Toward a typology for the systemic drivers. Renew. Sustain.
Energy Rev. 38, 834–847. doi:10.1016/j.rser.2014.07.023
Davis, F., 1989. Perceived usefulness, perceived ease of use, and user acceptance of information
technology. MIS Q. 13, 319–340.
Day, G., 1981. The product life cycle: analysis and applications issues. J. Mark. 45, 60–67.

119
De Araújo, M.S.M., de Freitas, M.A.V., 2008. Acceptance of renewable energy innovation in
Brazil—case study of wind energy. Renew. Sustain. Energy Rev. 12, 584–591.
doi:10.1016/j.rser.2006.03.017
Delre, S. a., Jager, W., Janssen, M. a., 2007. Diffusion dynamics in small-world networks with
heterogeneous consumers. Comput. Math. Organ. Theory 13, 185–202. doi:10.1007/s10588-
006-9007-2
Dewald, U., 2008. Solarinitiativen in Deutschland: Struktur, Aufgabenfelder und gegenwärtige
Herausforderungen. Lehrstuhl für Wirtschaftsgeographie, RWTH Aachen University.
Dewald, U., Truffer, B., 2011. Market Formation in Technological Innovation Systems—
Diffusion of Photovoltaic Applications in Germany. Ind. Innov. 18, 285–300.
doi:10.1080/13662716.2011.561028
Dewald, U., Truffer, B., 2012. The local sources of market formation: explaining regional growth
differentials in German photovoltaic markets. Eur. Plan. Stud. 37–41.
Diekmann, J., Groba, F., Vogel-Sperl, A., Püttner, A., Vohrer, P., Schmidt, J., 2012. Vergleich der
Bundesländer: Analyse der Erfolgsfaktoren für den Ausbau der Erneuerbaren Energien 2012-
Indikatoren und Ranking. Endbericht: Deutsches Institut für Wirtschaftsforschung.
Drücke, O., 2004. RegioSolar : Kurzstudie Solarinitiativen in Deutschland. Bundesverband
Solarindustrie e.V.
Drury, E., Miller, M., Macal, C.M., Graziano, D.J., Heimiller, D., Ozik, J., Perry IV, T.D., 2012.
The transformation of southern California’s residential photovoltaics market through third-
party ownership. Energy Policy 42, 681–690. doi:10.1016/j.enpol.2011.12.047
Durkheim, E., 1933. The division of Labor in Society. Macmillan, New York.
EC, 2007. Photovoltaic solar energy, Development and current research. European Commision
(EC), Belgium. doi:10.2768/38305
Eder, J.M., Mutsaerts, C.F., Sriwannawit, P., 2015. Mini-grids and renewable energy in rural
Africa: How diffusion theory explains adoption of electricity in Uganda. Energy Res. Soc.
Sci. 5, 45–54. doi:10.1016/j.erss.2014.12.014
EIO, 2010. Methodological report. Eco-Innovation Observatory (EIO).
EIO, 2011. The Eco-Innovation Challenge: Pathways to a resource-efficient Europe. Eco-
Innovation Observatory. Eco-Innovation Observatory (EIO), Funded by the European
Commission, DG Environment, Brussels.
Eisenhardt, K., 1989. Building theories from case study research. Acad. Manag. Rev. 14, 532–550.
EP, 2009. Directive 2009/28/EC of the European Parliment and the Council of the 23 April 2009
on the promotion of the use of energy from renewable sources and amending and
subswquently repealing Directives 2001/77/EC and 2003/30/EC. Off. J. Eur. Union 16–62.
EPIA, 2010. Photovoltaic energy, electricity from the sun, Energy. European Photovaltaic Industry
Association, ESTMAC project “Creating Markets for Renewable Energy Sources.”

120
EPIA, 2013. Global Market Outlook For Photovoltaics 2013-2017. European Photovoltaic
Industry Association (EPIA).
EPIA, 2014a. Global Market Outlook- For Photovoltaics 2014-2018. Eur. Photovolt. Ind. Assoc.
EPIA, 2014b. Market report 2013, European Photovoltaic Industry Association. European
Photovoltaic Industry Association (EPIA).
ETAP, 2010. Clean , Clever , Competitive Eco-innovation for a sustainable future, Newsletter
Issue 18. Environmental Technologies Action Plan (ETAP), European Commision, Brussels,
Belgium.
Faber, A., Frenken, K., 2009. Models in evolutionary economics and environmental policy:
Towards an evolutionary environmental economics. Technol. Forecast. Soc. Change 76,
462–470. doi:10.1016/j.techfore.2008.04.009
Fabrizio, K.R., Hawn, O., 2013. Enabling diffusion: How complementary inputs moderate the
response to environmental policy. Res. Policy 42, 1099–1111.
doi:10.1016/j.respol.2013.02.003
Fagerberg, J., Fosaas, M., Sapprasert, K., 2012. Innovation: Exploring the knowledge base. Res.
Policy 41, 1132–1153. doi:10.1016/j.respol.2012.03.008
Florida, R., Davison, D., 2001. Gaining from Green management: Environmental Management
Systems Inside and Outside the Factory. Calif. Manage. Rev.
Flyvbjerg, B., 2006. Five misunderstandings about case-study research. Qual. Inq. 420–434.
Fourt, L.A., Woodlock, J.W., 1960. Early Prediction of Market Success for New Grocery
Products. J. Mark. 25, 31–38.
Foxon, T., Pearson, P., 2008. Overcoming barriers to innovation and diffusion of cleaner
technologies: some features of a sustainable innovation policy regime. J. Clean. Prod. 16,
S148–S161. doi:10.1016/j.jclepro.2007.10.011
Frantzis, L., Graham, S., Katofsky, R., Sawyer, H., 2008. Photovoltaics business models. National
Renewable Energy Laboratory.
Frondel, M., Horbach, J., Rennings, K., 2008a. What triggers environmental management and
innovation? Empirical evidence for Germany. Ecol. Econ. 66, 153–160.
doi:10.1016/j.ecolecon.2007.08.016
Frondel, M., Ritter, N., Schmidt, C.M., 2008b. Germany’s solar cell promotion: Dark clouds on
the horizon. Energy Policy 36, 4198–4204. doi:10.1016/j.enpol.2008.07.026
Fthenakis, V.M., Kim, H.C., Alsema, E., 2008. Emissions from Photovoltaic Life Cycles
Emissions from Photovoltaic Life Cycles 42, 2168–2174. doi:10.1021/es071763q
Garcia, R., Jager, W., 2011. From the Special Issue Editors: Agent-Based Modeling of Innovation
Diffusion. J. Prod. Innov. Manag. 148–151.

121
Gaul, C., Carley, S., 2012. Solar set asides and renewable electricity certificates: Early lessons
from North Carolina’s experience with its renewable portfolio standard. Energy Policy 48,
460–469. doi:10.1016/j.enpol.2012.05.043
Geels, F.W., 2010. Ontologies, socio-technical transitions (to sustainability), and the multi-level
perspective. Res. Policy 39, 495–510. doi:10.1016/j.respol.2010.01.022
Geels, F.W., 2011. The multi-level perspective on sustainability transitions: Responses to seven
criticisms. Environ. Innov. Soc. Transitions 1, 24–40. doi:10.1016/j.eist.2011.02.002
Gooding, J., Edwards, H., Giesekam, J., Crook, R., 2013. Solar City Indicator: A methodology to
predict city level PV installed capacity by combining physical capacity and socio-economic
factors. Sol. Energy 95, 325–335. doi:10.1016/j.solener.2013.06.027
Graham, B., 1998. Liberalization, regional economic development and the geography of demand
for air transport in the European Union. J. Transp. Geogr. 6, 87–104. doi:10.1016/S0966-
6923(98)00003-9
Graziano, M., Gillingham, K., 2014. Spatial Patterns of Solar Photovoltaic System Adoption: The
Influence of Neighbors and the Built Environment ǂ. J. Econ. Geogr. 1–25.
doi:10.1093/jeg/lbu036
Griliches, Z., 1957. Hybrid corn: An exploration in the economics of technological change.
Econom. J. Econom. Soc. 25, 501–522.
Guidolin, M., Mortarino, C., 2010. Cross-country diffusion of photovoltaic systems: Modelling
choices and forecasts for national adoption patterns. Technol. Forecast. Soc. Change 77,
279–296. doi:10.1016/j.techfore.2009.07.003
Haas, R., Lettner, G., Auer, H., Duic, N., 2013. The looming revolution: How photovoltaics will
change electricity markets in Europe fundamentally. Energy 57, 38–43.
doi:10.1016/j.energy.2013.04.034
Hägerstrand, T., 1967. Innovation Diffusion as a Spatial Process. The University of Chicago Press
(Postscript and translation by Allan Pred).
Halila, F., 2007. The adoption and diffusion of environmental innovations, Doctoral Thesis.
Management. Lund University of Technology.
Hannah, S.T., Lester, P.B., 2009. A multilevel approach to building and leading learning
organizations. Leadersh. Q. 20, 34–48. doi:10.1016/j.leaqua.2008.11.003
Harvey, A., 1984. Time series forecasting based on the logistic curve. J. Oper. Res. Soc. 35, 641–
646.
Haynes, K., Mahajan, V., White, G., 1977. Innovation diffusion: A deterministic model of space-
time integration with physical analog. Socioecon. Plann. Sci. 11, 25–29.
Hervani, A. a., Helms, M.M., Sarkis, J., 2005. Performance measurement for green supply chain
management. Benchmarking An Int. J. 12, 330–353. doi:10.1108/14635770510609015

122
Higgins, A., McNamara, C., Foliente, G., 2014. Modelling future uptake of solar photo-voltaics
and water heaters under different government incentives. Technol. Forecast. Soc. Change 83,
142–155. doi:10.1016/j.techfore.2013.07.006
Ho, H., Wong, S., 2007. Housing allocation problem in a continuum transportation system.
Transportmetrica 3, 21–39.
Ho, H.W., Wong, S.C., Loo, B.P.Y., 2006. Combined distribution and assignment model for a
continuum traffic equilibrium problem with multiple user classes. Transp. Res. Part B
Methodol. 40, 633–650. doi:10.1016/j.trb.2005.09.003
Hockerts, K., Wüstenhagen, R., 2010. Greening Goliaths versus emerging Davids — Theorizing
about the role of incumbents and new entrants in sustainable entrepreneurship. J. Bus.
Ventur. 25, 481–492. doi:10.1016/j.jbusvent.2009.07.005
Hofer, C., 1975. Toward a contingency theory of business strategy. Acad. Manag. J. 18, 784–810.
Hoppmann, J., Peters, M., Schneider, M., Hoffmann, V.H., 2013. The two faces of market
support—How deployment policies affect technological exploration and exploitation in the
solar photovoltaic industry. Res. Policy 42, 989–1003. doi:10.1016/j.respol.2013.01.002
Horbach, J., Chen, Q., Rennings, K., Vögele, S., 2014. Do lead markets for clean coal technology
follow market demand? A case study for China, Germany, Japan and the US. Environ. Innov.
Soc. Transitions 10, 42–58. doi:10.1016/j.eist.2013.08.002
Hsu, D.D., O’Donoughue, P., Fthenakis, V., Heath, G. a., Kim, H.C., Sawyer, P., Choi, J.K.,
Turney, D.E., 2012. Life Cycle Greenhouse Gas Emissions of Crystalline Silicon
Photovoltaic Electricity Generation: Systematic Review and Harmonization. J. Ind. Ecol. 16.
doi:10.1111/j.1530-9290.2011.00439.x
Huber, J., 2008. Pioneer countries and the global diffusion of environmental innovations: Theses
from the viewpoint of ecological modernisation theory. Glob. Environ. Chang. 18, 360–367.
doi:10.1016/j.gloenvcha.2008.03.004
Huenteler, J., Schmidt, T.S., Kanie, N., 2012. Japan’s post-Fukushima challenge – implications
from the German experience on renewable energy policy. Energy Policy 45, 6–11.
doi:10.1016/j.enpol.2012.02.041
Huijben, J.C.C.M., Verbong, G.P.J., 2013. Breakthrough without subsidies? PV business model
experiments in the Netherlands. Energy Policy 56, 362–370. doi:10.1016/j.enpol.2012.12.073
Hull, C., Rothenberg, S., 2008. Firm performance: The interactions of corporate social
performance with innovation and industry differentiation. Strateg. Manag. J. 29, 781–789.
doi:10.1002/smj
IEA, 2014. Technology Roadmap, Solar Photovoltaic Energy. Int. Energy Agency.
IMS Research, 2013. PV Storage Market Set to Explode to $19 Billion in 2017; Germany leads
Again (Press Release, 25 April 2013).
Islam, T., Meade, N., 2013. The impact of attribute preferences on adoption timing: The case of
photo-voltaic (PV) solar cells for household electricity generation. Energy Policy 55, 521–
530. doi:10.1016/j.enpol.2012.12.041

123
Jacob, K., Beise, M., Blazejczak, J., Edler, D., Haum, R., Jänicke, M., Löw, T., Petschow, U.,
Rennings, K., 2005. Lead Markets for VOC-Reduced Paints, in: Wolfgang, F. (Ed.), Lead
Markets for Environmental Innovations. Physica-Verlag Heidelberg New York.
Jacobsson, S., Bergek, A., 2004. Transforming the energy sector: the evolution of technological
systems in renewable energy technology. Ind. Corp. Chang. 13, 815–849.
doi:10.1093/icc/dth032
Jacobsson, S., Johnson, A., 2000. The diffusion of renewable energy technology: an analytical
framework and key issues for research. Energy Policy 28, 625–640.
Jacobsson, S., Lauber, V., 2006. The politics and policy of energy system transformation-
explaining the German diffusion of renewable energy technology. Energy Policy 34, 256–
276. doi:10.1016/j.enpol.2004.08.029
Jaffe, A., Newell, R., Stavins, R., 2002. Environmental policy and technological change. Environ.
Resour. … 41–69.
Jaffe, A., Palmer, K., 1997. Environmental regulation and innovation: a panel data study. Rev.
Econ. Stat. 79, 610–619.
Jäger, W., 2006. Stimulating the diffusion of photovoltaic systems: A behavioural perspective.
Energy Policy 34, 1935–1943. doi:10.1016/j.enpol.2004.12.022
Jänicke, M., 2008. Ecological modernisation: new perspectives. J. Clean. Prod. 16, 557–565.
doi:10.1016/j.jclepro.2007.02.011
Jeong, G., 2013. Assessment of government support for the household adoption of micro-
generation systems in Korea. Energy Policy 62, 573–581. doi:10.1016/j.enpol.2013.07.015
Jiang, Y., Wong, S.C., Ho, H.W., Zhang, P., Liu, R., Sumalee, A., 2011. A dynamic traffic
assignment model for a continuum transportation system. Transp. Res. Part B Methodol. 45,
343–363. doi:10.1016/j.trb.2010.07.003
Johanson, J., 1978. The Mechanism of Internationalisation.
Julien, P.-A., 2007. A Theory of Local Entrepreneurship in the Knowledge Economy. Edwaed
Elgar Publishing Limited.
Kalish, S., Mahajan, V., Muller, E., 1995. Waterfall and sprinkler new-product strategies in
competitive global markets. Int. J. Res. Mark. 12, 105–119. doi:10.1016/0167-
8116(94)00008-C
Kannan, R., Leong, K.C., Osman, R., Ho, H.K., Tso, C.P., 2006. Life cycle assessment study of
solar PV systems: An example of a 2.7 kWp distributed solar PV system in Singapore. Sol.
Energy 80, 555–563. doi:10.1016/j.solener.2005.04.008
Karakaya, E., Hidalgo, A., Nuur, C., 2014a. Diffusion of eco-Innovations: A review. Renew.
Sustain. Energy Rev. 33, 392–399.
Karakaya, E., Hidalgo, A., Nuur, C., 2015. Motivators for adoption of photovoltaic systems at grid
parity: A case study from Southern Germany. Renew. Sustain. Energy Rev. 43, 1090–1098.
doi:10.1016/j.rser.2014.11.077

124
Karakaya, E., Nuur, C., Breitschopf, B., Hidalgo, A., 2014b. Spatial Dimension of Lead Markets:
Evidences from Diffusion of Photovoltaic Systems in Germany, in: DRUID Society
Conference 2014, CBS, Copenhagen, June 16-18.
Karakaya, E., Nuur, C., Hidalgo, A., 2016. Business model challenge: Lessons from a local solar
company. Renew. Energy 85, 1026–1035. doi:10.1016/j.renene.2015.07.069
Karakaya, E., Sriwannawit, P., 2015. Barriers to the adoption of photovoltaic systems: The state of
the art. Renew. Sustain. Energy Rev. 49, 60–66.
Karteris, M., Papadopoulos, A.M., 2013. Legislative framework for photovoltaics in Greece: A
review of the sector’s development. Energy Policy 55, 296–304.
doi:10.1016/j.enpol.2012.12.001
Kazmerski, L.L., 2006. Solar photovoltaics R&D at the tipping point: A 2005 technology
overview. J. Electron Spectros. Relat. Phenomena 150, 105–135.
doi:10.1016/j.elspec.2005.09.004
Kiesling, E., Günther, M., Stummer, C., Wakolbinger, L.M., 2011. Agent-based simulation of
innovation diffusion: a review. Cent. Eur. J. Oper. Res. 183–230. doi:10.1007/s10100-011-
0210-y
Kley, F., Lerch, C., Dallinger, D., 2011. New business models for electric cars—A holistic
approach. Energy Policy 39, 3392–3403. doi:10.1016/j.enpol.2011.03.036
Kline, S.J., Rosenberg, N., 1986. An overview of innovation. Posit. sum Strateg. Harnessing
Technol. Econ. growth 275, 305.
Kobos, P.H., Erickson, J.D., Drennen, T.E., 2006. Technological learning and renewable energy
costs: implications for US renewable energy policy. Energy Policy 34, 1645–1658.
doi:10.1016/j.enpol.2004.12.008
Köhler, J., Walz, R., Marscheder-Weidemann, F., Thedieck, B., 2014. Lead markets in 2nd
generation biofuels for aviation: A comparison of Germany, Brazil and the USA. Environ.
Innov. Soc. Transitions 10, 59–76. doi:10.1016/j.eist.2013.10.003
Koinegg, J., Brudermann, T., Posch, A., Mrotzek, M., 2013. “It would be a shame if we did not
take advantage of the spirit of the times …” An analysis of prospects and barriers of building
integrated photovoltaics. Ecol. Perspect. Sci. Soc. 22, 39–45.
Komatsu, S., Kaneko, S., Shrestha, R.M., Ghosh, P.P., 2011. Nonincome factors behind the
purchase decisions of solar home systems in rural Bangladesh. Energy Sustain. Dev. 15,
284–292. doi:10.1016/j.esd.2011.03.003
Kost, C., Mayer, J.N., Thomsen, J., Hartmann, N., Senkpiel, C., Philipps, S., Nold, S., Lude, S.,
Saad, N., Schlegl, T., 2013. Levelized Cost of Electricity, Renewable Energy Technologies.
Fraunhofer ISE.
Kost, C., Schlegl, T., 2010. Studie Stromgestehungskosten Erneuerbare Energien, Fraunhofer, ISE,
Fraunhofer ISE.
Kost, C., Schlegl, T., Thomsen, J., Nold, S., Mayer, J., 2012. Studie Stromgestehungskosten
Erneuerbare Energien, Fraunhofer, ISE, Fraunhofer ISE.
125
Kwan, C.L., 2012. Influence of local environmental, social, economic and political variables on
the spatial distribution of residential solar PV arrays across the United States. Energy Policy
47, 332–344. doi:10.1016/j.enpol.2012.04.074
Laird, F.N., Stefes, C., 2009. The diverging paths of German and United States policies for
renewable energy: Sources of difference. Energy Policy 37, 2619–2629.
doi:10.1016/j.enpol.2009.02.027
Lay, J., Ondraczek, J., Stoever, J., 2013. Renewables in the energy transition: Evidence on solar
home systems and lighting fuel choice in Kenya. Energy Econ. 40, 350–359.
doi:10.1016/j.eneco.2013.07.024
Lazard, 2013. Lazard’s levelized cost of energy analysis - version 7.0.
Leepa, C., Unfried, M., 2013. Effects of a cut-off in feed-in tariffs on photovoltaic capacity:
Evidence fromGermany. Energy Policy 56, 536–542. doi:10.1016/j.enpol.2013.01.018
Lettner, G., Auer, H., 2012a. Realistic roadmap to PV grid parity for all target countries. Vienna
Univ. Technol. - PV Parit. Proj.
Lettner, G., Auer, H., 2012b. Realistic roadmap to PV grid parity in the commercial sector for all
target countries.
Lewis, R.W., Nithiarasu, P., Seetharamu, K.N., 2004. Fundamentals of the Finite Element Method
for Heat and Fluid Flow. John Wiley & Sons.
Lincoln, C.Y.S., Guba, E.G., 2009. The Only Generalization is: There is no Generalization, in:
Gomm, R., Hammersley, M., Foster, P. (Eds.), Case Study Method. Sage Publications, pp.
27–45.
Loock, M., 2012. Going beyond best technology and lowest price: on renewable energy investors’
preference for service-driven business models. Energy Policy 40, 21–27.
doi:10.1016/j.enpol.2010.06.059
Lund, P.D., 2011. Boosting new renewable technologies towards grid parity – Economic and
policy aspects. Renew. Energy 36, 2776–2784. doi:10.1016/j.renene.2011.04.025
Luque, A., 2001. Photovoltaic market and costs forecast based on a demand elasticity model. Prog.
Photovoltaics Res. Appl. 9, 303–312. doi:10.1002/pip.371
MacVaugh, J., Schiavone, F., 2010. Limits to the diffusion of innovation: A literature review and
integrative model. Eur. J. Innov. Manag. doi:10.1108/14601061011040258
Madlener, R., 2007. Innovation diffusion, public policy, and local initiative: The case of wood-
fuelled district heating systems in Austria. Energy Policy 35, 1992–2008.
doi:10.1016/j.enpol.2006.06.010
Magretta, J., 2002. Why Business Models Matter. Harv. Bus. Rev. 80, 86–92.
Mahajan, V., Muller, E., Wind, Y., 2000. New-Product Diffusion Models, in: International Series
in Quantitative Marketing. Kluwer Academic Publishers.
126
Mahajan, V., Peterson, R. a., 1979. Integrating time and space in technological substitution
models. Technol. Forecast. Soc. Change 14, 231–241. doi:10.1016/0040-1625(79)90079-9
Mainali, B., Silveira, S., 2011. Financing off-grid rural electrification: Country case Nepal. Energy
36, 2194–2201. doi:10.1016/j.energy.2010.07.004
Malerba, F., 2002. Sectoral systems of innovation and production. Res. Policy 31, 247–264.
Mallett, A., 2007. Social acceptance of renewable energy innovations: The role of technology
cooperation in urban Mexico. Energy Policy 35, 2790–2798.
doi:10.1016/j.enpol.2006.12.008
Mani, A., Rahwan, I., Pentland, A., 2013. Inducing peer pressure to promote cooperation. Nature,
Sci. Reports 3, 1735. doi:10.1038/srep01735
Mansfield, E., 1961. Technical change and the rate of imitation. Econom. J. Econom. Soc. 29,
741–766.
Markard, J., Raven, R., Truffer, B., 2012. Sustainability transitions: An emerging field of research
and its prospects. Res. Policy 41, 955–967. doi:10.1016/j.respol.2012.02.013
Markides, C., 2013. Business model innovation: What can the ambidexterity literature teach us?
Acad. Manag. Perspect. 27, 313–323.
Marx, K., 1954. Capital: a critique of political economy. Lawrence & Wishart, London.
Masini, A., Frankl, P., 2002. Forecasting the diffusion of photovoltaic systems in southern
Europe : A learning curve approach. Technol. Forecast. Soc. Change 70, 39–65.
McEachern, M., Hanson, S., 2008. Socio-geographic perception in the diffusion of innovation:
Solar energy technology in Sri Lanka. Energy Policy 36, 2578–2590.
doi:10.1016/j.enpol.2008.03.020
Meade, N., Islam, T., 1998. Technological forecasting—Model selection, model stability, and
combining models. Manage. Sci. 44, 1115–1130.
Meade, N., Islam, T., 2006. Modelling and forecasting the diffusion of innovation – A 25-year
review. Int. J. Forecast. 22, 519–545. doi:10.1016/j.ijforecast.2006.01.005
Mesak, H., Coleman, R., 1992. Modeling the effect of subsidized pricing policy on new product
diffusion. Omega 20, 303–312. doi:10.1016/0305-0483(92)90035-6
Michelacci, C., Silva, O., 2007. Why so many local entrepreneurs? Rev. Econ. Stat. 89, 615–633.
Morgan, K., 2004. The exaggerated death of geography: learning, proximity and territorial
innovation systems. J. Econ. Geogr. 4, 3–21. doi:10.1093/jeg/4.1.3
Morrill, R., 1970. The shape of diffusion in space and time. Econ. Geogr. 46, 259–268.
Morris, M., Schindehutte, M., Allen, J., 2005. The entrepreneur’s business model: toward a unified
perspective. J. Bus. Res. 58, 726–735. doi:10.1016/j.jbusres.2003.11.001
127
Movilla, S., Miguel, L.J., Blázquez, L.F., 2013. A system dynamics approach for the photovoltaic
energy market in Spain. Energy Policy 60, 142–154. doi:10.1016/j.enpol.2013.04.072
Müggenburg, H., Tillmans, A., Schweizer-Ries, P., Raabe, T., Adelmann, P., 2012. Social
acceptance of PicoPV systems as a means of rural electrification — A socio-technical case
study in Ethiopia. Energy Sustain. Dev. 16, 90–97. doi:10.1016/j.esd.2011.10.001
Müller, S., Rode, J., 2013. The adoption of photovoltaic systems in Wiesbaden, Germany. Econ.
Innov. New Technol. 22, 519–535. doi:10.1080/10438599.2013.804333
Munoz, L. a H., Huijben, J.C.C.M., Verhees, B., Verbong, G.P.J., 2014. The power of grid parity:
A discursive approach. Technol. Forecast. Soc. Change 87, 179–190.
doi:10.1016/j.techfore.2013.12.012
Murray, C.E., 2009. Diffusion of Innovation Theory : A Bridge for the Research - Practice Gap in
Counseling. J. Couns. Dev. 87, 108–116.
Nair, S., Paulose, H., 2014. Emergence of green business models: The case of algae biofuel for
aviation. Energy Policy 65, 175–184. doi:10.1016/j.enpol.2013.10.034
Nelson, R., 1959. The simple economics of basic scientific research. J. Polit. Econ. 67, 297–306.
Nelson, R., Winter, S., 1982. An evolutionary Theory of Economic Change. Harvard University
Press.
Nemet, G.F., 2006. Beyond the learning curve: factors influencing cost reductions in
photovoltaics. Energy Policy 34, 3218–3232. doi:10.1016/j.enpol.2005.06.020
NREL, 2012. Best research-cell efficiences, National Reneable Energy Laboratory. National
Renewable Energy Laboratory (NREL).
NREL, 2014. Best Research-Cell Efficiences [WWW Document]. Natl. Reneable Energy Lab.
URL http://www.nrel.gov/ncpv/images/efficiency_chart.jpg (accessed 6.10.14).
Okkonen, L., Suhonen, N., 2010. Business models of heat entrepreneurship in Finland. Energy
Policy 38, 3443–3452. doi:10.1016/j.enpol.2010.02.018
Oltra, V., Saint Jean, M., 2009. Sectoral systems of environmental innovation: An application to
the French automotive industry. Technol. Forecast. Soc. Change 76, 567–583.
doi:10.1016/j.techfore.2008.03.025
Ondraczek, J., 2013. The sun rises in the east (of Africa): A comparison of the development and
status of solar energy markets in Kenya and Tanzania. Energy Policy 56, 407–417.
doi:10.1016/j.enpol.2013.01.007
Ormrod, R., 1990. Local context and innovation diffusion in a well-connected world. Econ. Geogr.
66, 109–122.
Ottman, J., Stafford, E., Hartman, C., 2006. Avoiding green marketing myopia: ways to improve
consumer appeal for environmentally preferable products. Environment 48, 24–36.
Ozaki, R., 2011. Adopting sustainable innovation: what makes consumers sign up to green
electricity? Bus. Strateg. Environ. 20, 1–17.

128
Painuly, J.P., 2001. Barriers to renewable energy penetration: A framework for analysis. Renew.
Energy 24, 73–89. doi:10.1016/S0960-1481(00)00186-5
Palit, D., 2013. Solar energy programs for rural electrification: Experiences and lessons from
South Asia. Energy Sustain. Dev. 17, 270–279. doi:10.1016/j.esd.2013.01.002
Pansera, M., 2012. Renewable energy for rural areas of Bolivia. Renew. Sustain. Energy Rev. 16,
6694–6704. doi:10.1016/j.rser.2012.08.015
Pantaleo, A., Candelise, C., Bauen, A., Shah, N., 2014. ESCO business models for biomass
heating and CHP: Profitability of ESCO operations in Italy and key factors assessment.
Renew. Sustain. Energy Rev. 30, 237–253. doi:10.1016/j.rser.2013.10.001
Parida, B., Iniyan, S., Goic, R., 2011. A review of solar photovoltaic technologies. Renew.
Sustain. Energy Rev. 15, 1625–1636. doi:10.1016/j.rser.2010.11.032
Parsons, T., 1938. The role of theory in social research. Am. Sociol. Rev. 3, 13–20.
Parunak, H.V.D., Savit, R., 1998. Agent-based modeling vs. equation-based modeling: A case
study and users’ guide, in: Proceedings of Multi-Agent Systems and Agent-Based Simulation
(MABS’98), Springer, LNAI 1534. pp. 10–25.
Pearson, D., Fuller, G., Chapin, C.;, 1954. A New Silicon p-n Junction Photocell for Converting
Solar Radiation into Electrical Power. J. Appl. Phys. 25, 676–677.
Penrose, E., 2009. The theory of the growth of the firm, 4th Editio. ed. Oxford University Press.
Pentland, A., 2012. The new science of building great teams. Harv. Bus. Rev.
Pentland, A., 2013. Beyond the Echo Chamber. Harv. Bus. Rev.
Pentland, A., 2014. Social Physics, How Good Ideas Spread- The Lessons from a New Science.
The Penguin Press, New York.
Peres, R., Muller, E., Mahajan, V., 2010. Innovation diffusion and new product growth models: A
critical review and research directions. Int. J. Res. Mark. 27, 91–106.
doi:10.1016/j.ijresmar.2009.12.012
Pérez, D., Cervantes, V., Báez, M.J., Domínguez, F.T., 2013. PV Grid Parity Monitor Residential
Sector, Spain eclareon. Spain Eclareon.
Peter, R., Ramaseshan, B., Nayar, C.., 2002. Conceptual model for marketing solar based
technology to developing countries. Renew. Energy 25, 511–524. doi:10.1016/S0960-
1481(01)00080-5
Petrova-Koch, V., Hezel, R., Goetzberger, A., 2009. High-Efficient Low-Cost Photovoltaics -
Recent Developments, Springer-Verlag Berlin Heidelberg.
Pode, R., 2013. Financing LED solar home systems in developing countries. Renew. Sustain.
Energy Rev. 25, 596–629. doi:10.1016/j.rser.2013.04.004
Popp, D., Hascic, I., Medhi, N., 2011. Technology and the diffusion of renewable energy. Energy
Econ. 33, 648–662. doi:10.1016/j.eneco.2010.08.007

129
Porter, M., 1990. The competitive advantage of nations. Free Press, New York.
Porter, M.E., 1990. The Competitive Advantage of Nations. Free Press, New York.
Porter, M.E., 2000. Location, Competition, and Economic Development: Local Clusters in a
Global Economy. Econ. Dev. Q. 14, 15–34. doi:10.1177/089124240001400105
Prahalad, C.K., 2010. The fortune at the bottom of the pyramid: Eradicating poverty through
profits (revised and ppdated 5th anniversary edition), ptgmedia.pearsoncmg.com. Pearson
Education, Inc, Upper Saddle River, New Jersey.
Pujari, D., 2006. Eco-innovation and new product development: understanding the influences on
market performance. Technovation 26, 76–85. doi:10.1016/j.technovation.2004.07.006
PvParity, 2013. PV Parity Project, How to Support Different Photovoltaic Applications in the
Achievement of Competitiveness and Beyond. Final Rep.
Quitzow, R., Walz, R., Köhler, J., Rennings, K., 2014. The concept of “lead markets” revisited:
Contribution to environmental innovation theory. Environ. Innov. Soc. Transitions 10, 4–19.
doi:10.1016/j.eist.2013.11.002
Rahmandad, H., Sterman, J., 2008. Heterogeneity and Network Structure in the Dynamics of
Diffusion: Comparing Agent-Based and Differential Equation Models. Manage. Sci. 54,
998–1014. doi:10.1287/mnsc.1070.0787
Rai, V., Robinson, S.A., 2013. Effective information channels for reducing costs of
environmentally- friendly technologies: evidence from residential PV markets. Environ. Res.
Lett. 8, 014044. doi:10.1088/1748-9326/8/1/014044
Rao, K.U., Kishore, V.V.N., 2010. A review of technology diffusion models with special reference
to renewable energy technologies. Renew. Sustain. Energy Rev. 14, 1070–1078.
doi:10.1016/j.rser.2009.11.007
Reardon, C., 2009. The diffusion of sustainable practices within the Australian housing industry :
implications for future change management.
Rebane, K.L., Barham, B.L., 2011. Knowledge and adoption of solar home systems in rural
Nicaragua. Energy Policy 39, 3064–3075. doi:10.1016/j.enpol.2011.02.005
Reichelstein, S., Yorston, M., 2013. The prospects for cost competitive solar PV power. Energy
Policy 55, 117–127. doi:10.1016/j.enpol.2012.11.003
Ren21, 2014. Renewables 2013: Global Status Report, Renewable Energy Policy Network for the
21st Century. Renewable Energy Policy Network for the 21st Centruy (Ren21).
Rennings, K., 2000. Redefining innovation—eco-innovation research and the contribution from
ecological economics. Ecol. Econ. 32, 319–332.
Richter, M., 2013a. Business model innovation for sustainable energy: German utilities and
renewable energy. Energy Policy 62, 1226–1237. doi:10.1016/j.enpol.2013.05.038
Richter, M., 2013b. German utilities and distributed PV: How to overcome barriers to business
model innovation. Renew. Energy 55, 456–466. doi:10.1016/j.renene.2012.12.052

130
Rink, D.R., Swan, J.E., 1979. Product life cycle research: A literature review. J. Bus. Res. 7, 219–
242. doi:10.1016/0148-2963(79)90030-4
Rode, J., Weber, A., 2012. Does Localized Imitation Drive Technology Adoption? A Case Study
on Solar Cells in Germany.
Rogers, E., Medina, U., Rivera, M., Wiley, C., 2005. Complex adaptive systems and the diffusion
of innovations. Innov. J. Public Sect. Innov. J. 10.
Rogers, E.M., 1962. Diffusion of Innovations. The Free Press, New York.
Rogers, E.M., 2003. Diffusion of innovations, 5th ed. The Free Press, New York.
Sá, C., Florax, R.J.G.M., Rietveld, P., 2004. Determinants of the Regional Demand for Higher
Education in The Netherlands: A Gravity Model Approach. Reg. Stud. 38, 375–392.
doi:10.1080/03434002000213905
SABL, 2013. Statistische Ämter des Bundes und der Länder [WWW Document]. URL
www.regionalstatistik.de
Sarzynski, A., Larrieu, J., Shrimali, G., 2012. The impact of state financial incentives on market
deployment of solar technology. Energy Policy 46, 550–557.
doi:10.1016/j.enpol.2012.04.032
SB, 2007. Ein Zentrum fürs Leben. Sol. Blvd.
Schiederig, T., Tietze, F., Herstatt, C., 2012. Green innovation in technology and innovation
management - an exploratory literature review. R&D Manag. 42, 180–192.
doi:10.1111/j.1467-9310.2011.00672.x
Schmookler, J., 1966. Invention and Economic Growth. Harvard University Press, Massachusetts.
Schoolgen, 2012. Student Fact Sheet: A Short History of Photovoltaic ( PV ) Cells, downloaded.
ed, World. Schoolgen Project, Genesis Energy, New Zealand.
Schumpeter, J.A., 1939. Business Cycles, A Theoretical, Historical and Statistical Analysis of the
Capitalist Process, Édition nu. ed. McGraw-Hill Book Company, Québec, Canada.
doi:10.1016/j.socscimed.2006.11.007
Schwarz, N., Ernst, A., 2009. Agent-based modeling of the diffusion of environmental innovations
— An empirical approach. Technol. Forecast. Soc. Change 76, 497–511.
doi:10.1016/j.techfore.2008.03.024
SEIA, 2010. The History of Solar Energy A Look at Uses of Solar Energy from BC to ITC. Solar
Energy Industries Association (SEIA).
Sharif, M., Islam, M., 1980. The Weibull distribution as a general model for forecasting
technological change. Technol. Forecast. Soc. Change 256, 247–256.
Shinohara, K., Okuda, H., 2010. Dynamic Innovation Diffusion Modelling. Comput. Econ. 35,
51–62. doi:10.1007/s10614-009-9191-5

131
Shrivastava, P., 1995. Environmental technologies and competitive advantage. Strateg. Manag. J.
16, 183–200.
Siggelkow, N., 2007. Persuasion With Case Studies. Acad. Manag. J. 50, 20–24.
doi:10.5465/AMJ.2007.24160882
SLBW, 2013. Statistisches Landesamt Baden-Württemberg [WWW Document]. URL
www.statistik.baden-wuerttemberg.de/?
Smith, A., Kern, F., Raven, R., Verhees, B., 2014. Spaces for sustainable innovation: Solar
photovoltaic electricity in the UK. Technol. Forecast. Soc. Change 81, 115–130.
doi:10.1016/j.techfore.2013.02.001
Sosna, M., Trevinyo-Rodríguez, R.N., Velamuri, S.R., 2010. Business Model Innovation through
Trial-and-Error Learning. Long Range Plann. 43, 383–407. doi:10.1016/j.lrp.2010.02.003
Sovacool, B.K., 2014a. What are we doing here? Analyzing fifteen years of energy scholarship
and proposing a social science research agenda. Energy Res. Soc. Sci. 1, 1–29.
doi:10.1016/j.erss.2014.02.003
Sovacool, B.K., 2014b. Diversity: Energy studies need social science. Nature 511, 529–30.
doi:10.1038/511529a
Spaargaren, G., 2003. Sustainable consumption: a theoretical and environmental policy
perspective. Soc. &Natural Resour. 687–701. doi:10.1080/08941920390217429
Spence, A., 1981. The learning curve and competition. Bell J. Econ. 12, 49–70.
Spertino, F., Leo, P. Di, Cocina, V., 2014. Which are the constraints to the photovoltaic grid-parity
in the main European markets? Sol. Energy 105, 390–400. doi:10.1016/j.solener.2014.03.021
Sriwannawit, P., 2012. Managing the diffusion of electrification in Bangladesh, in: International
Conference for the International Association of Management of Technology (IAMOT)
Taiwan.
Sriwannawit, P., Laestadius, S., 2013. Diffusion of photovoltaic systems for rural electrification in
Thailand. Int. J. Energy Environ. 4, 49–58.
Sriwannawit, P., Sandström, U., 2015. Large-scale bibliometric review of diffusion research.
Scientometrics 102, 1615–1645. doi:10.1007/s11192-014-1448-7
Stake, R., 2000. The case study method in social inquiry, in: Gomm, R., Hammer, M., Foster, P.
(Eds.), Case Study Method. London: Sage [originally published in Educational Researcher (7
February 1978): 5–8], pp. 19–26.
Strang, D., Meyer, J.W., 1993. Institutional conditions for diffusion. Theory Soc. 22, 487–511.
doi:10.1007/BF00993595
Sühlsen, K., Hisschemöller, M., 2014. Lobbying the “Energiewende”. Assessing the effectiveness
of strategies to promote the renewable energy business in Germany. Energy Policy 69, 316–
325. doi:10.1016/j.enpol.2014.02.018

132
Surinach, J., Autant-Bernard, C., Manca, F., 2009. The diffusion/adoption of innovation in the
internal market. Eur. Econ. Econ. Pap. 384 1, 1829–1841. doi:10.2765/40088
SWW, 2004. Flexibilität hört auf dem Dach nicth auf. Sonne, Wind wärme 1–4.
Szabó, S., Bódis, K., Huld, T., Moner-Girona, M., 2011. Energy solutions in rural Africa: mapping
electrification costs of distributed solar and diesel generation versus grid extension. Environ.
Res. Lett. 6, 034002. doi:10.1088/1748-9326/6/3/034002
Teece, D., 1980. The diffusion of an administrative innovation. Manage. Sci. 26, 464–470.
The Economist, 2014. Hail , the Swabian housewife Feb 1st.
The Economist, 2015. Special Report: Energy and technology. Econ. 17 Jan.
Thiam, D.R., 2011. An energy pricing scheme for the diffusion of decentralized renewable
technology investment in developing countries. Energy Policy 39, 4284–4297.
doi:10.1016/j.enpol.2011.04.046
Tiwari, R., Herstatt, C., 2012. Assessing India’s lead market potential for cost-effective
innovations. J. Indian Bus. Res. 4, 97–115. doi:10.1108/17554191211228029
Tomas, M., Yalamanchili, K., 2001. An application of finite elements to option pricing. J. Futur.
Mark. 21, 19–42.
Tongur, S., Engwall, M., 2014. The business model dilemma of technology shifts. Technovation
1–11. doi:10.1016/j.technovation.2014.02.006
Tranfield, D., Denyer, D., Smart, P., 2003. Towards a methodology for developing evidence-
informed management knowledge by means of systematic review *. Br. J. Manag. 14, 207–
222. doi:10.1111/1467-8551.00375
Trimi, S., Berbegal-Mirabent, J., 2012. Business model innovation in entrepreneurship. Int.
Entrep. Manag. J. 8, 449–465. doi:10.1007/s11365-012-0234-3
Trogdon, J.G., Nonnemaker, J., Pais, J., 2008. Peer effects in adolescent overweight. J. Health
Econ. 27, 1388–99. doi:10.1016/j.jhealeco.2008.05.003
Truffer, B., Coenen, L., 2012. Environmental innovation and sustainability transitions in regional
studies. Reg. Stud. 1–21.
Tsoutsos, T.D., Stamboulis, Y. a., 2005. The sustainable diffusion of renewable energy
technologies as an example of an innovation-focused policy. Technovation 25, 753–761.
doi:10.1016/j.technovation.2003.12.003
Twining, W., 2005. Social science and diffusion of law. J. Law Soc. 32, 203–240.
Van den Bergh, J., 2013a. Environmental and climate innovation: Limitations, policies and prices.
Technol. Forecast. Soc. Change 80, 11–23. doi:10.1016/j.techfore.2012.08.004
Van den Bergh, J., 2013b. Policies to enhance economic feasibility of a sustainable energy
transition. Proc. Natl. Acad. Sci. U. S. A. 110, 2436–2437. doi:10.1073/pnas.1221894110

133
Vasseur, V., Kamp, L.M., Negro, S.O., 2013. A comparative analysis of Photovoltaic
Technological Innovation Systems including international dimensions: The cases of Japan
and The Netherlands. J. Clean. Prod. 48, 200–210. doi:10.1016/j.jclepro.2013.01.017
Venkatesh, V., 2000. Determinants of perceived ease of use: Integrating control, intrinsic
motivation, and emotion into the technology acceptance model. Inf. Syst. Res. 1997, 342–
365.
Waarts, E., van Everdingen, Y., 2005. The influence of national culture on the adoption status of
innovations: An empirical study of firms across Europe. Eur. Manag. J. 23, 601–610.
doi:10.1016/j.emj.2005.10.007
Wagner, M., 2008. Empirical influence of environmental management on innovation: Evidence
from Europe. Ecol. Econ. 66, 392–402. doi:10.1016/j.ecolecon.2007.10.001
Walker, J., 1969. The diffusion of innovations among the American states. Am. Polit. Sci. Rev. 63,
880–899.
Walz, J., Fulton, R., Cyrus, N., 1968. Accuracy and convergence of finite element approximations.
Walz, R., Köhler, J., 2014. Using lead market factors to assess the potential for a sustainability
transition. Environ. Innov. Soc. Transitions 10, 20–41. doi:10.1016/j.eist.2013.12.004
Watanabe, C., Asgari, B., 2004. Impacts of functionality development on dynamism between
learning and diffusion of technology. Technovation 24, 651–664. doi:10.1016/S0166-
4972(02)00126-8
WB, 2014. World Bank categorization of countries by income [WWW Document]. World Bank.
URL http://data.worldbank.org/about/country-classifications/country-and-lending-groups
(accessed 5.6.14).
Weber, M., 1922. Economy and society: An outline of interpretive sociology.
Wejnert, B., 2002. Integrating Models of Diffusion of Innovations : A Conceptual Framework.
Annu. Rev. Sociol. 28, 297–326. doi:10.1146/annurev.soc.28.110601.141051
Wirth, H., 2013. Aktuelle Fakten zur Photovoltaik in Deutschland. Fraunhofer ISE.
Wirth, H., 2014. Recent facts about photovoltaics in Germany. Fraunhofer ISE.
Wirth, S., 2014. Communities matter: Institutional preconditions for community renewable
energy. Energy Policy 70, 236–246. doi:10.1016/j.enpol.2014.03.021
Wong, S., 1998. Multi-commodity traffic assignment by continuum approximation of network
flow with variable demand. Transp. Res. Part B Methodol. 32, 567–581.
Wong, S.C., Du, Y.C., Sun, L.J., Loo, B.P.Y., 2006. Sensitivity analysis for a continuum traffic
equilibrium problem. Ann. Reg. Sci. 40, 493–514. doi:10.1007/s00168-006-0071-9
Wong, S.C., Sun, S.H., 2001. A combined distribution and assignment model for continuous
facility location problem. Ann. Reg. Sci. 35, 267–281. doi:10.1007/s001680100042

134
Wong, S.C., Zhou, C., Lo, H.K., Yang, H., 2004. Improved Solution Algorithm for
Multicommodity Continuous Distribution and Assignment Model. J. Urban Plan. Dev. 130,
14–23. doi:10.1061/(ASCE)0733-9488(2004)130:1(14)
Wüstenhagen, R., Menichetti, E., 2012. Strategic choices for renewable energy investment:
Conceptual framework and opportunities for further research. Energy Policy 40, 1–10.
doi:10.1016/j.enpol.2011.06.050
Wüstenhagen, R., Wolsink, M., Bürer, M.J., 2007. Social acceptance of renewable energy
innovation: An introduction to the concept. Energy Policy 35, 2683–2691.
doi:10.1016/j.enpol.2006.12.001
Yang, C.J., 2010. Reconsidering solar grid parity. Energy Policy 38, 3270–3273.
doi:10.1016/j.enpol.2010.03.013
Yang, H., Yagar, S., Iida, Y., 1994. Traffic assignment in a congested discrete/ continuous
transportation system. Transp. Res. Part B Methodol. 28, 161–174. doi:10.1016/0191-
2615(94)90023-X
Yelle, L.E., 1979. the Learning Curve: Historical Review and Comprehensive Survey. Decis. Sci.
10, 302–328. doi:10.1111/j.1540-5915.1979.tb00026.x
Yin, R.K., 2003. Case Study Research: Design and methods. Thousand Oaks: Sage Publications.
Yin, R.K., 2011. Applications of Case Study Research, 3rd Editio. ed. Sage Publications.
Yuan, X., Zuo, J., Ma, C., 2011. Social acceptance of solar energy technologies in China—End
users’ perspective. Energy Policy 39, 1031–1036. doi:10.1016/j.enpol.2011.01.003
Zhai, P., 2013. Analyzing solar energy policies using a three-tier model: A case study of
photovoltaics adoption in Arizona, United States. Renew. Energy 57, 317–322.
doi:10.1016/j.renene.2013.01.058
Zhai, P., Williams, E.D., 2012. Analyzing consumer acceptance of photovoltaics (PV) using fuzzy
logic model. Renew. Energy 41, 350–357. doi:10.1016/j.renene.2011.11.041
Zhang, S., Andrews-Speed, P., Ji, M., 2014. The erratic path of the low-carbon transition in China:
Evolution of solar PV policy. Energy Policy 67, 903–912. doi:10.1016/j.enpol.2013.12.063
Zhang, X., Shen, L., Chan, S.Y., 2012. The diffusion of solar energy use in HK: What are the
barriers? Energy Policy 41, 241–249. doi:10.1016/j.enpol.2011.10.043
Zhang, Y., Song, J., Hamori, S., 2011. Impact of subsidy policies on diffusion of photovoltaic
power generation. Energy Policy 39, 1958–1964. doi:10.1016/j.enpol.2011.01.021
Zimmerman, D., 2003. Peer effects in academic outcomes: Evidence from a natural experiment.
Rev. Econ. Stat. 85, 9–23.
Zott, C., Amit, R., Massa, L., 2011. The Business Model: Recent Developments and Future
Research. J. Manage. 37, 1019–1042. doi:10.1177/0149206311406265

135
Zubaryeva, A., Thiel, C., Zaccarelli, N., Barbone, E., Mercier, A., 2012. Spatial multi-criteria
assessment of potential lead markets for electrified vehicles in Europe. Transp. Res. Part A
Policy Pract. 46, 1477–1489. doi:10.1016/j.tra.2012.05.018