A Morning with an Irreplacable Element: CHROME Morning with an Irreplacable Element: CHROME . ......
108
A Morning with an Irreplacable Element: CHROME Johannesburg & Cape Town, November 2010
Transcript of A Morning with an Irreplacable Element: CHROME Morning with an Irreplacable Element: CHROME . ......

A Morning with an Irreplacable Element: CHROME
Johannesburg & Cape Town, November 2010
Presenter
Presentation Notes
United States of America? Rather USA – New York and Boston

2
F. P. Bath, 1968
Source: Bath, F.P.: “Chromium in South Africa”, Journal of the SAIMM, March 1968

South Africa – Sales Values
3
5,782
0
2,000
4,000
6,000
8,000
10,000
12,000
14,00019
80
1982
1984
1986
1988
1990
1992
1994
1996
1998
2000
2002
2004
2006
2008
2010
in M
ill US
$
Cr Ore & FeCr SalesG.R.: 7.8%
GoldG.R.: -2.9%
2,84290 %
Source: DMR, Heinz H. Pariser

Agenda
4
1. The Effect of Chrome
2. South Africa – A Sleeping Cr Giant
3. Support for the Global Stainless Steel Industry
4. Nickel – the „Be-devilled“ Metal
5. Stainless Scrap – the Strongest Competitor
6. The Way Forward – Opportunities and Obstacles
7. Conclusions

5
The Effect of Chrome

Chromite – a Selective Historic Review
6
1797: Vauqeulin discovers a new element in „red lead“ – the mineral crocoite – and names it „chrôme“ 1821: First „Ferro Chrome“ obtained by direct reduction 1890: Research on „Chrome Steels“ starts 1909-15: Discovery of „Stainless Steel“ through the work of Haynes (USA – 1911), Brearley (UK - 1913), Maurer & Straus (Germany – 1914) 1920s: Various Cr-Alloy Steels and Stainless Steel in existence 1930s: NiCrFe „Super Alloys“ and NiCr / AlCr Electrical Resistance
1797 1821 1890 >1909 >1920
>1930

7
Value Added Structure of Chromium Alloys
Charge3.93
HC4.18
MC0.18
LC0.36
ULC0.05
4.0 – 7.5
7.5 – 8.5
0.5 – 4.0
0.05 – 0.5
< 0.05
< 0.02
0.03
1.01 – 1.36
0.65 – 1.16
0.85 – 1.40
2.00 – 2.17
2.33 – 2.50
3.78 – 5.13
Basis 2010 – Volumes in Mill. t Material Weight – Price Ranges 1st HY 2010
Cr Metal

Overview First Use for Chromite
8

Global Cr Ore & Concentrate Use 2009, in %
9
Metallurgical; 94.5
Foundry Sands; 2.5
Chemical; 2.0 Refractory; 1.0
Source: Heinz H. Pariser
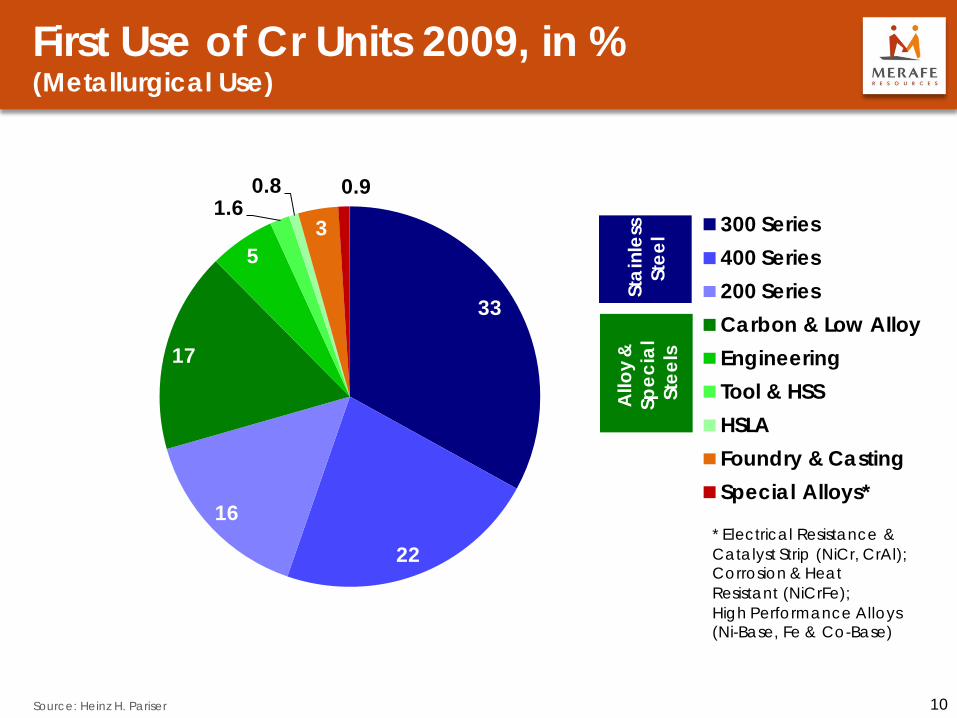
First Use of Cr Units 2009, in % (Metallurgical Use)
10 Source: Heinz H. Pariser
33
22
16
17
5
1.60.8
3
0.9
300 Series400 Series200 SeriesCarbon & Low AlloyEngineeringTool & HSSHSLAFoundry & CastingSpecial Alloys*
Stai
nles
sSt
eel
Allo
y &
Spec
ial
Stee
ls
* Electrical Resistance & Catalyst Strip (NiCr, CrAl); Corrosion & Heat Resistant (NiCrFe); High Performance Alloys (Ni-Base, Fe & Co-Base)

Cr End Use Markets 2009, in % (Metallurgical Use)
11 Source: Heinz H. Pariser
24
21
18
16
11
54
Engineering (Petro-chemical, Food Processing, etc.)Metal Goods (Cutlery, Tableware, etc.)
Building & Construction(Panels, Sinks, etc.)
Transport(Automotive, Aerospace, etc.)
Tubular Products
Electromechanical & Electronic Products(White goods,brown goods, etc.)Others

Overview First Use for Chromite
12 Source: Heinz H. Pariser
Sodiumdichromate Refractory Bricks & Mortars Molds for Casting
Metallurgical Chromite
(Lump, Chips, Fines & Concentrates) 20.0 Mill t
Chemical Chromite ( Concentrates)
0.3 Mill t
Refractory Chromite (Lump, Fines & Concentrates)
0.2 Mill t
Foundry Sand Chromite
( Concentrates)0.5 Mill t
Smelting Roasting Upgrade / Blend / Fire Upgrade
Ferro ChromeCharge/HC/MC/LC
8.3 Mill t / 4.3 Mill t Cr-units
Internal & External Stainless Scrap
10.2 Mill t,1.8 Mill t Cr-units
Stainless Steel (Cr input)Cr-units 2.9 Mill t Alloy Steel
Aust.Cr-units1.4 Mill t
Ferr.Cr-units0.9 Mill t
CrMnCr-units0.6 Mill t
Tool & High Speed Steel
Low Alloy Steel
Others
Nickel Alloys Foundries Welding Elec.
67.4% 5.5%27.1%

10
12
14
16
18
20
22
24
2000
2001
2002
2003
2004
2005
2006
2007
2008
2009
in M
ill t
Growth Rate6.9%
Chrome Ore Production - Metallurgical Grade -
Metallurgical Chromite Production & Applications
13 Source: Heinz H. Pariser
Stainless Steel
Automotive exhaust system
„General Purpose“ Architecture,
food processing, deep drawing
Process industry, Desalination plants, Flue-gas Cleaning
Shafts, parts requiring high toughness
mandrel rods, forging and
pressing dies, pressure casting
plastic molds & forms
Alloy Steel

200
300
400
500
600
700
800
900
1,000
1,100
2000
2001
2002
2003
2004
2005
2006
2007
2008
2009
in 0
00 t
Growth Rate-9.9%
Chemical Grade Production & Applications
14 Source: Heinz H. Pariser Source: Wikipedia
Chrome Ore Production - Chemical Grade -
Crocoite from Tasmania
Potassium Chromate
Potassium Dichromate
Tannery
Chrome Wheels

80
100
120
140
160
180
200
2000
2001
2002
2003
2004
2005
2006
2007
2008
2009
in 0
00 t
Growth Rate2.0%
Refractory Chromite Production & Applications
15 Source: Heinz H. Pariser
Chrome Ore Production - Refractory Grade -
Source: Nelion Exports Source: Sterling Coomodities Ltd.
Refractory Bricks
Source: www.asia.ru

Foundry Grade Production & Applications
16 Source: Heinz H. Pariser
Source: www.metrom.com
Chrome Ore
Custom Mold Made of Foundry Sand
300
350
400
450
500
550
600
650
700
750
2000
2001
2002
2003
2004
2005
2006
2007
2008
2009
in 0
00 t
Growth Rate7.3%
Chrome Ore Production - Foundry Grade -

17 Source: Heinz H. Pariser
Any Questions?

18
South Africa – A Sleeping Cr Giant

Chrome Ore Reserves & Resources 2009
19
Rankin Mill t in % in Mill t in %
South Africa 5,500 72 1 11.4 *) 50.0Zimbabwe 930 12 2 0.3 1.2
Kazakhstan 387 5 3 3.6 15.9
Finland 120 1.6 4 0.2 1.1
Turkey 70 0.9 5 1.6 7.3
India 67 0.9 6 2.4 10.6
Brazil 17 0.2 7 0.4 2.0
Others 576 7.5 8 2.7 12.0
Total 7,667 100.0 22.7 100.0*) incl. UG2 & Independent Mines
Source: Departm ent of Mineral Resources, South Africa, Heinz H. Pariser
Chromite Ore Reserves Chromite Ore Output

South Africa's Chrome Ore Market 2009
20 Source: Heinz H. Pariser
FeCr - Domestic & Export Sales
Revenues: 2,455 Mill $
Output 11.4 Mill tRevenues: 1,071 Mill $
ExportRevenues: 704 Mill $
MetallurgicalRevenues: 239 Mill $
internal sales
Chemical & FoundryRevenues: 128 Mill $

Chrome Ore Demand Structure 2009
21 Source: Heinz H. Pariser
China
Australia
Other Europe
AfricaAmerica
EU
Japan
Other Asia
-20
-15
-10
-5
0
5
10
15
20
25
30
0 20 40 60 80
Gro
wth
Rat
e 20
00 -
2009
in %
p.a
.
Share of Cr Ore Demand in %
Average Growth Rate: 6.8%
10
15
20
25
30
35
2000
2001
2002
2003
2004
2005
2006
2007
2008
2009
in M
ill t

South African Platinum Industry – Mine Production
22 Source: Heinz H. Pariser
588_
2000 2007 2008 2009 G.R.in %
Merensky 25.1 36.7 36.7 35.0 4.5
UG 2 28.3 47.8 49.7 54.9 7.3
Total 53.3 84.5 86.4 90.0 6.1
UG 2 Ratio in % 53.0 56.6 57.5 61.1 1.1
in Mill t
Anglo American Platinum
47%
Impala Platinum
15%
Aquarius Platinum
23%
Lonmin Platinum
15%
2009
20
30
40
50
60
70
80
90
100
2000
2001
2002
2003
2004
2005
2006
2007
2008
2009
in M
ill t
UG 2G.R.: 7.3%
Total Mine ProductionG.R.: 6.1%

Mine Production & Supply
23 Source: Heinz H. Pariser
2007 2008 2009
Mine ProductionDMR 9.6 9.6 6.6ICDA 8.7 9.3 6.2
HHP Supply 13.3 14.1 11.4Independent Mines & UG2 5.0 6.5 5.5
in Mill t
5.0
6.0
7.0
8.0
9.0
10.0
11.0
12.0
13.0
14.0
15.0
2000
2001
2002
2003
2004
2005
2006
2007
2008
2009
in M
ill t
HHP SupplyG.R.: 5.8%
Mine Production DMRG.R.: 3.6%
Mine Production ICDAG.R.: 2.3%

Export Sales
24 Source: Heinz H. Pariser
2007 2008 2009
Official Exports 3,397 4,938 4,986
Exports Independent Mines 1,002 1,266 1,197
Exports of UG2 1,503 2,953 2,794
Export Sales Integrated Mines 893 720 995
in ´000 t
0.0
1.0
2.0
3.0
4.0
5.0
6.0
2000
2001
2002
2003
2004
2005
2006
2007
2008
2009
in M
ill t
Export SalesIntegrated Mines
G.R.: 0.2%
ExportsIndependent Mines
G.R.: 24.0
Official ExportsG.R.: 19.2%
Exports of UG 2G.R.: 67.2
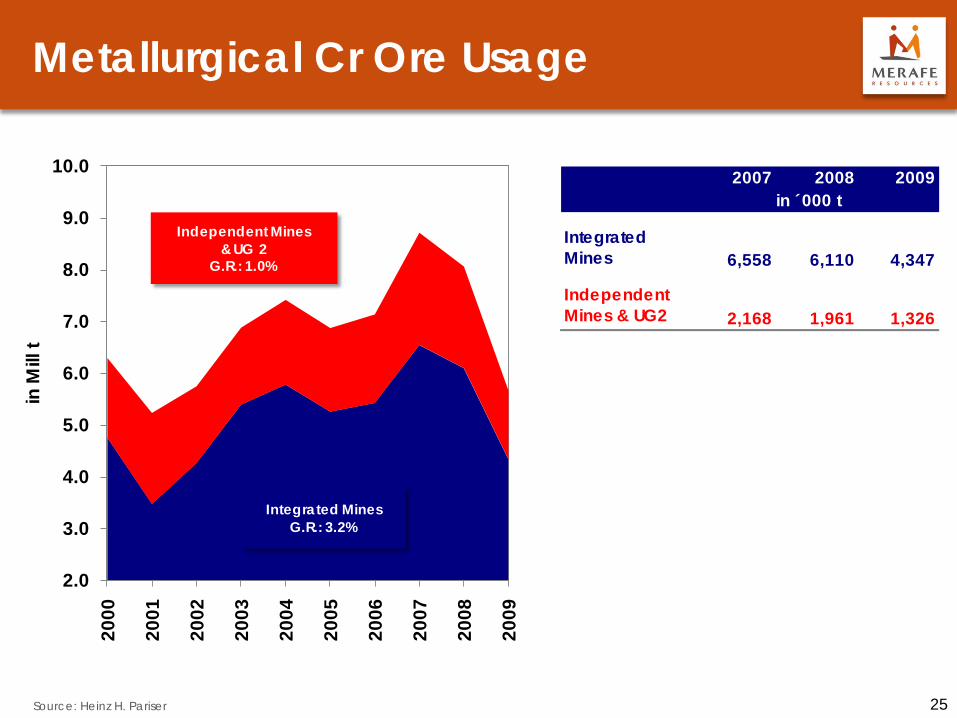
Metallurgical Cr Ore Usage
25 Source: Heinz H. Pariser
2007 2008 2009
Integrated Mines 6,558 6,110 4,347
Independent Mines & UG2 2,168 1,961 1,326
in ´000 t
2.0
3.0
4.0
5.0
6.0
7.0
8.0
9.0
10.0
2000
2001
2002
2003
2004
2005
2006
2007
2008
2009
in M
ill t
Integrated MinesG.R.: 3.2%
Independent Mines& UG 2
G.R.: 1.0%

Chemical & Foundry Usage
26 Source: Heinz H. Pariser
2007 2008 2009
Integrated Mines 831 797 496
Independent Mines & UG2 327 317 213
in ´000 t
0.4
0.5
0.6
0.7
0.8
0.9
1.0
1.1
1.2
1.3
1.4
2000
2001
2002
2003
2004
2005
2006
2007
2008
2009
in M
ill t
Integrated MinesG.R.: -5.4%
Independent Mines & UG 2G.R.: 7.2%

The Potential of UG2
27 Source: Heinz H. Pariser
-100
-80
-60
-40
-20
0
20
40
60
0.0 20.0 40.0 60.0 80.0 100.0
Rela
tive
Cha
nge
in O
re In
put C
ost,
in %
UG2 Transfer Price, in US$ per t
0% 10% 30%50% 70%
UG2 Share in Ore Mix
UG2 Transfer Price Range
UG2 in SAF Technology:
• Reduction of ore input costs
UG2 in DC Technology:
• Direct use, • Increased reduction of ore input cost • Lower reductant cost
Calculation based on: SAF Technology , 70% Pellets, 30% Lumpy, ZAR/US$ = 8.4
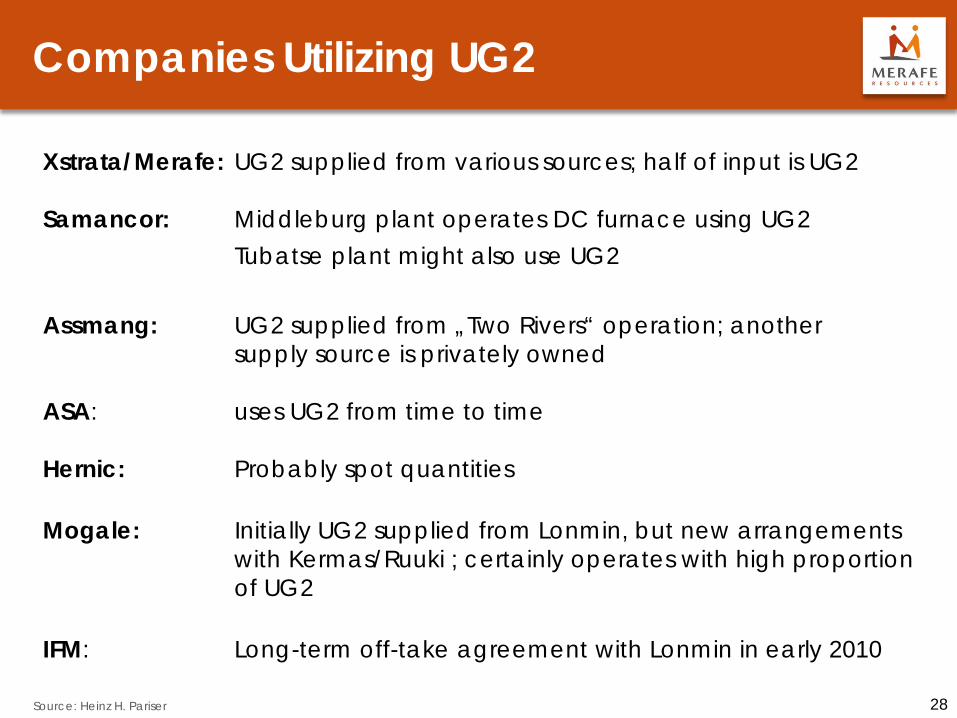
Companies Utilizing UG2
28 Source: Heinz H. Pariser
Xstrata/Merafe: UG2 supplied from various sources; half of input is UG2 Samancor: Middleburg plant operates DC furnace using UG2 Tubatse plant might also use UG2 Assmang: UG2 supplied from „Two Rivers“ operation; another supply source is privately owned ASA: uses UG2 from time to time Hernic: Probably spot quantities Mogale: Initially UG2 supplied from Lonmin, but new arrangements with Kermas/Ruuki ; certainly operates with high proportion of UG2 IFM: Long-term off-take agreement with Lonmin in early 2010

Metallurgical Chrome Ore & Concentrate
29 Source: Heinz H. Pariser
KazakhstanSudan
MadagascarTurkey
ZimbabweSouth Africa
IndiaIndonesia
OmanBrazilUG2
AlbaniaFinland
IranRussia
20 30 40 50 60 70
Cr2O3 Content in wt.-%
Cr2O3 Content
SudanKazakhstanZimbabwe
IndiaRussiaTurkey
AlbaniaIran
OmanBrazil
MadagascarFinland
South AfricaIndonesia
UG2
1.00 2.00 3.00 4.00 5.00Cr : Fe Ratio in wt.-%
Cr : Fe Ratio

Ferrochrome Production Technologies (I)
30
Pre-heating
Source: IFML Company Information
Beneficiation
SAF
FeCr Ingots
Fines
SAF (Outokumpu & Conventional Process)
Lumpy Ore
Pelletising
Sintering
Offgas
Offgas
Reductants Fluxes
Power
Slag
Fines
Beneficiation
DC Furnace Offgas Power
FeCr Ingots
Slag
Reductants Fluxes
DC Furnace

Ferrochrome Production Technologies (II)
31 Source: Heinz H. Pariser
Milling
Drying
Raw Materials: Cr2O3, Reductants, Binder Clay
Rotary Kiln (Pre-Reduction)
Electric Furnace
Reductants, Fluxes
Slag
FeCr Ingots
Power
Pelletizing
H2O
Roasting
Hot sintered pellets
Hot sintered pellets
Coal, Off Gas
FeCr Granules
Xstrata / Merafe – Premus Process

Generic*) Charge / HC FeCr – Capacity Changes
32 Source: Heinz H. Pariser
2007 2008 2009 2010 e 2011 f 2012 f 2013 f
Europe 1,021 1,068 1,071 1,122 1,197 1,287 1,502
South Africa 4,354 3,740 3,890 4,095 4,195 4,275 4,734Zimbabwe 250 250 250 250 250 250 250
Brazil 190 200 200 200 200 200 200
China 1,300 1,500 1,500 1,520 1,620 1,720 1,820
India 1,040 1,066 1,041 1,156 1,406 1,476 1,576I ran 20 50 50 50 50 50 50
Kazakhstan 1,150 1,150 1,170 1,170 1,300 1,500 1,600
Total Capacity 9,325 9,024 9,172 9,563 10,218 10,758 11,732
Demand 7,591 6,639 7,117 8,210 8,835 9,360 10,012Utilisation (%) 82.9 82.7 67.2 85.4 82.9 82.1 79.9*) incl. Feed Material for LC & MC FeCr
*) incl. Saleble & internal Feed
in ´000 t
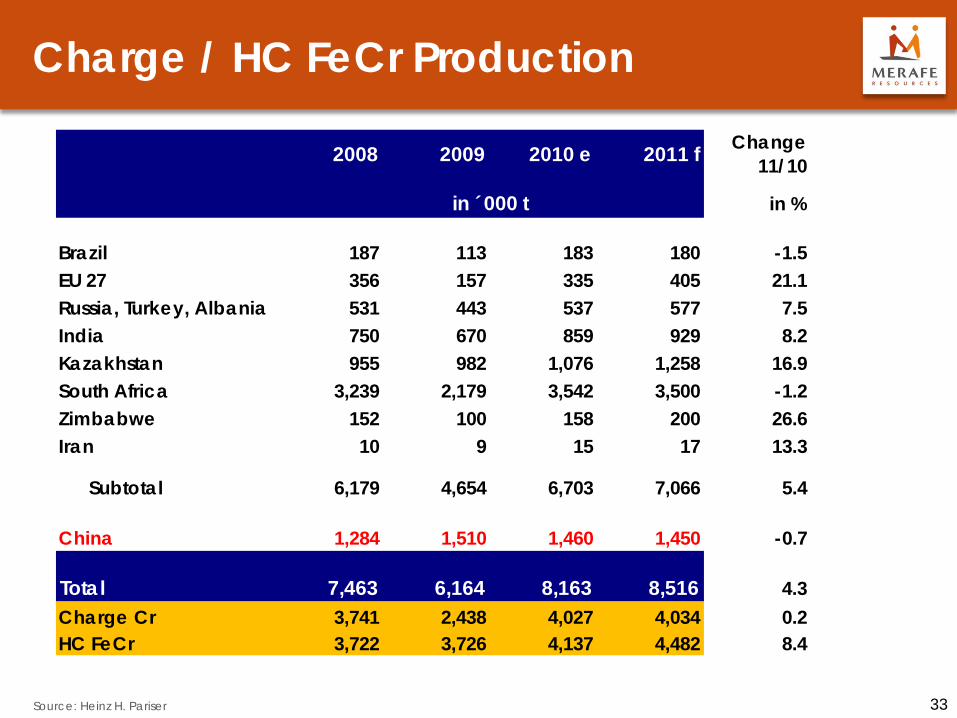
Charge / HC FeCr Production
33 Source: Heinz H. Pariser
2008 2009 2010 e 2011 f Change11/10
in %
Brazil 187 113 183 180 -1.5EU 27 356 157 335 405 21.1Russia, Turkey, Albania 531 443 537 577 7.5India 750 670 859 929 8.2Kazakhstan 955 982 1,076 1,258 16.9South Africa 3,239 2,179 3,542 3,500 -1.2Zimbabwe 152 100 158 200 26.6Iran 10 9 15 17 13.3
Subtotal 6,179 4,654 6,703 7,066 5.4
China 1,284 1,510 1,460 1,450 -0.7
Total 7,463 6,164 8,163 8,516 4.3Charge Cr 3,741 2,438 4,027 4,034 0.2HC FeCr 3,722 3,726 4,137 4,482 8.4
in ´000 t

Producers of Charge / HC FeCr
34 Source: Heinz H. Pariser
5141
2528
24 31
2008 2009
Production Breakdown Type
Charge Cr
Low Grade HC FeCr
High Grade HC FeCr
Total Output(Cr Units)4,237 kt
Total Output(Cr Units)3,406 kt
2008 2009
ENRC 696 740Chelyabinsk 85 64Mechel 45 57Eti Krom 44 24Vargön 13 5India 466 417China 305 334Zimbabwe 98 65Albania 18 4Iran 11 6Xstrata / Merafe 665 488Samancor 416 312Hernic 168 109Outokumpu 124 65IFML 109 61Assmang 103 50Ferbasa 101 59ASA Metals 61 25Tata & Others 66 45Vargön 54 17
High
Gra
deLo
w G
rade
Cha
rge
Cr
in ´000 t Cr Units

High Carbon overtaking Charge Chrome (Production)
35 Source: Heinz H. Pariser
1,500
2,000
2,500
3,000
3,500
4,000
4,500
5,000
2000 2001 2002 2003 2004 2005 2006 2007 2008 2009 2010 e 2011 f
in ´0
00 t
Mat
eria
l Wei
ght Charge Cr
G.R.: 2.7%
HC FeCrG.R.: 10.3%

Regional Production Breakdown 2009
36 Source: Heinz H. Pariser
-40
-30
-20
-10
0
10
20
30
40
0 10 20 30 40 50 60 70 80 90
Gro
wth
Rat
e 20
00 -
2009
, in
%
Share of Production, in %
Brazil
Others
China
India
Russia
Finland
South Africa
Average Growth Rate: 5.9% p.a.Kazakhstan
Zimbabwe
Turkey
Sweden
Others incl. Slovakia, Albania & Iran
Charge Cr
HC FeCr

Charge / HC FeCr Production – Integrated vs. Converters
37 Source: Heinz H. Pariser
0.0
5.0
10.0
15.0
20.0
25.0
30.0
0
1,000
2,000
3,000
4,000
5,000
6,000
7,000
8,000
9,000
2000 2001 2002 2003 2004 2005 2006 2007 2008 2009
% share of C
hinese Converters
in ´0
00 t
587_063_D3
Integrated ProducersG.R.: 3.7%
ChinaG.R.: 24.2%
Other ConvertersG.R.: -5.0%
Converters with own Cr Ore BaseG.R.: 11.2%
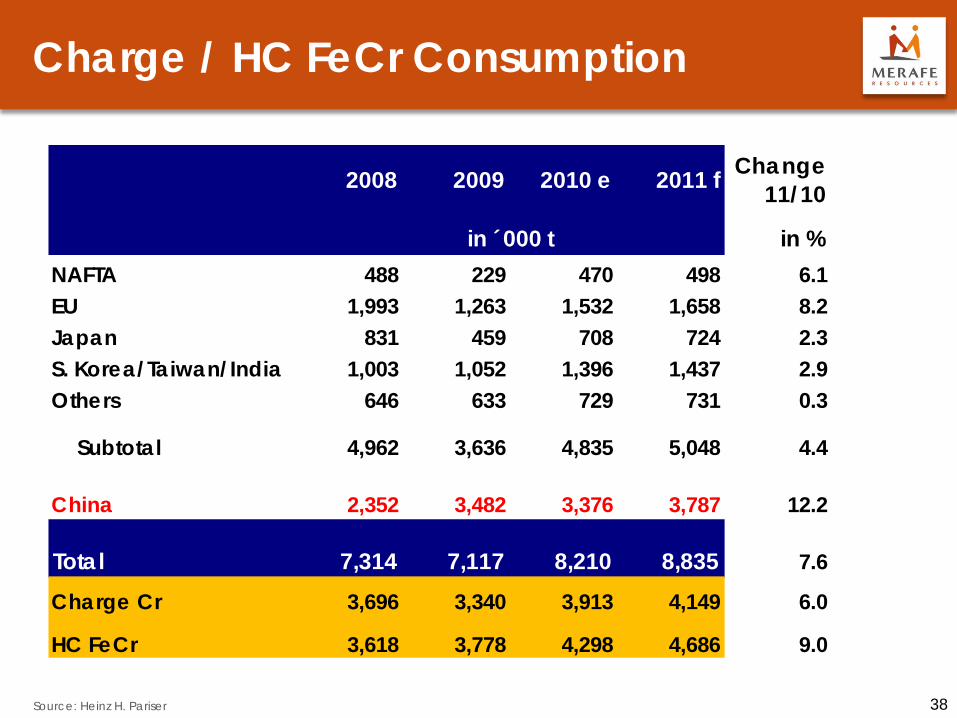
Charge / HC FeCr Consumption
38 Source: Heinz H. Pariser
2008 2009 2010 e 2011 f Change11/10
in %NAFTA 488 229 470 498 6.1EU 1,993 1,263 1,532 1,658 8.2Japan 831 459 708 724 2.3S. Korea/Taiwan/India 1,003 1,052 1,396 1,437 2.9Others 646 633 729 731 0.3
Subtotal 4,962 3,636 4,835 5,048 4.4
China 2,352 3,482 3,376 3,787 12.2
Total 7,314 7,117 8,210 8,835 7.6
Charge Cr 3,696 3,340 3,913 4,149 6.0
HC FeCr 3,618 3,778 4,298 4,686 9.0
in ´000 t
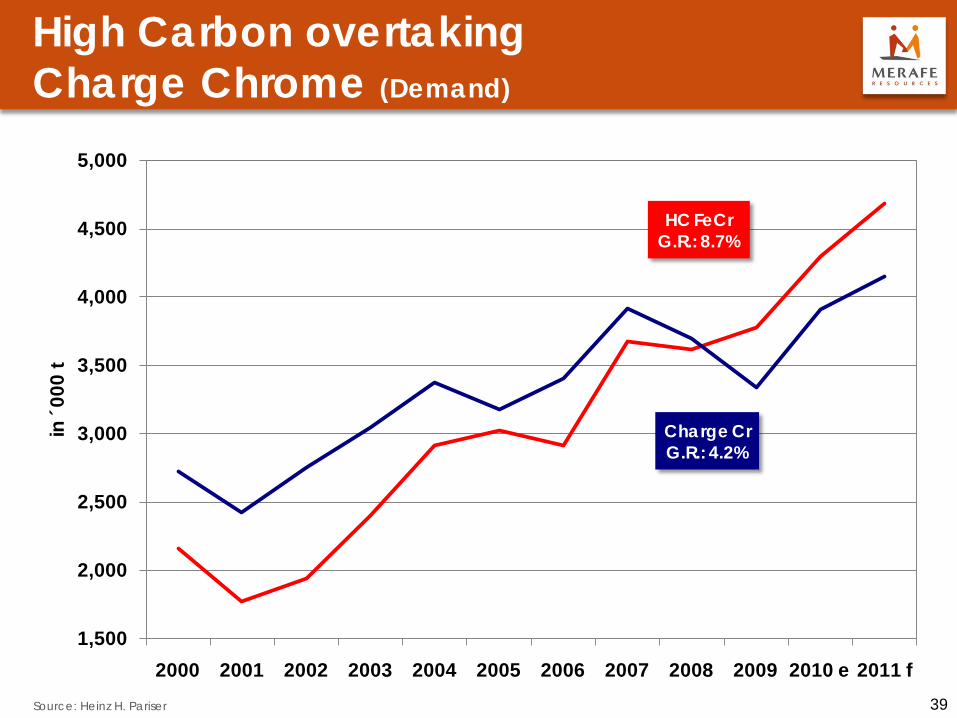
High Carbon overtaking Charge Chrome (Demand)
39 Source: Heinz H. Pariser
1,500
2,000
2,500
3,000
3,500
4,000
4,500
5,000
2000 2001 2002 2003 2004 2005 2006 2007 2008 2009 2010 e 2011 f
in ´0
00 t
HC FeCrG.R.: 8.7%
Charge CrG.R.: 4.2%

Regional Demand Breakdown
40 Source: Heinz H. Pariser
China
South Africa Other
America
NAFTA EU
Taiwan
Japan
South Korea
-10
-5
0
5
10
15
20
25
30
35
40
45
0 20 40 60 80
Gro
wth
Rat
e 20
00 -
2009
in %
p.a
.
Share of FeCr Demand in %
Charge Cr Demand Structure2009
Av. Growth Rate: 4.2%
China
Others
South Korea
NAFTA
Japan
EUIndia
-10
0
10
20
30
40
50
60
0 20 40 60 80
Gro
wth
Rat
e 20
00 -
2009
in %
p.a
.
Share of FeCr Demand in %
HC FeCr Demand Structure 2009
Average Growth Rate: 8.9%

Characteristics of Charge / HC FeCr
41 Source: Heinz H. Pariser
High Carbon FeCr Charge Cr Wide range of usage in alloy steels, the foundry industry as well as for other materials – but also in stainless steel
Almost exclusively for stainless steel melting Application
Benefits
High Cr Content (typically 58%-70%); advantages when limited Cr input is required, where specific constraints exist for certain special steels – in particular with regards to trace elements such as Ti, V, P, Si, etc.
Low Cr Content (48%-58%), high (free) iron content, typically high Si content (2%-6%); competitive bulk product for mass production
Marketing Mainly direct sales to main stainless producers
Often sold indirectly via traders / distributors to numerous users
Logistics Large monthly shipments to end user warehouses
Supplies from local mostly in truck loads; consignment stocks
Contracts Annual contracts Annual contracts and spot sales
Price Leadership
South Africa Global Market
South Africa and Kazakhstan; often isolated local markets
Cr:C ratio 6.5:1
Cr:Si ratio 12:1
Cr:C ratio 9:1
Cr:Si ratio >100:1

Charge / HC FeCr Supply & Demand Balance
42 Source: Heinz H. Pariser
2006 2007 2008 2009 2010 2011
´000 t
Demand* 6,316 7,591 6,639 7,117 8,210 8,835
Supply - Cr Production 6,555 7,727 7,463 6,164 8,163 8,516 - Capacity 7,807 9,325 9,024 9,172 9,563 10,278 - Ut ilisat ion (in %) 84.0 82.9 82.7 67.2 85.4 82.9
Supply & Demand Balance 238 136 824 -954 -47 -319
Charge Cr Prices in $ / lb 0.70 0.91 1.76 0.85 1.24 1.76
*) excl. Consum er stocking 675 kt in 2008

Charge / HC FeCr Supply & Demand
43 Source: Heinz H. Pariser
400
600
800
1,000
1,200
1,400
1,600
1,800
2,000
2,200
2,400
in ´0
00 t
2007 2008 2009 2010 e
Demand
Actual Forecast
Supply
2006 2011 f

Power Supply
44 Source: Heinz H. Pariser
1. According to Escom, sufficient electricity will be available from 2013 onwards.
2. Industry sources believe that electricity demand will shortly thereafter exceed capacity again
3. Other power stations in Botswana are providing additional electricity.
With exception of the recently announced LION II expansion, no other FeCr capacity expansions in South Africa will take place in large scale within the next 3 years. The LION II expansion as well as lifted capacity restrictions after 2013 are expected to add 360 ktpy new and some 600 ktpy idled FeCr capacity.

Charge Cr Long-term Price Development
45 Source: Heinz H. Pariser
0.00
0.50
1.00
1.50
2.00
2.50
3.00
1970 1975 1980 1985 1990 1995 2000 2005 2010 2015 2020
in U
S$ /
lb
Deflated Prices 2009 US$
Nominal Prices
Realistic Price Forecast
(in 2009 US$)
Phase : IG.R. : -3.8%
II-1.4%
III-1.0%
IV+8.0%
V-3.2%
FeCr Production Cost

46 Source: Heinz H. Pariser
Any Questions?
47
Support for the Global Stainless Steel Industry

Chrome makes Stainless Stainless
48 Source: Steel Manual / Heinz H. Pariser
Stainless Steels
are alloyed steel grades with a carbon mass fraction of 1.2% or less, and 10.5% Cr or more, with or without other elements.
Environment
Stainless Steel
O O
O
O OO O
OO
O
Cr
Cr CrCr
Cr
Cr

Stainless Steels – More than 200 Different Grades (but all with Cr)
49 Source: Heinz H. Pariser
Ferritic X 5 CrTi 12 4 („409“- 12% Cr)
% Cr
10.5%-
30.0%
Ø Cr: 17.0%
Typical Grades Applications
Automotive exhaust system
MartensiticX 20 Cr 13 („420“- 13% Cr)
Cutlery, needlevalves, nozzles
Austenitic / CrMnX 5 CrNi 18 9 („304“- 18% Cr) „General Purpose“
Architecture, food processing, deep drawing
X 12 CrMnNiN 18 9 5 („202“- 18% Cr)
DuplexX 2 CrNiMoN 22 5 3 („2205“- 22% Cr) Process industry,
Desalination plants,Flue-gas Cleaning

Typical Stainless Grades
50 Source: Heinz H. Pariser
Austenitic CrMn Ferritic Duplex
"Superaustenitics" "Superferritics" "Superduplex"
Chemical Composition
301 17Cr; 7Ni
304 18.5Cr; 8Ni
31618Cr; 11Ni;
2Mo
904 L23Cr; 25Ni;
4.3Mo
201 17Cr; 3.5Ni;
6Mn
20218Cr; 4Ni;
8Mn
India/China200 series
~16Cr; 9Mn;<2Ni
43017Cr
40911.5Cr; 0.25Ti
44418.5Cr; 1.5Mo
0.45Ti
"LDX 2101"21.5Cr; 1.5Ni;5Mn; 0.3Mo
220522Cr; 5.7Ni;
3.1Mo
250725Cr; 7Ni
4Mo

Stainless Steel in the Global Steel Environment
51 Source: Heinz H. Pariser
Stainless Steel Production
2.4%
Crude Steel Production
97.6%
Steel Production 2009
1,925 1,618 2,333 2,382
7,8285,974
7,411 7,663
7,344 9,751
11,258 12,010
3,564 2,607
3,3403,3504,458 4,811
5,6165,897
1,298 1,210
1,2621,349
Stainless Steel Production
OthersAsiaJapanChinaEU 27USA
26,418 25,971
31,220
2008 2010e2009 2011f
32,652

Global Stainless Steel End Use - 2009
52 Source: Heinz H. Pariser
5.8%
6.8%
11.6%
12.9%
17.2%
22.1%
23.6%
Non-Allocated
Electromechanical & Electronic Products
Transport(incl. Automotive)
Tubular Products
Building & Construction
Metal Goods
Engineering

Stainless Steel Melting
53 Source: Heinz H. Pariser
2008 2009 2010 e 2011 f Change 11/10
in %
USA 1,925 1,618 2,333 2,382 2.1Brazil 557 482 507 528 4.2European Union 7,828 5,974 7,411 7,663 3.4Other Europe 213 140 197 210 6.5Japan 3,564 2,607 3,340 3,350 0.3S. Korea/Taiwan 2,914 3,121 3,605 3,717 3.1S. Africa 529 588 558 611 9.5
Subtotal 17,530 14,530 17,951 18,462 2.8
China 7,344 9,751 11,258 12,010 6.7India 1,544 1,690 2,011 2,180 8.4
Subtotal 8,888 11,441 13,269 14,190 6.9
Total 26,418 25,971 31,220 32,652 4.6
in ´000 t

Global Stainless Melting – Since 1950
54 Source: Heinz H. Pariser
0.0
10.0
20.0
30.0
40.0
1950 1955 1960 1965 1970 1975 1980 1985 1990 1995 2000 2005 2010
in M
ill t
Post-War Reconstruction Crisis Years StSt Boom I:Japan, Taiwan,S. Korea
East
ern
Euro
pe
Tran
sitio
n StSt Boom II:Europe, USA
ChinaMarketEntrance
AOD / VODRefining
ContinuosCasting
Phase : IG.R. : +8.1%
II+2.9%
III+7.8%
IV-0.7%
V+7.0%
VI+0.9%
VII+5.3%
Stainless Steel Melting ProductionG.R. 50 - 10: 5.7%
Charge / HC FeCr Consumption
G.R. 70 - 10: 4.0%

Typical Material Charge for 304 Stainless
55 Source: Heinz H. Pariser
Stainless scrap
Carbon steel scrap
(C-scrap) Nickel Other alloys
Ferrochrome Charge Cr HC FeCr LC FeCr
Electric arc furnace melting 165kg
Trimming & refining AOD / VOD(1)
180kg
80kg
4kg
70kg 15kg 10kg
1kg
Continuous casting 180kg
Slabs / billets 180kg
Cr input in kg Cr units
(yield losses ignored)
53% Primary Cr Units 47% Stainless Scrap

Stainless Steel – Made of Scrap?
56 Source: Outokumpu Oy Annual report, Heinz H. Pariser
Stainless Melting
Outokumpu´s
Raw Material Mix between 2005 - 2009
Primary Metals 22.8 - 31.5%
Internal Scrap 20.1 – 20.6%
External Scrap 47.9 – 57.1%
Total Scrap Input 68.0 – 77.7%
Primary Metals
External Scrap
Internal Scrap

South Africa‘s FeCr Position in Main Stainless Countries
57 Source: Heinz H. Pariser
0
22
33
41
69
0
43
60
55
139
China
USA
Japan
Asia
EU27
50.3%
49.4%
56.1%
74.3%
2000 2010
Total
South Africa
FeCr Imports in ´000 t per Month
South Africa Average 55.5% South Africa Average 56.9%
25
30
61
74
96
44
61
81
148
172
48.8%
56.0%
75.6%
49.9%
57.1%

Charge / HC FeCr Imports
58 Source: Heinz H. Pariser
0
10
20
30
40
50
60
70
80
90
100
0
100
200
300
400
500
600
2000 2001 2002 2003 2004 2005 2006 2007 2008 2009 2010
Share in %in
´000
t pe
r Mon
th
Total Charge / HC FeCr Importsby Stainless Producing Countries
G.R.: 5.3%
Supplies from South AfricaG.R.: 4.6%

Stainless Steel Substitution Process – Substitution Trigger
59 Source: Heinz H. Pariser
50.0
55.0
60.0
65.0
70.0
75.0
80.0
5
10
15
20
25
30
35
40
45
50
Austenitic Ratio in %
LME
Ni P
rice
in ´0
00 U
S$/t
Ni Price
SS Austenitic Ratio
2000 2001 2002 2003 2004 2005 2006 2007
23.7Ferritics
CrMn
22.7 22.0 22.9 23.0 24.6 23.5 25.6
3.8 5.3 5.3 6.9 10.2 11.5 11.1 14.3
Ratios of:
2008
24.8
14.7
2009
15.9
26.4
15.8
28.0
2010 2011
28.2
16.0

Substitution Potential: Chrome vs. Nickel
60 Source: Heinz H. Pariser
End Use of Chrome Units
Substitution Potential End Use of Nickel Units
Substitution Potential
in % in %
Stainless Steel 65 59300 29 Not Replaceable 56 Yes, Int ernal Subst it ut ion400 24 0 bet ween St ainless Grades200 12 3
Alloy Steels 30 Limit ed Subst it ut ion 7 Limit ed Subst it ut ion
Ni-Base Alloys 1 Not Replaceable 12 Wide Range of Subst it ut es incl. Cu-Alloys,Ceramics, High Grade St ainless St eel
Cu-Base Alloys 0 1 Not Relevant
Plating 0 11 High Subst it ut ion Risk! Decorat ive Usage
Foundry 3 Limit ed Subst it ut ion 3 St ainless Scrap
Others 1 6
Total 100 100

Summary Substitution in Stainless
61 Source: Heinz H. Pariser
• Chrome is irreplacable: No Chrome – No Stainless!
• High nickel prices trigger substitution,
• But with China‘s growing stainless market – the global product mix has changed as well!
• Growing expansion of either ferritics or duplex will push ferrochrome demand, aided by low scrap input.
• E.g.: a 10% increase in ferritics (from 28% to 31% production share) would result in a 75 kt FeCr demand increase

Stainless Price Competitiveness
62
0
50
100
150
200
250
1967 1972 1977 1982 1987 1992 1997 2002 2007
in In
dex
Poin
ts
304 (18% Cr, 8% Ni)
430 (18% Cr)
*) Base Germany
Index 1967 =100 Source: Heinz H. Pariser200991.6
173.4161.9184.6233.0
430 SS CRNon FerrousPlasticAluminiumIron & Steel
2008137.7 197.5178.9200.3313.5
2010 (1-8) 118.6214.7166.8191.0251.6

Intrinsic Element Value in Stainless Prices
63 Source: Heinz H. Pariser
22.6
0.0
5.0
10.0
15.0
20.0
25.0
30.0
35.0
2000
2001
2002
2003
2004
2005
2006
2007
2008
2009
2010
Intri
nsic
Val
ue, i
n %
Grade 430 (18% Cr)
Chrome
Basis: Effective German Trader PriceCold Rolled Sheet, 2mm
DB/StSt Prices 304_316
75.9
19.0
0.0
10.0
20.0
30.0
40.0
50.0
60.0
70.0
80.0
2000
2001
2002
2003
2004
2005
2006
2007
2008
2009
2010
Intri
nsic
Val
ue, i
n %
Grade 304 (18% Cr, 8% Ni)
Nickel
Chrome
Basis: Effective German Trader Price Cold Rolled Sheet, 2mm
DB/StSt Prices 304_316

64 Source: Heinz H. Pariser
Any Questions?

65
Nickel – the “Be-devilled” Metal

Long-Term Historic Nickel Price Development
66 Source: Heinz H. Pariser
0
10,000
20,000
30,000
40,000
50,000
60,000
70,000
80,000
1950 1960 1970 1980 1990 2000 2010 2020
in U
S$ /
t
Nickel Price Crises I
LME NickelContract
Nickel Price Crises III
Nic
kel P
rice
Cris
es II
Nickel PriceNominal
Nickel PriceDeflated
23,200 US$/t
15,500 US$/t
19,400 US$/t

Chrome vs Nickel – A First Use Comparison (Basis: 2009 First Use Data)
67 Source: Heinz H. Pariser
4.5% p.a.
-0.6 % p.a.
4.0% p.a.
4.2% p.a.
1.7% p.a.
2.7% p.a.
Chr
ome
Nic
kel
in Stainless Steel in Other Applications in Alloy Steel
033.7 70.5 4.4 60.1 25.1
6.2

Stainless Driving Nickel Demand
68 Source: Heinz H. Pariser
0.0
100.0
200.0
300.0
400.0
500.0
600.0
700.0
800.0
900.0
1960
1965
1970
1975
1980
1985
1990
1995
2000
2005
2010
in 0
00 t
First Use of Nickel
Stainless SteelG.R.: 4.9 %
Non-Stainless ApplicationG.R.: 2.2 %
Stainless Steel59%
Alloy Steel8%
Ni Base10%
Cu Base1%
Plating11%
Foundry4%
Batteries & Others
7%
2009 p

Primary Nickel Consumption – 2006 to 2011
69 Source: Heinz H. Pariser
847 755 722 651 746 744
3748 43
4860 62
517520 521 543
622 718
0
200
400
600
800
1,000
1,200
1,400
1,600
1,800
2006 2007 2008 2009 2010 2011
in ´0
00 t
All Other Applications
CrNi SS(8.5%)
Low Ni CrMn(1.5%)
1,4011,323 1,287
1,242
1,428
Actual Forecast
+6.8
%
+ 15
.0%
1,525

Regional Nickel Consumption Breakdown 2009
70 Source: Heinz H. Pariser
China / Hong Kong
Australasia
Other Euorpe AfricaAmerica EU 27 JapanAsia
-5
0
5
10
15
20
25
30
0 20 40 60 80
Gro
wth
Rat
e 20
00 -
2009
in %
p.a
.
Share of Ni Consumption in %
Average Growth Rate: 1.8%
1,000
1,100
1,200
1,300
1,400
1,500
2000
2001
2002
2003
2004
2005
2006
2007
2008
2009
in ´0
00 t
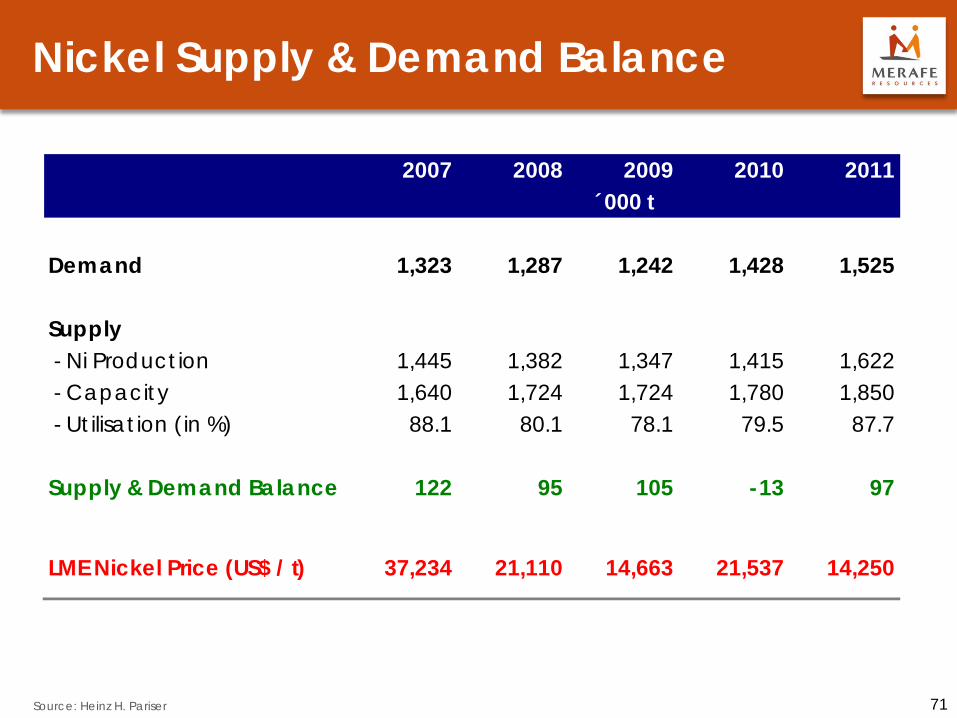
Nickel Supply & Demand Balance
71 Source: Heinz H. Pariser
2007 2008 2009 2010 2011
Demand 1,323 1,287 1,242 1,428 1,525
Supply - Ni Production 1,445 1,382 1,347 1,415 1,622 - Capacity 1,640 1,724 1,724 1,780 1,850 - Ut ilisat ion (in %) 88.1 80.1 78.1 79.5 87.7
Supply & Demand Balance 122 95 105 -13 97
LME Nickel Price (US$ / t) 37,234 21,110 14,663 21,537
´000 t
14,250

72 Source: Heinz H. Pariser
Any Questions?
73
Stainless Scrap – The Strongest Competitor

Stainless Scrap Cycles
74 Source: Heinz H. Pariser
T I M E
Internal Scrap External ScrapBlend
Material
Influencing Factors
Recycling Time
Recycling Ratio
Stainless Production Stainless Consumption Historical Stainless and AlloyConsumption, Nickel Price
3 days – 3 months Approx. 6 months 15 – 20 years
Approx .100 % Approx. 100% 60 – 80%
Stainless Scrap Availability
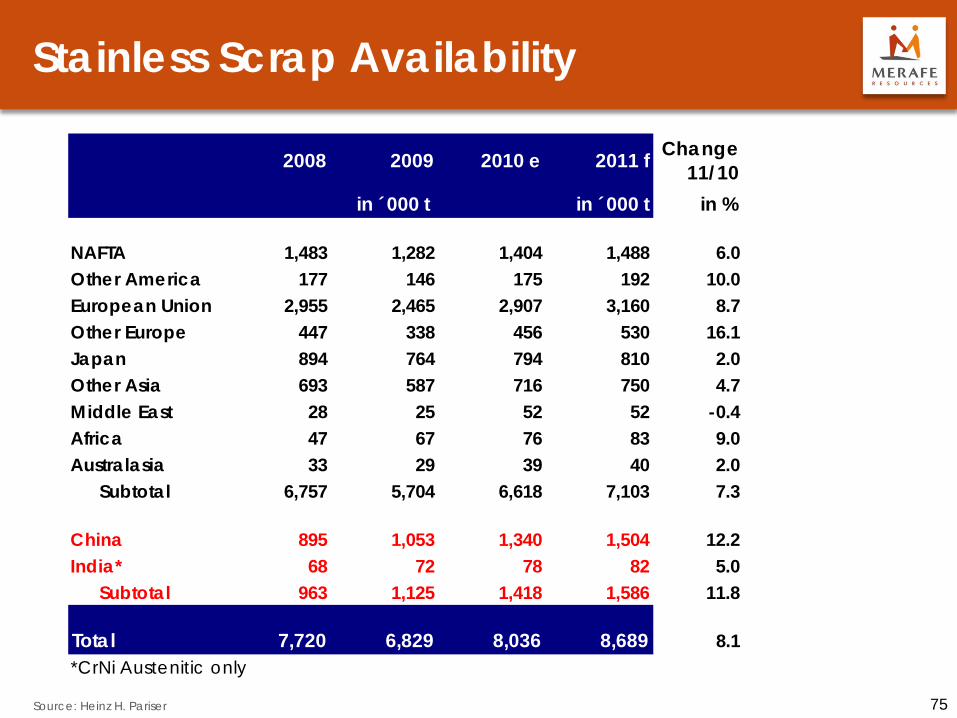
75 Source: Heinz H. Pariser
2008 2009 2010 e 2011 f Change11/10
in ´000 t in %
NAFTA 1,483 1,282 1,404 1,488 6.0Other America 177 146 175 192 10.0European Union 2,955 2,465 2,907 3,160 8.7Other Europe 447 338 456 530 16.1Japan 894 764 794 810 2.0Other Asia 693 587 716 750 4.7Middle East 28 25 52 52 -0.4Africa 47 67 76 83 9.0Australasia 33 29 39 40 2.0
Subtotal 6,757 5,704 6,618 7,103 7.3
China 895 1,053 1,340 1,504 12.2India* 68 72 78 82 5.0
Subtotal 963 1,125 1,418 1,586 11.8
Total 7,720 6,829 8,036 8,689 8.1*CrNi Austenitic only
in ´000 t

Scrap Availability – Dependency on Nickel
76 Source: Heinz H. Pariser
0.00
5.00
10.00
15.00
20.00
25.00
1,200
1,400
1,600
1,800
2,000
2,200
2,400
2,600
2006 2007 2008 2009 2010e 2011f
LME C
ash Nickel Price, US$/lb
Scra
p A
vaila
bilit
y, '0
00 t
Scrap AvailabilitySource: Heinz H. Pariser
LME Cash Nickel Price

Long-term Global Scrap Reserve
77 Source: Heinz H. Pariser
0.0
100.0
200.0
300.0
400.0
500.0
600.0
1970 1975 1980 1985 1990 1995 2000 2005 2010 2015 2020
in M
ill t
1980 2000 2009 2010 2020in Mill t
Cum. Aust. Consumption 66.1 208.1 322.2 338.2 560.4Cum. Scrap Consumption 20.2 92.0 159.1 169.1 303.3Scrap Reserve 45.9 116.1 163.1 169.1 257.2
Cum. Scrap Consumption
Cum. Aust. Consumption
Scrap Reserve

Product Mix Defining Scrap Input
78 Source: Heinz H. Pariser
External Stainless Scrap Consumption(Ratio in %)
MIN MAXGlobal Average
42.2300 Series China27.6
USA74.4
10.1200 SeriesChina
8.5USA, EU, Japan25.0
4.5400 SeriesChina
5.0India10.0
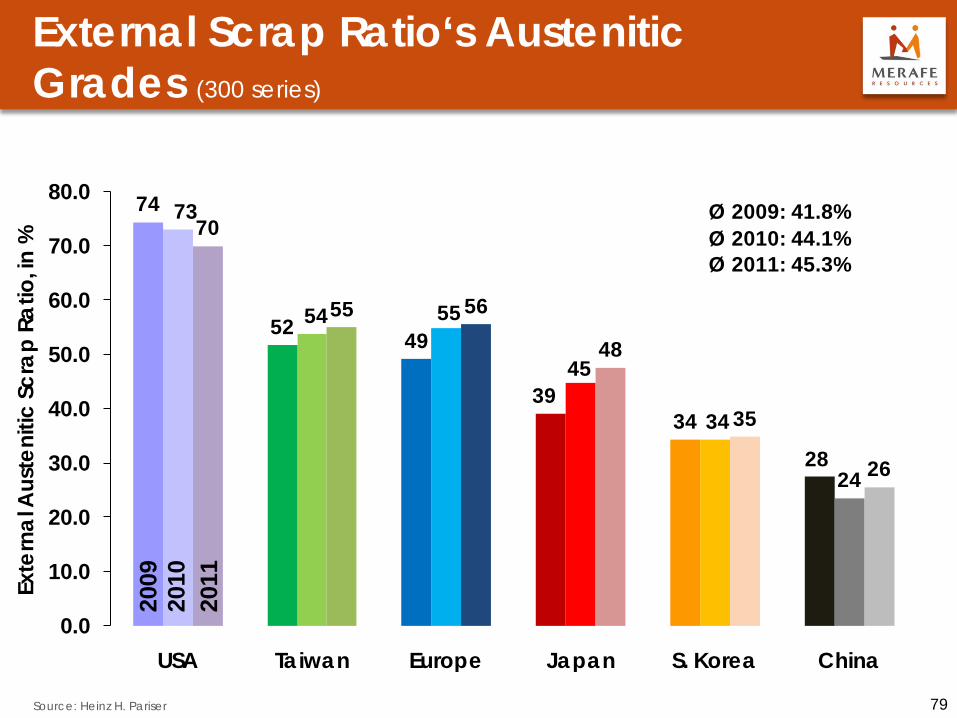
External Scrap Ratio‘s Austenitic Grades (300 series)
79 Source: Heinz H. Pariser
74
52 49
3934
28
73
54 55
45
34
24
70
55 56
48
35
26
0.0
10.0
20.0
30.0
40.0
50.0
60.0
70.0
80.0
USA Taiwan Europe Japan S. Korea China
Exte
rnal
Aus
teni
tic S
crap
Rat
io, in
%
2009
2010
Ø 2009: 41.8%Ø 2010: 44.1%Ø 2011: 45.3%
2011
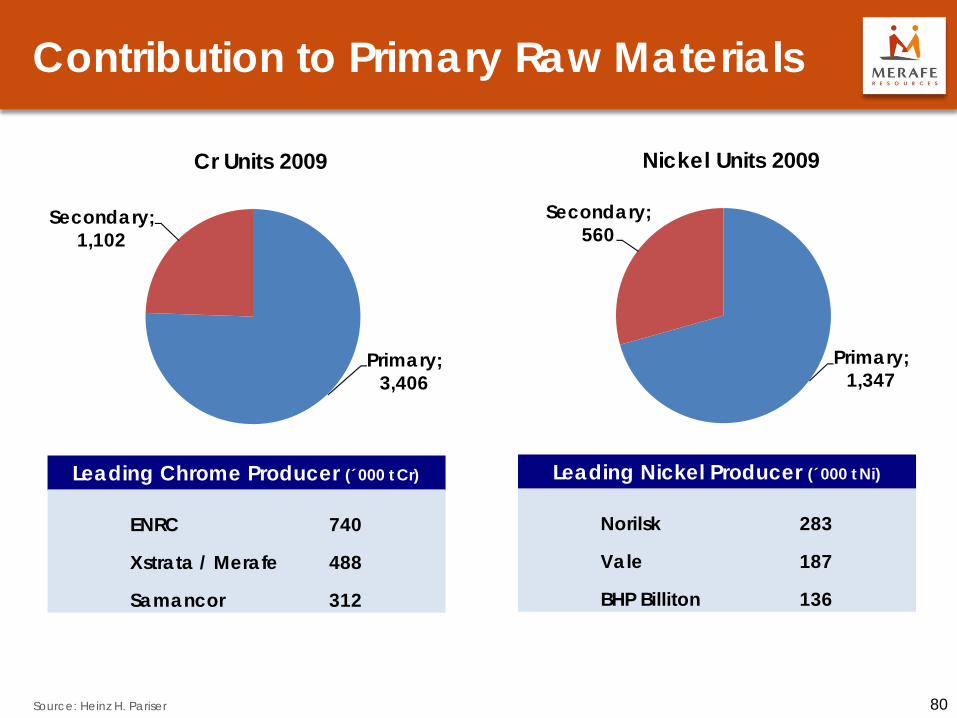
Contribution to Primary Raw Materials
80 Source: Heinz H. Pariser
ENRC 740
Xstrata / Merafe 488
Samancor 312
Leading Chrome Producer (´000 t Cr)
Primary; 3,406
Secondary; 1,102
Cr Units 2009
Norilsk 283
Vale 187
BHP Billiton 136
Leading Nickel Producer (´000 t Ni)
Primary; 1,347
Secondary; 560
Nickel Units 2009

Ni Units in External Stainless Scrap
81 Source: Heinz H. Pariser
2006 2007 2008 2009 2010e 2011fNi Units in ´000 t 707 652 633 560 659 712
350
400
450
500
550
600
650
700
750in
000
t N
i Con
tent
+ 14.5%
- 7.9%- 2.9%
- 11.5%
+ 17.7%
+ 8.1%

Cr Units in External Stainless Scrap
82 Source: Heinz H. Pariser
2006 2007 2008 2009 2010e 2011fCr Units in ´000 t 1,368 1,321 1,234 1,102 1,339 1,457
800
900
1,000
1,100
1,200
1,300
1,400
1,500in
000
t C
r Con
tent
+ 13.9%- 3.5%
- 6.6%
- 10.6%
+ 21.4%
+ 8.9%

Cr Units in External Stainless Scrap
83 Source: Heinz H. Pariser
0
1,000
2,000
3,000
4,000
5,000
6,000
1990
1992
1994
1996
1998
2000
2002
2004
2006
2008
2010
e
in 0
00 t
Cr C
onte
nt
Cr Requirement inStainless Steel - Total
Cr Requirements inStainless Steel
Cr Units from Cr in Scrap
0
200
400
600
800
1,000
1,200
1,400
1,600
1,800
2,000
1990
1992
1994
1996
1998
2000
2002
2004
2006
2008
2010
e
in 0
00 t
Cr C
onte
nt
Cr Requirement inStainless Steel - China
Cr Requirements inStainless Steel
Cr Units from Cr in Scrap

Element Valuation in Stainless Scrap
84 Source: Heinz H. Pariser
40
50
60
70
80
90
100
110
2006 2007 2008 2009 2010
Valu
atio
n re
lativ
e to
Ref
eren
cepr
ice,
in % Referenceprice
Nickel
ChromeMolybdenum
Scrap offers discounts… … but Ni is the main
determinant (e.g. grade 304 type scrap)
74.0%
9.0%
18.0%
19.4%
8.0%
71.7%
quantity in kg
valuein US$
NiCrFe
Staus: September 2010

Chrome Valuation in Scrap vs. SA Producer Price
85 Source: Heinz H. Pariser
0.0
5.0
10.0
15.0
20.0
25.0
30.0
35.0
40.0
45.0
50.0
0.00
0.50
1.00
1.50
2.00
2.50
Cr in Scrap Discount, in %
Pric
es in
US$
/ lb
Charge Chrome South African
Producer PriceChromein Scrap
2000 2010200920082007200620052004200320022001

86 Source: Heinz H. Pariser
Any Questions?

87
The Way Forward – Opportunities & Obstacles

China‘s Position in Stainless & Related Raw Materials 2000 vs 2009
88 Source: Heinz H. Pariser
2.9 4.71.3
6.0 5.17.6 5.5
8.03.7 2.2
37.5
20.0
1.2
24.5
15.4
42.437.9
33.5
48.9
22.3
Stainless Steel
Nickel Chrome Ore
Chrome Stainless Scrap
Stainless Steel
Nickel Chrome Ore
Chrome Stainless Scrap
Share in %
2000 2009
Production Consumption
DB

Stainless Steel Intensity in the Year 2000 Cold Rolled Flat Products
89 Source: Heinz H. Pariser
NAFTA
EU 27
Turkey
Other Europe
Japan
China
Taiwan
India
South Korea
Other Asia Middle East
Africa Australasia
South America
-5
0
5
10
15
20
25
0 1 10 100 1,000
Con
sum
ptio
n pe
r Cap
ita in
kg
PPP per Capita in 000 US$ (Logarithmic Scale)
Newly IndustrializedAsian Economies
Advanced Economies
Emerging Markets
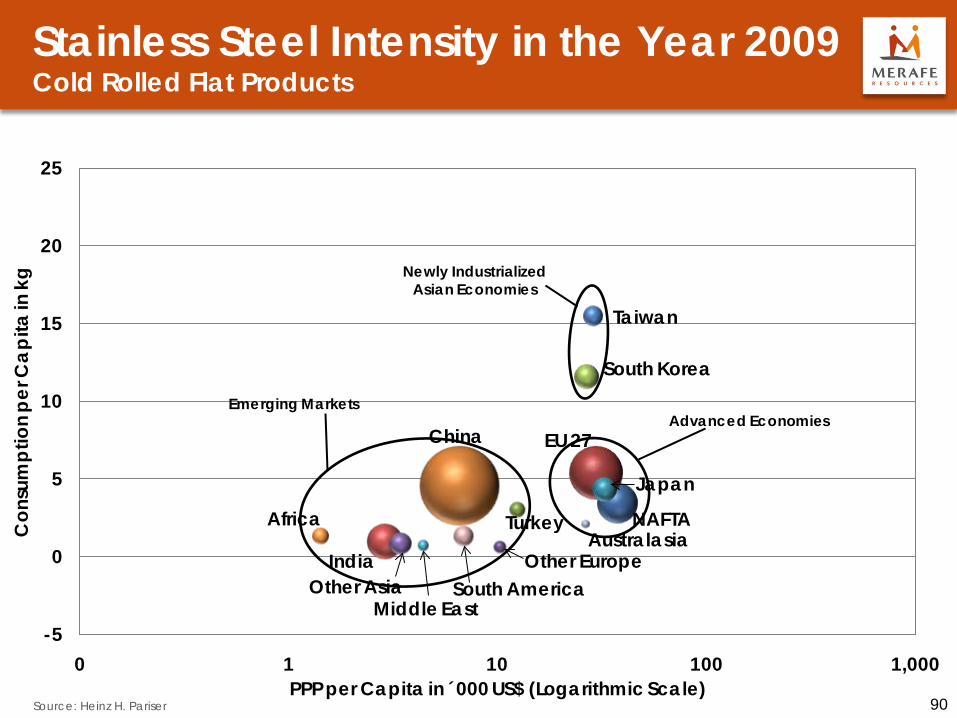
Stainless Steel Intensity in the Year 2009 Cold Rolled Flat Products
90 Source: Heinz H. Pariser
NAFTA
EU 27
Turkey
Other Europe
Japan
China
Taiwan
India
South Korea
Other AsiaMiddle East
AfricaAustralasia
South America
-5
0
5
10
15
20
25
0 1 10 100 1,000
Con
sum
ptio
n pe
r Cap
ita in
kg
PPP per Capita in 000 US$ (Logarithmic Scale)
Newly IndustrializedAsian Economies
Advanced EconomiesEmerging Markets

Stainless Steel Intensity in the Year 2020 Cold Rolled Flat Products
91 Source: Heinz H. Pariser
NAFTA
EU 27
Turkey
Other Europe
JapanChina
Taiwan
India
South Korea
Other AsiaMiddle East
Africa Australasia
South America
-5
0
5
10
15
20
25
0 1 10 100 1,000
Con
sum
ptio
n pe
r Cap
ita in
kg
PPP per Capita in 000 US$ (Logarithmic Scale)
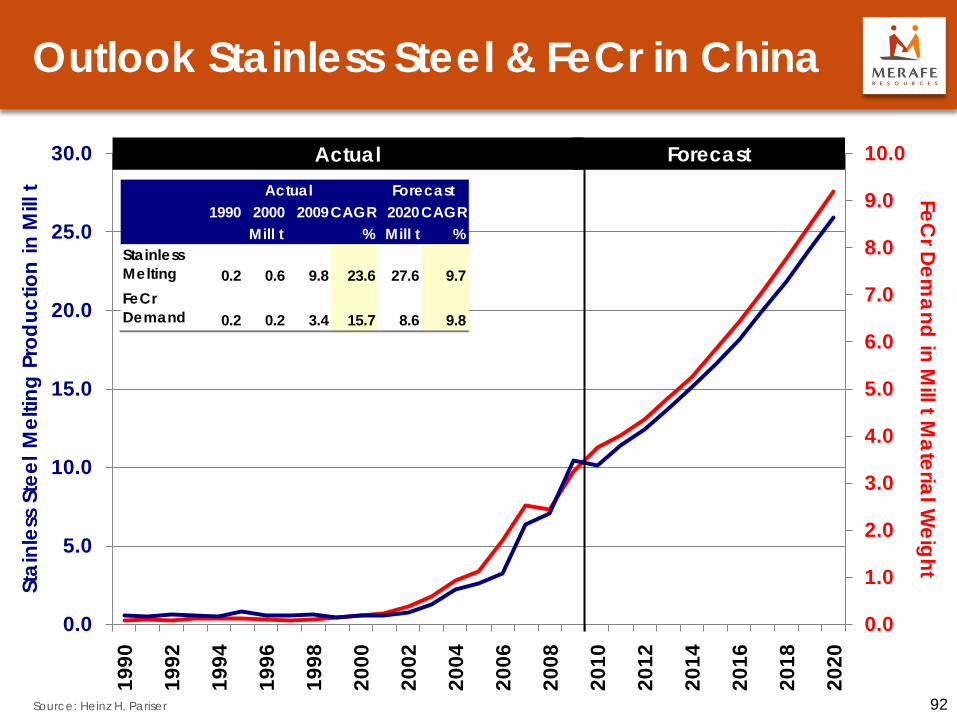
Outlook Stainless Steel & FeCr in China
92 Source: Heinz H. Pariser
0.0
1.0
2.0
3.0
4.0
5.0
6.0
7.0
8.0
9.0
10.0
0.0
5.0
10.0
15.0
20.0
25.0
30.019
90
1992
1994
1996
1998
2000
2002
2004
2006
2008
2010
2012
2014
2016
2018
2020
FeCr Dem
and in Mill t M
aterial Weight
Stai
nles
s St
eel M
eltin
g Pr
oduc
tion
in M
ill t
Actual Forecast
1990 2000 2009CAGR 2020CAGR% Mill t %
StainlessMelting 0.2 0.6 9.8 23.6 27.6 9.7FeCrDemand 0.2 0.2 3.4 15.7 8.6 9.8
Actual Forecast
Mill t

China‘s Challenges (1)
93 Source: Heinz H. Pariser
1. It appears that China’s Stainless Steel Market might not reach saturation before 2025.
2. Stainless Steel Demand is expected to increase from presently 7.1 kg /capita to almost 20 kg / capita by 2020 as rural areas are further developed.
3. Crude Stainless Output might subsequently increase by 20 Mill t from presently 9.7 Mill t to 27 Mill t.
4. As China has no intention to intensify (stainless) scrap recycling, ferrochrome requirement might expand parallel to stainless melting, which means FeCr demand will increase from 3.5 Mill t material weight to 8.7 Mill t.
China‘s Challenges (2)
94 Source: Heinz H. Pariser
During the past decade China has rapidly expanded FeCr production on the basis of imported Cr ore. It is questionable whether this can be maintained in future if the following aspects are considered.
1. China’s National Development & Reform Commission (NDRC) is already controlling energy usage, keeping the official reduction of carbon dioxide emission by 40-45% below the 2005 values in mind.
2. During Q3 2010 NDRC has already taken action against 13 of the 31 provinces which had over proportionally energy usage and numerous plants of the iron & steel industry, the ferroalloy industry and the cement industry have been cut off from electricity supply.
3. Pollution is becoming a major concern in China as well and it is the declared policy to reduce emissions. China’s numerous small and often outdated FeCr smelters account for approx. 80% of the country’s ferroalloy output. There is no doubt that also FeCr production in the country is under threat and probably not sustainable.

China‘s Challenges (3)
95 Source: Heinz H. Pariser
4. On the other hand, countries providing Cr ore to China’s FeCr converters are taking a more and more critical stand vs. exports of unprocessed vital raw materials such as Nickel and Chrome
5. South Africa might well benefit from this development provided electricity
availability would be rapidly expanded and triggering expansions of FeCr production facilities.
6. If in the 2009 depression year South Africa had provided China with the same volume of Cr units (1,350 kt) in form of FeCr rather than Cr ore, additional export revenues of more than US$ 2.1 Bill would have been generated. In addition the impact on employment would have resulted in an increase of 77 % or at least 9,500 employees.
96
India – Opportunity or Threat?

India – Stainless Steel & FeCr Demand
97 Source: Heinz H. Pariser
0.0
0.2
0.4
0.6
0.8
1.0
1.2
0.0
0.5
1.0
1.5
2.0
2.5
3.0
3.5
4.0
4.519
90
1992
1994
1996
1998
2000
2002
2004
2006
2008
2010
2012
2014
2016
2018
2020
FeCr Dem
and in Mill t M
aterial Weight
Stai
nles
s St
eel M
eltin
g Pr
oduc
tion
in M
ill t
Actual Forecast
CAGR:7.5%
CAGR:7.6%
CAGR:12.2%
CAGR:7.2%

India – FeCr Production & Demand
98 Source: Heinz H. Pariser
0.0
0.2
0.4
0.6
0.8
1.0
1.2
1.4
1.6
1.8
2.0
0.0
0.2
0.4
0.6
0.8
1.0
1.219
90
1992
1994
1996
1998
2000
2002
2004
2006
2008
2010
2012
2014
2016
2018
2020
FeCr Dem
and in Mill t M
aterial Weight
FeC
r Pro
duct
ion
in M
ill t M
ater
ial W
eigh
t
Actual Forecast
CAGR:7.5%
CAGR:7.6%
CAGR:7.6%
CAGR:7.2%

India – Opportunity or Threat?
99 Source: Heinz H. Pariser
1. India’s Cr Ore reserves are of high quality – but very limited. Subsequently, the Government wants to protect these and has imposed export restrictions and an export tax.
2. India is the third largest exporter of FeCr after South Africa and Kazakhstan. In 2009, the export ratio of FeCr was as high as 72.6%.
3. At the same time, domestic FeCr requirement will be strongly increasing as major stainless steel expansions are under way.
4. Since 2004, India is a regular importer of Cr ore; import volumes reached in 2008 a record volume of 122 kt, but declined last year to 57 kt. Main supply sources include UAE and Oman; South Africa plays a minor role.
5. With sufficient electricity availability, South Africa might be well positioned to provide India not only with Cr ore but also FeCr.

100
Stainless Steel – Old concepts renewed?

Changing Stainless Market Leadership…
101 Source: Heinz H. Pariser
… Changing (Raw Material) Strategies Region Scrap
AvailabilityScrap Input
RatioScrap Trade Interest in
PrimaryMetals
United States High High Exports Very low
Japan Sufficient Medium Exports Backward integrated
EU High Above average Large Exports Minimal
China Low Low High ImportsContinuing
Investments in Cr & Ni
1950 1960 1970 1980 1990 2000 2010
United States Japan EU China

RoW - Stainless Steel Old Concepts Renewed?
102 Source: Heinz H. Pariser
0.0
1.0
2.0
3.0
4.0
5.0
6.0
7.0
0.0
5.0
10.0
15.0
20.0
25.019
90
1992
1994
1996
1998
2000
2002
2004
2006
2008
2010
2012
2014
2016
2018
2020
FeCr Dem
and in Mill t M
aterial Weight
Stai
nles
s St
eel M
eltin
g Pr
oduc
tion
in M
ill t
Actual Forecast
CAGR:3.5%
CAGR:3.7%
CAGR:2.6%
CAGR:2.1%

Stainless Steel Old Concepts Renewed?
103 Source: Heinz H. Pariser
1. Underlying desire to further consolidation in Europe (ArcelorMittal; ThyssenKrupp Stainless)
2. Phasing out high of nickel containing stainless grades favors primary chrome requirements for ferritic stainless steels.
3. Subsequently primary Cr units will benefit from the changing product mix
4. Cr requirements outside China and India are expected to expand from 3.3 Mill t last year to 5.5 Mill t by 2020 (CAGR 2.3%)

104
Conclusions

Conclusion
105 Source: Heinz H. Pariser
1. South Africa has the largest Cr reserves and accounts presently for half of the global Cr ore supply. Ore availability is further supported through mining of UG2 platinum containing ores. Due to lack of electricity, this wealth is not fully utilised for a few years now.
2. China has become the World’s largest stainless steel producer for which substantial volumes of Cr are needed. The country is presently meeting some 40% of the requirement through converting imported Cr ore into FeCr while almost 60% are covered through imports of FeCr. As China’s policy aims at reducing energy usage and pollution drastically, South Africa is well positioned to meet the needs as soon as sufficient electricity is available.

Conclusion
106 Source: Heinz H. Pariser
3. India is in a similar situation as stainless demand and production expands rapidly. High grade Cr reserves are limited and India has already undertaken counteractions by imposing export restrictions as well as an export tax and noteworthy volumes of Cr ore are meanwhile imported from Middle East countries. Opportunities exist for South Africa to participate in this market development either through Cr ore or preferably with FeCr supply.
4. Stainless demand and production in all other markets continues growing but at a slower pace than in the past. These markets in America, Europe, Japan and Asia are already well covered by South Africa and it is assumed that the present position will be maintained.
5. In conclusion: South Africa enjoys excellent opportunities for its Cr industry, but substantial investments in electricity supply are needed to harvest the country’s wealth and recover its dominant market position.

107 Source: Heinz H. Pariser
Any Questions?

108 Source: Heinz H. Pariser
Contact Details
Heinz H. Pariser Heinz H. Pariser Alloy Metals & Steel Market Research Scharnstr. 51 46509 Xanten Germany Tel.: +49 2801 77 11 0 Email: [email protected] You are always welcome to contact us.