A monitoring program for Patagonian foxes based on … · (Pseudalopex griseus) are heavily culled...
14
HAL Id: hal-00535264 https://hal.archives-ouvertes.fr/hal-00535264 Submitted on 11 Nov 2010 HAL is a multi-disciplinary open access archive for the deposit and dissemination of sci- entific research documents, whether they are pub- lished or not. The documents may come from teaching and research institutions in France or abroad, or from public or private research centers. L’archive ouverte pluridisciplinaire HAL, est destinée au dépôt et à la diffusion de documents scientifiques de niveau recherche, publiés ou non, émanant des établissements d’enseignement et de recherche français ou étrangers, des laboratoires publics ou privés. A monitoring program for Patagonian foxes based on power analysis Alejandro Travaini, Alejandro Rodríguez, Diego Procopio, Sonia C. Zapata, Juan I. Zanón, Rolando Martínez-Peck To cite this version: Alejandro Travaini, Alejandro Rodríguez, Diego Procopio, Sonia C. Zapata, Juan I. Zanón, et al.. A monitoring program for Patagonian foxes based on power analysis. European Journal of Wildlife Research, Springer Verlag, 2009, 56 (3), pp.421-433. <10.1007/s10344-009-0337-5>. <hal-00535264>
Transcript of A monitoring program for Patagonian foxes based on … · (Pseudalopex griseus) are heavily culled...
HAL Id: hal-00535264https://hal.archives-ouvertes.fr/hal-00535264
Submitted on 11 Nov 2010
HAL is a multi-disciplinary open accessarchive for the deposit and dissemination of sci-entific research documents, whether they are pub-lished or not. The documents may come fromteaching and research institutions in France orabroad, or from public or private research centers.
L’archive ouverte pluridisciplinaire HAL, estdestinée au dépôt et à la diffusion de documentsscientifiques de niveau recherche, publiés ou non,émanant des établissements d’enseignement et derecherche français ou étrangers, des laboratoirespublics ou privés.
A monitoring program for Patagonian foxes based onpower analysis
Alejandro Travaini, Alejandro Rodríguez, Diego Procopio, Sonia C. Zapata,Juan I. Zanón, Rolando Martínez-Peck
To cite this version:Alejandro Travaini, Alejandro Rodríguez, Diego Procopio, Sonia C. Zapata, Juan I. Zanón, et al..A monitoring program for Patagonian foxes based on power analysis. European Journal of WildlifeResearch, Springer Verlag, 2009, 56 (3), pp.421-433. <10.1007/s10344-009-0337-5>. <hal-00535264>
ORIGINAL PAPER
A monitoring program for Patagonian foxes based on poweranalysis
Alejandro Travaini & Alejandro Rodríguez &
Diego Procopio & Sonia C. Zapata & Juan I. Zanón &
Rolando Martínez-Peck
Received: 3 July 2009 /Revised: 22 September 2009 /Accepted: 1 October 2009 /Published online: 15 October 2009# Springer-Verlag 2009
Abstract Culpeo fox (Pseudalopex culpaeus) and gray fox(Pseudalopex griseus) are heavily culled in Patagonia. Foxpopulations seem to persist thanks to spatial refuges fromwhich hunted areas are repopulated, following a source–sink dynamics. Sustainable use of Patagonian foxeswarrants the design of a monitoring program in naturereserves and areas subjected to predator control. During7 years, we used visitation indices to bait stations in anational park and neighboring sheep ranches of southernArgentina. We operated bait stations during three consec-utive nights and calculated seven indices of relativeabundance. For each fox species, we compared the powerof different monitoring designs and scenarios that combinedvisitation indices, effort (number of bait station lines andsurvey frequency) while controlling for type I error, andmagnitude of population change during a given period. Welooked at the combinations that produced high power(β≤0.24). The operation of bait stations during severalnights markedly increased statistical power. Index 7(recording visits 72 h after activation) exhibited the lowestvariation and improved expected power to detect apopulation trend. Both fox species could be monitored
simultaneously, with power >0.76 in the short term(5 years), activating 24 bait station lines. We conclude thatmonitoring programs for culpeo fox and gray fox based onbait stations are able to detect marked declines but are lessuseful to reliably detect moderate increases in abundance,especially in sheep ranches.
Keywords Argentina . Bait stations . Culpeo fox . Gray fox .
Population management . Sustainable use
Introduction
Culpeo fox (Pseudalopex culpaeus) and gray fox (Pseuda-lopex griseus) are heavily persecuted throughout Patagonia,where they are simultaneously considered pest and valuablespecies (Novaro and Funes 1994; Novaro 1995). Fox peltsconstitute an important source of income for rural people(Funes and Novaro 1999). On the other hand, sheephusbandry is a major land use, and culpeo fox preyregularly upon lambs and young sheep (Bellati 1986;Bellati and von Thungen 1990; Novaro 1997a; Novaro etal. 2000). Therefore, management of sheep ranchesincludes intensive control of culpeo fox (Travaini et al.2000), which may remove up to 75% of local populationseach year (Novaro 1995). Control methods are mostlynonselective (Travaini et al. 2000), and gray foxes as wellas other predators and scavengers are killed too (Olrog1980). Recently, Novaro et al. (2005) suggested that suchextraction rates would drive populations extinct in theabsence of spatial refuges from which hunted areas can berepopulated through immigration and that culpeo dynamicsmight be described by a source–sink model with attractivesinks. Since high levels of culpeo fox extraction arerepresentative for most sheep ranches across Patagonia,
Communicated by: C. Gortázar
A. Travaini :D. Procopio : S. C. Zapata : J. I. Zanón :R. Martínez-PeckCentro de Investigaciones de Puerto Deseado,Universidad Nacional de la Patagonia Austral, CONICET,Avenida Prefectura Naval S/N,9050 Puerto Deseado, Santa Cruz, Argentina
A. Rodríguez (*)Department of Conservation Biology,Estación Biológica de Doñana, CSIC,Américo Vespucio s/n,41092 Sevilla, Spaine-mail: [email protected]
Eur J Wildl Res (2010) 56:421–433DOI 10.1007/s10344-009-0337-5

source–sink dynamics with attractive sinks might bewidespread (Novaro 1997a). Potential refuges for culpeofox include cattle ranches (Novaro et al. 2005), abandonedranches, and protected areas. After 1985, sheep husbandrywas progressively abandoned in two thirds of Santa Cruzprovince (250,000 km2), southern Argentina, due to acombination of socioeconomic and environmental factors.However, since 2003, sheep farming is being restored inmany of those abandoned ranches, threatening the culpeopopulations that could act as sources. The attractive sinkmodel predicts that population size will decline first onsources (Delibes et al. 2001), which warrants closemonitoring of fox populations in protected areas and otherrefuges if sustainability criteria are to be incorporated topredator control. Moreover, assuming that lamb lossesaugment with culpeo density, detecting an increase of foxabundance in sheep ranches may help to anticipate controlusing nonselective methods (and their ecologically detri-mental side effects) before predation on lambs reachesranchers’ tolerance levels (5% of lambs produced; Travainiet al. 2000).
The fundamental feature that makes useful a monitoringprogram is its ability to detect biologically significantchanges in abundance (Taylor and Gerrodette 1993;Zielinski and Stauffer 1996; Gibbs et al. 1998). In thiscontext, statistical power (Mapstone 1995) equals theprobability that monitoring detects a specified populationchange (Lougheed et al. 1999), the “signal” among the“noise” in the field data (Gibbs et al. 1999). For anypopulation index, designing a monitoring program basicallyimplies maximizing statistical power to detect a pre-established level of change while minimizing samplingeffort, in terms of spatial and temporal replicates, and itsassociated costs (Steidl et al. 1997; Gibbs et al. 1998).However, with some exceptions (e.g., Zielinski and Stauffer1996; Rice et al. 2001), many monitoring programs havenot been preceded by proper power analysis (Peterman1990). Further, the relative sensitivity of power to differentcomponents of sampling effort may help to optimize thedesign of a monitoring program (Di Stefano 2003; Stemet al. 2005; Salzer and Salafsky 2006).
Scent stations and bait stations are standard methods tosurvey carnivores at broad spatial scales (Harrison et al.2002; Sargeant et al. 2003; Zielinski et al. 2005). Thesemethods can detect population trends when substantialchanges in numbers occur across wide areas (Diefenbach etal. 1994; Sargeant et al. 1998). One of their drawbacks,however, is that a high proportion of visitation rates equalto zero produces concomitant high variability and reducesstatistical power to detect trends (Gibbs 2000). Low or zerovisitation rates partly depend on intrinsic attributes of thespecies surveyed at the behavioral and population levelsand are unavoidable. For example, conditioning from
previous contacts of individuals with stations, low densityof the target species, or high food availability might allresult in low attraction to scents or baits. A high proportionof zeros in the population index may also arise ifmonitoring effort is insufficient or the monitoring protocolis unsuitable for the target population. In this case, powerpartly depends upon variables that can be managed byresearchers when designing a monitoring program (Field etal. 2005).
We wanted to design a monitoring program for culpeoand gray foxes based on bait stations in an area includingprotected land (potential source) and sheep ranches (poten-tial sink). We sought to minimize sampling effort whilemaintaining a high probability to detect a given level ofchange. In this study, we first compared the statisticalproperties of seven different visitation indices, with especialattention to the number of zeros and its influence on indexvariability. Then, we assessed the relative performance ofdifferent indices to maximize power. Finally, we analyzedthe sensitivity of power to relevant components of themonitoring program. Specifically, we examined the influ-ence of spatial replication, survey frequency, and season indifferent simulated scenarios of population decrease insources and population increase in sinks.
Study area
The study was conducted at the Monumento NaturalBosques Petrificados National Park (MNBP; 56,000 ha)and five neighboring sheep ranches totaling 100,000 ha(Santa Cruz province, Argentina; Fig. 1). Annual rainfallranged between 100 and 300 mm, and snow is rare.Summer temperatures averaged 17°C, and winters wererelatively mild for this region, with an average of 12.4freezing days per year. A moderate to strong west windblows almost constantly (Harris 1998). Most of the areawas covered with tussock grasses and low, dome-shaped,and spiny shrubs (Soriano 1983), whose cover ranged fromless than 10% in the most arid areas to 60% (Ares et al.1990; Bertiller and Bisigato 1998).
Methods
Field methods
A bait station consisted of a 1-m-diameter circular surfaceof sifted, smoothed soil with a 30-g bait buried at 2–3-cmdepth in its center (Linhart and Knowlton 1975). Baitcomposition was minced meat (80.6%), hydrogenous oil(9.7%), corn starch (8.1%), and a commercial trap lure(1.6%; Cat Passion, O’Gorman Enterprises Inc.; Travaini et
422 Eur J Wildl Res (2010) 56:421–433
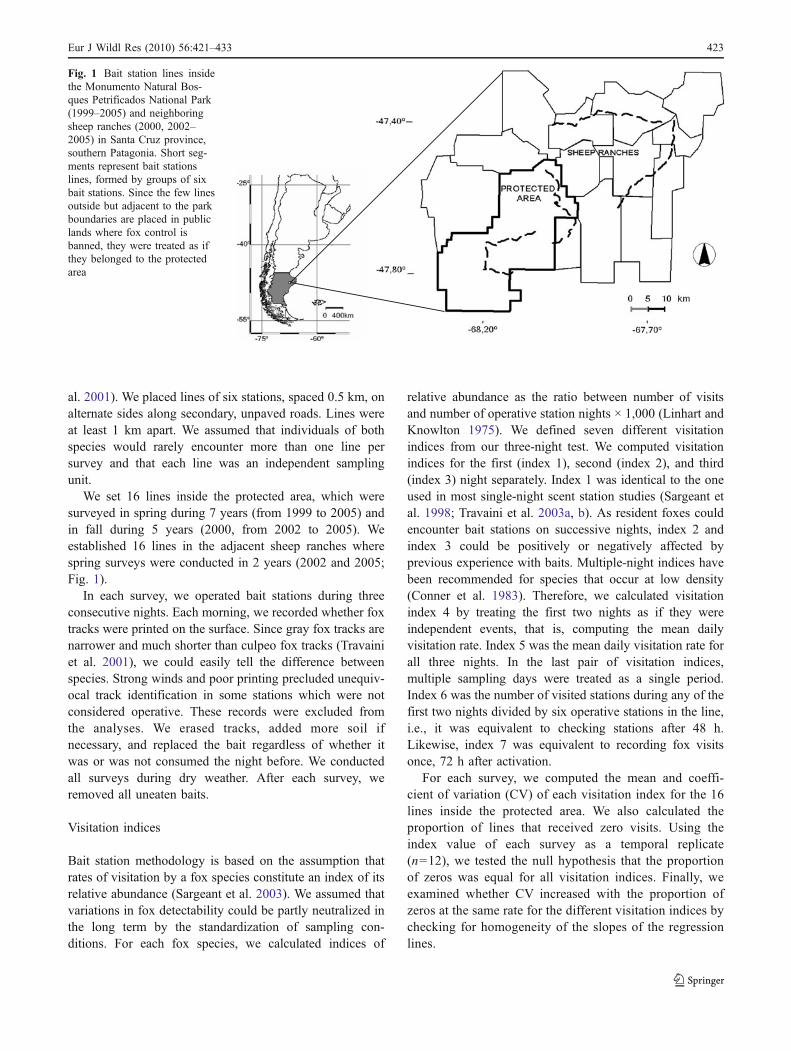
al. 2001). We placed lines of six stations, spaced 0.5 km, onalternate sides along secondary, unpaved roads. Lines wereat least 1 km apart. We assumed that individuals of bothspecies would rarely encounter more than one line persurvey and that each line was an independent samplingunit.
We set 16 lines inside the protected area, which weresurveyed in spring during 7 years (from 1999 to 2005) andin fall during 5 years (2000, from 2002 to 2005). Weestablished 16 lines in the adjacent sheep ranches wherespring surveys were conducted in 2 years (2002 and 2005;Fig. 1).
In each survey, we operated bait stations during threeconsecutive nights. Each morning, we recorded whether foxtracks were printed on the surface. Since gray fox tracks arenarrower and much shorter than culpeo fox tracks (Travainiet al. 2001), we could easily tell the difference betweenspecies. Strong winds and poor printing precluded unequiv-ocal track identification in some stations which were notconsidered operative. These records were excluded fromthe analyses. We erased tracks, added more soil ifnecessary, and replaced the bait regardless of whether itwas or was not consumed the night before. We conductedall surveys during dry weather. After each survey, weremoved all uneaten baits.
Visitation indices
Bait station methodology is based on the assumption thatrates of visitation by a fox species constitute an index of itsrelative abundance (Sargeant et al. 2003). We assumed thatvariations in fox detectability could be partly neutralized inthe long term by the standardization of sampling con-ditions. For each fox species, we calculated indices of
relative abundance as the ratio between number of visitsand number of operative station nights × 1,000 (Linhart andKnowlton 1975). We defined seven different visitationindices from our three-night test. We computed visitationindices for the first (index 1), second (index 2), and third(index 3) night separately. Index 1 was identical to the oneused in most single-night scent station studies (Sargeant etal. 1998; Travaini et al. 2003a, b). As resident foxes couldencounter bait stations on successive nights, index 2 andindex 3 could be positively or negatively affected byprevious experience with baits. Multiple-night indices havebeen recommended for species that occur at low density(Conner et al. 1983). Therefore, we calculated visitationindex 4 by treating the first two nights as if they wereindependent events, that is, computing the mean dailyvisitation rate. Index 5 was the mean daily visitation rate forall three nights. In the last pair of visitation indices,multiple sampling days were treated as a single period.Index 6 was the number of visited stations during any of thefirst two nights divided by six operative stations in the line,i.e., it was equivalent to checking stations after 48 h.Likewise, index 7 was equivalent to recording fox visitsonce, 72 h after activation.
For each survey, we computed the mean and coeffi-cient of variation (CV) of each visitation index for the 16lines inside the protected area. We also calculated theproportion of lines that received zero visits. Using theindex value of each survey as a temporal replicate(n=12), we tested the null hypothesis that the proportionof zeros was equal for all visitation indices. Finally, weexamined whether CV increased with the proportion ofzeros at the same rate for the different visitation indices bychecking for homogeneity of the slopes of the regressionlines.
Fig. 1 Bait station lines insidethe Monumento Natural Bos-ques Petrificados National Park(1999–2005) and neighboringsheep ranches (2000, 2002–2005) in Santa Cruz province,southern Patagonia. Short seg-ments represent bait stationslines, formed by groups of sixbait stations. Since the few linesoutside but adjacent to the parkboundaries are placed in publiclands where fox control isbanned, they were treated as ifthey belonged to the protectedarea
Eur J Wildl Res (2010) 56:421–433 423
Power estimates and sources of variation
We estimated the power of different monitoring designs forPatagonian foxes with the aid of the freeware MONITOR(Gibbs 1995; Thomas and Krebs 1997; available at http://nhsbig.inhs.uiuc.edu/wes/populations). MONITOR usesMonte Carlo simulations to model count surveys (visitationindices in our case) over time and generates detection ratesderived from route-regression analyses (Geissler and Sauer1990; Gibbs and Melvin 1997). This simulation procedureis useful for evaluating the tradeoffs between samplingeffort, logistical constraints, and power to detect trends(Gibbs et al. 1998). To estimate statistical power, wesupplied the program with initial estimates of eachvisitation index and its variance for each fox species,sampling effort in terms of number of lines, surveyfrequency, and type I error. We specified the size of theeffect as the percentage of population change during agiven period. We also ran different simulations for baitstation data obtained in different seasons. Combinations ofparameter values for these variables produced differentscenarios. For each scenario, we estimated one value ofstatistical power after 1,000 replications. To select scenariosthat we considered suitable for the design of a monitoringprogram, we arbitrarily set the minimum acceptable powerat (1−β)=0.76, i.e., the highest probability of failing todetect a specified trend was 0.24.
As initial values, the program needs the estimates of themean and CV of the visitation rates. Gibbs et al. (1998)suggested to feed the program with tentative estimates ofvariability obtained from the literature, which were com-piled for many taxa by Gibbs (2000). We opted, however,for deriving empirically these initial values in our studyarea (Table 1). To examine the effect of variability ofvisitation rates in different seasons inside the protected area,we fed the program with initial values calculated separatelyfor spring surveys and fall surveys.
In simulations, we set the number of sampling units (baitstation lines) between 14 and 26. In preliminary analyses,we found that highly variable visitation indices precludedreaching a statistical power of 0.8 if the number of lineswas <14 (Travaini et al. 2003a, b). The upper limit of 26lines was imposed by road availability inside the protectedarea. The period between successive surveys was set atvalues of 0.5, 1, and 2 years, the latter only when initialvalues of visitation rates were derived from bait station datarecorded over a period of 6 years. To test the nullhypothesis of no population change, type I error was setat values of α=0.05, α=0.10, and α=0.20. We used one-tailed tests, as the predicted direction of change wasestablished a priori (decrease in the protected area, increasein sheep ranches). We considered three levels of effect sizeor magnitude of population change: a 50% decrease after
5 years (6 years if field surveys were considered to beconducted every other year), a 50% decrease after 10 years,and a 30% increase after 3 years.
We used generalized linear models to analyze therelative effect of visitation index, sampling effort, andsampling frequency on estimated statistical power. Toexplore these effects, we used the subset of power valuesobtained within the protected area. For both fox species,power values followed a lognormal distribution, and wemodeled log-transformed power using normal errors andthe following predictors: (1) season, (2) sampling frequency(once a year or once every 2 years), (3) number of spatialreplicates or lines, and (4) visitation index. Since changes inpower cannot be considered in isolation of “effect size” and“alpha level,” we fitted these two factors as covariates inorder to control for their effects. The contribution of eachfactor to the explained variance in power was assessedthrough sequential backward removal from the maximalmodel (Crawley 1993).
Results
We ran MONITOR for 4,998 scenarios corresponding todifferent combinations of parameters, 3,822 for the pro-tected area (76%), and 1,176 for neighboring sheep ranches(24%).
Proportion of zeros and performance of visitation indices
Inside the protected area, visitation indices derived from theoperation of bait stations during 2 or 3 days showed atendency to have a lower proportion of zero values. Themean proportion of lines without visits was highest forindex 1 (0.61 for culpeo fox; 0.40 for gray fox) and lowestfor indices 5 and 7 (culpeo fox 0.44–0.46; gray fox 0.21–0.22). Using index 5 instead of index 1 produced amaximum reduction in the mean number of zeros of 27%for culpeo fox and 48% for gray fox. However, indexvariance was high enough to preclude that differences in theproportion of zeros between visitation indices were signifi-cant (Kruskal–Wallis, n=79; culpeo fox: H=8.04, p=0.235;gray fox: H=9.44, p=0.151). Index variance was higher forculpeo fox than for gray fox; for all indices combined, themaximum CV was 2.8 and 1.7, respectively.
The positive effect of the proportion of zeros on indexvariance was highly significant, and it was adequatelydescribed by a linear relationship (culpeo fox: slope=1.99,R2=0.854; F1, 77=456, p<0.001; gray fox: slope=2.21,R2=0.850; F1, 77=444, p<0.001). Therefore, index vari-ance was also lower for indices calculated as the mean ratesof several consecutive nights or as if stations were checkedafter two or three nights (Table 2). The highest mean CV
424 Eur J Wildl Res (2010) 56:421–433

corresponded to index 1 (culpeo fox 1.79; gray fox 1.28)and the lowest to index 7 (culpeo fox 1.22; gray fox 0.77).Contrasts (Tukey test) indicated that for both species themean CV of index 7 was significantly lower than those ofindices 1–4.
The effect of the proportion of zeros on the variability ofvisitation indices varied across indices (interaction term in
Table 2). Mean CV of indices obtained after checking baitstations during two or three nights increased with theproportion of zeros at a lower rate than single-nightvisitation indices. For the culpeo fox, extreme differencesoccurred between slopes above 2.2 for indices 1 and 2 andslopes below 1.8 for indices 4 to 7. For the gray fox,maximum differences were found between slopes in the
Culpeo fox Gray fox
Periodicity Season Index Mean CV Mean CV
Protected area
1 year, 2 years Spring 1 159 1.132 182 1.088
1 year, 2 years Spring 2 161 1.000 255 1.109
1 year, 2 years Spring 3 220 1.045 222 1.455
1 year, 2 years Spring 4 160 0.994 214 1.065
1 year, 2 years Spring 5 191 0.859 213 1.188
1 year, 2 years Spring 6 253 0.826 306 0.944
1 year, 2 years Spring 7 338 0.787 343 0.983
1 year, 2 years Fall 1 183 1.164 248 1.016
1 year, 2 years Fall 2 188 1.505 322 1.047
1 year, 2 years Fall 3 214 1.299 334 0.790
1 year, 2 years Fall 4 182 1.324 292 0.942
1 year, 2 years Fall 5 195 1.277 308 0.864
1 year, 2 years Fall 6 266 1.068 386 0.966
1 year, 2 years Fall 7 328 0.987 454 0.817
6 months 1 202 0.842 132 1.492
6 months 2 243 0.831 143 1.336
6 months 3 297 0.660 189 1.016
6 months 4 221 0.701 138 1.304
6 months 5 247 0.595 156 1.147
6 months 6 361 0.598 228 1.162
6 months 7 499 0.451 314 0.911
Sheep ranches
1 year, 2 years Spring 1 42 1.619 120 1.317
1 year, 2 years Spring 2 68 1.691 68 2.015
1 year, 2 years Spring 3 47 1.936 120 1.267
1 year, 2 years Spring 4 52 1.269 94 1.447
1 year, 2 years Spring 5 49 1.388 103 1.320
1 year, 2 years Spring 6 94 1.244 151 1.192
1 year, 2 years Spring 7 110 1.200 198 1.030
Table 1 Mean and CV of visi-tation indices used as initialvalues to run simulations inMONITOR
Values were obtained from asample of surveys in the pro-tected area (spring 1999, 2000,and 2001; fall 2000, 2002, and2003) and in the sheep ranches(spring 2002 and 2005). Period-icity means time elapsed be-tween successive surveys in thesimulations
Culpeo fox Gray fox
SS df MS F p SS df MS F p
Intercept 2.832 1 2.832 85.52 <0.001 2.386 1 2.386 106.35 <0.001
Index 0.440 6 0.073 2.22 0.053 0.609 6 0.102 4.53 <0.001
Zero 16.600 1 16.560 501.29 <0.001 12.037 1 12.037 536.65 <0.001
Index × Zero 0.563 6 0.094 2.83 0.016 0.785 6 0.131 5.84 <0.001
Error 2.152 65 0.033 1.458 65 0.022
Table 2 Analysis of covariancefor the effect of visitationindex and the proportion ofbait station lines without foxvisits (“zero”) on the CVin visitation indices
The interaction term tests forhomogeneity of slopes of re-gression lines for seven differentindices
Eur J Wildl Res (2010) 56:421–433 425
range 2.1–3.1 for indices 1, 3, and 4 and slopes below 1.8for indices 5 to 7. In both species, index 7 exhibited thebest behavior, that is, lowest CV and lowest rate of increaseof CV with the proportion of zeros.
Statistical power in selected scenarios
All else being equal, the lowest variation in the visitationindex was expected to yield the highest statistical power.Since index 7 was the visitation index that exhibited thelowest variation, we used this index to illustrate thescenarios that allowed us to detect trends with high power.For this purpose, power values were classified into threeclasses: low (<0.76), high (0.76–0.85; i.e., around 0.8,which is considered an acceptable power; Steidl et al.1997), and very high (>0.85).
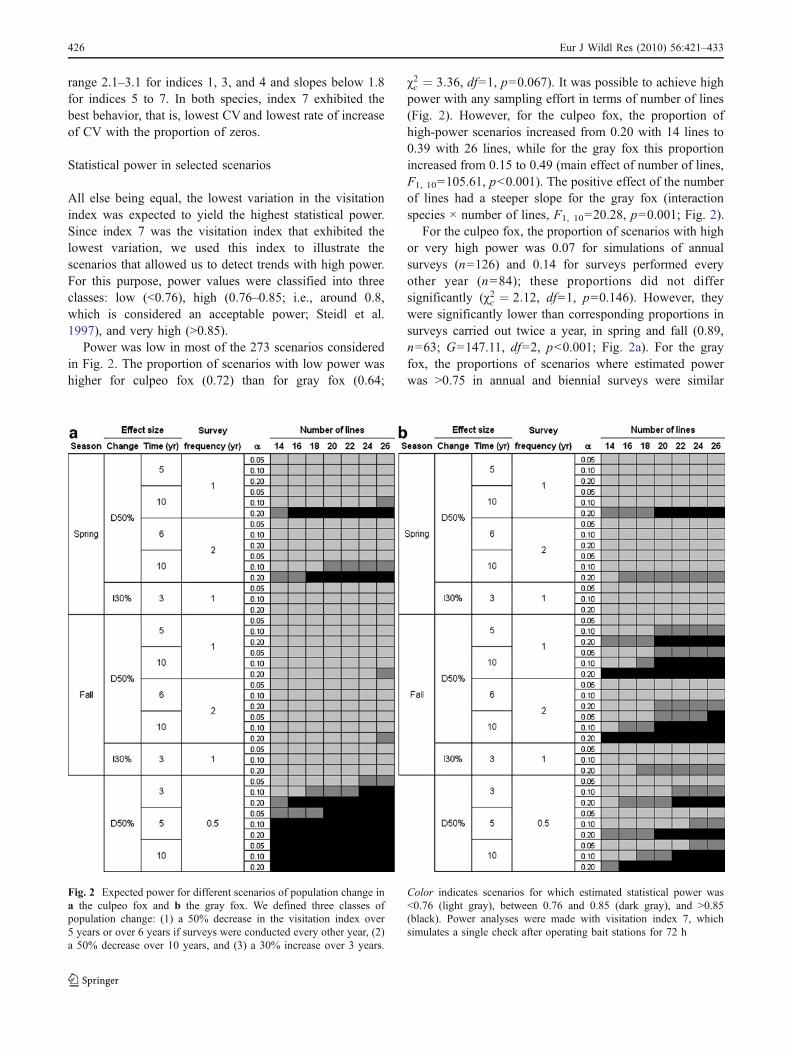
Power was low in most of the 273 scenarios consideredin Fig. 2. The proportion of scenarios with low power washigher for culpeo fox (0.72) than for gray fox (0.64;
#2c ¼ 3:36, df=1, p=0.067). It was possible to achieve highpower with any sampling effort in terms of number of lines(Fig. 2). However, for the culpeo fox, the proportion ofhigh-power scenarios increased from 0.20 with 14 lines to0.39 with 26 lines, while for the gray fox this proportionincreased from 0.15 to 0.49 (main effect of number of lines,F1, 10=105.61, p<0.001). The positive effect of the numberof lines had a steeper slope for the gray fox (interactionspecies × number of lines, F1, 10=20.28, p=0.001; Fig. 2).
For the culpeo fox, the proportion of scenarios with highor very high power was 0.07 for simulations of annualsurveys (n=126) and 0.14 for surveys performed everyother year (n=84); these proportions did not differsignificantly (#2c ¼ 2:12, df=1, p=0.146). However, theywere significantly lower than corresponding proportions insurveys carried out twice a year, in spring and fall (0.89,n=63; G=147.11, df=2, p<0.001; Fig. 2a). For the grayfox, the proportions of scenarios where estimated powerwas >0.75 in annual and biennial surveys were similar
Fig. 2 Expected power for different scenarios of population change ina the culpeo fox and b the gray fox. We defined three classes ofpopulation change: (1) a 50% decrease in the visitation index over5 years or over 6 years if surveys were conducted every other year, (2)a 50% decrease over 10 years, and (3) a 30% increase over 3 years.
Color indicates scenarios for which estimated statistical power was<0.76 (light gray), between 0.76 and 0.85 (dark gray), and >0.85(black). Power analyses were made with visitation index 7, whichsimulates a single check after operating bait stations for 72 h
426 Eur J Wildl Res (2010) 56:421–433
(0.31 and 0.32, respectively) and significantly lower thanthe proportion in biannual surveys (0.51; G=7.71, df=2,p=0.021; Fig. 2b).
If culpeo fox abundance was monitored twice a year,high power was attained regardless of variation in type Ierror (Fig. 2a). Using lower survey frequencies and settingα=0.05 led invariably to low power, whereas high or veryhigh power was expected in 7% of scenarios if α=0.10 and23% of scenarios if α=0.20 (G=19.11, df=2, p<0.001;Fig. 2a). For the gray fox, the percentage of scenarioswhose expected power was >0.75 increased from 11% ifα=0.05 through 28% if α=0.10 to 69% if α=0.20(G=74.08, df=2, p<0.001).
For culpeo fox, it was not possible to detect a 30%increase of visitation index 7 over 3 years in any of thescenarios for the sheep ranches (Fig. 2a). A high or veryhigh power was estimated inside the protected area for a50% decrease over 5 years (6 years if surveys wereperformed every other year) in 20% of scenarios and over10 years in 40% of scenarios (Fig. 2a). Differences in thefraction of scenarios with high power between these twotemporal projections were significant (#2c ¼ 8:31, df=1,p=0.004). Differences between the three effect sizes consid-ered for the culpeo fox were significant too (G=29.73, df=2,p<0.001). For the gray fox, high power to detect asubstantial population increase in the short term was possiblein the sheep ranches (12% of scenarios; Fig. 2b). Inside theprotected areas, the fraction of scenarios with high power todetect a population reduction notably increased by expandingthe projected time from 5 or 6 years for surveys performedevery other year (23%) to 10 years (57%; #2c ¼ 24:31, df=1,p<0.001; Fig. 2b). Differences between the three effect sizeswere also significant (G=40.34, df=2, p<0.001).
For culpeo fox, surveys in spring yielded high powerin 18% of scenarios, a fraction significantly higher(#2c ¼ 13:54, df=1, p<0.001) than the 2% we found forfall surveys (Fig. 2a). By contrast, high power wasexpected in 51% of fall scenarios for gray fox, and thispercentage was significantly higher than the correspondingpercentage of scenarios in spring (12%; #2c ¼ 33:61, df=1,p<0.001).
Relative effects of components of monitoring on statisticalpower
Generalized linear models explained about 90% of thevariance in statistical power for both fox species (Tables 3and 4). All main effects were retained in the final modelswith the only exception of the survey frequency. That is,expected power was similar when simulations were runwith visitation indices obtained either from annual surveysor from surveys carried out every other year. The effects wefound in univariate analyses of power for visitation index 7
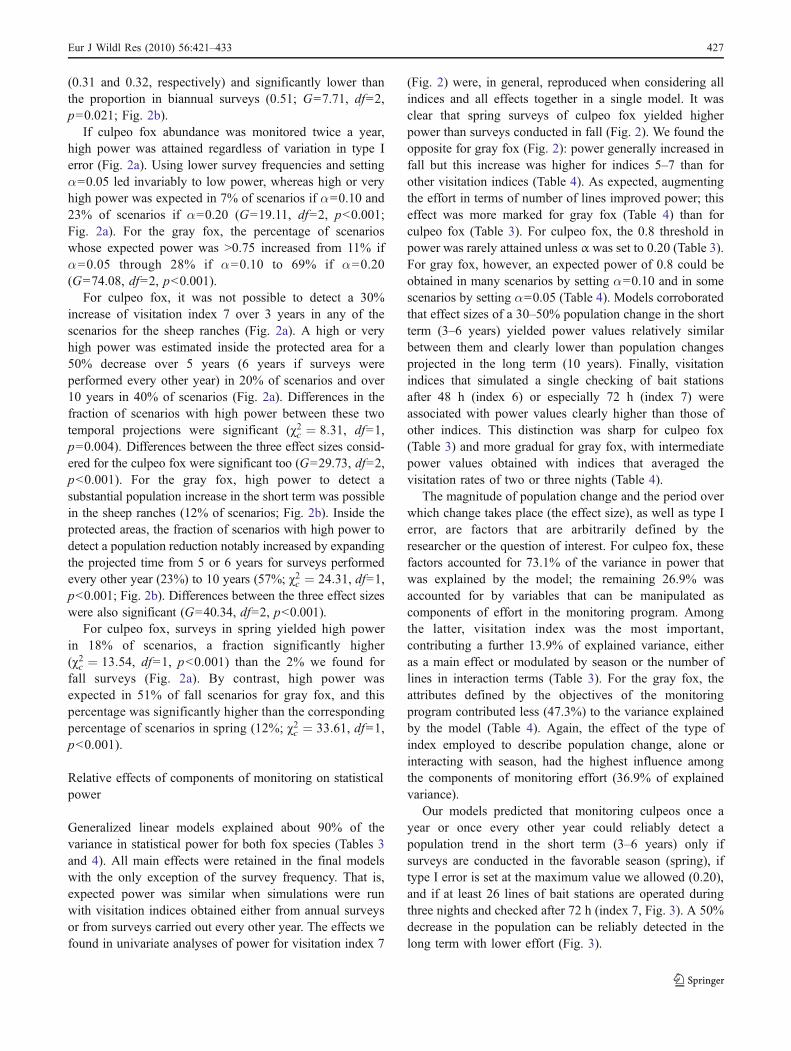
(Fig. 2) were, in general, reproduced when considering allindices and all effects together in a single model. It wasclear that spring surveys of culpeo fox yielded higherpower than surveys conducted in fall (Fig. 2). We found theopposite for gray fox (Fig. 2): power generally increased infall but this increase was higher for indices 5–7 than forother visitation indices (Table 4). As expected, augmentingthe effort in terms of number of lines improved power; thiseffect was more marked for gray fox (Table 4) than forculpeo fox (Table 3). For culpeo fox, the 0.8 threshold inpower was rarely attained unless α was set to 0.20 (Table 3).For gray fox, however, an expected power of 0.8 could beobtained in many scenarios by setting α=0.10 and in somescenarios by setting α=0.05 (Table 4). Models corroboratedthat effect sizes of a 30–50% population change in the shortterm (3–6 years) yielded power values relatively similarbetween them and clearly lower than population changesprojected in the long term (10 years). Finally, visitationindices that simulated a single checking of bait stationsafter 48 h (index 6) or especially 72 h (index 7) wereassociated with power values clearly higher than those ofother indices. This distinction was sharp for culpeo fox(Table 3) and more gradual for gray fox, with intermediatepower values obtained with indices that averaged thevisitation rates of two or three nights (Table 4).
The magnitude of population change and the period overwhich change takes place (the effect size), as well as type Ierror, are factors that are arbitrarily defined by theresearcher or the question of interest. For culpeo fox, thesefactors accounted for 73.1% of the variance in power thatwas explained by the model; the remaining 26.9% wasaccounted for by variables that can be manipulated ascomponents of effort in the monitoring program. Amongthe latter, visitation index was the most important,contributing a further 13.9% of explained variance, eitheras a main effect or modulated by season or the number oflines in interaction terms (Table 3). For the gray fox, theattributes defined by the objectives of the monitoringprogram contributed less (47.3%) to the variance explainedby the model (Table 4). Again, the effect of the type ofindex employed to describe population change, alone orinteracting with season, had the highest influence amongthe components of monitoring effort (36.9% of explainedvariance).
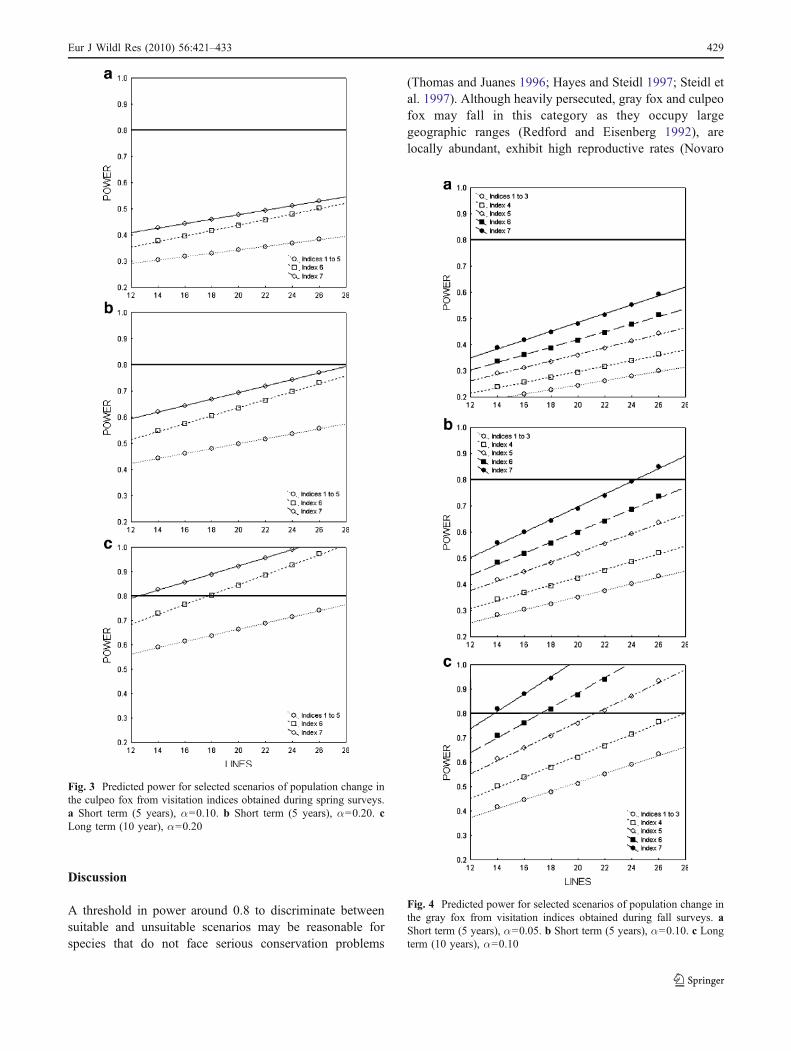
Our models predicted that monitoring culpeos once ayear or once every other year could reliably detect apopulation trend in the short term (3–6 years) only ifsurveys are conducted in the favorable season (spring), iftype I error is set at the maximum value we allowed (0.20),and if at least 26 lines of bait stations are operated duringthree nights and checked after 72 h (index 7, Fig. 3). A 50%decrease in the population can be reliably detected in thelong term with lower effort (Fig. 3).
Eur J Wildl Res (2010) 56:421–433 427
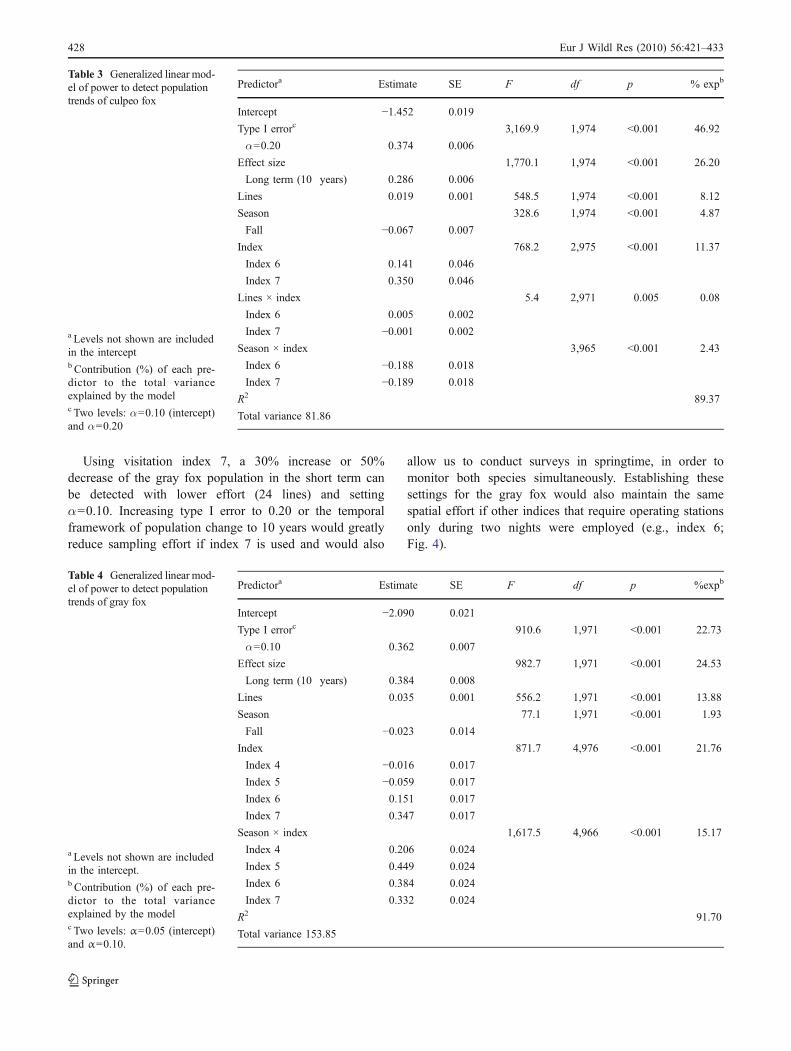
Using visitation index 7, a 30% increase or 50%decrease of the gray fox population in the short term canbe detected with lower effort (24 lines) and settingα=0.10. Increasing type I error to 0.20 or the temporalframework of population change to 10 years would greatlyreduce sampling effort if index 7 is used and would also
allow us to conduct surveys in springtime, in order tomonitor both species simultaneously. Establishing thesesettings for the gray fox would also maintain the samespatial effort if other indices that require operating stationsonly during two nights were employed (e.g., index 6;Fig. 4).
Predictora Estimate SE F df p %expb
Intercept −2.090 0.021
Type I errorc 910.6 1,971 <0.001 22.73
α=0.10 0.362 0.007
Effect size 982.7 1,971 <0.001 24.53
Long term (10 years) 0.384 0.008
Lines 0.035 0.001 556.2 1,971 <0.001 13.88
Season 77.1 1,971 <0.001 1.93
Fall −0.023 0.014
Index 871.7 4,976 <0.001 21.76
Index 4 −0.016 0.017
Index 5 −0.059 0.017
Index 6 0.151 0.017
Index 7 0.347 0.017
Season × index 1,617.5 4,966 <0.001 15.17
Index 4 0.206 0.024
Index 5 0.449 0.024
Index 6 0.384 0.024
Index 7 0.332 0.024
R2 91.70
Total variance 153.85
Table 4 Generalized linear mod-el of power to detect populationtrends of gray fox
a Levels not shown are includedin the intercept.b Contribution (%) of each pre-dictor to the total varianceexplained by the modelc Two levels: α=0.05 (intercept)and α=0.10.
Predictora Estimate SE F df p % expb
Intercept −1.452 0.019
Type I errorc 3,169.9 1,974 <0.001 46.92
α=0.20 0.374 0.006
Effect size 1,770.1 1,974 <0.001 26.20
Long term (10 years) 0.286 0.006
Lines 0.019 0.001 548.5 1,974 <0.001 8.12
Season 328.6 1,974 <0.001 4.87
Fall −0.067 0.007
Index 768.2 2,975 <0.001 11.37
Index 6 0.141 0.046
Index 7 0.350 0.046
Lines × index 5.4 2,971 0.005 0.08
Index 6 0.005 0.002
Index 7 −0.001 0.002
Season × index 3,965 <0.001 2.43
Index 6 −0.188 0.018
Index 7 −0.189 0.018
R2 89.37
Total variance 81.86
Table 3 Generalized linear mod-el of power to detect populationtrends of culpeo fox
a Levels not shown are includedin the interceptb Contribution (%) of each pre-dictor to the total varianceexplained by the modelc Two levels: α=0.10 (intercept)and α=0.20
428 Eur J Wildl Res (2010) 56:421–433
Discussion
A threshold in power around 0.8 to discriminate betweensuitable and unsuitable scenarios may be reasonable forspecies that do not face serious conservation problems
(Thomas and Juanes 1996; Hayes and Steidl 1997; Steidl etal. 1997). Although heavily persecuted, gray fox and culpeofox may fall in this category as they occupy largegeographic ranges (Redford and Eisenberg 1992), arelocally abundant, exhibit high reproductive rates (Novaro
Fig. 4 Predicted power for selected scenarios of population change inthe gray fox from visitation indices obtained during fall surveys. aShort term (5 years), α=0.05. b Short term (5 years), α=0.10. c Longterm (10 years), α=0.10
Fig. 3 Predicted power for selected scenarios of population change inthe culpeo fox from visitation indices obtained during spring surveys.a Short term (5 years), α=0.10. b Short term (5 years), α=0.20. cLong term (10 year), α=0.20
Eur J Wildl Res (2010) 56:421–433 429

1997b), and have demonstrated a high potential for quickrecovery after severe population decline (Ojeda and Mares1982; Mares and Ojeda 1984; Novaro 1993, 1997b; Novaroet al. 2005). On the other hand, setting a higher thresholdfor statistical power would probably imply logistical andbudgetary constraints that would compromise the practicalimplementation of the monitoring program. We relaxedtype I error up to a maximum of α=0.20. When testing thenull hypothesis of absence of fox population decline inprotected areas, from a conservation standpoint, a falsealarm (type I error) is more tolerable than the consequencesof failing to detect a population crash (Thompson et al.1998; Elzinga et al. 2001).
Performance of visitation indices
Minimizing the average number of zeros in visitationindices by choosing the less zero-prone index was moreeffective for the gray fox (48% reduction of zero values)than for the culpeo fox (26% reduction). Moreover,maximum values of the CV for any index were higher forculpeo fox than for gray fox. Since the number of zeros wasstrongly correlated with index variance and index varianceaffected power, index behavior predicted that it will bemore difficult to detect a trend for culpeo fox than for grayfox.
As recommended by Roughton and Sweeny (1982),scent stations and bait stations have been operated just forone night in most studies (Linscombe et al. 1983; Smith etal. 1994; Travaini et al. 1996; Sargeant et al. 1998). Single-night operation may restrict the chances of individuals toencounter at least one station during its activity period thatparticular night, especially if their home ranges are largecompared with station spacing. This contributes to thedecrease in visitation rates within lines and to the increasein the number of lines without visits. In turn, zeros maygreatly inflate the variance in visitation rates and reducethe power of bait stations to detect a population trend. Theabsence of visits in some lines may also reflect gaps in thedistribution of animals, but variance inflation in visitationrates due to spatial heterogeneity in territory occupancy isunavoidable. The amount of zeros due to short exposure ofstations, however, can be minimized. All visitation indicescomputed with records obtained during more than one nighthad the purpose of reducing the proportion of lines notvisited and the variance of the index by extending theperiod of exposure to stations. The operation of bait stationsduring several nights increases monitoring effort but alsohelps to increase statistical power. Moreover, in periodswith favorable weather (dry and calm), bait stations couldbe checked only once after three consecutive nights, andtotal field effort would be the same as that of a single-nightoperation.
The probability of contagion in visits has been empha-sized for adjacent stations or even clustered lines (Sargeantet al. 1998). Temporal contagion is also likely sinceindividuals may visit a station with higher probability ifthey have previously obtained a bait as a reward. Neutral ornegative reactions to baits might also be possible, and linesoperated during successive nights may not constituteindependent trials. However, visitation indices, regardlessthe way they are derived, are estimates of relativeabundance. The fundamental assumption for the validityof the index to detect changes in fox abundance is thatdetectability and the average response of individuals(frequency of attraction or reluctance to baits after the firstencounter) remain reasonably constant between surveys. Toour knowledge, this assumption has not been tested in thecontext of bait station methodology.
Statistical power in selected scenarios
Power was low (<0.76) in most scenarios for both specieseven when we employed the visitation index that showedthe lowest variance. To save space, we have not reportedthe results for other indices, including the widely usedindex 1. Their performance was even worse than that forindex 7, i.e., power <0.76 was expected in a higherproportion of scenarios.
High power could be achieved with any number of linesbetween 14 and 26. This removes unavoidable spatialrestrictions due to road availability and therefore proper linespacing, as a limiting factor for monitoring populationtrends in the MNBP.
For culpeo fox, high power was common in biannualsurveys, but it also was restricted to a few scenarios(projections over 10 years and α=0.20) if survey frequencywas lower. Survey frequency was less influential forachieving high power in the gray fox. The annual peak ofgray fox density usually occurs in fall, during juveniledispersal and before winter mortality. High fox densitymight result in higher visitation rates with lower variability,and our results support this expectation. The opposite wasobserved for culpeo fox, and we have no clear explanationfor this. A possibility is that the continuous decrease invisitation rates observed for this species throughout thestudy period could have masked the expected pattern.
Relative effects of components of monitoring on statisticalpower
The components of the monitoring program that weredirectly related to sampling effort explained a substantialfraction of the expected power to detect population trendsin both fox species. Among these components, it wasparticularly relevant choosing a visitation index whose
430 Eur J Wildl Res (2010) 56:421–433

statistical properties included a relatively low variance. Inthis regard, index 6 (a single check after 48-h operation)and especially index 7 (one check after 72 h) showed thebest behavior and performed much better than the otherindices, including index 1 (one check after 24 h) which iswidely used in scent station and bait station surveys ofmany carnivores (Sargeant et al. 1998). The superiorperformance of index 7 seems to be density dependent.Outside the protected area, where average fox densities tendto be lower, a higher proportion of lines received no foxvisit, and variance in visitation indices increased. As aresult, obtaining a given power to detect fox trends in sheepranches requires considerably more effort than inside thenational park. Despite variation of index performance inareas subjected to different management regimes, therelative properties of visitation indices may be general anddeserve consideration in bait or scent station surveys, assuggested by Conner et al. (1983) who found that operatingscent stations during several nights improve abundanceestimations of low-density carnivores. Wherever maximiz-ing power will be an objective, researchers may want toconsider an increase in the operation time of stations whilekeeping sampling effort constant.
A monitoring program for Patagonian foxes
Setting type I error to α=0.20 allows reliable monitoring(power>0.76) of both fox species in the short term (5 years)as long as 24 bait station lines are operated and visitationindex 7 is used. With this design, similar power is expectedif surveys are performed either every year or every otheryear. To save resources, surveys can be made only in springwhich enhances power for culpeo fox, while increasing thenumber of lines will compensate any eventual loss of powerfor gray fox associated with spring surveys.
Based on MONITOR simulations, we suggest thefollowing recommendations:
Inside the protected area
(a) To detect a 50% decrease in 5 years or a 30%increase in 3 years for both species, spring surveys canbe conducted every other year, activating 26 lines andkeeping α=0.20. Visitation indices 6 or 7 should beused, although the latter is preferred.(b) To detect a 50% decrease in 10 years, springsurveys could be conducted biennially, activating 18–20 lines and with α=0.20 for both foxes. Visitationindices 6 or 7 are recommended.
Outside the protected area
(a) Bait stations could not be used to reveal anysubstantial increase in culpeo fox numbers in the shortterm. To detect a 30% increase in 3 years with high
power, at least 26 lines should be operated twice a year,with α=0.20 and using index 7. Clearly, this is not aviable alternative for sheep ranchers or wildlife man-agement authorities in Santa Cruz. Nevertheless, theimportance of early detection of fox increase, theconcomitant ability to use selective control methods,and thereby enhanced protection of nontarget speciesdeserve further attention.
Management implications
The monitoring program we propose may be applied toother protected areas and abandoned ranches over southernPatagonia, in order to detect fox population declines due toextractive or control activities in neighboring ranches. Ourstudy involved about 100,000 ha of sheep ranches.Nevertheless, Santa Cruz province covers 25 millionhectares. The use of predictive models of fox occurrence(cf. Travaini et al. 2007) should be a valuable tool foridentifying representative areas where monitoring should bemore efficient.
On the other hand, since methods of fox control used bysheep ranchers are not selective and have important sideeffects on nontarget species of conservation value (Olrog1980), detecting an increase of low magnitude in foxabundance, as a signal for a potential positive trend in thelong term, is important for wildlife agencies to anticipate aprescribed control with selective methods. Furthermore, itis important to detect a positive trend early, before themagnitude of damage to lambs will be considered unac-ceptable by ranchers. However, bait stations seem to be aweak method to detect, timely and with high power, apopulation increase as large as 30% in sheep ranches,especially for culpeo fox. In the ranches of our study area,this could be due in part to the fact that culpeo fox densitieswere lower than inside the national park, making higher theproportion of lines without visits, increasing the variance ofvisitation indices and, therefore, reducing power. Toachieve an early detection of positive trends, the power ofmonitoring programs based on alternative indices, such asfecal density counts (Cavallini 1994; Webbon et al. 2004),spotlight counts (Ruette et al. 2003; Sobrino et al. 2009),and culling indices (Hewson and Kolb 1973; Myrberget1988; McDonald and Harris 1999), should be tested.
Simultaneous monitoring in adjacent protected andfarmland areas may allow the integral management of foxpopulations subjected to spatial heterogeneity in mortalitylevels or in resource availability that translates into otherpopulation parameters. In a context of source–sink dynam-ics, a decreasing trend in the protected area, but not insheep ranches, might draw attention to fox control levels in
Eur J Wildl Res (2010) 56:421–433 431

ranches if these act as attractive sinks (Delibes et al. 2001;Robinson et al. 2008; Dexter and Murray 2009). Theoperation of other processes could also be suspected. Forexample, a severe reduction of food in ranches could lead tocrowding effects in the protected area, as has beensuggested for other taxa after substantial habitat removal(Hagan et al. 1996). Finally, similar monitoring approachescould be useful to manage the widespread predator–livestock conflict, as long as predator populations occupyrefuges or constitute conservation targets (Herfindal et al.2005; Fleming et al. 2006).
Acknowledgments Funds were provided by the Universidad Nacio-nal de la Patagonia Austral, project B-013, CONICET (PEI-6065), theSecretaría de Agricultura, Ganadería, Pesca y Alimentación de LaNación through the “Programa de Apoyo a la Producción Agro-pecuaria Patagónica en Emergencia” Resolutions SAGPyA nos. 613/96, 716/97, and 925/97, the Secretaría de Ambiente y DesarrolloSustentable de La Nación; the Consejo Agrario Provincial, theAgencia Nacional de Promoción Científica y Tecnológica, ProjectBID 802/OC-AR-PICT Nro. 08-03293, BID 1728/OC-AR-PICTONro 30723, and the BBVA Foundation through a grant under theConservation Biology Program. Personal support to A. Rodríguez wasprovided by the Consejería de Innovación, Junta de Andalucía, Spain.D. Procopio was supported by a CONICET predoctoral fellowship. M.Santillán, C. Zoratti, G. Soria, F. Escobar, G. Aguilera, P. Collavino,E. Daher, M. Yaya, and M. Bronfman collaborated in the field work.
References
Ares J, Beeskow AM, Bertiller MB, Rostagno CM, Irisarri MP,Anchorena J, Defossé GE, Meroni CA (1990) Structural anddynamic characteristics of overgrazed lands of Northern Patago-nia, Argentina. In: Bremeyer A (ed) Managed grasslands:regional studies. Elsevier, Amsterdam, pp 149–175
Bellati J (1986) Estimación de las pérdidas por zorro colorado decorderos de 1 a 60 días de edad en el departamento de Pilcaniyeu,Río Negro. Presencia 2:43–44
Bellati J, von Thungen J (1990) Lamb predation in Patagonianranches. In: Davis LR, Marsh RE (eds) Proc 14th Vertebr PestConf. Univ California, Davis, pp 263–268
Bertiller MB, Bisigato A (1998) Vegetation dynamics under grazingdisturbance. The state-and-transition model for the Patagoniansteppes. Ecol Austral 8:191–199
Cavallini P (1994) Faeces count as an index of fox abundance. ActaTheriol 39:417–424
Conner MC, Labisky RF, Progulske DR (1983) Scent-station indicesas measures of population abundance for bobcats, raccoons, grayfoxes and opossums. Wildl Soc Bull 11:146–152
Crawley MJ (1993) GLIM for ecologists. Blackwell, OxfordDelibes M, Gaona P, Ferreras P (2001) Effects of an attractive sink
leading into maladaptive habitat selection. Am Nat 158:277–285Dexter N, Murray A (2009) The impact of fox control on the relative
abundance of forest mammals in East Gippsland, Victoria. WildlRes 36:252–261
Di Stefano J (2003) How much power is enough? Against thedevelopment of an arbitrary convention for statistical powercalculations. Funct Ecol 17:707–709
Diefenbach DR, Conroy MJ, Warren RJ, James WE, Baker LA, HonT (1994) A test of the scent-station survey technique for bobcats.J Wildl Manage 58:10–17
Elzinga C, Salzer D, Willoughby J, Gibbs JP (2001) Monitoring plantand animal populations: a handbook for field biologists. Black-well, London
Field SA, Tyre AJ, Possingham HP (2005) Optimizing allocation ofmonitoring effort under economic and observational constraints.J Wildl Manage 69:473–482
Fleming PJS, Allen LR, Lapidge SJ, Robley A, Saunders GR,Thomson PC (2006) Strategic approach to mitigating the impactsof wild canids: proposed activities of the Invasive AnimalsCooperative Research Centre. Aust J Exp Agric 46:753–762
Funes MC, Novaro JA (1999) Rol de la fauna silvestre en la economíadel poblador rural, provincia del Neuquén, Argentina. RevArgent Prod Anim 19:265–271
Geissler PH, Sauer JR (1990) Topic in route regression analysis. In:Sauer JR, Droege S (eds) Survey designs and statistical methodsfor the estimation of avian population trends. US Fish Wildl Serv,Biol Report 90(1), pp 54–57
Gibbs JP (1995) Monitor: users manual. Department of Biology, YaleUniv, New Haven
Gibbs JP (2000) Monitoring populations. In: Boitani L, Fuller TK(eds) Research techniques in animal ecology. Columbia UnivPress, New York, pp 213–252
Gibbs JP, Melvin SM (1997) Power to detect trends in waterbirdabundance with call-response surveys. J Wildl Manage 61:1262–1267
Gibbs JP, Droege S, Eagle P (1998) Monitoring populations of plantsand animals. Bioscience 48:935–940
Gibbs JP, Snell HL, Causton E (1999) Effective monitoring foradaptive wildlife management: lessons from the GalápagosIslands. J Wildl Manage 63:1055–1065
Hagan JM, van der Haegen WM, McKinley PS (1996) The earlydevelopment of forest fragmentation effects on birds. ConservBiol 10:188–202
Harris G (1998) A guide to the birds and mammals of coastalPatagonia. Princeton Univ Press, Princeton
Harrison RL, Barr DJ, Dragoo JW (2002) A comparison of populationsurvey techniques for swift foxes (Vulpes velox) in New Mexico.Am Midl Nat 148:320–337
Hayes JP, Steidl RJ (1997) Statistical power analysis and amphibianpopulation trends. Conserv Biol 11:173–275
Herfindal I, Linnell JDC, Moa PF, Odden J, Austmo LB, Andersen R(2005) Does recreational hunting of lynx reduce depredationlosses of domestic sheep? J Wildl Manage 69:1034–1042
Hewson R, Kolb HH (1973) Changes in the numbers and distributionof foxes (Vulpes vulpes) killed in Scotland from 1948–1970. JZool 171:345–365
Linhart SB, Knowlton FF (1975) Determining the relative abundanceof coyotes by scent station lines. Wildl Soc Bull 3:119–124
Linscombe G, Kinler N, Wright V (1983) An analysis of scent stationresponse in Louisiana. Proc Ann Conf Southeast Assoc FishWildl Agencies 37:190–200
Lougheed LW, Breault A, Lank DB (1999) Estimating statisticalpower to evaluate ongoing waterfowl population monitoring. JWildl Manage 63:1359–1369
Mapstone BD (1995) Scalable decision rules for environmental impactstudies: effects size, type I, and type II errors. Ecol Appl 5:401–410
Mares MA, Ojeda RA (1984) Faunal commercialization and conser-vation in South America. Bioscience 34:580–584
McDonald RA, Harris S (1999) The use of trapping records to monitorpopulations of stoats Mustela erminea and weasels M nivalis: theimportance of trapping effort. J Appl Ecol 36:679–688
Myrberget S (1988) Hunting statistics as indicators of gamepopulation size and composition. Stat J UN Econ Comm Eur5:289–301
Novaro AJ (1993) Culpeo foxes in Patagonia. Canid News 1:15–17
432 Eur J Wildl Res (2010) 56:421–433

Novaro AJ (1995) Sustainability of harvest of culpeo foxes inPatagonia. Oryx 29:18–22
Novaro AJ (1997a) Source-sink dynamics induced by hunting: casestudy of culpeo foxes on rangelands in Patagonia, Argentina.Dissertation, Univ Florida, Gainesville
Novaro AJ (1997b) Pseudalopex culpaeus. Mammal Spec 558:1–8Novaro AJ, Funes MC (1994) Impact of hunting on Argentinean
foxes. Canid News 2:19–20Novaro AJ, Funes MC, Rambeaud C, Monsalvo O (2000) Calibración
del índice de estaciones odoríferas para estimar tendenciaspoblacionales del zorro colorado (Pseudalopex culpaeus) enPatagonia. Mastozool Neotrop 7:81–88
Novaro JA, Funes MC, Walker RS (2005) An empirical test of source-sink dynamics induced by hunting. J Appl Ecol 42:910–920
Ojeda RA, Mares MA (1982) Conservation of South Americanmammals: Argentina as a paradigm. In: Mares MA, GenowaysHH (eds) Mammalian biology in South America. PymatuningLaboratory of Ecology Special Publication, vol 6. PymatuningLaboratory of Ecology, Linesville, pp 505–521
Olrog CH (1980) Alarmante escasez de rapaces en el sur argentino.Hornero 12:82–84
Peterman RM (1990) The importance of reporting statistical power:the forest decline and acidic deposition example. Ecology71:2024–2027
Redford KH, Eisenberg JF (1992) Mammals of the neotropics. Thesouthern cone: Chile, Argentina, Uruguay, Paraguay, 2. UnivChicago Press, Chicago
Rice CG, Rohlman J, Beecham J, Pozzanghera S (2001) Poweranalysis of bait station surveys in Idaho and Washington. Ursus12:227–236
Robinson HS, Wielgus RB, Cooley HS, Cooley SW (2008) Sinkpopulations in carnivore management: cougar demographyand immigration in a hunted population. Ecol Appl 18:1028–1037
Roughton RD, Sweeny MW (1982) Refinements in scent-stationmethodology for assessing trends in carnivore populations. JWildl Manage 46:217–229
Ruette S, Stahl P, Albaret M (2003) Applying distance-samplingmethods to spotlight counts of red foxes. J Appl Ecol 40:32–43
Salzer D, Salafsky N (2006) Allocation resources between takingaction, assessing status, and measuring effectiveness of conser-vation actions. Nat Areas J 26:310–316
Sargeant GA, Johnson DH, Berg WE (1998) Interpreting carnivorescent-station surveys. J Wildl Manage 62:1235–1245
Sargeant GA, Johnson DH, Berg WE (2003) Sampling designs forcarnivore scent-station surveys. J Wildl Manage 67:289–298
Smith WP, Borden DL, Endres KM (1994) Scent-station visits as anindex to abundance of raccoons: an experimental manipulation. JMammal 75:637–647
Sobrino R, Acevedo P, Escudero MA, Marco J, Gortázar C (2009)Carnivore population trends in Spanish agrosystems after thereduction in food availability due to rabbit decline by rabbit
haemorrhagic disease and improved waste management. Eur JWildl Res 55:161–165
Soriano A (1983) Deserts and semi-deserts of Patagonia. In: West NE(ed) Temperate deserts and semideserts. Elsevier, Amsterdam, pp423–459
Steidl RJ, Hayes JP, Schauber E (1997) Statistical power analysis inwildlife research. J Wildl Manage 61:270–279
Stem C, Margoluis R, Salafsky N, Brown M (2005) Monitoring andevaluation in conservation: a review of trends and approaches.Conserv Biol 19:295–309
Taylor BL, Gerrodette T (1993) The uses of statistical power inconservation biology: the Vaquita and northern Spotted Owl.Conserv Biol 7:489–500
Thomas L, Juanes F (1996) The importance of statistical poweranalysis: an example from animal behaviour. Anim Behav52:856–859
Thomas L, Krebs CJ (1997) A review of statistical power analysissoftware. Bull Ecol Soc Am 78:126–139
Thompson WL, White GC, Gowan C (1998) Monitoring vertebratepopulations. Academic Press, San Diego
Travaini A, Laffitte R, Delibes M (1996) Determining the relativeabundance of European red foxes by scent-station methodology.Wildl Soc Bull 24:500–504
Travaini A, Zapata SC, Martínez-Peck R, Delibes M (2000)Percepción y actitud humanas hacia la predación de ganadoovino por el zorro colorado (Pseudalopex culpaeus) en SantaCruz, Patagonia Argentina. Mastozool Neotrop 7:117–129
Travaini A, Martínez-Peck R, Zapata SC (2001) Selection of odorattractants and meat delivery methods to control Culpeo foxes(Pseudalopex culpaeus) in Patagonia. Wildl Soc Bull 29:1089–1096
Travaini A, Zapata SC, Zoratti C, Soria G, Escobar F, Aguilera G,Collavino P (2003a) Diseño de un programa de seguimiento depoblaciones de cánidos silvestres en ambientes esteparios de laPatagonia, Argentina. Acta Zool Mex 90:1–14
Travaini A, Pereira J, Martínez-Peck R, Zapata SC (2003b) Monitoreode zorros colorados (Pseudalopex culpaeus) y grises (Pseudalo-pex griseus) en Patagonia: diseño y comparación de dos métodosalternativos. Mastozool Neotrop 10:277–291
Travaini A, Bustamante J, Rodríguez A, Zapata S, Procopio D,Pedrana J, Martínez-Peck R (2007) An integrated framework tomap animal distributions in large and remote regions. DiversDistrib 13:289–298
Webbon CC, Baker PJ, Harris S (2004) Faecal density counts formonitoring changes in red fox numbers in rural Britain. J ApplEcol 41:768–779
Zielinski WJ, Stauffer HB (1996) Monitoring Martes populations inCalifornia: survey design and power analysis. Ecol Appl 6:1254–1267
Zielinski WJ, Truex RL, Schlexer FV, Campbell LA, Carroll C (2005)Historical and contemporary distributions of carnivores in forestsof the Sierra Nevada, California, USA. J Biogeogr 32:1385–1407
Eur J Wildl Res (2010) 56:421–433 433