
A model for non–Fickian moisture transfer in wood · A model for non–Fickian moisture transfer...
22
A model for non–Fickian moisture transfer in wood ∗ Kristian Krabbenhoft Department of Civil Engineering Technical University of Denmark DK-2800 Lyngby, Denmark Lars Damkilde Institute of Chemistry and Applied Engineering Science Aalborg University Esbjerg DK-6700 Esbjerg, Denmark Abstract A model for non-Fickian moisture transfer in wood is presented. The model considers the transfer of water vapour separate from the transfer of bound water. These two components are linked by an equa- tion describing the sorption on the cell wall level. Hereby, a formulation capable of describing known non-Fickian effects, including the effects of step size, absolute moisture content, and sample length, is achieved. The sorption curves predicted by the model are compared with experimental results and good agreement is found. Keywords Wood, non-Fickian, moisture, sorption, coupled transfer. 1 Introduction The mathematical description of the transfer of moisture in wood below the fiber saturation point is often made using two basic assumptions. Firstly, that the moisture flux can be described by a Fickian type gradient law, and secondly that the bound water in the cell walls is at all times in equilibrium with the surrounding mixture of vapour and air as described by the sorption isotherm. In one dimensional isothermal transfer the moisture flux j is given by j = D m dm dx (1) where m is the moisture content and D m a moisture dependent diffusion coefficient. Using the equilibrium assumption this expression can, alternatively, be formulated with the relative humidity r as potential j = D m dm dx = D m ( dm dr ) dr dx = D r dr dx (2) where the diffusion coefficient with r as potential is given by D r = D m ( dm dr ) (3) * Published in Materials and Structures, 37, 615–622, 2004. 1
Transcript of A model for non–Fickian moisture transfer in wood · A model for non–Fickian moisture transfer...

A model for non–Fickian moisture transfer in wood∗
Kristian KrabbenhoftDepartment of Civil EngineeringTechnical University of Denmark
DK-2800 Lyngby, Denmark
Lars DamkildeInstitute of Chemistry and Applied Engineering Science
Aalborg University EsbjergDK-6700 Esbjerg, Denmark
Abstract
A model for non-Fickian moisture transfer in wood is presented. The model considers the transfer ofwater vapour separate from the transfer of bound water. These two components are linked by an equa-tion describing the sorption on the cell wall level. Hereby, a formulation capable of describing knownnon-Fickian effects, including the effects of step size, absolute moisture content, and sample length, isachieved. The sorption curves predicted by the model are compared with experimental results and goodagreement is found.
Keywords
Wood, non-Fickian, moisture, sorption, coupled transfer.
1 Introduction
The mathematical description of the transfer of moisture in wood below the fiber saturation point is oftenmade using two basic assumptions. Firstly, that the moisture flux can be described by a Fickian typegradient law, and secondly that the bound water in the cell walls is at all times in equilibrium with thesurrounding mixture of vapour and air as described by the sorption isotherm.In one dimensional isothermal transfer the moisture flux j is given by
j = Dmdmdx
(1)
where m is the moisture content and Dm a moisture dependent diffusion coefficient. Using the equilibriumassumption this expression can, alternatively, be formulated with the relative humidity r as potential
j = Dmdmdx
= Dm
(dmdr
)drdx
= Drdrdx
(2)
where the diffusion coefficient with r as potential is given by
Dr = Dm
(dmdr
)(3)
∗Published in Materials and Structures, 37, 615–622, 2004.
1

Roman lettersD Diffusion coefficientE Fractional weight increaseh Sorption term (kg m−3 s−1 Pa−1)j Flux (kg m−2 s−1)m Moisture content (MC) (kg m−3)m Sorption term (kg m−3 s−1)p Pressure (Pa)r Relative humidity (RH)R Gas constant (J mol−1 K−1)T Temperature (K)w Bound water content (kg m−3)
Greek lettersφ Porosityρ Concentration (kg/m3)ζ Internal area/volume ratio (m−1)ξ Vapour diffusivity reduction factor
Sub– and superscriptsa Aireff Effectiveg Gas – air + vapourL LongitudinalT Tangentialv Vapour
Table 1: Nomenclature
By mass conservation considerations unsteady state conditions can then be described by either of the twofollowing partial differential equations
∂m
∂t=
∂
∂x
(Dm
∂m
∂x
)or c
∂r
∂t=
∂
∂x
(Dr
∂r
∂x
)(4)
where c = dm/dr is the slope of the sorption isotherm.In the following, the shortcomings of this so–called Fickian model are discussed. An alternative model isthen proposed and the capabilities of this model are demonstrated by comparison to experimental results.
2 Failure of Fickian models
As already discussed the Fickian models rely upon two basic assumptions, namely that the transfer ofmoisture is governed by a Fickian type gradient law and that within the wood there exists an equilibriumstate such that the moisture content is at all times a unique function of the corresponding relative humidityas given by the sorption isotherm.The first assumption that the flux of some quantity can be taken as being proportional to the gradient of this
2

quantity by some scalar D is probably reasonable, at least as a first approximation and especially whendealing with a relatively slow transfer under isothermal conditions. However, the second assumption thatthere is instantaneous equilibrium between the bound water and the water vapour at all times is harder tojustify.Considering in more detail the mechanisms of moisture transfer in the hygroscopic range this must consistof a diffusive, and possibly convective, transfer of water vapour in the cellular structure with simultaneoussorption in the cell walls. In addition, bound water may be transferred within the cell walls by diffusion.Thus, in general the validity of the equilibrium assumption depends on the rate of the diffusive and con-vective processes in relation to the rate of sorption. If, for example, the resistance to vapour transfer withinthe wood is very small it is the rate of sorption that will govern the overall process. Conversely, in the caseof a high vapour resistance it is the transport of vapour to the sorption sites which will be determining forthe overall behaviour.In many cases the latter scenario is predominant and either of the Fickian models (4) may be applied.There are, however, also cases where the results obtained with the diffusion equation can not be made tofit the experimental data. Such measurements have been made by Wadso [1]. These experiments, whichwere conducted on one-dimensional samples with half lengths of 4.8 mm to 11.4 mm, show among othersthings a dimensional dependence such that if the moisture transfer is to be described by (4) the diffusioncoefficient must be made to vary with the length of the sample. This is illustrated in Figure 1. In Figure1 (a) the results of two sorption experiments with samples of different length are shown. The sampleswere initially in equilibrium with 54% relative humidity and then subjected to a step increase to 75% RH.In the figure the relative weight increase in shown as a function of the square root of time divided by therespective sample lengths. If diffusion was the dominant mechanism involved the two experimental curvesshould be superimposed on each other, even in the case of a moisture dependent diffusion coefficient, seee.g. Crank [2]. As is clearly seen this is not the case. If, nevertheless, diffusion is assumed valid this wouldimply a sample length dependent diffusion coefficient, which is clearly unacceptable from a physical pointof view.In Figure 1 (b) the results of the same type of experiment is shown, now for a step increase in relativehumidity from 75% to 84% and, as can be seen, the situation becomes even more extreme in this case.Apart from the suggestion that the diffusion coefficient should be moisture dependent, the most com-monly mentioned cause of the discrepancies is probably that there could be a finite surface resistance at
0 20 40 600
0.2
0.4
0.6
0.8
1
t½/a (s½/mm)
Fra
ctio
nal w
eigh
t inc
reas
e
a/2 = 6.7 mma/2 = 11.4 mm
(a) RH = 54%→75%
0 50 100 1500
0.2
0.4
0.6
0.8
1
t½/a (s½/mm)
Fra
ctio
nal w
eigh
t inc
reas
e
a/2 = 6.7 mma/2 = 11.4 mm
(b) RH = 75%→84%
Figure 1: Failure of Fickian models by non-Fickian sample length dependence.
3

the ends of the sample. In general this is of course a valid point. However, the air velocity used by Wadsowas 3 m/s which by Rosen [3] has been shown experimentally to be close to the upper limit at whichsurface resistance has any effect. Furthermore, in a series of experiments conducted by Christensen [4]the atmospheric air was evacuated from the sorption chamber such that the samples were subjected to anenvironment of pure vapour. Under these conditions surface resistance can be assumed to be very close tozero, but still the results produced showed significant deviation from what one would expect on the basisof a diffusion model.
In addition to the obvious discrepancies involved when considering samples of different lengths, anotherand more fundamental concern is that the sorption curves produced experimentally look very differentfrom what would be expected from Fickian diffusion. This is illustrated in Figure 2. In Figure 2 (a) thesorption curve is shown for a sample of half length equal to 11.4mm. The sample was subjected to astep change in relative humidity from 75% RH to 84% RH. As can be seen the sorption curve displaysan abrupt change in slope very early on around a fractional weight increase of E = 0.2. This is very un-characteristic of Fickian process, again, even if the diffusivity varies with moisture content. Such Fickianprocesses are shown in Figure 2 (b) where the results of three different simulations with different moisturedependent diffusion coefficients were used. First a constant diffusion coefficient was used after which twosimulations with exponentially increasing and decreasing coefficients were performed. In these nonlin-ear computations the coefficients were varied by a factor of 3 (even though this is much more than canbe justified within the relatively small sorption step of 75%–84% RH). As can be seen these curves differqualitatively only slightly from the results obtained by a constant diffusivity: up to approximately E = 0.6the slope of all three curves are approximately linear, after which the sorption rates decrease in a smoothmanner.Although this demonstration does not constitute a mathematical proof of the impossibility of sorptionbeing a Fickian process, it does illustrate the difficulties involved with fitting experimental results to aFickian model.
In Wadso [5] different alternative models for predicting the above mentioned sorption response are re-viewed. It is, however, concluded that none of the models are able to capture all of the effects which havebeen observed experimentally. We believe this in part be due to the fact that the resulting anomalous sorp-tion behaviour is a result of anomalies on different levels. If the bound water–water vapour equilibrium
0 500 1000 1500 2000 25000
0.2
0.4
0.6
0.8
1
Time½ (s½)
Fra
ctio
nal w
eigh
t inc
reas
e
(a)
0 500 1000 1500 2000 25000
0.2
0.4
0.6
0.8
1
Time½ (s½)
Fra
ctio
nal w
eigh
t inc
reas
e
ConstantIncreasingDecreasing
(b)
Figure 2: Failure of Fickian models. Experimental (a) and theoretical (b) sorption curves.
4

assumption is abandoned it is obvious that the overall behaviour will be influenced by the rate of vapourtransfer to the rate of sorption. If vapour transfer is a faster process than sorption then the length of thesample will naturally influence the results in a way which is not predicted by a simple global diffusionequation. However, on the cell wall level a number of other anomalies have been observed. Christensen[4] performed adsorption measurements on single cell walls and found that large steps in relative humiditygave faster sorption rates than did smaller steps in a way which was inconsistent with what a diffusionmodel would predict. Furthermore, the sorption responses for cell walls of different thickness were almostidentical indicating that diffusion is not the governing mechanism for cell wall sorption. Similar conclu-sions were drawn in [6, 7, 8, 9].In the following, both the effects on the cell wall level and the effect of separating the water vapour fromthe bound water are considered. The result is a non-equilibrium Fickian model, that is, a model wherethe vapour pressure is not necessarily in equilibrium with the bound water content at all times, but whereFick’s law is used throughout to describe diffusive transfer of both bound water within the cell walls andwater vapour and air in the lumens.
Figure 3: Moisture transfer model.
3 Non-equilibrium Fickian model
With the considerations of the previous section in mind a model has been formulated where the transfer ofwater vapour is considered independently from the transfer of bound water in the cell walls, see Figure 3.The cell wall moisture content is linked to the vapour pressure in the lumens by a term equivalent to thatdescribing the transfer of vapour from a wet surface. Similar models have previously been formulated byCunningham [10], Salin [11], and Absetz and Koponen [12].The model presented here refers only to the one–dimensional isothermal case. However, inclusion ofadditional phases such as free water and dry air is straight forward, as is the extension to two and threespatial dimensions.
5

3.1 Bound water
The flow of bound water in the cell walls is assumed to be a diffusive process, Siau [13], governed by thefollowing equation
∂w
∂t=
∂
∂x
(Dw
∂w
∂x
)+ m (5)
where w is the mass of water per unit volume of gross wood (kg/m3), Dw is the corresponding diffusioncoefficient. The sorption term m accounts for the interchange between bound water and water vapor, seeFigure 3. This quantity will be positive in adsorption.That the transfer of bound water within the cell walls is a diffusive process has been rendered probableby Stamm [11] who measured longitudinal bound water diffusion of Picea Sitchensis cell wall substance.Although several discrepancies have been reported, such as a difference between steady state and transientmeasurements, different values in adsorption and desorption and a possible influence of moisture inducedstresses, Comstock [12], we shall make the assumption of the bound water transfer being a diffusiveprocess with the diffusion coefficient depending solely on the moisture content and temperature.
3.2 Water vapour
The conservation equation for water vapour is given by
φ∂ρv∂t
=∂j
∂x− m (6)
where ρv is the vapour concentration, φ the porosity and j the flux. Since any bound water released fromthe cell walls will appear as water vapour, the sorption term m is again included.Using Fick’s law the flux of vapour is given by
j = −ρgDeffva
ddx
(ρvρg
)(7)
where ρg is the concentration of total gas, i.e. water vapour and dry atmospheric air, and Deffva is the
effective vapour diffusivity which can be related to the diffusivity of water vapour in stall air as
Deffva = ξDva, 0 ≤ ξ ≤ 1 (8)
where the reduction factor ξ accounts for the resistance within the wood stemming from its porous struc-ture. For Dva several empirical expressions are available, e.g. Schirmer [14],
Dva = 2.31× 10⁻⁵ papa + pv
(T
273.16
)1.81
(9)
where pa is the air pressure, in this case the atmospheric pressure, and T the absolute temperature.If the concentration of vapour is much smaller than the concentration of total gas as is the case undermoderate temperatures, Fick’s law (7) reduces to the well–known form
j = −Deffva
dρvdx
(10)
By combining (6) and (10) and assuming isothermal conditions the governing equation for vapour transfercan be written in terms of pressure as
φ∂pv∂t
=∂
∂x
(Deff
va
∂pv∂x
)− m (11)
6

3.3 Cell wall sorption
As already mentioned the coupling between the bound water and the water vapour is assumed to followa type of surface mass transfer relation. From the mass transfer of vapour from a saturated surface thefollowing relation is known [15]
m = h(pv − pw) (12)
where pw is the vapour pressure at the saturated surface, pv is the vapour pressure in the surrounding airand h is the mass transfer coefficient. For the case of transfer between the lumens and the cell walls ananalogous relation is assumed. In the works of Cunningham [10], Salin [11], and Absetz and Koponen[12], h was assumed constant within the RH-step in question. The assumption of a constant h, however,has some consequences which are in conflict with the findings of Christensen [4], who listed three majorpoints:
1. For steps of identical magnitude in MC, e.g. 5% MC to 10% MC and 12% MC to 17% MC, thesorption rates were lower for steps in the higher MC–range.
2. For steps of different magnitude but with the same final MC, e.g. 5% MC to 10% MC and 8% MCto 10% MC, the sorption rates were lower for the smaller steps.
3. When starting from a completely dry sample the effect of step size was cancelled, such that a stepfrom 0% MC to 5% gave the same qualitative response as a step from 0% MC to 10% MC.
These statements are also valid if RH is substituted for MC, i.e. the shape of the sorption isotherm doesnot help to explain the anomalies.The first of the above points can be accommodated by making h depend on the moisture content, andassuming a constant h within steps of relatively small magnitude is thus reasonable. But the effect thatlarger steps should result in higher sorption rates than smaller steps cannot be captured by assuming aconstant value of h. To see this, consider a sorption process governed by the equation
m =dmdt
= h0(m∞ −m) (13)
where m∞ is the target moisture content. The solution is given by
m = m∞ − c e−h0t (14)
where c is a constant of integration determined by the initial moisture content m0. The relative moistureuptake is given by
E =m−m0
m∞ −m0= 1− c e−h0t
m∞ −m= 1− e−h0t (15)
from which it is clearly seen that the step size effect cannot be modeled using a constant value of h.A possible interpretation of the step size effect is that close to equilibrium there is an additional resistanceto moisture uptake. This is the possibility explored in the following. As a measure of the proximity toequilibrium some function of the ratio of the actual moisture content to the target moisture content maybe used. Thus, one possibility of including the increased resistance close to equilibrium would be
dmdt
= h (m∞ −m) in adsorption (m∞ > m) (16)
where
h =
h0 (1−m/m∞) in adsorption (m∞ > m)
h0 (1−m∞/m) in desorption (m∞ < m)(17)
7

0 2 4 60
0.2
0.4
0.6
0.8
1
Time [(h0 t)½]
Fra
ctio
nal m
oist
ure
upta
ke m0 = 0.0
0.6 0.8 0.9
m∞ = 1.0
Figure 4: Sorption curves for steps of different magnitude.
and h0 is a constant. Considering the case of adsorption the solution to (16) is
m =h0t(m∞ −m0)m∞ +m0m∞
h0t(m∞ −m0) +m∞(18)
or in terms of fractional moisture uptake
E =(1−m0/m∞)h0t
1 + (1−m0/m∞)h0t(19)
Clearly, the closer m0 is to m∞ the slower the sorption will be. This is illustrated in Figure 4. More in-terestingly, however, is that when m0 = 0, i.e. when starting from a completely dry sample, the fractionalweight increase reduces to
E =h0t
1 + h0t(20)
which is independent of the final moisture content and thereby the step size. This will generally be thecase for all relations of the type
dmdt
= f(m/m∞) (m∞ −m) (21)
and thus, using m/m∞ as a measure of the proximity to equilibrium has the obvious advantage that theobserved behaviour of the canceling of step size effects when starting from completely dry conditions isincluded directly in the expression for h.
3.3.1 Relation of adsorption to swelling
In the above, the equilibrium proximity measure was introduced on the grounds of mathematical argu-ments. There are, however, also indications that this variable has a deeper physical significance. In theworks of Christensen, and later also by Skaar et al. [16], it was argued that the only plausible explanationfor the behaviour was to be found in the swelling which accompanies adsorption. That is, as the woodtakes up moisture it swells which, until a stress relaxation has taken place, slows down the sorption ofadditional water molecules. In analogy with the osmotic pressure equation, Katz [17] originally proposed
8

that the maximum swelling pressure exerted by an elastic gel when the surrounding vapour pressure israised from some value p0 to the saturation vapour pressure of the gel psat would be
Π = −ρwRT
Mwln
(p0psat
)(22)
where ρw is the density of water and Mw the molecular weight. Later Barkas [18] extended this equationto be valid for any pair of vapour pressures pi and pf
Π = −ρwRT
Mwln
(pi
pf
)(23)
where subscripts i and f indicate the initial and final states respectively. Christensen [4] further exploredexperimentally the possibility of a relation between sorption and swelling and found that the half–time tosorption was approximately inversely proportional to ln(pi/pf), i.e.
√t0.5 ≃
a
− ln(pipf
) (24)
where a is a constant. This result was interpreted such that the higher potential swelling pressure availablethe faster the relaxation, and thereby the sorption, will be.As also admitted by Christensen, the choice of using the half–time to sorption is somewhat arbitrary andnot particularly representative of the whole sorption process. However, the results do indicate that thevariable ln(pi/pf) could be of vital importance in describing the sorption process.
3.3.2 Application to wood
In the particular case of wood, a similar expression may be used. The equilibrium proximity measure canbe taken as the ratio between the equilibrium vapour pressure pw(w) corresponding to a given moisturecontent w as defined by the sorption isotherm and the actual vapour pressure pv. Thus, the term m in (5)has the following principal appearance
m = h
(pwpv
, w,∂w
∂t, T, . . .
)(pw − pv) (25)
where the influence of the absolute magnitude of the moisture content and temperature have been in-cluded. Also, the expressions for h should be different in adsorption and desorption as already discussed.Concerning the expression for h in adsorption it can be deduced from the results published by Christensen[4] and Wadso [1] the h should be relatively large in the beginning of the sorption process, i.e. whenfar from equilibrium. This is followed by a rapid decrease as equilibrium is approached, where the pointat which h begins to decrease abruptly is determined by the absolute moisture content. An analyticalexpression able to describe these characteristics is given by
h = c1 exp
(−c2
(pwpv
)c3)+ c4 (26)
Whereas this expression contains four parameters which may be adjusted independently we have foundthat only the parameter c2 needs to be made dependent on the moisture content in order to fit the ex-perimental results of Wadso [1] satisfactorily. By varying c2 a family of curves as shown in Figure 5 isobtained.As indicated in the figure the maximum value of h is approximately h = 2 × 10⁻⁶ kg m−3s−1Pa−1.
9

0.7 0.8 0.9 10
0.5
1
1.5
2
2.5x 10
-6
pw/pv
h
(kgm
-3P
a-1s-1
)
c2 =103 102 10 5
(a)
40 50 60 700
10
20
30
40
50
60
70
w (kgm-3)
c2
Presently used variationPresently used variationPresently used variation
Continuous variation
(b)
Figure 5: Variation of h with c2 and pv/pw (a) and variation of c2 with absolute moisture content w (b).
This value may be compared to the value of the surface evaporation coefficient kp which has a typicalvalue of around kp = 5 × 10⁻⁸ kg m−3s−1Pa−1 [15]. The evaporation per unit volume of internal sur-face should then be at most ζkp(pw − pv) where ζ is the internal surface area per unit volume. Fortypical softwoods this may be taken as approximately ζ = 105 m−1 giving a maximum value of h ofhmax = ζkp ≃ 5 × 10⁻³ kg m−3s−1Pa−1. This is well above the maximum value actually used, sug-gesting that the process of sorption is more complicated and involves other mechanism with much highertimes scales than evaporation/condensation.Since the approach to equilibrium should be slower with higher moisture contents, c2 has to increase withincreasing w. As seen the curves have been constructed such that h is near constant for low values ofpw/pv. Whether this can be experimentally justified is of course an open question. It is, however, anattractive feature to be able to recover the basic surface evaporation equation in the limit of small valuesof pw/pv.
4 Results
In the following a number of sorption simulations are performed and the results compared to those ofWadso [1].In all the simulations we use c1 = 2.6×10⁻⁶ kg m−3s−1Pa−1, c3 = 50, and c4 = 8.0×10⁻⁸ kg m−3s−1Pa−1.The coefficient c2 should in principle increase continuously with increasing moisture content in a mannersimilar to what is shown in Figure 5 (b). However, at this point there is not sufficient experimental dataavailable to establish such a curve and we have therefore chosen to keep c2 constant within the two mois-ture ranges considered. In the first series of experiments the relative humidity is changed from 54% to75%, whereas in the second series it is varied from 75% to 84%. The corresponding values of c2 that havebeen used are c2 = 8.0 and c2 = 40.0 respectively.Also the water vapour diffusion coefficients are kept constant within each MC-range. In Table 2 the valuesused in the simulations are compared to values found by Siau [13] on the basis of a geometrical model ofthe cellular structure of a typical softwood. The latter values have been converted into equivalent diffusioncoefficients with vapour pressure as potential. As can be seen, the values used in the simulations are in
10

all cases within the ranges determined by Siau [13]. In the model of Siau the resistance to vapour flow
Transverse LongitudinalRH (%) ξ (Siau [13]) ξ (Present) ξ (Siau [13]) ξ (Present)54–75 156–56 130 2.8–1.7 1.775–84 56–28 30 1.7–1.5 1.7
Table 2: Values of ξ = Dva/Deffva of Siau and values used in the present simulations.
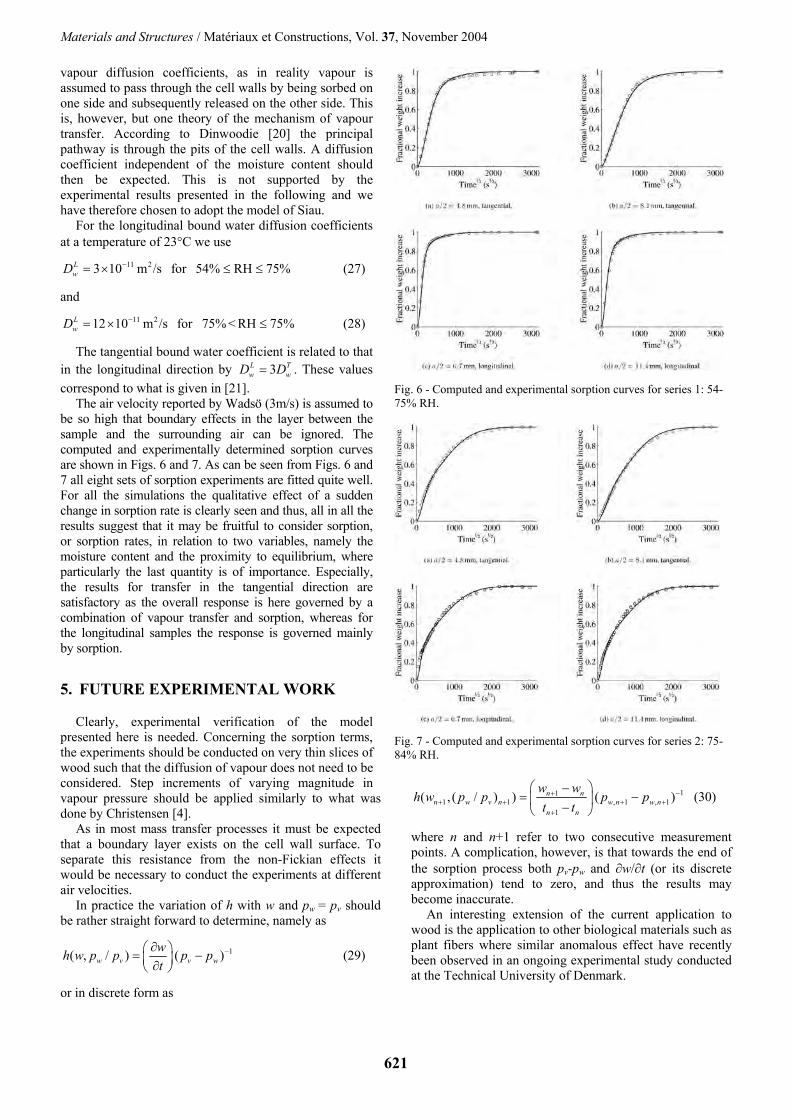
comprises cell lumens as well as cell walls. Thus, strictly speaking, the coefficients can only be regardedas apparent vapour diffusion coefficients, as in reality vapour is assumed to pass through the cell walls bybeing sorped on one side and subsequently released on the other side. This is, however, but one theoryof the mechanism of vapour transfer. According to Dinwoodie [19] the principal pathway is through thepits of the cell walls. A diffusion coefficient independent of the moisture content should then be expected.This is not supported by the experimental results presented in the following and we have therefore chosento adopt the model of Siau.For the longitudinal bound water diffusion coefficients at a temperature of 23◦C we use
DLw = 3× 10⁻¹¹ m2/s for RH in the range of 54% to 75% (27)
andDL
w = 12× 10−11 m2/s for RH in the range of 75% to 84% (28)
The tangential bound water coefficient is related to that in the longitudinal direction by DLw = 3DT
w . Thesevalues correspond to what is given in [20].The air velocity reported by Wadso (3m/s) is assumed to be so high that boundary effects in the layerbetween the sample and the surrounding air can be ignored. The computed and experimentally determinedsorption curves are shown in Figures 6 and 7. As can be seen from Figures 6 and 7 all eight sets ofsorption experiments are fitted quite well. For all the simulations the qualitative effect of a sudden changein sorption rate is clearly seen and thus, all in all the results suggest that it may be fruitful to considersorption, or sorption rates, in relation to two variables, namely the moisture content and the proximity toequilibrium, where especially the last quantity is of importance. Especially, the results for transfer in thetangential direction are satisfactory as the overall response is here governed by a combination of vapourtransfer and sorption, whereas for the longitudinal samples the response is governed mainly by sorption.
5 Future experimental work
Clearly, experimental verification of the model presented here is needed. Concerning the sorption terms,the experiments should be conducted on very thin slices of wood such that the diffusion of vapour doesnot need to be considered. Step increments of varying magnitude in vapour pressure should be appliedsimilarly to what was done by Christensen [4]. As in most mass transfer processes it must be expected thata boundary layer exists on the cell wall surface. To separate this resistance from the non–Fickian effectsit would be necessary to conduct the experiments at different air velocities.In practice the variation of h with w and pw/pv should be rather straight forward to determine, namely as
h(w, pw/pv) =
(∂w
∂t
)(pv − pw)
−1 (29)
11

0 1000 2000 30000
0.2
0.4
0.6
0.8
1
Time½ (s½)
Fra
ctio
nal w
eigh
t inc
reas
e
(a) a/2 = 4.8mm, tangential.
0 1000 2000 30000
0.2
0.4
0.6
0.8
1
Time½ (s½)
Fra
ctio
nal w
eigh
t inc
reas
e
(b) a/2 = 8.1mm, tangential.
0 1000 2000 30000
0.2
0.4
0.6
0.8
1
Time½ (s½)
Fra
ctio
nal w
eigh
t inc
reas
e
(c) a/2 = 6.7mm, longitudinal.
0 1000 2000 30000
0.2
0.4
0.6
0.8
1
Time½ (s½)
Fra
ctio
nal w
eigh
t inc
reas
e
(d) a/2 = 11.4mm, longitudinal.
Figure 6: Computed (-----) and experimental [1] sorption curves (◦) for series 1: 54% to 75% RH.
or in discrete form as
h(wn+1, (pw/pv)n+1) =
(wn+1 − wn
tn+1 − tn
)(pv,n+1 − pw,n+1)
−1 (30)
where n and n+1 refer to two consecutive measurement points. A complication, however, is that towardsthe end of the sorption process both pv − pw and ∂w/∂t (or its discrete approximation) tend to zero, andthus the results may become inaccurate.An interesting extension of the current application to wood is the application to other biological materialssuch as plant fibers where similar anomalous effect have recently been observed in an ongoing experimen-tal study conducted at the Technical University of Denmark.
6 Conclusions
A new model for the transfer of moisture in wood in the hygroscopic range has been formulated. With thismodel all the common non-Fickian effects reported in the literature can be explained. This is demonstrated
12

0 1000 2000 30000
0.2
0.4
0.6
0.8
1
Time½ (s½)
Fra
ctio
nal w
eigh
t inc
reas
e
(a) a/2 = 4.8mm, tangential.
0 1000 2000 30000
0.2
0.4
0.6
0.8
1
Time½ (s½)
Fra
ctio
nal w
eigh
t inc
reas
e
(b) a/2 = 8.1mm, tangential.
0 1000 2000 30000
0.2
0.4
0.6
0.8
1
Time½ (s½)
Fra
ctio
nal w
eigh
t inc
reas
e
(c) a/2 = 6.7mm, longitudinal.
0 1000 2000 30000
0.2
0.4
0.6
0.8
1
Time½ (s½)
Fra
ctio
nal w
eigh
t inc
reas
e
(d) a/2 = 11.4mm, longitudinal.
Figure 7: Computed (-----) and experimental [1] sorption curves (◦) for series 2: 75% to 84% RH.
by reproducing a set of eight different sorption experiments. The model has been implemented in a generalfinite element framework where the extension to multiple spatial dimensions is straight forward.Further experimentation is still necessary, both in order to verify the model presented here as well as tostudy the influences of temperature and the response in desorption in relation to the response in adsorption.
References
[1] L. Wadso. Unsteady-state waper vapour adsorption in wood: An experimental study. Wood andFiber Science, 6(1), 36–, (1994).
[2] J. Crank. The Mathematics of Diffusion. Oxford University Press, London, (1967).
[3] H.-N. Rosen. The influence of external resistance on moisture adsorption rates in wood. Wood andFiber Science, 10(3), 218–228, (1978).
13

[4] G. N. Christensen. The rate of sorption by thin materials. In A. Wexler and P. A. Winn, editors,Humidity and Moisture, volume 4, pages 279–293, Reinhold Pub. Corp., N.Y. (1965).
[5] L. Wadso. Describing non-Fickian water-vapour sorption in wood. Journal of Materials Science,29, 2367–2372, (1994).
[6] G. N. Christensen. The rate of sorption by wood and pulp. Appita, 13, 112–123, (1959).
[7] G. N. Christensen and K. E. Kelsey. Die Sorption von Wasserdampf durch die chemichem Be-standteile des Holzes. Holz als Roh- und Werkstoff, 17(5), 178–188, (1959).
[8] G. N. Christensen and K. E. Kelsey. Die Geschwindigkeit der Wasserdampfsorption durch Holz.Holz als Roh- und Werkstoff, 17(5), 189–203, (1959).
[9] M. W. Kelly and C. A. Hart. Water sorption rates by wood cell walls. Wood and Fiber Science, 1,270–282, (1970).
[10] M. J. Cunningham. A model to explain ”anomalous” moisture sorption in wood under step functiondriving forces. Wood and Fiber Science, 27(3), 265–277, (1996).
[11] J.-G. Salin. Mass transfer from wooden surfaces and internal moisture non-equilibrium. DryingTechnology, 14(10), 2213–2224, (1996).
[12] I. Absetz and S. Koponen. Fundamental diffusion behaviour of wood. In P. Hoffmeyer, editor,International Conference on Wood-Water Relations, pages 89–106, Copenhagen, Denmark. COSTAction E8. Mechanical Performance of Wood and Wood Products, (1996).
[13] J. F. Siau. Transport Processes in Wood. Springer-Verlag, Berlin, (1984).
[14] R. Schirmer. Die diffusionszahl von wasserdampf-luftgemischem und die verdampfungs-geschwindigkeit. VDI Beihaft Verfahrestechnik, 6, 170, (1938).
[15] L. Wadso. Studies of Water Vapor Transport and Sorption in Wood. Doctoral Dissertation, ReportTVBM-1013, Lund University, Lund, Sweden, (1993).
[16] C. Skaar, C. Prichananda, and R. W. Davidson. Some aspects of moisture sorption dynamics inwood. Wood Science, 2(3), 179–185, (1970).
[17] J. R. Katz. Gesetze der quellung. Kolloidchemische Beihefte, 9, 1–182, (1917).
[18] W. W. Barkas. The Swelling of Wood under Stress. His Majesty’s Stationery Office, London, (1949).
[19] J. M. Dinwoodie. Timber, its nature and behaviour. Van Norstrand Reinhold, New York, (1981).
[20] C. Skaar. Wood-Water Relations. Springer-Verlag, Berlin, (1988).
14

Materials and Structures / Matériaux et Constructions, Vol. 37, November 2004, pp 615-622
1359-5997/04 © RILEM 615
ABSTRACT A model for non-Fickian moisture transfer in wood is
presented. The model considers the transfer of water vapour separate from the transfer of bound water. These two components are linked by an equation describing the sorption on the cell wall level. Hereby, a formulation capable of describing known non-Fickian effects, including the effects of step size, absolute moisture content, and sample length, is achieved. The sorption curves predicted by the model are compared with experimental results and good agreement is found.
RÉSUMÉ Un modèle pour le transfert non-Fickien d'humidité dans
le bois est présenté. Le modèle considère le transfert de la vapeur d'eau séparé pour le transfert de l'eau liée. Ces deux composants sont liés par une équation décrivant la sorption au niveau de mur de cellules. Par ceci, une formulation capable de décrire des effets non-Fickian connus, comprenant les effets de la taille d'étape, le contenu d’humidité absolu, et la longueur d'échantillon, est réalisée. Les courbes de sorption prévues par le modèle sont comparées aux résultats expérimentaux et une bonne concordance est trouvée.
1. INTRODUCTION
The mathematical description of the transfer of moisture in wood below the fiber saturation point is often made using two basic assumptions. Firstly, that the moisture flux can be described by a Fickian type gradient law, and secondly that the bound water in the cell walls is at all times in equilibrium with the surrounding mixture of vapour and air as described by the sorption isotherm.
In one dimensional isothermal transfer the moisture flux j is given by
ddmmj Dx
(1)
where m is the moisture content and Dm a moisture dependent diffusion coefficient. Using the equilibrium assumption this expression can, alternatively, be formulated with the relative humidity r as potential as
m m rdm dm dr drj D D Ddx dr dx dx
(2)
where the diffusion coefficient with r as potential is given by
r mdmD Ddr
(3)
By mass conservation considerations unsteady state conditions can then be described by either of the two following partial differential equations
orm rm m r rD c Dt x x t x x
(4)
where c = dm/dr is the slope of the sorption isotherm. In the following, the shortcomings of this so-called
Fickian model are discussed. An alternative model is then proposed and the capabilities of this model are demonstrated by comparison to experimental results.
2. FAILURE OF FICKIAN MODELS
As already discussed the Fickian models rely upon two basic assumptions, namely that the transfer of moisture is governed by a Fickian type gradient law and that within the wood there exists an equilibrium state such that the moisture content is at all times a unique function of the corresponding relative humidity as given by the sorption isotherm.
K. Krabbenhoft1 and L. Damkilde2
(1) Department of Civil Engineering, Technical University of Denmark, DK-2800 Lyngby, Denmark Currently at: Department of Civil, Surveying and Environmental Engineering, University of Newcastle, NSW 2300, Australia (2) Institute of Chemistry and Applied Engineering Science, Aalborg University Esbjerg, DK-6700 Esbjerg, Denmark
A model for non-Fickian moisture transfer in wood
SCIE
NT
IFIC
RE
POR
T

Krabbenhoft, Damkilde
616
The first assumption that the flux of some quantity can be taken as being proportional to the gradient of this quantity by some scalar D is probably reasonable, at least as a first approximation and especially when dealing with a relatively slow transfer under isothermal conditions. However, the second assumption that there is instantaneous equilibrium between the bound water and the water vapour at all times is harder to justify.
Considering in more detail the mechanisms of moisture transfer in the hygroscopic range this must consist of a diffusive, and possibly convective, transfer of water vapour in the cellular structure with simultaneous sorption in the cell walls. In addition, bound water may be transferred within the cell walls by diffusion. Thus, in general the validity of the equilibrium assumption depends on the rate of the diffusive and convective processes in relation to the rate of sorption. If, for example, the resistance to vapour transfer within the wood is very small it is the rate of sorption that will govern the overall process. Conversely, in the case of a high vapour resistance it is the transport of vapour to the sorption sites which will be determining for the overall behaviour.
In many cases the latter scenario is predominant and either of the Fickian models (4) may be applied. There are, however, also cases where the results obtained with the diffusion equation can not be made to fit the experimental data. Such measurements have been made by Wadsö [1]. These experiments, which were conducted on one-dimensional samples with half lengths of 4.8 mm to 11.4 mm, show among others things a dimensional dependence such that if the moisture transfer is to be described by (4) the diffusion coefficient must be made to vary with the length of the sample. This is illustrated in Fig. 1. In Fig. 1 (a) the results of two sorption experiments with samples of different length are shown. The samples were initially in equilibrium with 54% relative humidity and then subjected to a step increase to 75% RH. In the figure the relative weight increase is shown as function of the square root of time divided by the respective sample lengths. If diffusion was the dominant mechanism involved the two experimental curves should be superimposed on each other, even in the case of a moisture dependent diffusion coefficient, see e.g. Crank [2]. As is clearly seen this is not the case. If, nevertheless, diffusion is assumed valid this would imply a sample length dependent diffusion coefficient, which is clearly unacceptable from a physical point of view.
In Fig. 1 (b) the results of the same type of experiment is shown, now for a step increase in relative humidity from 75% to 84% and, as can be seen, the situation becomes even more extreme in this case.
Apart from the suggestion that the diffusion coefficient should be moisture dependent, the most commonly mentioned cause of the discrepancies is probably that there could be a finite surface resistance at the ends of the sample. In general this is of course a valid point. However, the air velocity used by Wadsö was 3 m/s, which by Rosen [3] has been shown experimentally to be close to the upper limit at which surface resistance has any effect. Furthermore, in a series of experiments conducted by Christensen [4] the atmospheric air was evacuated from the sorption camber such that the samples were subjected to an
environment of pure vapour. Under these conditions surface resistance can be assumed to be very close to zero, but still the results showed significant deviation from what one would expect on the basis of a diffusion model.
In addition to the obvious discrepancies involved when considering samples of different lengths, another and more fundamental concern is that the sorption curves produced experimentally look very different from what would be expected from Fickian diffusion. This is illustrated in Fig. 2. In Fig. 2 (a) the sorption curve is shown for a sample of half length equal to 11.4 mm. The sample was subjected to a step change in relative humidity from 75% RH to 84% RH. As can be seen the sorption curve displays an abrupt change in slope very early on around a fractional weight increase of E = 0.2. This is very uncharacteristic of Fickian process, again, even if the diffusivity varies with moisture content. Such Fickian processes are shown in Fig. 2 (b) where the results of three different simulations with different moisture dependent diffusion coefficients were used. First a constant diffusion coefficient was used after which two simulations with exponentially increasing and decreasing coefficients were performed. In these nonlinear computations the coefficients were varied by a factor of 3 (even though this is much more than can be justified within
Fig. 1 (a) - Failure by non-Fickian length dependence.
Fig. 1 (b) - Failure by non-Fickian length dependence.

Materials and Structures / Matériaux et Constructions, Vol. 37, November 2004
617
the relatively small sorption step of 75% to 84% RH). As can be seen these curves differ qualitatively only slightly from the results obtained by a constant diffusivity: up to approximately E = 0.6 the slope of all three curves are approximately linear, after which the sorption rates decrease in a smooth manner.
Although this demonstration does not constitute a mathematical proof of the impossibility of sorption being a Fickian process, it does illustrate the difficulties involved with fitting experimental results to a Fickian model.
In Wadsö [5] different alternative models for predicting the above mentioned sorption response are reviewed. It is, however, concluded that none of the models are able to capture all of the effects which have been observed experimentally. We believe this in part be due to the fact that the resulting anomalous sorption behaviour is a result of anomalies on different levels. If the bound water-water vapour equilibrium assumption is abandoned it is obvious that the overall behaviour will be influenced by the rate of vapour transfer to the rate of sorption. If vapour transfer is a faster process than sorption then the length of the sample will naturally influence the results in a way which is not predicted by a simple global diffusion equation. However, on the cell wall level a number of other anomalies have been observed.
Christensen [4] performed adsorption measurements on single cell walls and found that large steps in relative humidity gave faster sorption rates than did smaller steps in a way, which was inconsistent with what a diffusion model would predict. Furthermore, the sorption responses for cell walls of different thickness were almost identical indicating that diffusion is not the governing mechanism for cell wall sorption. Similar conclusions were drawn in [6-9].
In the following, both the effects on the cell wall level and the effect of separating the water vapour from the bound water are considered. The result is a non-equilibrium Fickian model, that is, a model where the vapour pressure is not necessarily in equilibrium with the bound water content at all times, but where Fick’s law is used throughout to describe diffusive transfer of both bound water within the cell walls and water vapour and air in the lumens.
3. NON-EQUILBRIUM FICKIAN MODEL
With the considerations of the previous section in mind a model has been formulated where the transfer of water vapour is considered independently from the transfer of bound water in the cell walls, see Fig. 3. The cell wall moisture content is linked to the vapour pressure in the lumens by a term equivalent to that describing the transfer of vapour from a wet surface. Similar models have previously been formulated by Cunningham [10], Salin [11], and Absetz and Koponen [12].
The model presented here refers only to the one-dimensional isothermal case. However, inclusion of additional phases such as free water and dry air is straight forward, as is the extension to two and three spatial dimensions.
3.1 Bound water The flow of bound water in the cell walls is assumed to
be a diffusive process, Siau [13], governed by the following equation
ww wD mt x x
(5)
where w is the mass of water per unit volume of gross wood (kg/m3), Dw is the corresponding diffusion coefficient. The sorption term m accounts for the interchange between bound water and water vapour, see Fig. 3. This quantity will be positive in adsorption.
That the transfer of bound water within the cell walls is a diffusive process has been rendered probable by Stamm [11] who measured longitudinal bound water diffusion of
Fig. 2 (a) - Failure of Fickian models. Experimental curve.
Fig. 2 (b) - Failure of Fickian models. Theoretical curves.
Fig. 3 - Moisture transfer model.

Krabbenhoft, Damkilde
618
Picea Sitchensis cell wall substance. Although several discrepancies have been reported, such as a difference between steady state and transient measurements, different values in adsorption and desorption and a possible influence of moisture induced stresses, Comstock [12], we shall make the assumption of the bound water transfer being a diffusive process with the diffusion coefficient depending solely on the moisture content and temperature.
3.2 Water vapour The conservation equation for water vapour is given by
v j mt x
(6)
where v is the vapour concentration, the porosity and jthe flux. Since any bound water released from the cell walls will appear as water vapour, the sorption term m is again included.
Using Fick’s law the flux of vapour is given by
eff vg va
g
dj Ddx
(7)
where g is the concentration of total gas, i.e. water vapour and dry atmospheric air, and eff
vaD is the effective vapour diffusivity which can be related to the diffusivity of water vapour in stall air as
effva vaD D (8)
where the reduction factor accounts for the the resistance within the wood stemming from its porous structure. For
effvaD several empirical expressions are available, e.g.
Schirmer [14], 1.81
52.31 10273.16
ava
a v
p TDp p
(9)
where pa is the air pressure, in this case the atmospheric pressure, and T the absolute temperature.
If the concentration of vapour is much smaller than the concentration of total gas as is the case under moderate temperatures, Fick’s law (7) reduces to the well-known form
eff vva
dj D
dx (10)
By combining (6) and (10) and assuming isothermal conditions the governing equation for vapour transfer can be written in terms of pressure as
effv vva
p pD m
t x x (11)
3.3 Cell wall sorption As already mentioned the coupling between the bound
water and the water vapour is assumed to follow a type of surface mass transfer relation. From the mass transfer of
vapour from a saturated surface the following relation is known [15]
( )v wm h p p (12)
where pw is the vapour pressure at the saturated surface, pv is the vapour pressure in the surrounding air and h is the mass transfer coefficient. For the case of transfer between the lumens and the cell walls an analogous relation is assumed. In the works of Cunningham [10], Salin [11], and Absetz and Koponen [12], h was assumed constant within the RH-step in question. If the non-Fickian behaviour was solely the result of an internal boundary layer this would probably be reasonable, and these models are then equivalent to the model introduced by Choong and Skaar [16]. The assumption of a constant h, however, has some consequences which are in conflict with the findings of Christensen [4], who listed three major points:
1. For steps of different magnitude but with the same final MC, e.g. 5% MC to 10% MC and 8% MC to 10% MC, the sorption rates were lower for the smaller steps.
2. For steps of different magnitude but with the same final MC, e.g. 5% MC to 10% MC and 8% MC to 10% MC, the sorption rates were lower for the smaller steps.
3. When starting from a completely dry sample the effect of step size was cancelled, such that a step from 0% MC to 5% gave the same qualitative response as a step from 0% MC to 10% MC.
These statements are also valid if RH is substituted for MC, i.e. the shape of the sorption isotherm does not help to explain the anomalies.
The first of the above points can be accommodated by making h depend on the moisture content, and assuming a constant h within steps of relatively small magnitude is thus reasonable.
But the effect that larger steps should result in higher sorption rates than smaller steps cannot be captured by assuming a constant value of h. To see this, consider a sorption process governed by the equation
0d ( )dmm h m mt
(13)
where m is the target moisture content. The solution is given by
0eh tm m c (14)
where c is a constant of integration determined by the initial moisture content m0. The relative moisture uptake is given by
000
0
e1 1 eh t
h tm m cEm m m m
(15)
from which it is clearly seen that the step size effect cannot be modeled using a constant value of h.
A possible interpretation of the step size effect is that close to equilibrium there is an additional ‘resistance’ to moisture uptake. This is the possibility explored in the following. As a measure of the proximity to equilibrium some function of the ratio of the actual moisture content to

Materials and Structures / Matériaux et Constructions, Vol. 37, November 2004
619
the target moisture content may be used. Thus, one possibility of including the increased resistance close to equilibrium would be
d ( )dm h m mt
(16)
where
0
0
(1 / ) ( )(1 / ) ( )
h m m in adsorption m mh
h m m in desorption m m (17)
and h0 is a constant. Considering the case of adsorption the solution to (16) is
0 0
0
( )( )
h t m m m m mm
h t m m m (18)
or in terms of the fractional moisture uptake
0 0
0 0
(1 / )1 (1 / )
m m h tE
m m h t (19)
Clearly, the closer m0 is to m the slower the sorption will be. This is illustrated in Fig. 4. More interestingly, however, is that when m0 = 0, i.e. when starting from a completely dry sample, the fractional weight increase reduces to
0
01h t
Eh t
(20)
which is independent of the final moisture content and thereby the step size. This will generally be the case for all relations of the type
( / )( )dm f m m m mdt
(21)
and thus, using m/m as a measure of the proximity to equilibrium has the obvious advantage that the observed behaviour of the canceling of step size effects when starting from completely dry conditions is included directly in the expression for h.
3.3.1 Relation of adsorption to swelling
In the above, the equilibrium proximity measure was introduced on the grounds of mathematical arguments. There are, however, also indications that this variable has a deeper physical significance. In the works of Christensen, and later also by Skaar et al. [17], it was argued that the only plausible explanation for the behaviour was to be found in the swelling which accompanies adsorption. That is, as the wood takes up moisture it swells which, until a stress relaxation has taken place, slows down the sorption of additional water molecules. In analogy with the osmotic pressure equation, Katz [18] originally proposed that the maximum swelling pressure exerted by an elastic gel when the surrounding vapour pressure is raised fromsome value p0 to the saturation vapour pressure of the gel psat would be:
0
sat
lnw
w
RT pM p
(22)
where w is the density of water and Mw the molecular weight. Later Barkas [19] extended this equation to be valid for any pair of vapour pressures pi and pf
i
f
lnw
w
RT pM p
(23)
where subscripts i and f indicate the initial and final states respectively. Christensen [4] further explored experimentally the possibility of a relation between sorption and swelling and found that the half-time to sorption was approximately inversely proportional to ln(pi/pf), i.e.
0.5i fln( / )
atp p
(24)
where a is a constant. This result was interpreted such that the higher potential swelling pressure available the faster the relaxation, and thereby the sorption, will be. As also admitted by Christensen, the choice of using the half-time to sorption is somewhat arbitrary and not particularly representative of the whole sorption process. However, the results do indicate that the variable ln(pi/pf)could be of vital importance in describing the sorption process.
3.3.2 Application to wood
In the particular case of wood, a similar expression may be used. The equilibrium proximity measure can be taken as the ratio between the equilibrium vapour pressure pw(w)corresponding to a given moisture content w as defined by the sorption isotherm and the actual vapour pressure pv.Thus, the term m in (5) has the following principal appearance
, , , ,... ( )ww v
v
p wm h w T p pp t
(25)
where the influence of the absolute magnitude of the moisture content and temperature have been included. Also, the expressions for h should be different in adsorption and desorption as already discussed. Concerning the expression
Fig. 4 - Sorption curves for steps of different magnitude.

Krabbenhoft, Damkilde
620
for h in adsorption it can be deduced from the results published by Christensen [4] and Wadsö [1] the h should be relatively large in the beginning of the sorption process, i.e.when far from equilibrium. This is followed by a rapid decrease as equilibrium is approached, where the point at which h begins to decrease abruptly is determined by the absolute moisture content. An analytical expression able to describe these characteristics is given by
3
1 2 4expc
w
v
ph c c c
p (26)
Whereas this expression contains four parameters which may be adjusted independently we have found that only the parameter c2 needs to be made dependent on the moisture content in order to fit the experimental results of Wadsö [1] satisfactorily. By varying c2 a family of curves as shown in Fig. 5 is obtained.
As indicated in the figure the maximum value of h is approximately 62 10h kgm-3s-1Pa-1. This value may be compared to the value of the surface evaporation coefficient kpwhich has a typical value of around 85 10pk kgm-2s-1Pa-1
[15]. The evaporation per unit volume of internal surface should then be at most ( )p w vk p p where is the internal surface area per unit volume. For typical softwoods this may be taken as approximately 5 110 m giving a maximum value of h of 3
max 5 10h kgm-3s-1Pa-1. This is well above the maximum value actually used, suggesting that the process of sorption is more complicated and involves other mechanism with much higher times scales than evaporation/condensation.
Since the approach to equilibrium should be slower with higher moisture contents, c2 has to increase with increasing w. As seen the curves have been constructed such that h is near constant for low values of pw = pv. Whether this can be experimentally justified is of course an open question. It is, however, an attractive feature to be able to recover the basic surface evaporation equation in the limit of small values of pw = pv.
In the following the non-Fickian behaviour is described via the sorption term described in the above. Thus, the physical mechanisms responsible for the sorption behaviour are lumped into this one term. This includes also the boundary layer resistance in the lumens. Although this is probably oversimplified, it appears at the current time to be a satisfactory compromise. In a more complete model, however, each of the physical mechanisms contained in the sorption term should be considered separately.
4. RESULTS
In the following a number of sorption simulations are performed and the results compared to those of Wadsö [1].
In all the simulations we use 31 5 10c kgm-3s-1Pa-1,
c3 = 50.0, and 84 8 10c kgm-3s-1Pa-1. The coefficient c2
should in principle increase continuously with increasing moisture content in a manner similar to what is shown in Fig. 5 (b). However, at this point there is not sufficient experimental data available to establish such a curve and we have therefore chosen to keep c2 constant within the two
moisture ranges considered. In the first series of experiments the relative humidity is changed from 54% to 75%, whereas in the second series it is varied from 75% to 84%. The corresponding values of c2 that have been used are c2 = 8.0 and c2 = 40.0 respectively.
Also the water vapour diffusion coefficients are kept constant within each MC-range. In Table 1 the values used in the simulations are compared to values found by Siau [13] on the basis of a geometrical model of the cellular structure of a typical softwood. The latter values have been converted into equivalent diffusion coefficients with vapour pressure as potential. As can be seen, the values used in the simulations are in all cases within the ranges determined by Siau [13].
In the model of Siau the resistance to vapour flow comprises cell lumens as well as cell walls. Thus, strictly speaking, the coefficients can only be regarded as apparent
Fig. 5 (a) - Variation of h with c2 and pw/pv.
Fig. 5 (b) - Variation of c2 with absolute moisture content w.
Table 1 - Values of /effva vaD D of Siau [13] and values
used in the present simulations Trans. Trans. Long. Long. RH (%) (Siau [13]) (Present) (Siau [13]) (Present) 54-75 156-56 130 2.8-1.7 1.7 75-84 56-28 30 1.7-1.5 1.7
Materials and Structures / Matériaux et Constructions, Vol. 37, November 2004
621
vapour diffusion coefficients, as in reality vapour is assumed to pass through the cell walls by being sorbed on one side and subsequently released on the other side. This is, however, but one theory of the mechanism of vapour transfer. According to Dinwoodie [20] the principal pathway is through the pits of the cell walls. A diffusion coefficient independent of the moisture content should then be expected. This is not supported by the experimental results presented in the following and we have therefore chosen to adopt the model of Siau.
For the longitudinal bound water diffusion coefficients at a temperature of 23 C we use
11 23 10 m /s for 54% RH 75%LwD (27)
and11 212 10 m /s for 75% < RH 75%L
wD (28)
The tangential bound water coefficient is related to that in the longitudinal direction by 3L T
w wD D . These values correspond to what is given in [21].
The air velocity reported by Wadsö (3m/s) is assumed to be so high that boundary effects in the layer between the sample and the surrounding air can be ignored. The computed and experimentally determined sorption curves are shown in Figs. 6 and 7. As can be seen from Figs. 6 and 7 all eight sets of sorption experiments are fitted quite well. For all the simulations the qualitative effect of a sudden change in sorption rate is clearly seen and thus, all in all the results suggest that it may be fruitful to consider sorption, or sorption rates, in relation to two variables, namely the moisture content and the proximity to equilibrium, where particularly the last quantity is of importance. Especially, the results for transfer in the tangential direction are satisfactory as the overall response is here governed by a combination of vapour transfer and sorption, whereas for the longitudinal samples the response is governed mainly by sorption.
5. FUTURE EXPERIMENTAL WORK
Clearly, experimental verification of the model presented here is needed. Concerning the sorption terms, the experiments should be conducted on very thin slices of wood such that the diffusion of vapour does not need to be considered. Step increments of varying magnitude in vapour pressure should be applied similarly to what was done by Christensen [4].
As in most mass transfer processes it must be expected that a boundary layer exists on the cell wall surface. To separate this resistance from the non-Fickian effects it would be necessary to conduct the experiments at different air velocities.
In practice the variation of h with w and pw = pv should be rather straight forward to determine, namely as
1( , / ) ( )w v v wwh w p p p pt
(29)
or in discrete form as
111 1 , 1 , 1
1
( , ( / ) ) ( )n nn w v n w n w n
n n
w wh w p p p p
t t (30)
where n and n+1 refer to two consecutive measurement points. A complication, however, is that towards the end of the sorption process both pv-pw and w/ t (or its discrete approximation) tend to zero, and thus the results may become inaccurate.
An interesting extension of the current application to wood is the application to other biological materials such as plant fibers where similar anomalous effect have recently been observed in an ongoing experimental study conducted at the Technical University of Denmark.
Fig. 6 - Computed and experimental sorption curves for series 1: 54-75% RH.
Fig. 7 - Computed and experimental sorption curves for series 2: 75-84% RH.

Krabbenhoft, Damkilde
622
6. CONCLUSIONS
A new model for the transfer of moisture in wood in the hygroscopic range has been formulated. With this model all the common non-Fickian effects reported in the literature can be explained. This is demonstrated by reproducing a set of eight different sorption experiments. The model has been implemented in a general finite element framework where the extension to multiple spatial dimensions is straight forward, see e.g. [22].
Further experimentation is still necessary, both in order to verify the model presented here as well as to study the influences of temperature and the response in desorption in relation to the response in adsorption.
ACKNOWLEDGEMENTS
This work has been funded in part by the Danish Research Agency under Project No. 9901363: ‘Modeling the Effects of Moisture and Load History on the Mechanical Properties of Wood’. The financial support is gratefully acknowledged.
NOMENCLATURE
Roman letters D Diffusion coefficient E Fractional weight increase h Sorption constant (kgm-3s-1Pa-1)j Flux (kgm-2s-1)m Moisture content (kg/kg) m Sorption term (kgm-3s-1)p Pressure (Pa) r Relative humidity (RH) R Gas constant (8.31 Jmol-1K-1)T Temperature (K) w Moisure content (kgm-3)
Greek letters Porosity Density (kgm-3)Internal area/volume ration (m-1)Vapour diffusivity reduction factor
Sub- and superscripts a aireff effectiveg gas – vapour+air L longitudinal T tangential v vapour
REFERENCES
[1] Wadsö, L., ‘Unsteady-state water vapour adsorption in wood: An experimental study’, Wood and Fiber Science6(1) (1994) 36-45.
[2] Crank, J., ‘The Mathematics of Diffusion’ (Oxford University Press, London, 1967).
[3] Rosen, H.-N., ‘The influence of external resistance on moisture adsorption rates in wood’, Wood and Fiber Science10(3) (1973) 218-228.
[4] Christensen, G.N., ‘The rate of sorption by thin materials’, Humidity and Moisture (4) (1965) 279-293.
[5] Wadsö, L., ‘Describing non-Fickian water-vapour sorption in wood’, Journal of Materials Science 29 (1994) 2367-2372.
[6] Christensen, G.N., ‘The rate of sorption by wood and pulp’, Appita 13 (1959) 112-123.
[7] Christensen, G.N. and Kelsey, K.E., ‘The sorption of water vapour through the chemical componenets of wood (Die Sorption von Wasserdampf durch die chemichen Bestandteile des Holzes)’, Holz als Roh- und Werkstoff17(5) (1959) 178-188 [in German].
[8] Christensen, G.N. and Kelsey, K.E., ‘The rate of water vapour sorption through wood (Die Gescwhindigkeit der Wasserdampfsorption durch Holz)’, Holz als Roh- und Werkstof 17(5) (1959) 189-203 [in German].
[9] Kelly, M.W. and Hart, C.A., ‘Water sorption rates by wood cell walls’, Wood and Fiber Science 1 (1970) 270-282.
[10] Cunningham, M.J., ‘A model to explain “anomalous” moisture sorption in wood under step function driving forces’, Wood and Fiber Science 27(3) (1996) 265-277.
[11] Salin, J.G., ‘Mass transfer from wooden surfaces and internal moisture non-equilibrium, Drying Technology14(10) (1996) 2213-2224.
[12] Absetz, I. and Koponen, S., ‘Fundamental diffusion behaviour of wood’, In Hoffmeyer, P. (editor) ‘International Conference on Wood Water Relations’, (Copenhagen, 1997).
[13] Siau, J.F., ‘Transport Processes in Wood’, (Springer-Verlag, Berlin, 1984).
[14] Schirmer, R., ‘The diffusion coefficient water vapour-air mixtures and the rate of evaporation (Die Diffusionzahl von Wasserdampf-luftgemischem und die Verdampfungsgeschwingkeit)’, VDI Beihaft Verfahrestechnik 6 (1938) 170 [in German].
[15] Wadsö, L., ‘Studies of Water-vapor Transport and Sorption in Wood’, (Report TVBM-1013, Lund University, Sweden 1993).
[16] Choong, E.T. and Skaar, C., ‘Separating internal and external resistance to moisture removal in wood drying’, Wood Science 1(4) (1969) 200-202.
[17] Skaar, C., Prichananda, C. and Davidson, R.W., ‘Soma aspects of the dynamic moisture sorption dynamics in wood’, Wood Science 2(3) (1970) 179-185.
[18] Katz, J.R., ‘The laws of swelling (Gesetze der Quellung)’, Kollidchemische Beihefte 9 (1917) 1-182 [in German].
[19] Barkas, W.W., ‘The Swelling of Wood under Stress’, (HM Stationary Office, London, 1949).
[20] Dinwoodie, J.M., ‘Timber, its Nature and Behaviour’, (Van Norstrand Reinhold, New York, 1981).
[21] Skaar, C., ‘Wood-Water Relations’, (Springer-Verlag, Berlin, 1988).
[22] Zienkiewicz, O.C. and Taylor, R.L., ‘The Finite Element Method’, (Butterworth-Heinemann, Oxford, 2000).
Paper received: March 19, 2003; Paper accepted: August 27, 2003


![Methods to determine wood moisture content and their ... · Fig. 2: Influence of wood moisture content on selected wood properties, from [1] The dimensional changes of wood due to](https://static.fdocuments.in/doc/165x107/5d51837388c993ad428bcaf8/methods-to-determine-wood-moisture-content-and-their-fig-2-influence-of.jpg)
