A model for gravity flow of fragmented rock in block caving - ISRM
65
A MODEL FOR GRAVITY FLOW OF FRAGMENTED ROCK IN BLOCK CAVING MINES Matthew Edward Pierce SUMMARY of a thesis submitted for the degree of Doctor of Philosophy at The University of Queensland in September 2010 Sustainable Minerals Institute (SMI) WH Bryan Mining & Geology Research Centre
Transcript of A model for gravity flow of fragmented rock in block caving - ISRM
A MODEL FOR GRAVITY FLOW OF
FRAGMENTED ROCK IN BLOCK CAVING MINES
Matthew Edward Pierce
SUMMARY of a thesis submitted for the degree of Doctor of Philosophy at
The University of Queensland in September 2010
Sustainable Minerals Institute (SMI)
WH Bryan Mining & Geology Research Centre
M Pierce Thesis Summary Page i
Table of Contents
Table of Contents ............................................................................................................................. i
1.0 Introduction ........................................................................................................................... 1
2.0 Predictive Models for Flow ................................................................................................... 5
2.1 Stochastic .......................................................................................................................... 5
2.2 Kinematic .......................................................................................................................... 6
2.3 Empirical ........................................................................................................................... 7
2.4 REBOP .............................................................................................................................. 7
3.0 Flow Above an Isolated Drawpoint ...................................................................................... 9
3.1 Critical Review .................................................................................................................. 9
3.2 Simulations ...................................................................................................................... 12
3.3 REBOP Logic .................................................................................................................. 16
3.4 Testing and Validation .................................................................................................... 19
4.0 Flow Above Multiple Drawpoints: Overlapping Draw ....................................................... 22
4.1 Critical Review ................................................................................................................ 22
4.2 REBOP Logic .................................................................................................................. 23
4.3 Testing and Validation .................................................................................................... 23
5.0 Flow Above Multiple Drawpoints: Interactive Draw and the Role of Stress ..................... 26
5.1 Critical Review ................................................................................................................ 26
5.2 Simulations ...................................................................................................................... 27
5.3 REBOP Logic .................................................................................................................. 32
5.4 Testing and Validation .................................................................................................... 33
6.0 Secondary Fragmentation .................................................................................................... 36
6.1 Critical Review ................................................................................................................ 36
6.2 Simulations ...................................................................................................................... 37
6.3 REBOP Logic .................................................................................................................. 39
6.4 Testing and Validation .................................................................................................... 40
7.0 Fines Migration ................................................................................................................... 40
7.1 Critical Review ................................................................................................................ 40
7.2 Simulations ...................................................................................................................... 40
7.3 REBOP Logic .................................................................................................................. 43
7.4 Testing and Validation .................................................................................................... 44
8.0 Case Study ........................................................................................................................... 45
9.0 Conclusions ......................................................................................................................... 50
10.0 References ........................................................................................................................... 51
M Pierce Thesis Summary Page 1
1.0 INTRODUCTION
The work in this thesis is directed towards the development of a model for gravity flow of
fragmented rock that can assist in the design of drawpoint layouts and draw schedules in caving
mines. Such methods have been employed successfully in the extraction of orebodies since the
late Nineteenth Century (Brown, 2003). There are several different methods of cave mining,
including block, panel, sublevel and inclined. This thesis focuses specifically on block/panel
caving, in which an ore column of finite width, length and height is drawn from a horizontal
array of drawpoints at its base. In order for the ore to flow freely into the drawpoints, the rock
mass first must be fragmented — i.e. disturbed to the point where it disintegrates into a frictional
assembly of fully formed blocks that are susceptible to flow. This generally is accomplished by
blasting and removing some of the rock at the base of the ore column, a process referred to as
undercutting.
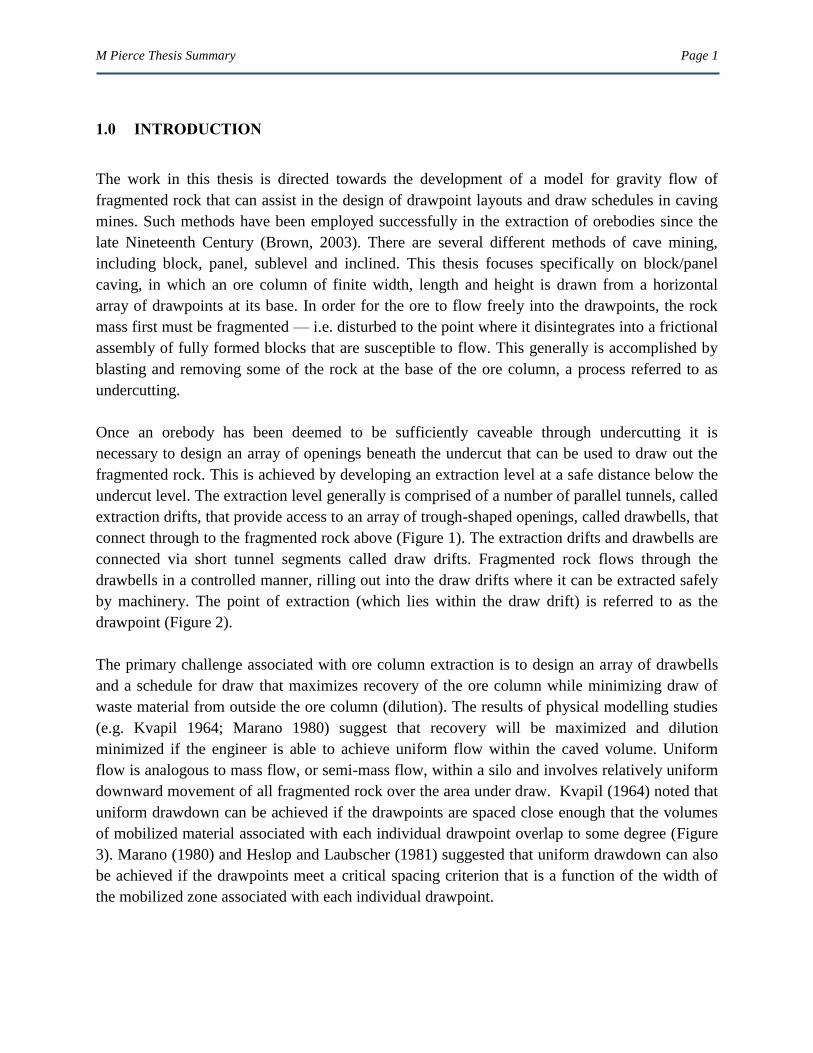
Once an orebody has been deemed to be sufficiently caveable through undercutting it is
necessary to design an array of openings beneath the undercut that can be used to draw out the
fragmented rock. This is achieved by developing an extraction level at a safe distance below the
undercut level. The extraction level generally is comprised of a number of parallel tunnels, called
extraction drifts, that provide access to an array of trough-shaped openings, called drawbells, that
connect through to the fragmented rock above (Figure 1). The extraction drifts and drawbells are
connected via short tunnel segments called draw drifts. Fragmented rock flows through the
drawbells in a controlled manner, rilling out into the draw drifts where it can be extracted safely
by machinery. The point of extraction (which lies within the draw drift) is referred to as the
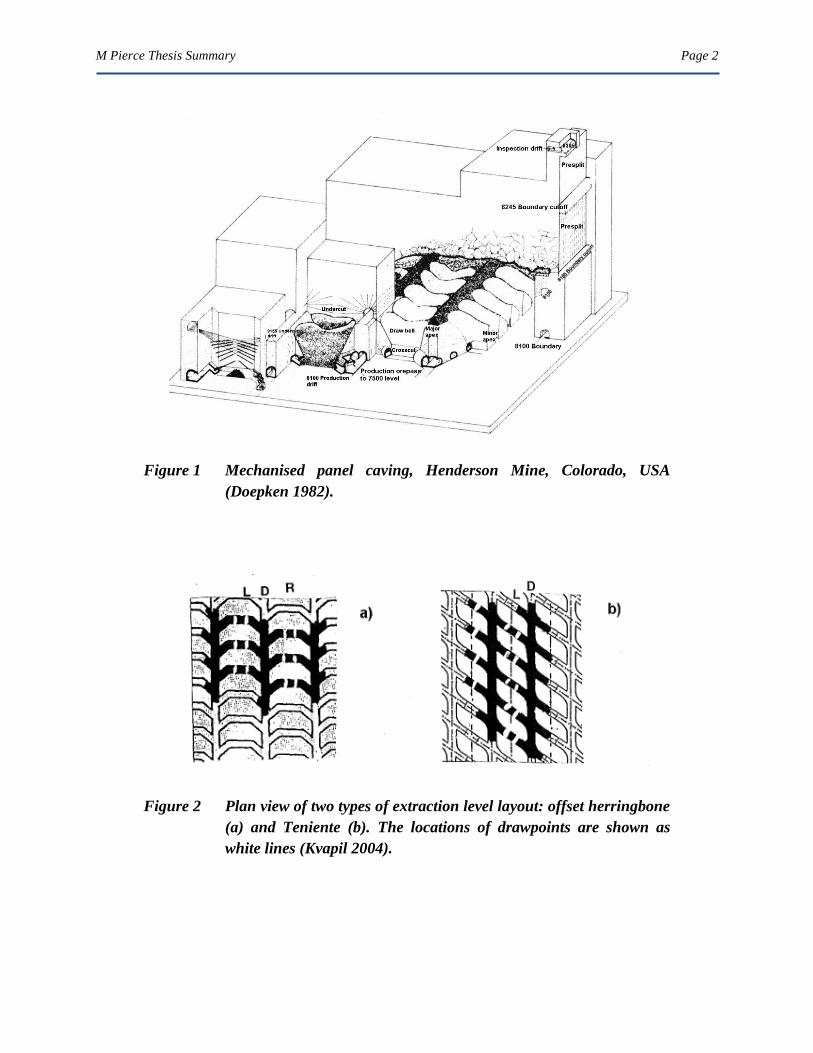
drawpoint (Figure 2).
The primary challenge associated with ore column extraction is to design an array of drawbells
and a schedule for draw that maximizes recovery of the ore column while minimizing draw of
waste material from outside the ore column (dilution). The results of physical modelling studies
(e.g. Kvapil 1964; Marano 1980) suggest that recovery will be maximized and dilution
minimized if the engineer is able to achieve uniform flow within the caved volume. Uniform
flow is analogous to mass flow, or semi-mass flow, within a silo and involves relatively uniform
downward movement of all fragmented rock over the area under draw. Kvapil (1964) noted that
uniform drawdown can be achieved if the drawpoints are spaced close enough that the volumes
of mobilized material associated with each individual drawpoint overlap to some degree (Figure
3). Marano (1980) and Heslop and Laubscher (1981) suggested that uniform drawdown can also
be achieved if the drawpoints meet a critical spacing criterion that is a function of the width of
the mobilized zone associated with each individual drawpoint.
M Pierce Thesis Summary Page 2
Figure 1 Mechanised panel caving, Henderson Mine, Colorado, USA
(Doepken 1982).
Figure 2 Plan view of two types of extraction level layout: offset herringbone
(a) and Teniente (b). The locations of drawpoints are shown as
white lines (Kvapil 2004).
M Pierce Thesis Summary Page 3
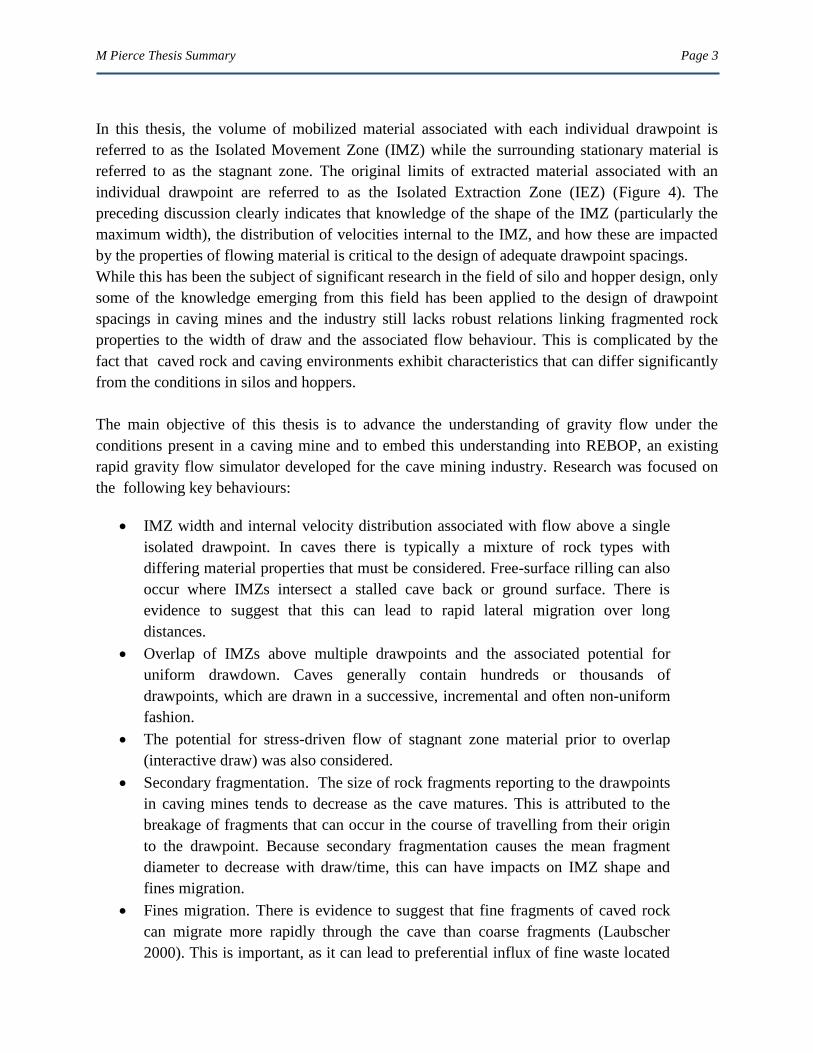
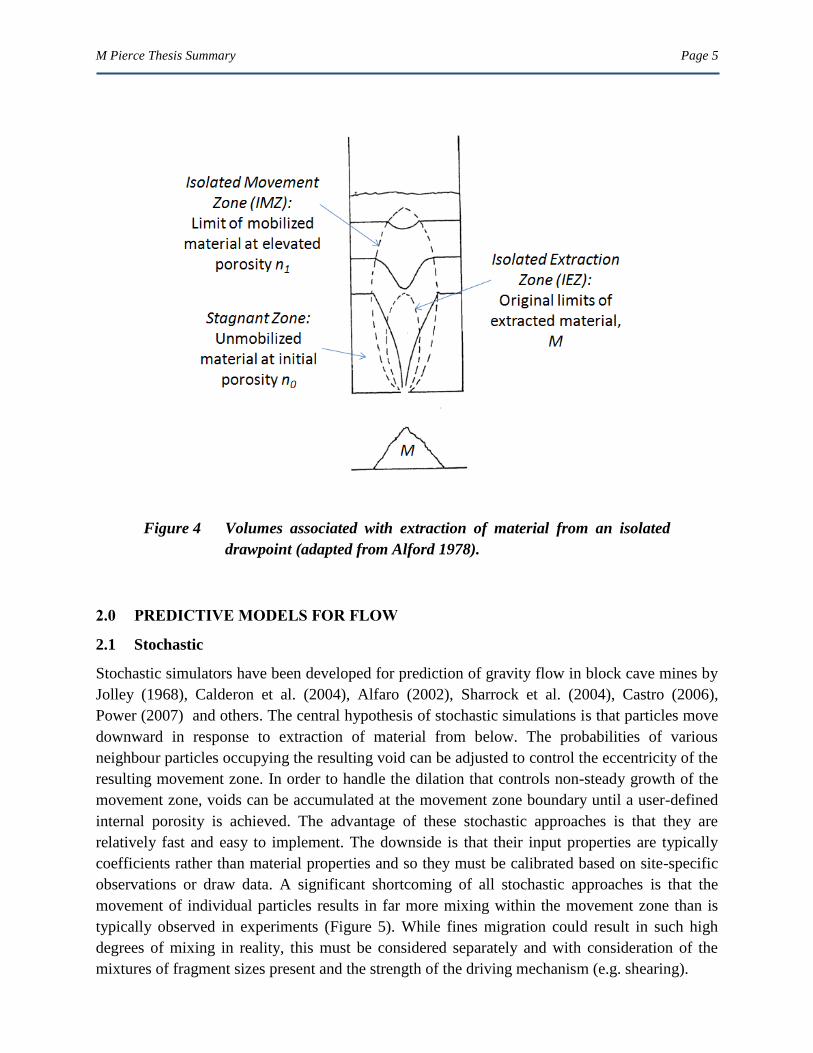
In this thesis, the volume of mobilized material associated with each individual drawpoint is
referred to as the Isolated Movement Zone (IMZ) while the surrounding stationary material is
referred to as the stagnant zone. The original limits of extracted material associated with an
individual drawpoint are referred to as the Isolated Extraction Zone (IEZ) (Figure 4). The
preceding discussion clearly indicates that knowledge of the shape of the IMZ (particularly the
maximum width), the distribution of velocities internal to the IMZ, and how these are impacted
by the properties of flowing material is critical to the design of adequate drawpoint spacings.
While this has been the subject of significant research in the field of silo and hopper design, only
some of the knowledge emerging from this field has been applied to the design of drawpoint
spacings in caving mines and the industry still lacks robust relations linking fragmented rock
properties to the width of draw and the associated flow behaviour. This is complicated by the
fact that caved rock and caving environments exhibit characteristics that can differ significantly
from the conditions in silos and hoppers.
The main objective of this thesis is to advance the understanding of gravity flow under the
conditions present in a caving mine and to embed this understanding into REBOP, an existing
rapid gravity flow simulator developed for the cave mining industry. Research was focused on
the following key behaviours:
IMZ width and internal velocity distribution associated with flow above a single
isolated drawpoint. In caves there is typically a mixture of rock types with
differing material properties that must be considered. Free-surface rilling can also
occur where IMZs intersect a stalled cave back or ground surface. There is
evidence to suggest that this can lead to rapid lateral migration over long
distances.
Overlap of IMZs above multiple drawpoints and the associated potential for
uniform drawdown. Caves generally contain hundreds or thousands of
drawpoints, which are drawn in a successive, incremental and often non-uniform
fashion.
The potential for stress-driven flow of stagnant zone material prior to overlap
(interactive draw) was also considered.
Secondary fragmentation. The size of rock fragments reporting to the drawpoints
in caving mines tends to decrease as the cave matures. This is attributed to the
breakage of fragments that can occur in the course of travelling from their origin
to the drawpoint. Because secondary fragmentation causes the mean fragment
diameter to decrease with draw/time, this can have impacts on IMZ shape and
fines migration.
Fines migration. There is evidence to suggest that fine fragments of caved rock
can migrate more rapidly through the cave than coarse fragments (Laubscher
2000). This is important, as it can lead to preferential influx of fine waste located
M Pierce Thesis Summary Page 4
above the column (e.g. in a previously exhausted level) and local accumulations
of fines that can flow unexpectedly, particularly in the presence of water.
The following four steps were undertaken for each key behaviour, as summarized in the
following sections:
Critical review of existing data and postulated controlling mechanisms.
Full- and component-scale simulations of flow using DEM and continuum models
to test hypotheses emerging from the critical review and extend the current body
of knowledge.
Using existing data and the results of new simulations, formulate new incremental
equations for incorporation into REBOP.
Testing and validation of REBOP against experimental and in-situ data.
This thesis summary begins with a brief review of predictive models for flow, including REBOP,
then addresses each of the five key behaviours in turn. The summary concludes with a
description of the mining case study used to test the enhanced REBOP code.
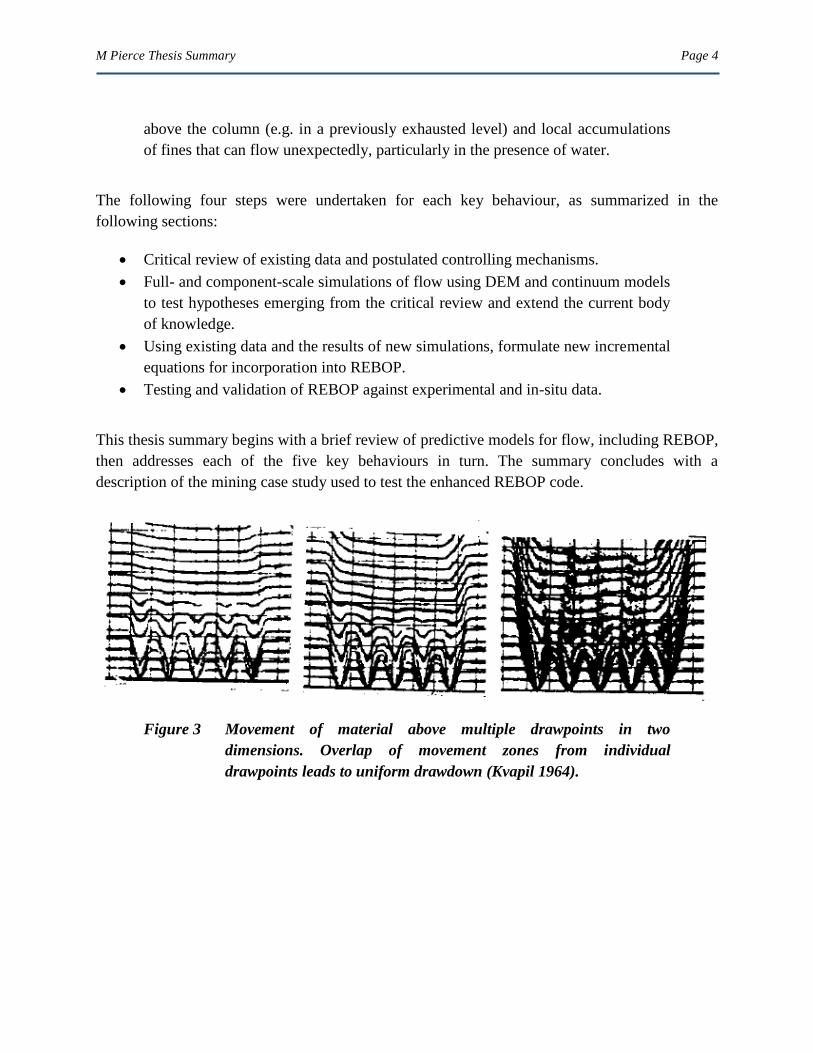
Figure 3 Movement of material above multiple drawpoints in two
dimensions. Overlap of movement zones from individual
drawpoints leads to uniform drawdown (Kvapil 1964).
M Pierce Thesis Summary Page 5
Figure 4 Volumes associated with extraction of material from an isolated
drawpoint (adapted from Alford 1978).
2.0 PREDICTIVE MODELS FOR FLOW
2.1 Stochastic
Stochastic simulators have been developed for prediction of gravity flow in block cave mines by
Jolley (1968), Calderon et al. (2004), Alfaro (2002), Sharrock et al. (2004), Castro (2006),
Power (2007) and others. The central hypothesis of stochastic simulations is that particles move
downward in response to extraction of material from below. The probabilities of various
neighbour particles occupying the resulting void can be adjusted to control the eccentricity of the
resulting movement zone. In order to handle the dilation that controls non-steady growth of the
movement zone, voids can be accumulated at the movement zone boundary until a user-defined
internal porosity is achieved. The advantage of these stochastic approaches is that they are
relatively fast and easy to implement. The downside is that their input properties are typically
coefficients rather than material properties and so they must be calibrated based on site-specific
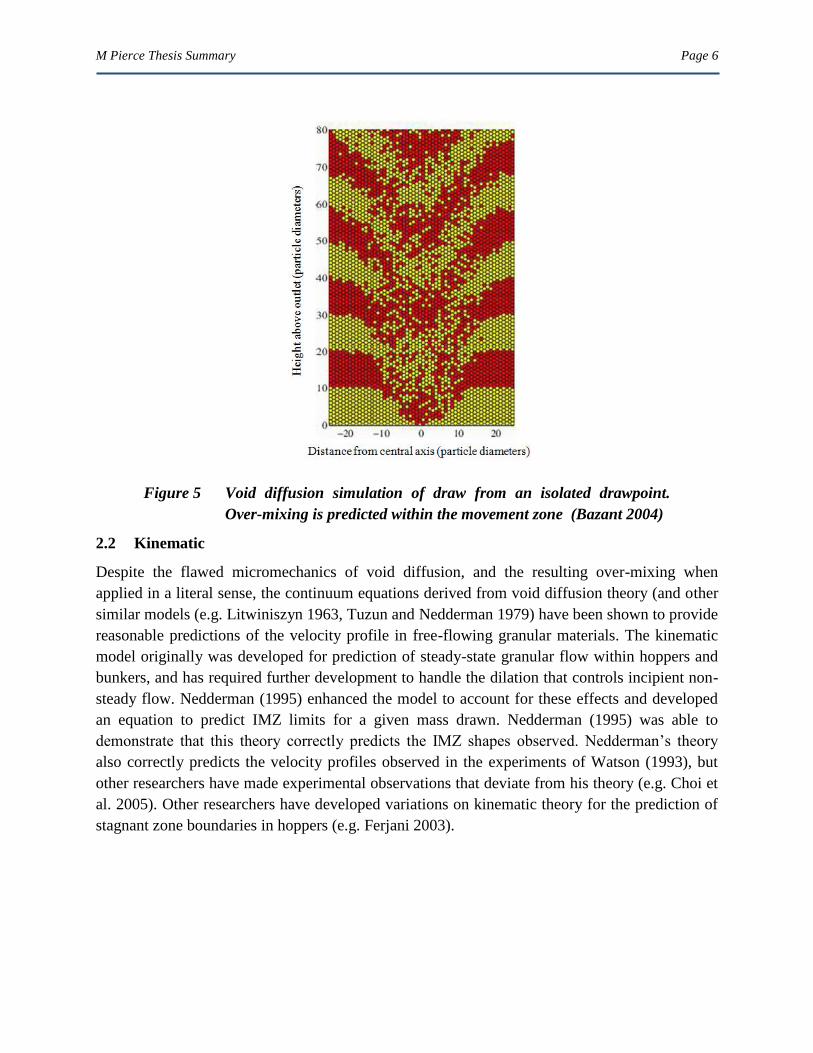
observations or draw data. A significant shortcoming of all stochastic approaches is that the
movement of individual particles results in far more mixing within the movement zone than is
typically observed in experiments (Figure 5). While fines migration could result in such high
degrees of mixing in reality, this must be considered separately and with consideration of the
mixtures of fragment sizes present and the strength of the driving mechanism (e.g. shearing).
M Pierce Thesis Summary Page 6
Figure 5 Void diffusion simulation of draw from an isolated drawpoint.
Over-mixing is predicted within the movement zone (Bazant 2004)
2.2 Kinematic
Despite the flawed micromechanics of void diffusion, and the resulting over-mixing when
applied in a literal sense, the continuum equations derived from void diffusion theory (and other
similar models (e.g. Litwiniszyn 1963, Tuzun and Nedderman 1979) have been shown to provide
reasonable predictions of the velocity profile in free-flowing granular materials. The kinematic
model originally was developed for prediction of steady-state granular flow within hoppers and
bunkers, and has required further development to handle the dilation that controls incipient non-
steady flow. Nedderman (1995) enhanced the model to account for these effects and developed
an equation to predict IMZ limits for a given mass drawn. Nedderman (1995) was able to
demonstrate that this theory correctly predicts the IMZ shapes observed. Nedderman‘s theory
also correctly predicts the velocity profiles observed in the experiments of Watson (1993), but
other researchers have made experimental observations that deviate from his theory (e.g. Choi et
al. 2005). Other researchers have developed variations on kinematic theory for the prediction of
stagnant zone boundaries in hoppers (e.g. Ferjani 2003).
M Pierce Thesis Summary Page 7
2.3 Empirical
PC-BC (Gemcom 1999) is an empirical code for prediction of gravity flow in block caving
mines. It is based on understanding developed from sand model experiments, in situ marker trials
and back analysis of drawn grades/lithologies from caving operations. The code does not claim
to predict the evolution and velocity profiles associated with gravity flow; rather, a series of
fixed-radius ―draw cones‖ are defined ahead of time and empirical mixing rules applied to the
material within those cones to account for the mixing cause by non-uniform velocity profiles,
fines migration and free surface rilling. It is presumed within the code that interactive draw is
always achieved, which makes it unsuitable for the analysis of recovery and dilution in cases
where fine fragmentation (relative to drawpoint spacing) leads to isolated draw and early waste
entry. The software requires input parameters such as the height above the extraction level at
which uniform drawdown occurs (Height of Interaction Zone, or HIZ), IMZ maximum width, a
draw control factor and definition of fines percolation attributes. These inputs require site-
specific calibration using grades and geological markers from the block caving operation to
which it is being applied. While this limits the robustness of the code, it has proven useful at a
number of operations where data was available for calibration (Diering, 2000).
2.4 REBOP
REBOP (Rapid Emulator Based On PFC) simulates flow within a block or panel cave by
tracking the growth of Isolated Movement Zones (IMZs) (and corresponding internal
movements) associated with each drawpoint. The model was developed by Cundall et al. (2000)
based on observations of flow in PFC3D simulations of draw. It is similar to the kinematic
models of Nedderman (1995) and Ferjani (2003) (which consider only the IMZ limits and
internal velocities), but differs in several respects. Rather than relying on functions fit to the
observed IMZ shapes, the IMZs are comprised of a number of disk-shaped layers, and IMZ
growth results from incremental laws enforced at the layer level. Growth of the IMZ occurs
either through the expansion (i.e. increase in radius) of an existing layer or through the addition
of new layers on top. The material movements associated with IMZ growth are tracked by a field
of markers that are established on a fixed lattice at the start of the simulation. When a marker
becomes engulfed by an IMZ, its position is updated based on its location inside the IMZ
(distance from the centreline and layer number) and an incremental law (derived from PFC3D)
that controls how material moves downward from one layer to the next. Unlike stochastic
simulations, markers are not forced to move to fixed lattice sites. They are considered drawn
when they exit the lowermost layer, thereby providing a means to record the material drawn and
outline the extraction zone (IEZ).
The incremental laws governing local IMZ expansion and material movement in REBOP were
derived on the basis of flow patterns observed in PFC3D and FLAC simulations of draw
conducted by Lorig and Cundall (2000). Most of the simulations incorporated a single isolated
drawpoint. Based on observation of particle movements and displacement profiles within the
M Pierce Thesis Summary Page 8
resulting movement zone, three main mechanisms were postulated to govern upward and
outward growth of an isolated movement zone: porosity jump (or dilation), collapse and erosion.
Incremental rules were developed to describe how each of these mechanisms controls the growth
of discrete layers within the movement zone. Draw is simulated by extracting a small mass from
the lowermost layer and moving up through the overlying layers, growing each layer in sequence
as necessary to conform to the incremental laws while ensuring continuity and mass balance.
By basing the IMZ growth on mechanistically based laws at the layer scale, rather than
empirically based shapes at the IMZ scale, REBOP offers an opportunity to be predictive in
situations that have not been studied previously in physical or numerical experiments. In
addition, it is possible for IMZ shapes to deviate from ideal when spatial variations in material
properties (e.g. porosity, density, fragmentation) are expected. The REBOP approach is also
appealing because it allows the fundamental behaviours examined in DEM simulations to be
represented on a mine scale. As suggested by Lorig and Cundall (2000), the lower-level
approach employed in REBOP is potentially much closer to reality, and allows local mechanisms
and interactions to be reproduced.
The code, as originally developed by Cundall et al. (2000), was controlled by a number of
parameters that are not related to the physical properties of the caved material. As a result, it
relied on calibration to observations made in PFC3D or physical models that attempt to mimic
the mine in question. In addition, it did not account for the potential impacts of free-surface
rilling, fines migration or secondary fragmentation on material movements. The following
sections outline the results of research conducted within the scope of the thesis to address these
shortcomings and improve the predictive capabilities of REBOP.
M Pierce Thesis Summary Page 9
3.0 FLOW ABOVE AN ISOLATED DRAWPOINT
3.1 Critical Review
There are few experiments and simulations in which researchers have attempted to measure
evolving IMZ shapes in three dimensions under conditions that reasonably represent a block
caving environment. The following conclusions regarding IMZ shape were drawn from a review
of existing experimental and simulation data.
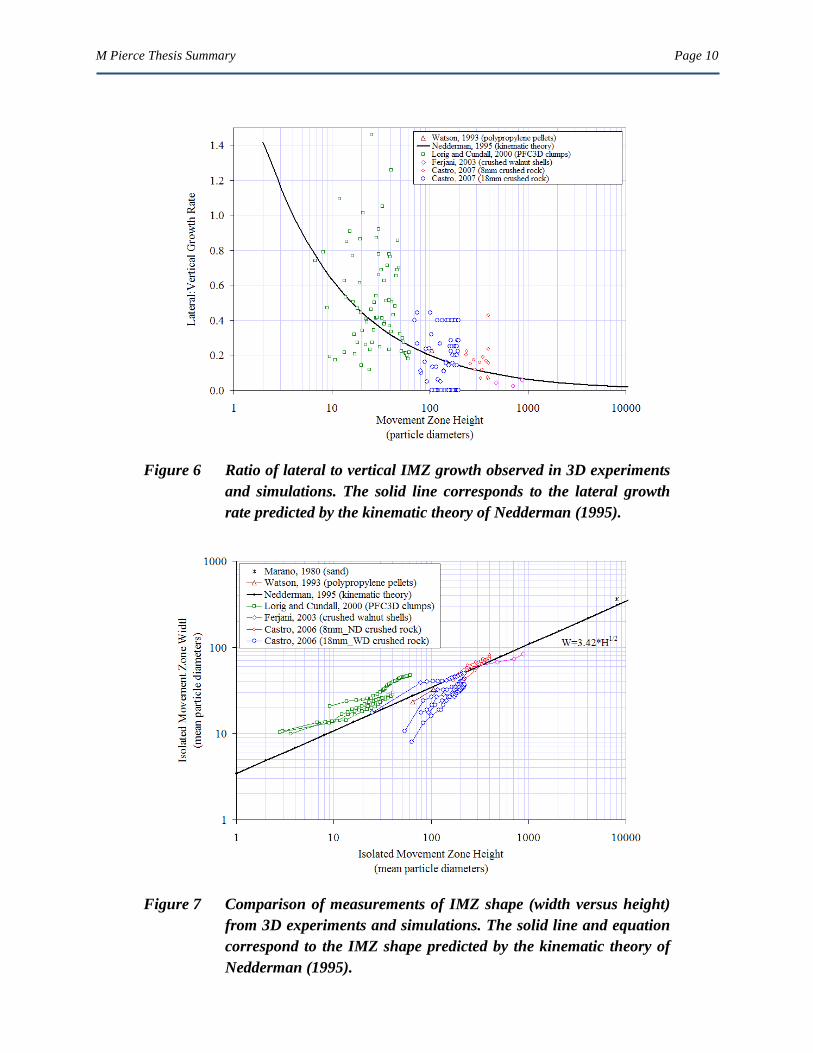
An IMZ widens as it grows in height. An examination of IMZ growth-rate data
suggests that the rate of growth in width diminishes significantly once the IMZ
height exceeds ~100-200 mean particle diameters (Figure 6).
At heights less than 100-200 mean particle diameters (referred to as the near
field), the high lateral-growth rate results in an IMZ shape that is ellipsoidal. At
heights greater than 100-200 mean particle diameters (referred to as the far field),
the IMZ assumes a cylindrical shape.
The results of experiments on a range of materials (including rock) at several
different scales suggest that IMZ width is well predicted by the kinematic theory
of Nedderman (1995), which suggests that the height and maximum width of the
IMZ (when expressed in terms of mean particle diameter) are related as shown in
Figure 7.
The nature of the intersection between the IMZ and the free-surface cone appears
to differ in the near field and far field. In the far field, the surface cone is likely to
grow well beyond the limits of the IMZ, resulting in an intersection that is sharply
convex. In the near field, the surface cone rim and the IMZ limit grow outward at
more similar rates, resulting in a more concave intersection that lies closer to the
surface cone rim.
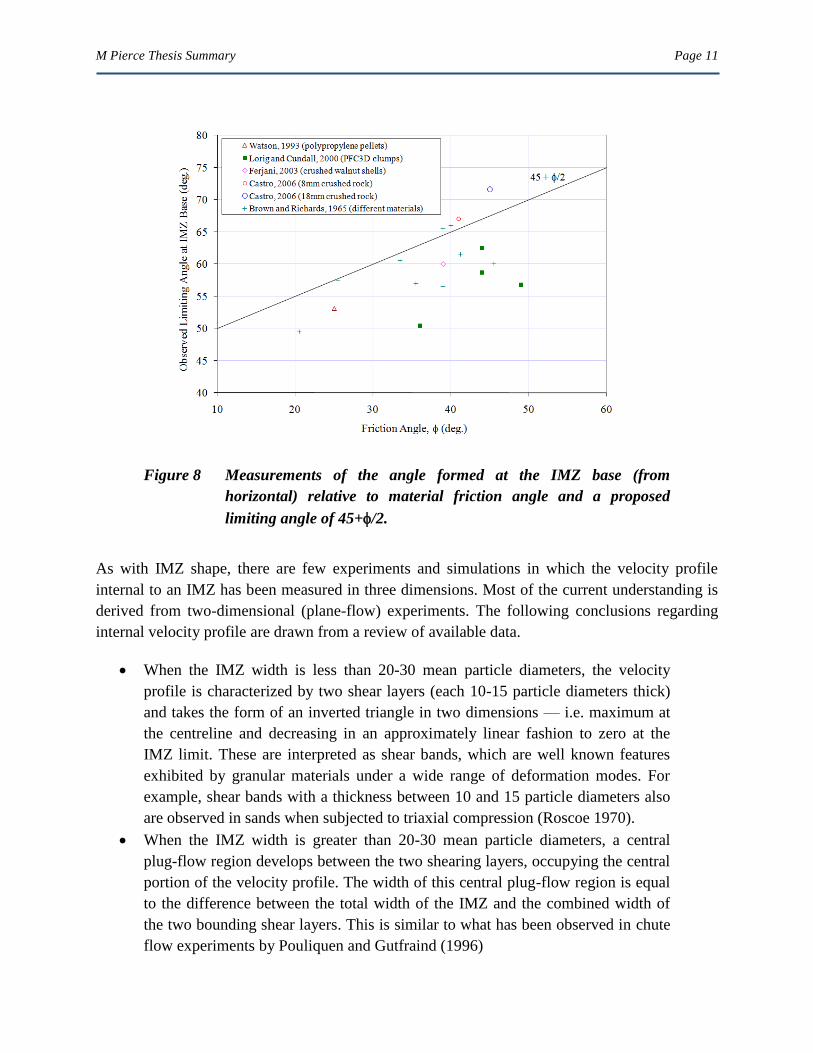
The results of a number of experiments and simulations suggest that the friction
angle of the granular material limits the angle at the base of the IMZ to 45+/2
(Figure 8).
The results of experiments employing non-spherical particle shapes suggest that
the exact shape of the particles does not have a significant impact on far-field
IMZ shape (as long as they are non-spherical).
M Pierce Thesis Summary Page 10
Figure 6 Ratio of lateral to vertical IMZ growth observed in 3D experiments
and simulations. The solid line corresponds to the lateral growth
rate predicted by the kinematic theory of Nedderman (1995).
Figure 7 Comparison of measurements of IMZ shape (width versus height)
from 3D experiments and simulations. The solid line and equation
correspond to the IMZ shape predicted by the kinematic theory of
Nedderman (1995).
M Pierce Thesis Summary Page 11
Figure 8 Measurements of the angle formed at the IMZ base (from
horizontal) relative to material friction angle and a proposed
limiting angle of 45+/2.
As with IMZ shape, there are few experiments and simulations in which the velocity profile
internal to an IMZ has been measured in three dimensions. Most of the current understanding is
derived from two-dimensional (plane-flow) experiments. The following conclusions regarding
internal velocity profile are drawn from a review of available data.
When the IMZ width is less than 20-30 mean particle diameters, the velocity
profile is characterized by two shear layers (each 10-15 particle diameters thick)
and takes the form of an inverted triangle in two dimensions — i.e. maximum at
the centreline and decreasing in an approximately linear fashion to zero at the
IMZ limit. These are interpreted as shear bands, which are well known features
exhibited by granular materials under a wide range of deformation modes. For
example, shear bands with a thickness between 10 and 15 particle diameters also
are observed in sands when subjected to triaxial compression (Roscoe 1970).
When the IMZ width is greater than 20-30 mean particle diameters, a central
plug-flow region develops between the two shearing layers, occupying the central
portion of the velocity profile. The width of this central plug-flow region is equal
to the difference between the total width of the IMZ and the combined width of
the two bounding shear layers. This is similar to what has been observed in chute
flow experiments by Pouliquen and Gutfraind (1996)
M Pierce Thesis Summary Page 12
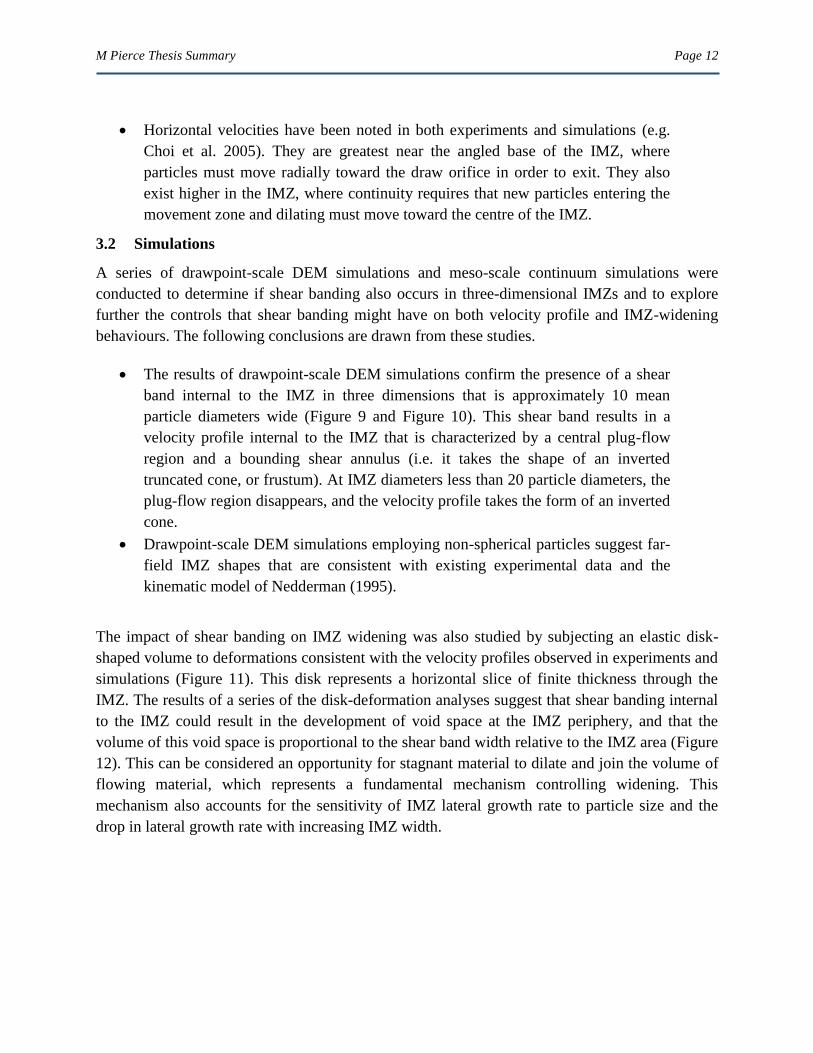
Horizontal velocities have been noted in both experiments and simulations (e.g.
Choi et al. 2005). They are greatest near the angled base of the IMZ, where
particles must move radially toward the draw orifice in order to exit. They also
exist higher in the IMZ, where continuity requires that new particles entering the
movement zone and dilating must move toward the centre of the IMZ.
3.2 Simulations
A series of drawpoint-scale DEM simulations and meso-scale continuum simulations were
conducted to determine if shear banding also occurs in three-dimensional IMZs and to explore
further the controls that shear banding might have on both velocity profile and IMZ-widening
behaviours. The following conclusions are drawn from these studies.
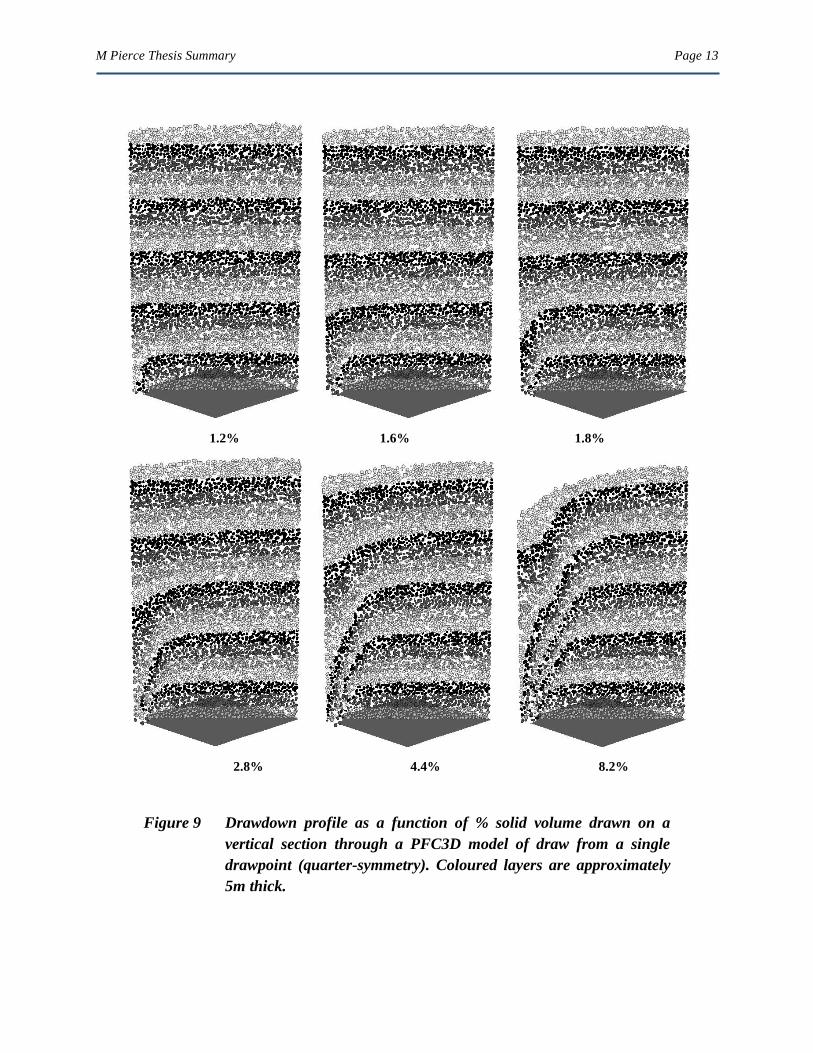
The results of drawpoint-scale DEM simulations confirm the presence of a shear
band internal to the IMZ in three dimensions that is approximately 10 mean
particle diameters wide (Figure 9 and Figure 10). This shear band results in a
velocity profile internal to the IMZ that is characterized by a central plug-flow
region and a bounding shear annulus (i.e. it takes the shape of an inverted
truncated cone, or frustum). At IMZ diameters less than 20 particle diameters, the
plug-flow region disappears, and the velocity profile takes the form of an inverted
cone.
Drawpoint-scale DEM simulations employing non-spherical particles suggest far-
field IMZ shapes that are consistent with existing experimental data and the
kinematic model of Nedderman (1995).
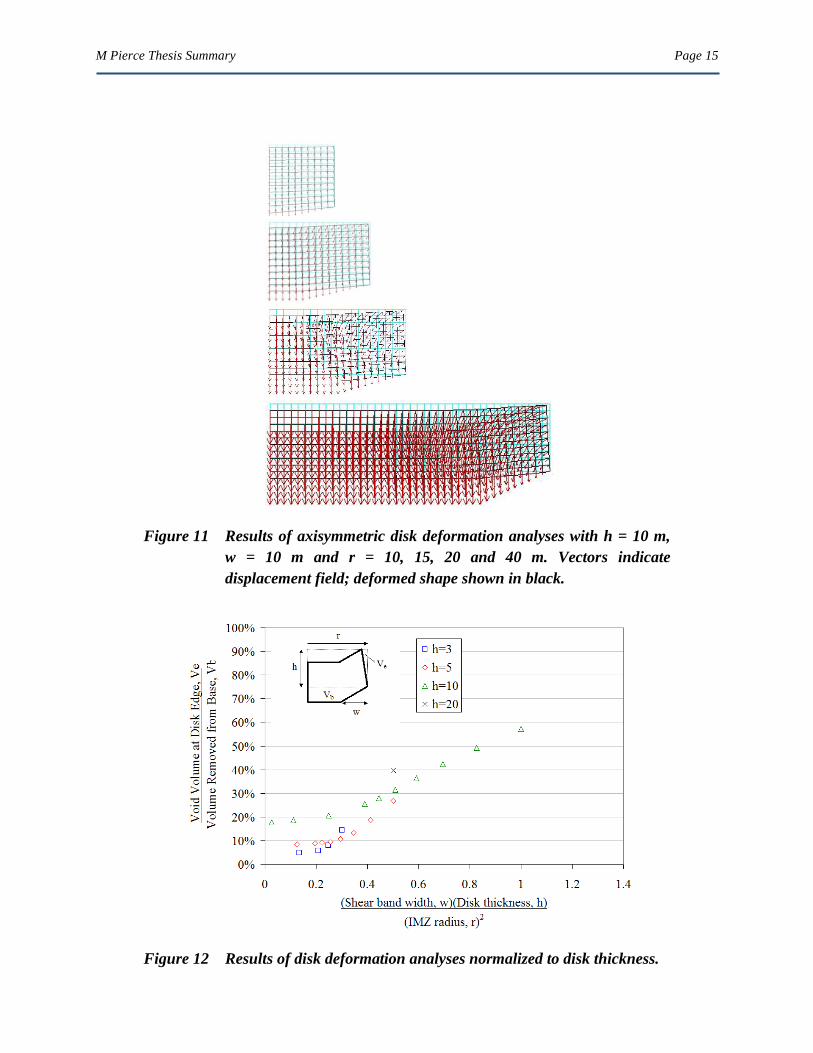
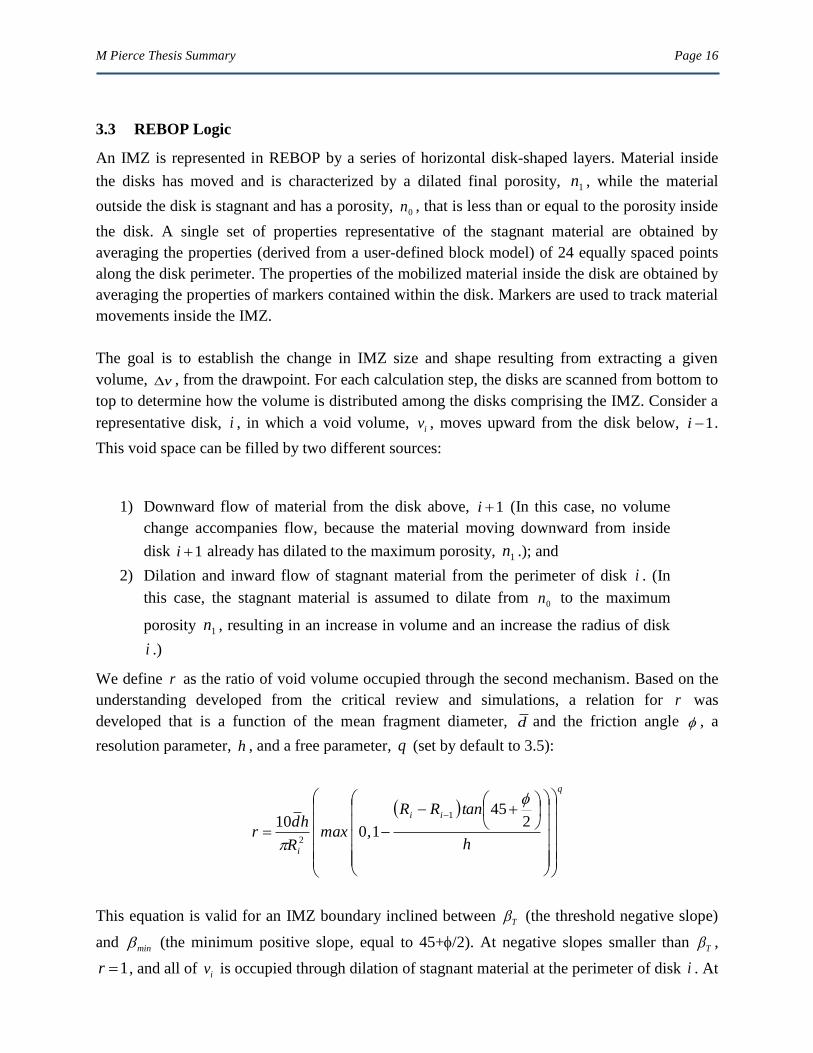
The impact of shear banding on IMZ widening was also studied by subjecting an elastic disk-
shaped volume to deformations consistent with the velocity profiles observed in experiments and
simulations (Figure 11). This disk represents a horizontal slice of finite thickness through the
IMZ. The results of a series of the disk-deformation analyses suggest that shear banding internal
to the IMZ could result in the development of void space at the IMZ periphery, and that the
volume of this void space is proportional to the shear band width relative to the IMZ area (Figure
12). This can be considered an opportunity for stagnant material to dilate and join the volume of
flowing material, which represents a fundamental mechanism controlling widening. This
mechanism also accounts for the sensitivity of IMZ lateral growth rate to particle size and the
drop in lateral growth rate with increasing IMZ width.
M Pierce Thesis Summary Page 13
1.2% 1.6% 1.8%
2.8% 4.4% 8.2%
Figure 9 Drawdown profile as a function of % solid volume drawn on a
vertical section through a PFC3D model of draw from a single
drawpoint (quarter-symmetry). Coloured layers are approximately
5m thick.
M Pierce Thesis Summary Page 14
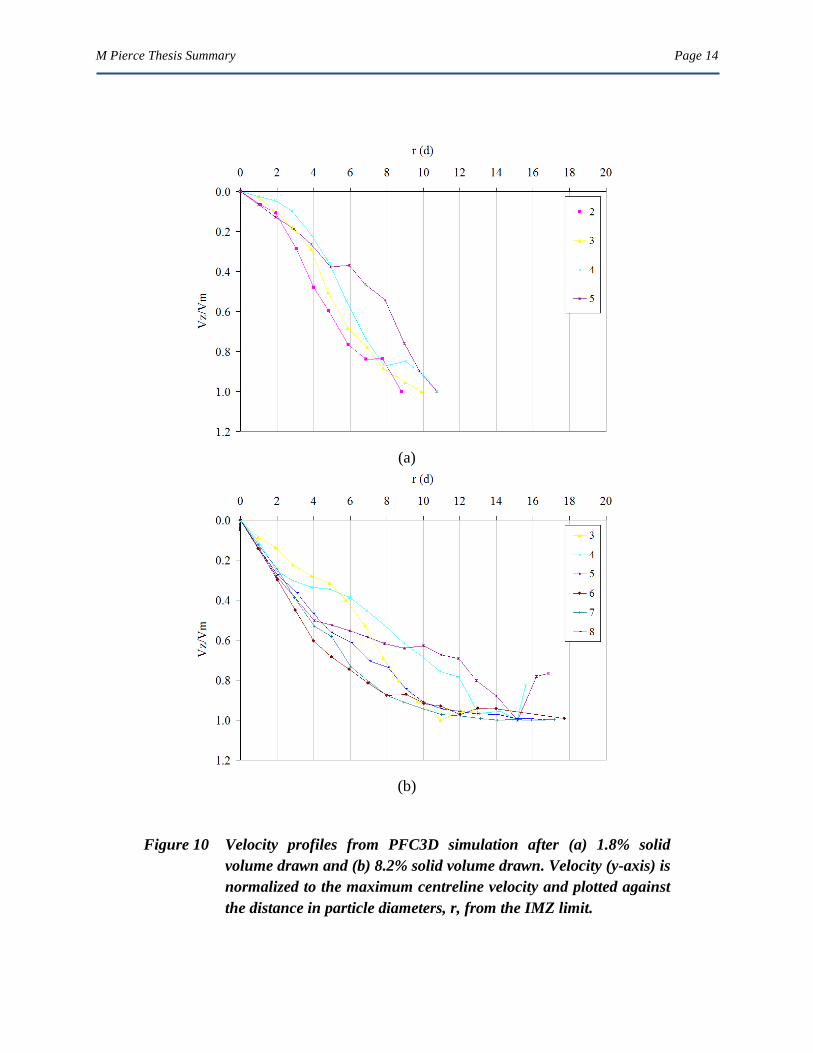
(a)
(b)
Figure 10 Velocity profiles from PFC3D simulation after (a) 1.8% solid
volume drawn and (b) 8.2% solid volume drawn. Velocity (y-axis) is
normalized to the maximum centreline velocity and plotted against
the distance in particle diameters, r, from the IMZ limit.
M Pierce Thesis Summary Page 15
Figure 11 Results of axisymmetric disk deformation analyses with h = 10 m,
w = 10 m and r = 10, 15, 20 and 40 m. Vectors indicate
displacement field; deformed shape shown in black.
Figure 12 Results of disk deformation analyses normalized to disk thickness.
M Pierce Thesis Summary Page 16
3.3 REBOP Logic
An IMZ is represented in REBOP by a series of horizontal disk-shaped layers. Material inside
the disks has moved and is characterized by a dilated final porosity, 1n , while the material
outside the disk is stagnant and has a porosity, 0n , that is less than or equal to the porosity inside
the disk. A single set of properties representative of the stagnant material are obtained by
averaging the properties (derived from a user-defined block model) of 24 equally spaced points
along the disk perimeter. The properties of the mobilized material inside the disk are obtained by
averaging the properties of markers contained within the disk. Markers are used to track material
movements inside the IMZ.
The goal is to establish the change in IMZ size and shape resulting from extracting a given
volume, v , from the drawpoint. For each calculation step, the disks are scanned from bottom to
top to determine how the volume is distributed among the disks comprising the IMZ. Consider a
representative disk, i , in which a void volume, iv , moves upward from the disk below, 1i .
This void space can be filled by two different sources:
1) Downward flow of material from the disk above, 1i (In this case, no volume
change accompanies flow, because the material moving downward from inside
disk 1i already has dilated to the maximum porosity, 1n .); and
2) Dilation and inward flow of stagnant material from the perimeter of disk i . (In
this case, the stagnant material is assumed to dilate from 0n to the maximum
porosity 1n , resulting in an increase in volume and an increase the radius of disk
i .)
We define r as the ratio of void volume occupied through the second mechanism. Based on the
understanding developed from the critical review and simulations, a relation for r was
developed that is a function of the mean fragment diameter, d and the friction angle , a
resolution parameter, h , and a free parameter, q (set by default to 3.5):
q
ii
ih
tanRR
,maxR
hdr
2
45
1010
1
2
This equation is valid for an IMZ boundary inclined between T (the threshold negative slope)
and min (the minimum positive slope, equal to 45+/2). At negative slopes smaller than T ,
1r , and all of iv is occupied through dilation of stagnant material at the perimeter of disk i . At

M Pierce Thesis Summary Page 17
positive slopes equal tomin , r must equal zero, and all of iv is occupied by material from the
disk above.
Once r is determined, we calculate how much the radius of disk i , iR , must increase in order for
dilation of the stagnant material to fully occupy d
iv :
01
2
nnh
rvRR i
ii
The remaining void volume is occupied by material flowing from the disk above, 1i :
ii vrv 11
This introduces a void into disk 1i , which is partitioned further according to the preceding
calculations. This process is repeated, continuing from disk to disk in an upward fashion, until
the available volume diminishes to zero. This calculation cycle (traversing from lowermost to
uppermost disk) is performed multiple times to permit extraction of the full v from the
drawpoint.
Markers are used in REBOP to track material movements. Their positions are updated regularly
according to the velocity profile internal to the IMZs. The form of the velocity profile within a
given disk depends on the disk radius iR relative to the shear band width, iw . If the disk radius is
less than or equal to the shear band width i iR w , the plug flow region does not exist, and the
velocity profile is in the shape of an inverted cone. In this case, the vertical displacement at any
point is given by:
2
13
i
i
mi
mR
R
av
z
where ma is the radial distance of the marker from the disk center and iv is the total cumulative
void volume that has been passed up from disk 1i to disk i since the last marker update. This
accounts for the linear variation of velocity between the drawpoint centreline and its IMZ
boundary.
If the disk radius is greater than the shear band width, ( iR > iw ), a plug flow region of radius
iip wRR is introduced, and the velocity profile takes the shape of an inverted truncated cone
M Pierce Thesis Summary Page 18
(i.e. a frustum). If the marker lies within the plug flow region (pm Ra ), the vertical
displacement of the marker is given by:
22
3
PPii
i
mRRRR
vz
and if it lies in the shear annulus, it is given by:
22
13
PPii
i
Pm
i
mRRRR
w
Rav
z
Inward radial displacements are expected to occur within the IMZ as a result of the dilation of
stagnant material at the IMZ perimeter. For a change in disk radius of old
iii RRR , the
maximum radial displacement maximum displacement occurs at old
iR , and is presumed to
decrease in a linear fashion inward to the disk centre and outward to the new disk radius:
If old
im Ra :
i
old
ii
mR
Rs
nn
nRs 1
1
01
1
and if old
im Ra :
old
i
m
old
ii
mR
aR
nn
nRa 1
1
01
1
Markers must undergo an additional radial displacement if the IMZ boundary slope is positive (
1 ii RR ) and the marker moves from disk i to disk 1i :
m
i
i'
m aR
Ra
11
Under these conditions, markers must also undergo additional vertical displacement to conserve
volume. This is approximated by the following equation:
M Pierce Thesis Summary Page 19
m
mmi
i
iim'
mz
zzz
R
RRzz
2
1
2
1
2
where iz is the base elevation of disk i .
3.4 Testing and Validation
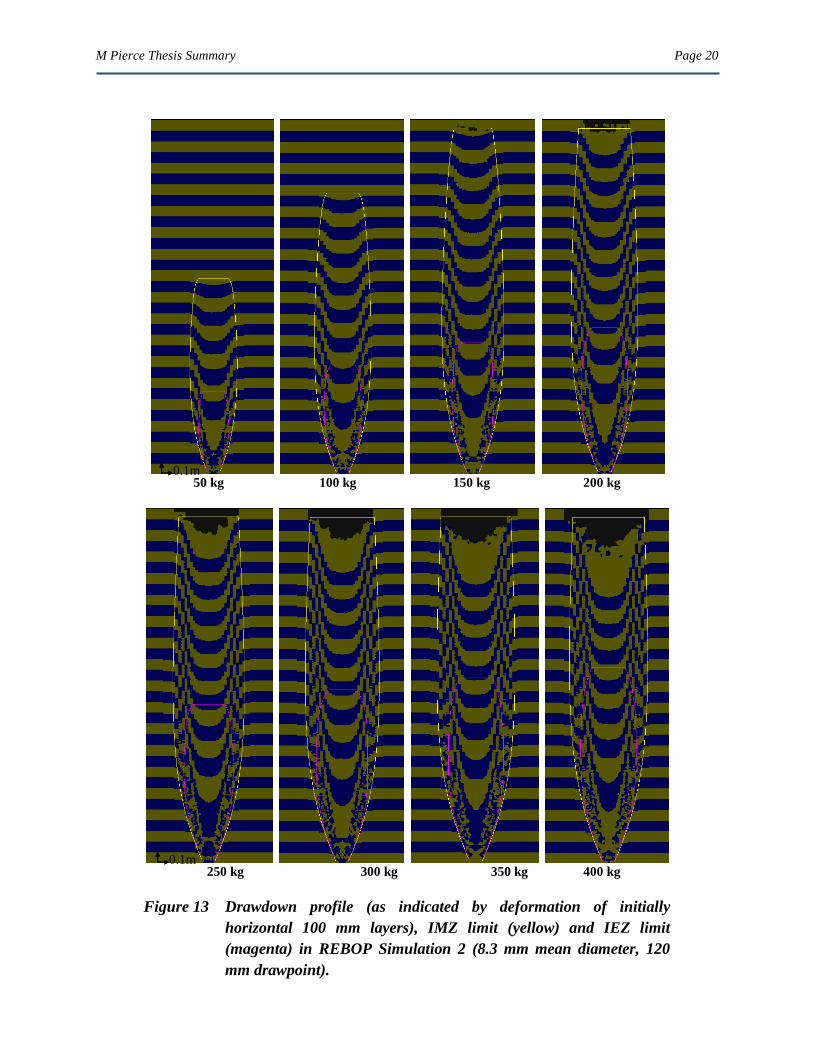
Using the IMZ growth logic described above, REBOP exhibits a sensitivity to fragment size,
drawpoint width, friction angle and porosity jump that is consistent with the conclusions drawn
from the range of physical and numerical models analysed, and with the results of additional
DEM and continuum simulations conducted as part of this thesis. In general, REBOP also
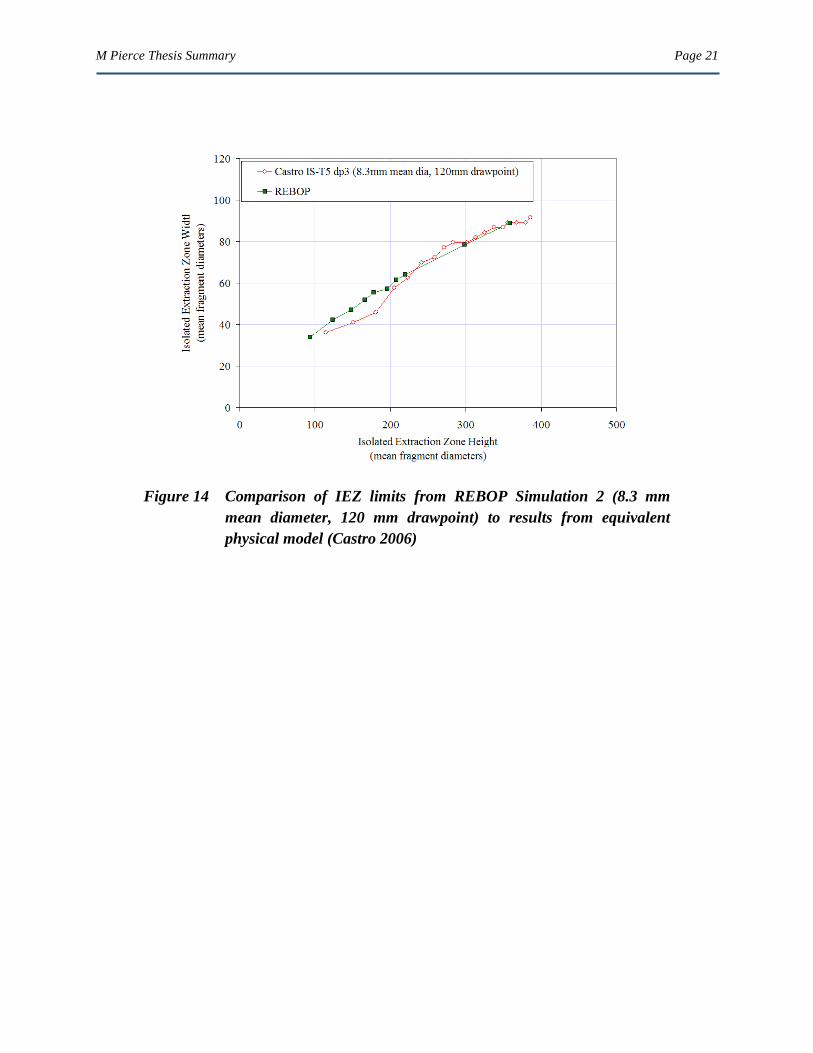
exhibits far-field IMZ and IEZ sizes and shapes under isolated draw that are consistent with the
kinematic theory of Nedderman (1995) and the physical experiments by Castro (2006) (Figure
13 and Figure 14). IMZ widths were over-predicted at small ratios of fragment diameter to
drawpoint width, however. Further work is recommended to better understand the kinematics
and mechanics of flow under these conditions, particularly as relates to hang-up potential.
M Pierce Thesis Summary Page 20
50 kg 100 kg 150 kg 200 kg
250 kg 300 kg 350 kg 400 kg
Figure 13 Drawdown profile (as indicated by deformation of initially
horizontal 100 mm layers), IMZ limit (yellow) and IEZ limit
(magenta) in REBOP Simulation 2 (8.3 mm mean diameter, 120
mm drawpoint).
0.1m
0.1m
M Pierce Thesis Summary Page 21
Figure 14 Comparison of IEZ limits from REBOP Simulation 2 (8.3 mm
mean diameter, 120 mm drawpoint) to results from equivalent
physical model (Castro 2006)
M Pierce Thesis Summary Page 22
4.0 FLOW ABOVE MULTIPLE DRAWPOINTS: OVERLAPPING DRAW
4.1 Critical Review
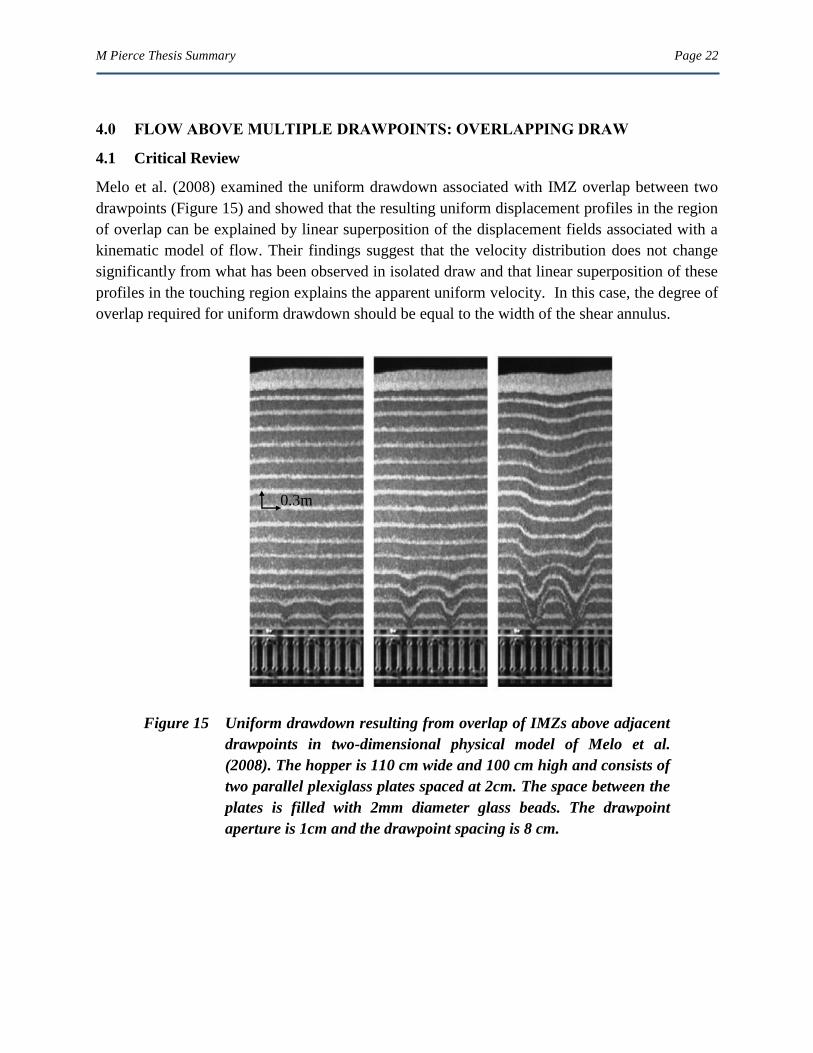
Melo et al. (2008) examined the uniform drawdown associated with IMZ overlap between two
drawpoints (Figure 15) and showed that the resulting uniform displacement profiles in the region
of overlap can be explained by linear superposition of the displacement fields associated with a
kinematic model of flow. Their findings suggest that the velocity distribution does not change
significantly from what has been observed in isolated draw and that linear superposition of these
profiles in the touching region explains the apparent uniform velocity. In this case, the degree of
overlap required for uniform drawdown should be equal to the width of the shear annulus.
Figure 15 Uniform drawdown resulting from overlap of IMZs above adjacent
drawpoints in two-dimensional physical model of Melo et al.
(2008). The hopper is 110 cm wide and 100 cm high and consists of
two parallel plexiglass plates spaced at 2cm. The space between the
plates is filled with 2mm diameter glass beads. The drawpoint
aperture is 1cm and the drawpoint spacing is 8 cm.
0.3m
M Pierce Thesis Summary Page 23
4.2 REBOP Logic
The variable porosity jump around the IMZ that occurs during overlap is handled by the IMZ
logic developed for isolated draw and so no additional logic was required to simulate the flow
conditions during overlapping draw.
4.3 Testing and Validation
Using IMZ superposition to represent overlap, REBOP exhibits drawdown profiles that are
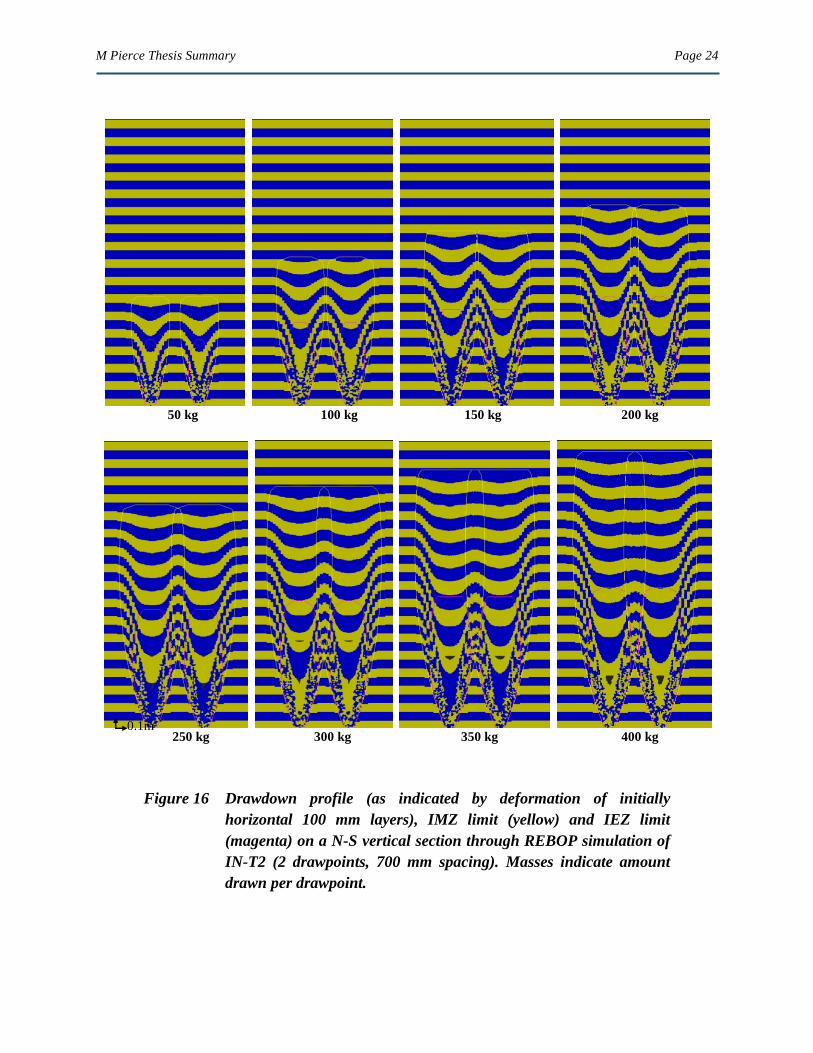
qualitatively consistent with the results of physical modelling studies (Figure 16). Back analysis
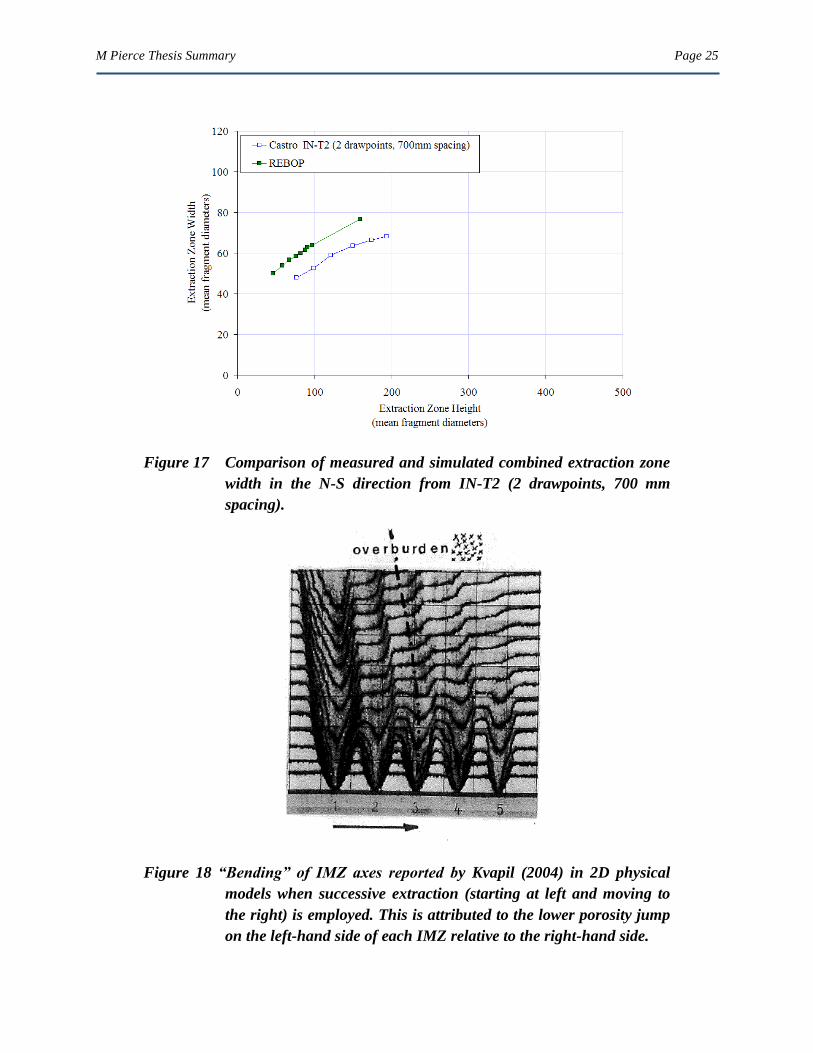
of the multiple drawpoint physical experiments of Castro (2006) suggests that IEZ size and shape
is over predicted in REBOP relative to the physical model (Figure 17). This is attributed to the
―bending‖ of the IMZ axes toward each other, which has been observed in experiments with bins
and silos (Figure 18) but is not represented within REBOP. While this effect is expected to
diminish in the far field under conditions of uniform concurrent draw (where overlap of the two
IMZs becomes extreme), it could impact flow more significantly under non-uniform or non-
concurrent draw. Future versions of REBOP should consider the impacts of non-uniform
porosity jump and the corresponding potential for asymmetric flow and ―bending‖ of IMZ axes.
M Pierce Thesis Summary Page 24
50 kg 100 kg 150 kg 200 kg
250 kg 300 kg 350 kg 400 kg
Figure 16 Drawdown profile (as indicated by deformation of initially
horizontal 100 mm layers), IMZ limit (yellow) and IEZ limit
(magenta) on a N-S vertical section through REBOP simulation of
IN-T2 (2 drawpoints, 700 mm spacing). Masses indicate amount
drawn per drawpoint.
0.1m
M Pierce Thesis Summary Page 25
Figure 17 Comparison of measured and simulated combined extraction zone
width in the N-S direction from IN-T2 (2 drawpoints, 700 mm
spacing).
Figure 18 “Bending” of IMZ axes reported by Kvapil (2004) in 2D physical
models when successive extraction (starting at left and moving to
the right) is employed. This is attributed to the lower porosity jump
on the left-hand side of each IMZ relative to the right-hand side.
M Pierce Thesis Summary Page 26
5.0 FLOW ABOVE MULTIPLE DRAWPOINTS: INTERACTIVE DRAW AND THE
ROLE OF STRESS
5.1 Critical Review
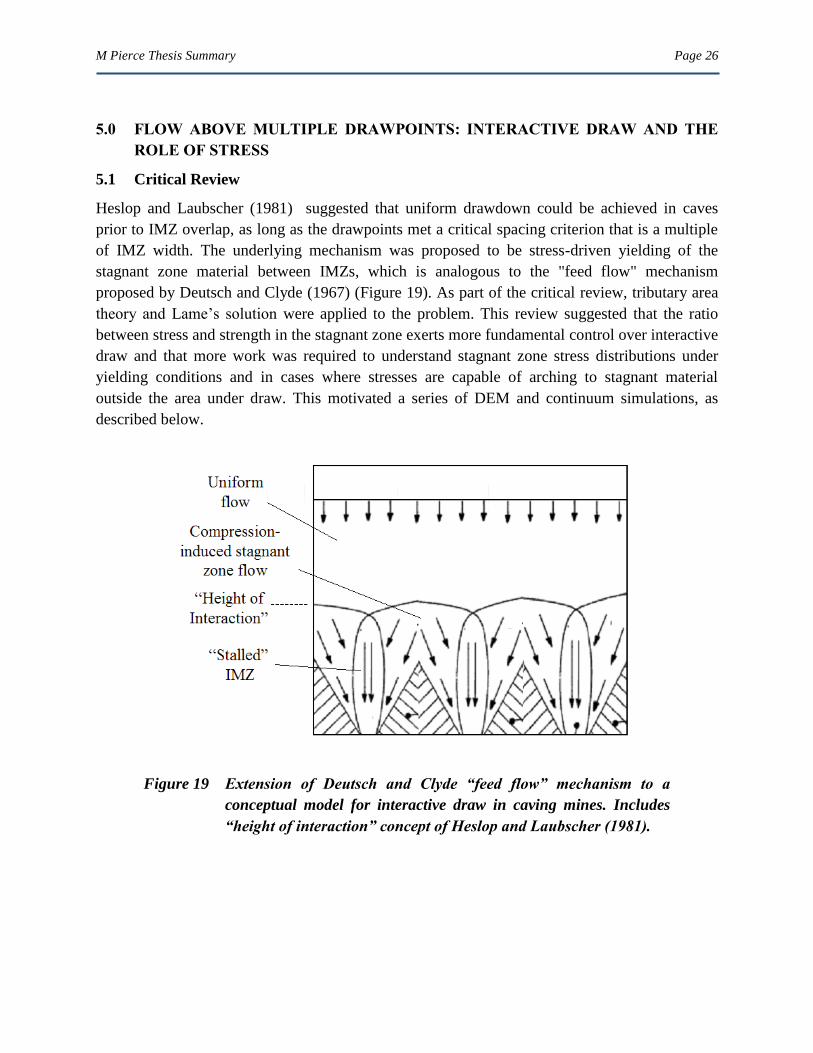
Heslop and Laubscher (1981) suggested that uniform drawdown could be achieved in caves
prior to IMZ overlap, as long as the drawpoints met a critical spacing criterion that is a multiple
of IMZ width. The underlying mechanism was proposed to be stress-driven yielding of the
stagnant zone material between IMZs, which is analogous to the "feed flow" mechanism
proposed by Deutsch and Clyde (1967) (Figure 19). As part of the critical review, tributary area
theory and Lame‘s solution were applied to the problem. This review suggested that the ratio
between stress and strength in the stagnant zone exerts more fundamental control over interactive
draw and that more work was required to understand stagnant zone stress distributions under
yielding conditions and in cases where stresses are capable of arching to stagnant material
outside the area under draw. This motivated a series of DEM and continuum simulations, as
described below.
Figure 19 Extension of Deutsch and Clyde “feed flow” mechanism to a
conceptual model for interactive draw in caving mines. Includes
“height of interaction” concept of Heslop and Laubscher (1981).
M Pierce Thesis Summary Page 27
5.2 Simulations
Before attempting to understand the distribution of stress and yield around multiple drawpoints, a
series of single-drawpoint DEM simulations and axisymmetric continuum simulations (Figure
20) were conducted to develop a better understanding of the nature of stress redistribution around
a single drawpoint. The conclusions of the single drawpoint studies are as follows.
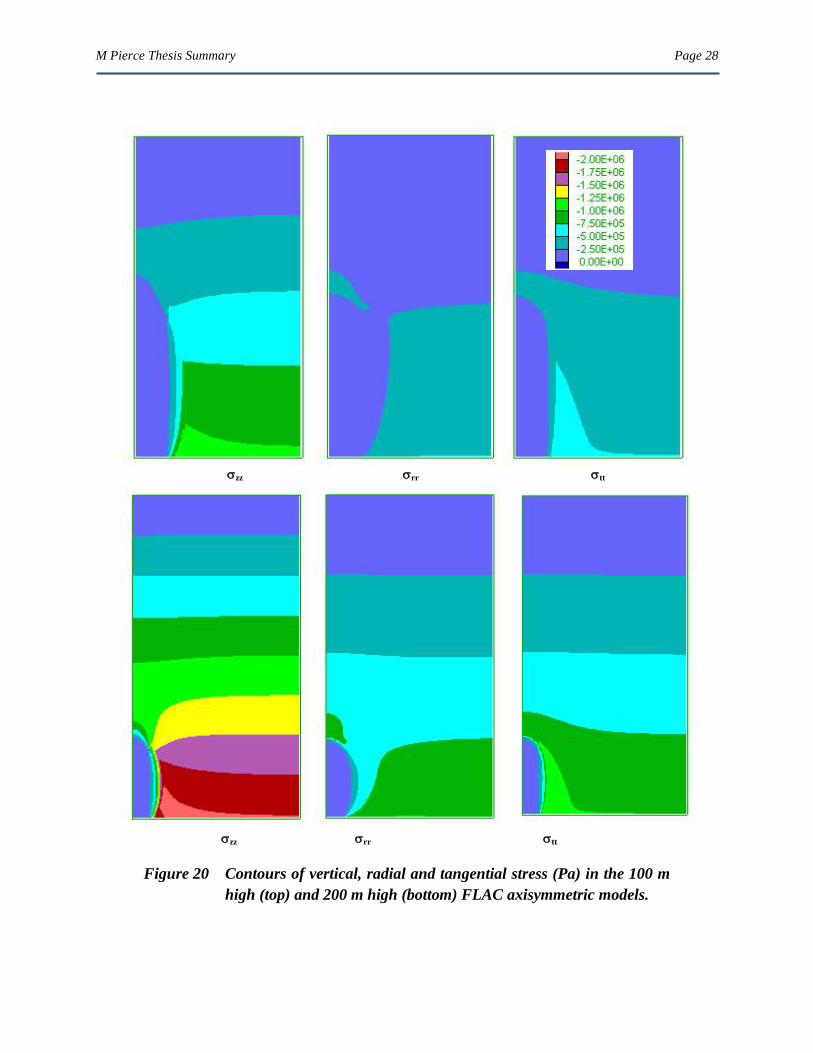
Both DEM and continuum models demonstrate that the vertical and radial stresses
inside the IMZ are approximately equal, and independent of both IMZ height and
overburden height. Janssen‘s (1895) equation for steady-state stresses in a tall
narrow bin was shown to provide a reasonable estimate IMZ stresses as a function
of the IMZ radius and caved-rock frictional strength.
Both DEM and continuum models suggest that an annulus of yielding stagnant
zone material (referred to as the plastic zone) develops around an IMZ (Figure
21). This is due to the presence of low radial stresses inside the IMZ relative to
high vertical stresses outside the IMZ. This material generally does not flow,
however, as long as vertical stresses are able to redistribute into the surrounding
unyielded stagnant zone (referred to as the elastic zone). This explains why
kinematics alone are sufficient to explain the evolution in IMZ shape when
experiments and simulations employ boundaries that lie far from the IMZ. The
IMZ doesn‘t ―see‖ the vertical stresses in the stagnant zone because it is
effectively shielded from them by a plastic zone, which varies in thickness
according to the level of vertical stress.
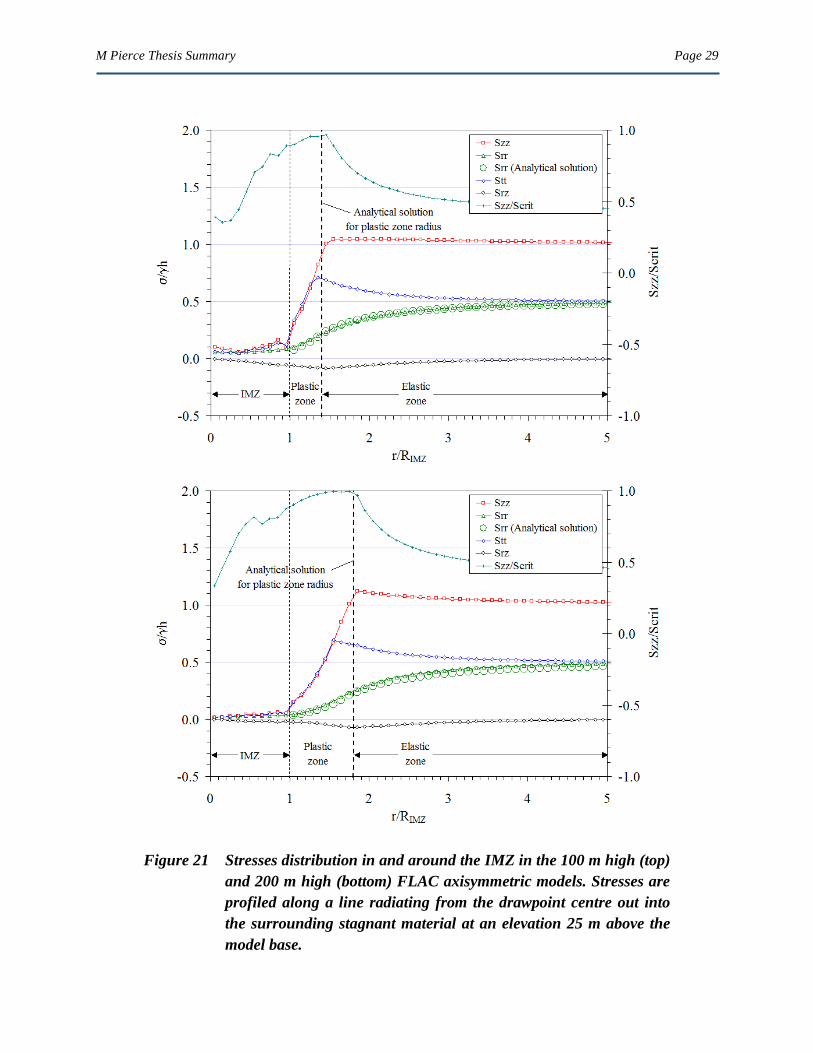
The large area of stagnant zone material surrounding the drawpoint that is
available to carry stresses shed from the plastic zone, combined with the fact that
this area increases in proportion to the squared distance from the IMZ, means that
induced vertical stresses in the elastic zone are close to the initial vertical stresses.
The analytical solution for a pressurized shaft in a Mohr-Coulomb material
(Carranza-Torres 2002) was shown (through comparison to the continuum model
results) to provide a reasonable estimate of the plastic zone radius, and the radial
stresses in the plastic and elastic zones.
M Pierce Thesis Summary Page 28
zz rr tt
zz rr tt
Figure 20 Contours of vertical, radial and tangential stress (Pa) in the 100 m
high (top) and 200 m high (bottom) FLAC axisymmetric models.
M Pierce Thesis Summary Page 29
Figure 21 Stresses distribution in and around the IMZ in the 100 m high (top)
and 200 m high (bottom) FLAC axisymmetric models. Stresses are
profiled along a line radiating from the drawpoint centre out into
the surrounding stagnant material at an elevation 25 m above the
model base.
M Pierce Thesis Summary Page 30
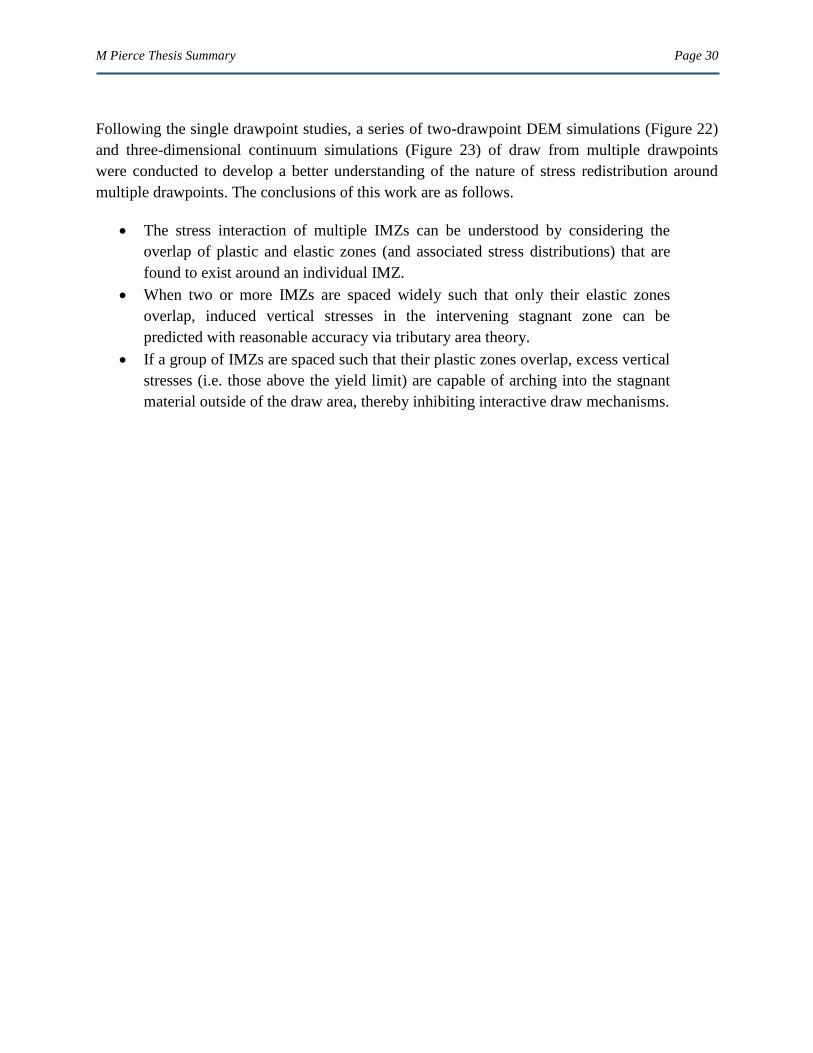
Following the single drawpoint studies, a series of two-drawpoint DEM simulations (Figure 22)
and three-dimensional continuum simulations (Figure 23) of draw from multiple drawpoints
were conducted to develop a better understanding of the nature of stress redistribution around
multiple drawpoints. The conclusions of this work are as follows.
The stress interaction of multiple IMZs can be understood by considering the
overlap of plastic and elastic zones (and associated stress distributions) that are
found to exist around an individual IMZ.
When two or more IMZs are spaced widely such that only their elastic zones
overlap, induced vertical stresses in the intervening stagnant zone can be
predicted with reasonable accuracy via tributary area theory.
If a group of IMZs are spaced such that their plastic zones overlap, excess vertical
stresses (i.e. those above the yield limit) are capable of arching into the stagnant
material outside of the draw area, thereby inhibiting interactive draw mechanisms.
M Pierce Thesis Summary Page 31
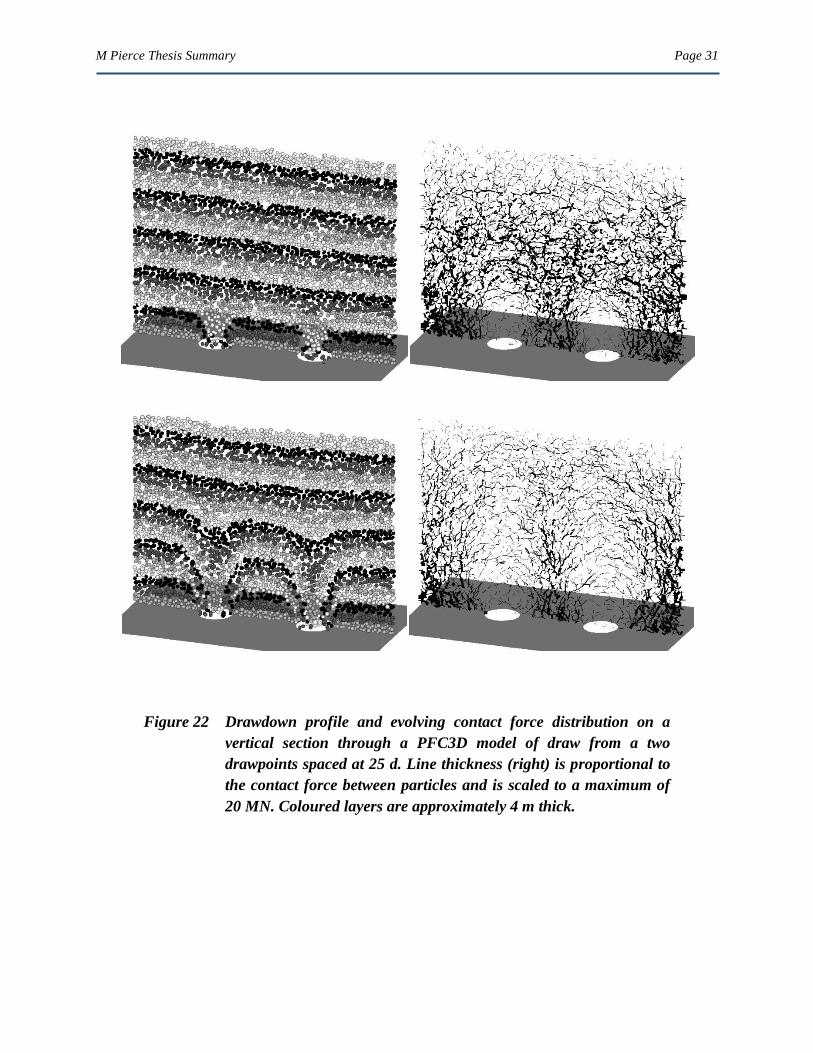
Figure 22 Drawdown profile and evolving contact force distribution on a
vertical section through a PFC3D model of draw from a two
drawpoints spaced at 25 d. Line thickness (right) is proportional to
the contact force between particles and is scaled to a maximum of
20 MN. Coloured layers are approximately 4 m thick.
M Pierce Thesis Summary Page 32
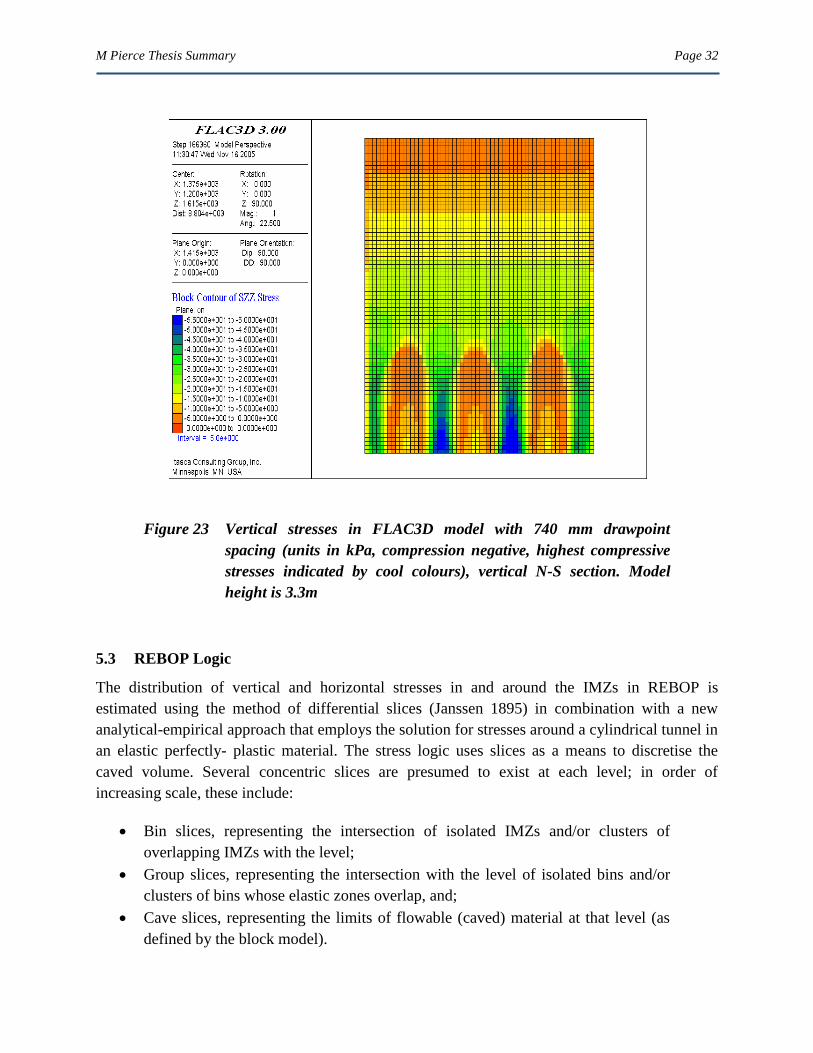
Figure 23 Vertical stresses in FLAC3D model with 740 mm drawpoint
spacing (units in kPa, compression negative, highest compressive
stresses indicated by cool colours), vertical N-S section. Model
height is 3.3m
5.3 REBOP Logic
The distribution of vertical and horizontal stresses in and around the IMZs in REBOP is
estimated using the method of differential slices (Janssen 1895) in combination with a new
analytical-empirical approach that employs the solution for stresses around a cylindrical tunnel in
an elastic perfectly- plastic material. The stress logic uses slices as a means to discretise the
caved volume. Several concentric slices are presumed to exist at each level; in order of
increasing scale, these include:
Bin slices, representing the intersection of isolated IMZs and/or clusters of
overlapping IMZs with the level;
Group slices, representing the intersection with the level of isolated bins and/or
clusters of bins whose elastic zones overlap, and;
Cave slices, representing the limits of flowable (caved) material at that level (as
defined by the block model).
M Pierce Thesis Summary Page 33
The slices employed in the stress logic are distinct from, but analogous to, the disks employed in
the IMZ limit logic. The first step in the stress-prediction methodology is to estimate the average
vertical stresses within the caved volume using the method of differential slices (Janssen, 1895).
An analytical-empirical approach then is used to estimate how the horizontal and vertical stresses
are likely to redistribute locally within the stagnant material in each cave slice to accommodate
the intersection of IMZs. A key assumption in this approach is that the average cave-scale
vertical stresses (as calculated for the current cave geometry) remain constant in each cave slice.
The resulting stress logic allows for the prediction of vertical and horizontal stress distributions
in and around IMZs without resorting to finite element or finite difference techniques, and
accounts for the presence of low stresses inside the IMZs resulting from arching, the extent of
surrounding plastic and elastic zones, and a distribution of stresses in the stagnant zones that
consider the potential for arching outside of the draw area.
5.4 Testing and Validation
The stress logic in REBOP is capable of predicting stress arching, the development of a plastic
zone around the IMZs and the associated redistribution of stresses away from the IMZs and into
stagnant zones that are sufficiently wide to sustain them (Figure 24 and Figure 25). Back analysis
of the multiple drawpoint physical experiments of Castro (2006) (in which stresses were
measured at the model base) suggests that the stress logic would benefit from additional study of
stress distributions at the base of the draw area. Stresses predicted farther up in the column
appear to be reasonable when compared with the results of three-dimensional continuum models
of draw conducted as part of this thesis (Figure 23).
M Pierce Thesis Summary Page 34
0 kg 10 kg 20 kg
40 kg 80 kg 160 kg
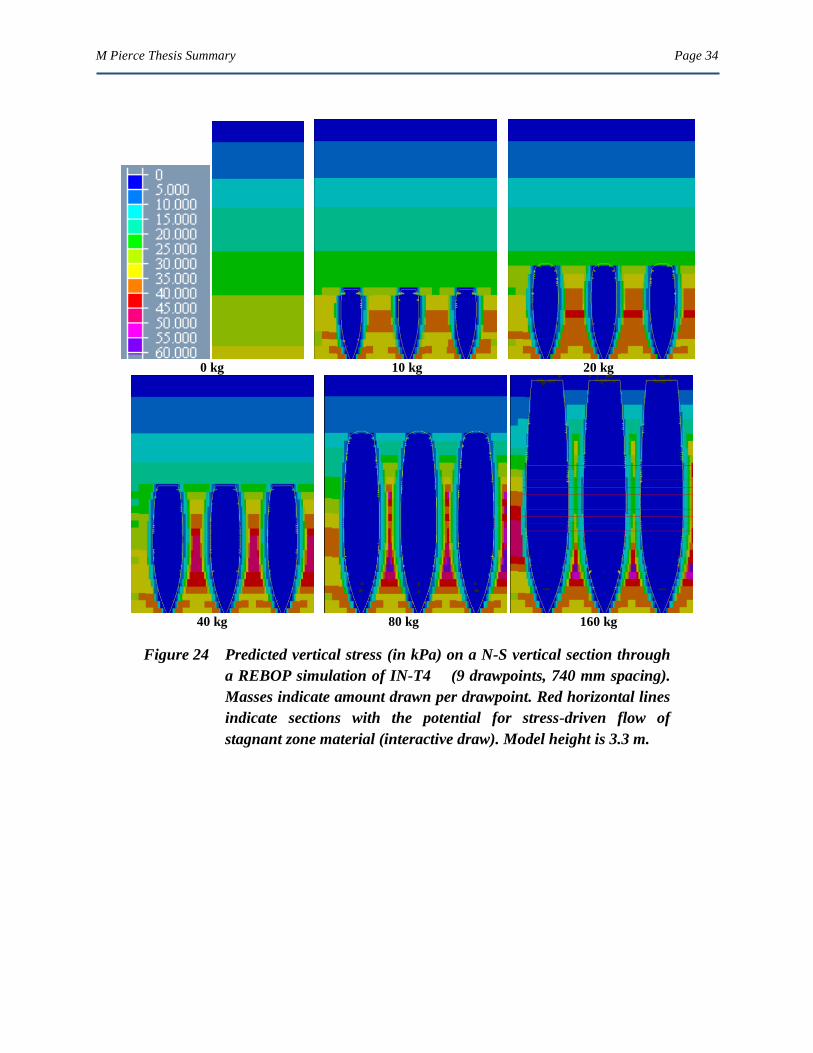
Figure 24 Predicted vertical stress (in kPa) on a N-S vertical section through
a REBOP simulation of IN-T4 (9 drawpoints, 740 mm spacing).
Masses indicate amount drawn per drawpoint. Red horizontal lines
indicate sections with the potential for stress-driven flow of
stagnant zone material (interactive draw). Model height is 3.3 m.
M Pierce Thesis Summary Page 35
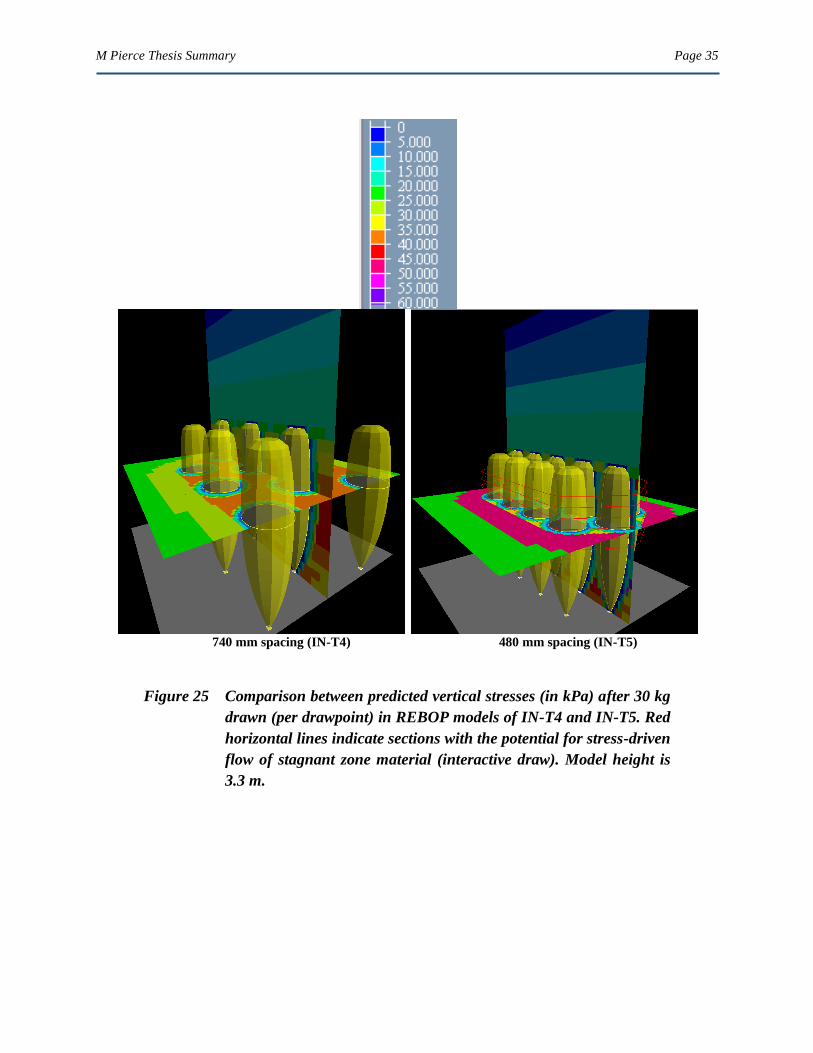
740 mm spacing (IN-T4) 480 mm spacing (IN-T5)
Figure 25 Comparison between predicted vertical stresses (in kPa) after 30 kg
drawn (per drawpoint) in REBOP models of IN-T4 and IN-T5. Red
horizontal lines indicate sections with the potential for stress-driven
flow of stagnant zone material (interactive draw). Model height is
3.3 m.
M Pierce Thesis Summary Page 36
6.0 SECONDARY FRAGMENTATION
6.1 Critical Review
In the literature, secondary fragmentation within caving commonly is attributed to a combination
of splitting (bulk fracture or crushing) and rounding (abrasion) that occurs as rock fragments
travel from the cave back to the drawpoints. A review of stress and strain conditions within the
cave suggests that it is logical to consider secondary fragmentation under conditions of
compression and shear, which broadly characterise conditions in the stagnant zones and IMZs,
respectively. Secondary fragmentation also may result from impact loading associated with a fall
through an air gap. This falls outside the scope of this current thesis, but is worthy of further
investigation. The following conclusions were drawn from a critical review of secondary
fragmentation mechanisms and controls:
Splitting failure modes dominate under compression and under shearing at high
stress:strength ratios. In laboratory studies on granular materials, the size
distribution in these cases is observed to rotate around the largest fragment size
and to evolve toward a fractal distribution of sizes (straight line on a log-log
distribution plot). The largest fragments survive because they are stabilised by
large numbers of smaller fragments surrounding them.
Rounding dominates under shearing at low stress:strength ratios. The size
distribution in this case develops a larger percentage of fine material that results
in a bi-modal distribution under laboratory test conditions.
A review of experimental studies on the behaviour of granular material under compression and
shear suggests that there are several key factors that are likely to control secondary fragmentation
in caves, including shear strain, stress, shape, size distribution, strength and initial porosity. The
following conclusions are drawn from this review.
The results of laboratory compression tests provide strong evidence for a positive
correlation between aspect ratio and splitting potential under compression. In
contrast, tests conducted by Bridgwater et al. (2003) on a range of aspect ratios
suggest that fragmentation under shearing is insensitive to aspect ratio.
Experimental evidence suggests that angularity increases the potential for both
splitting and rounding under compression.
There is evidence to suggest that the range of sizes impacts splitting; uniformly-
sized materials have been found to be more susceptible to splitting than well-
graded materials under both compression and shearing. This is due to the
influence of the coordination number (the number of contacts), which acts to
stabilise particles and increases with the range of sizes present as a result of
denser packing.
There is strong evidence from tests on a wide range of materials to suggest that
fragmentation increases with the stress:tensile strength ratio.
M Pierce Thesis Summary Page 37
Materials with a lower initial porosity may experience less breakage under
compression due to the fact that, in a more compact assembly, the forces are
distributed among a larger number of particles, thereby decreasing the tensile
stresses generated in any one particle.
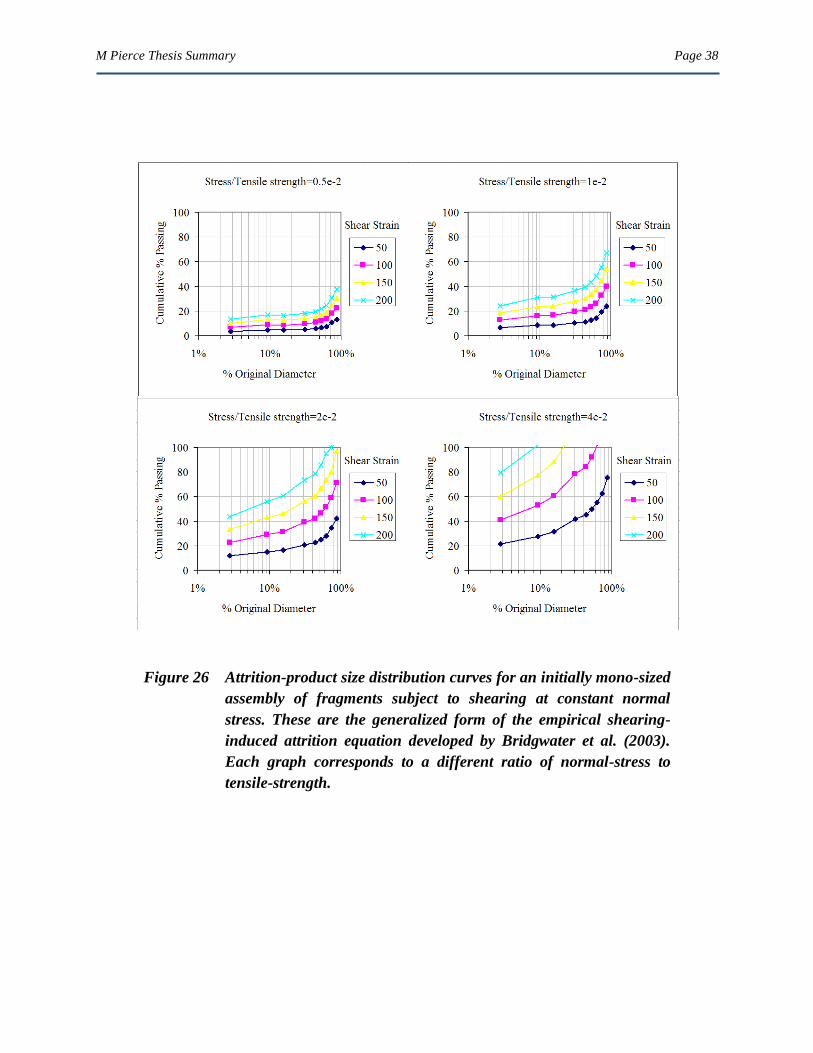
The empirical breakage model of Bridgwater et al. (2003) was identified as having potential for
estimating shearing-induced secondary fragmentation within a caving context. Based on the
results of the experiments, Bridgwater et al. (2003) assert that the mechanics of attrition for
initially mono-sized assemblies, when evaluated over a broad range of stresses and strains, are
united in a simple manner, by way of an empirical attrition law:
scs
N
NKW
where W is the mass fraction attrited for a given normal stress, N , and shear strain, ; scs is the
tensile strength; and KN , and are empirical constants. This suggests that secondary
fragmentation under shearing is strongly controlled by the product of stress and shear strain,
which is essentially the work done on the material. Bridgwater et al. (2003) provide the empirical
constants for a number of different fragment shapes combined over a range of attrition product
sizes. A family of generalized attrition-product size distribution curves was generated based on
the attrition equation (Figure 26).
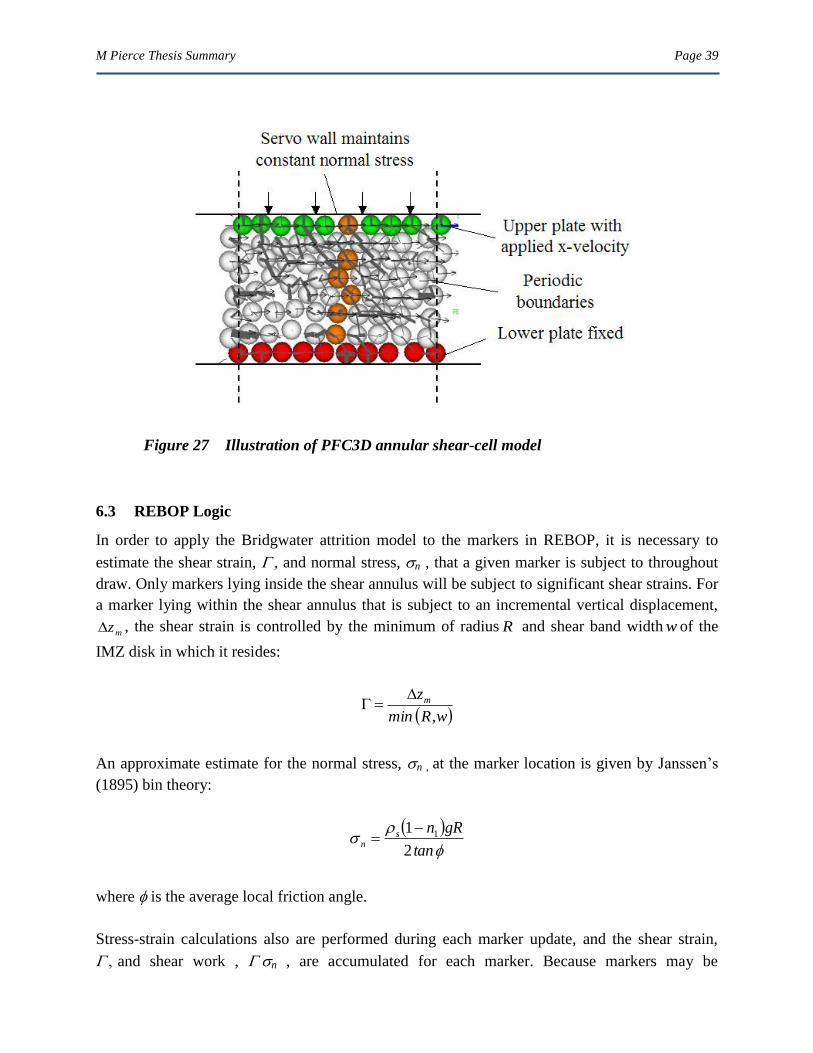
6.2 Simulations
A methodology also was developed for the study of shearing-induced secondary fragmentation
via rounding with DEM models (Figure 27). The proposed methodology employs periodic
boundaries to allow for very large shear strains under conditions similar to an annular shear-cell
experiment. It also incorporates a new microphysical law for implicit prediction of rounding as a
function of the slip work that accompanies frictional interactions between particles. The
following conclusions were drawn from a series of simulations employing this methodology:
The model exhibits a sensitivity to shear strain and normal stress that is consistent
with Bridgwater et al.‘s (2003) experimental results at low normal stress levels
(where rounding dominates). At high levels of normal stress, the numerical results
deviate from the experimental data due to the absence of splitting mechanisms.
The results of a series of shear simulations conducted at varying levels of slip
work efficiency and normal stress suggest that the slip work performed during
shear is inefficient.
The proposed methodology offers promise as a means to extend Bridgwater et
al.‘s model to materials more closely resembling caved rock.
M Pierce Thesis Summary Page 38
Figure 26 Attrition-product size distribution curves for an initially mono-sized
assembly of fragments subject to shearing at constant normal
stress. These are the generalized form of the empirical shearing-
induced attrition equation developed by Bridgwater et al. (2003).
Each graph corresponds to a different ratio of normal-stress to
tensile-strength.
M Pierce Thesis Summary Page 39
Figure 27 Illustration of PFC3D annular shear-cell model
6.3 REBOP Logic
In order to apply the Bridgwater attrition model to the markers in REBOP, it is necessary to
estimate the shear strain, and normal stress, n , that a given marker is subject to throughout
draw. Only markers lying inside the shear annulus will be subject to significant shear strains. For
a marker lying within the shear annulus that is subject to an incremental vertical displacement,
mz , the shear strain is controlled by the minimum of radius R and shear band width w of the
IMZ disk in which it resides:
w,Rmin
zm
An approximate estimate for the normal stress, n , at the marker location is given by Janssen‘s
(1895) bin theory:
tan
gRnsn
2
1 1
where is the average local friction angle.
Stress-strain calculations also are performed during each marker update, and the shear strain,
and shear work , n , are accumulated for each marker. Because markers may be
M Pierce Thesis Summary Page 40
encompassed by more than one IMZ, shear work can be performed on a marker via draw from
multiple drawpoints. When combined with the empirical constants K, and and a user-defined
tensile strength, we can obtain an estimate of the size distribution for the attrited marker.
6.4 Testing and Validation
No experimental data were available for testing of the logic at the drawpoint scale. Testing and
validation of the logic were restricted to back-analysis of draw from Henderson 7700 Level, as
discussed in the case study analysis.
7.0 FINES MIGRATION
7.1 Critical Review
Bridgwater et al. (1978) described fines migration as a release-capture process in which a
percolating particle travels downward through layers of larger bed particles in discrete steps.
Bridgwater et al. carried out a large number of shear box experiments to measure shear-induced
percolation rates. Of the particle properties, the ratio of percolating-particle diameter to bed-
particle diameter (diameter ratio) was found to have the largest effect on percolation rate. There
are some key differences between the materials and bed conditions used in Bridgwater et al.‘s
(1978) percolation rate experiments (horizontal shearing of isolated fines within a bed of
uniformly sized spheres) and those existing within a column of caved rock under draw. Caved
rock exhibits a range of particle sizes with non-spherical shapes, and has a greater proportion of
finer fragments, and the shearing direction is vertical (or near-vertical) in caved rock under draw
rather than horizontal.
7.2 Simulations
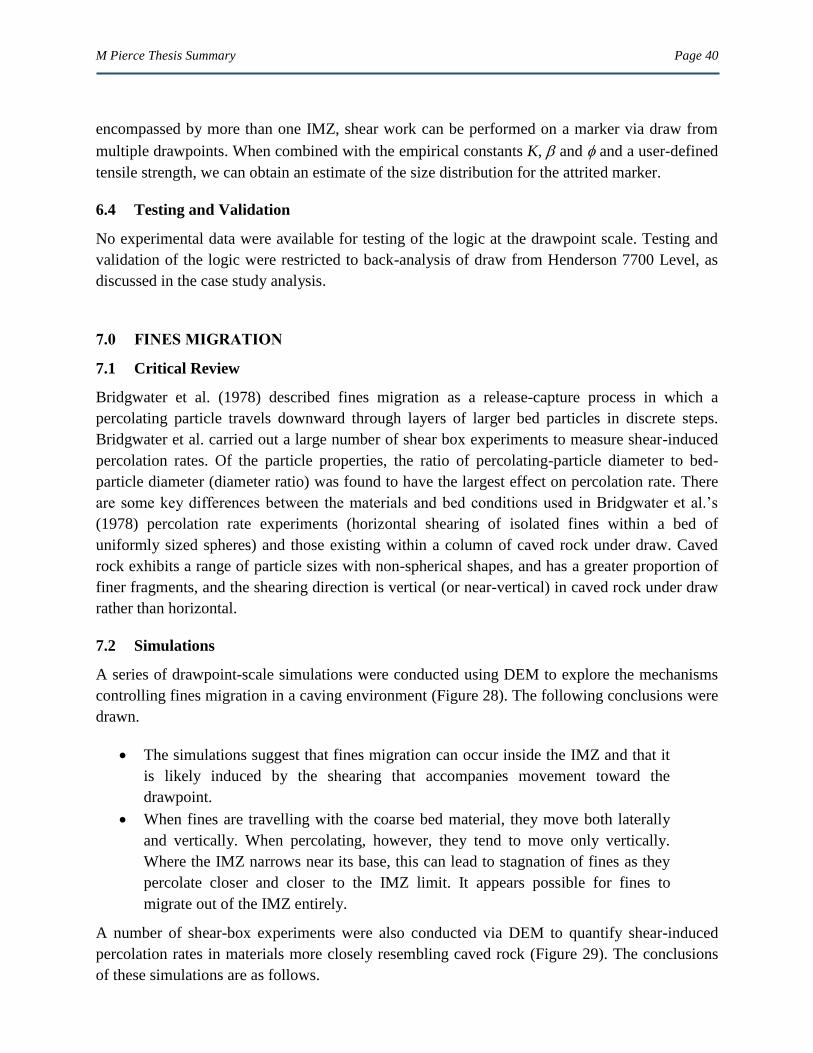
A series of drawpoint-scale simulations were conducted using DEM to explore the mechanisms
controlling fines migration in a caving environment (Figure 28). The following conclusions were
drawn.
The simulations suggest that fines migration can occur inside the IMZ and that it
is likely induced by the shearing that accompanies movement toward the
drawpoint.
When fines are travelling with the coarse bed material, they move both laterally
and vertically. When percolating, however, they tend to move only vertically.
Where the IMZ narrows near its base, this can lead to stagnation of fines as they
percolate closer and closer to the IMZ limit. It appears possible for fines to
migrate out of the IMZ entirely.
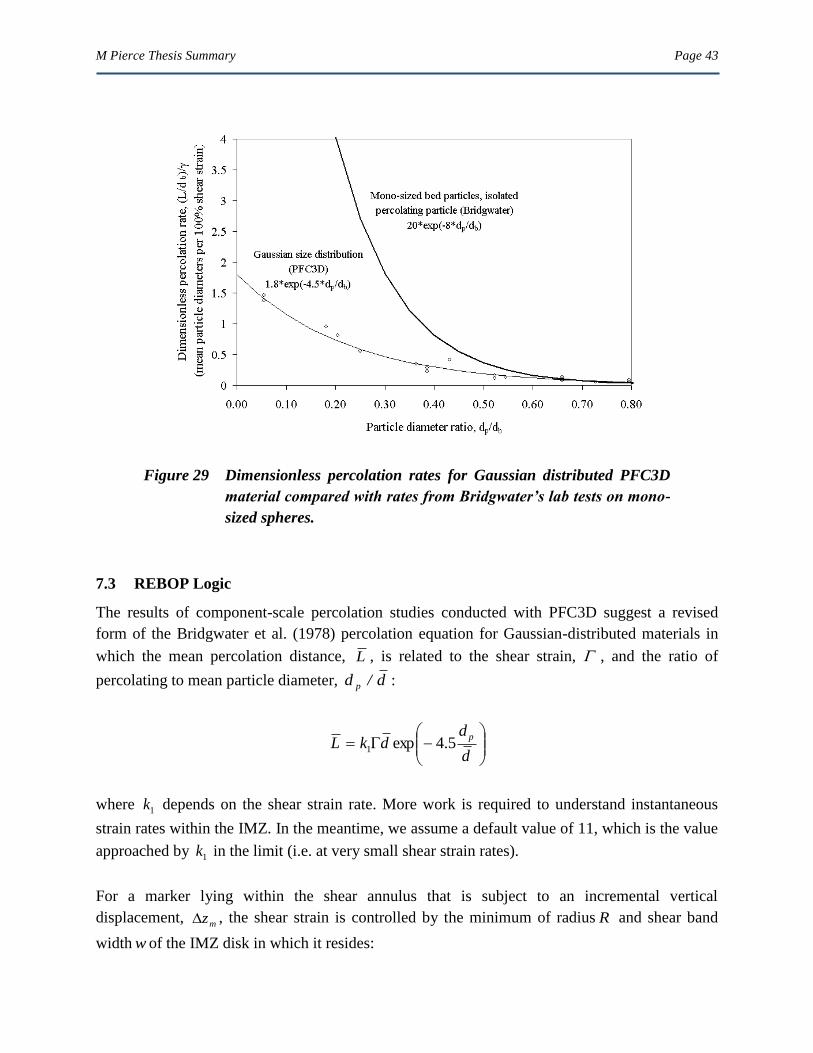
A number of shear-box experiments were also conducted via DEM to quantify shear-induced
percolation rates in materials more closely resembling caved rock (Figure 29). The conclusions
of these simulations are as follows.
M Pierce Thesis Summary Page 41
Comparisons between the results of shear tests of Bridgwater et al. (1978) and
similar tests conducted in PFC3D show a good match, indicating that PFC3D is
able to capture the essential mechanisms involved in shear-induced percolation.
The impact of particle shape (spherical versus clumped) and direction of shearing
was found to be negligible in tests on mono-size assemblies with isolated
percolating particles.
Simulation of non-dilute mixtures more typical of caved rock indicate that mean
percolation rates are lower for materials containing a Gaussian distribution of
particle sizes, and that the percolation rate can be related to shear strain and the
ratio of particle diameter to mean particle diameter. A percolation rate equation
was developed for caved rock based on these findings (Figure 29).
It also was demonstrated that percolation rate is sensitive to strain rate. Measures
of instantaneous strain rate from full-scale flow simulations can be used to
determine the appropriate constants in the percolation rate equation developed
from this research.
M Pierce Thesis Summary Page 42
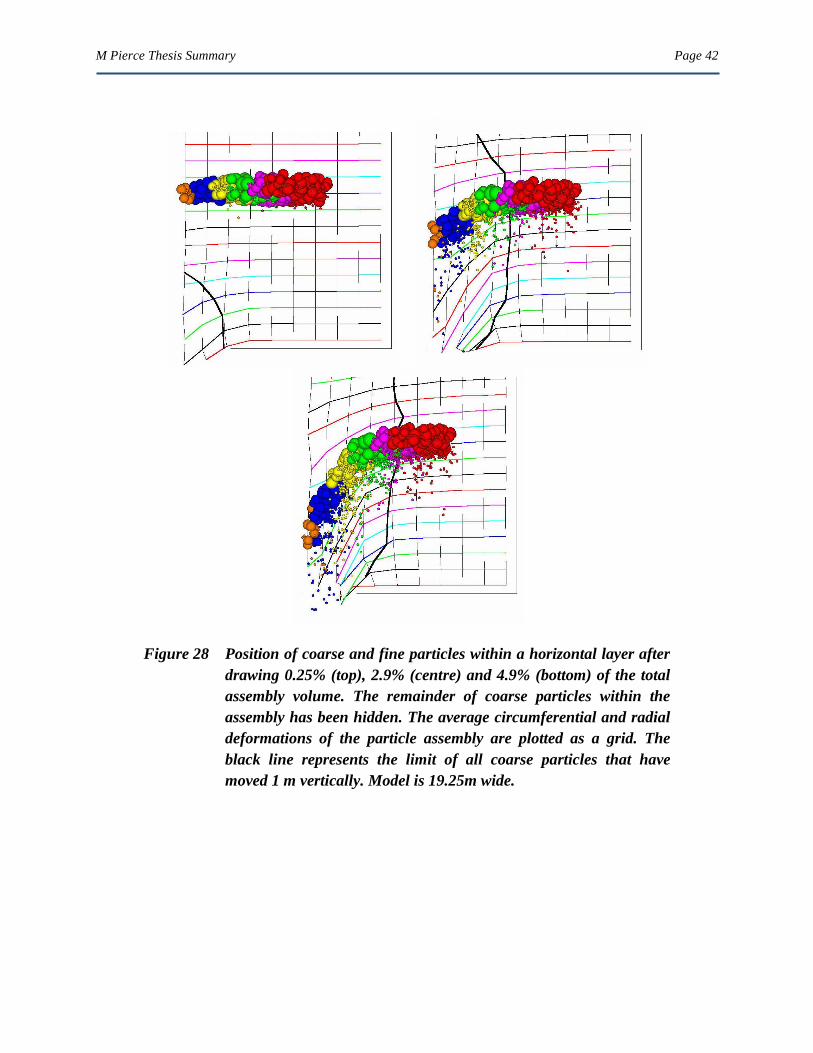
Figure 28 Position of coarse and fine particles within a horizontal layer after
drawing 0.25% (top), 2.9% (centre) and 4.9% (bottom) of the total
assembly volume. The remainder of coarse particles within the
assembly has been hidden. The average circumferential and radial
deformations of the particle assembly are plotted as a grid. The
black line represents the limit of all coarse particles that have
moved 1 m vertically. Model is 19.25m wide.
M Pierce Thesis Summary Page 43
Figure 29 Dimensionless percolation rates for Gaussian distributed PFC3D
material compared with rates from Bridgwater’s lab tests on mono-
sized spheres.
7.3 REBOP Logic
The results of component-scale percolation studies conducted with PFC3D suggest a revised
form of the Bridgwater et al. (1978) percolation equation for Gaussian-distributed materials in
which the mean percolation distance, L , is related to the shear strain, , and the ratio of
percolating to mean particle diameter, d/d p :
d
ddkL
p5.4exp1
where 1k depends on the shear strain rate. More work is required to understand instantaneous
strain rates within the IMZ. In the meantime, we assume a default value of 11, which is the value
approached by 1k in the limit (i.e. at very small shear strain rates).
For a marker lying within the shear annulus that is subject to an incremental vertical
displacement, mz , the shear strain is controlled by the minimum of radius R and shear band
width w of the IMZ disk in which it resides:
M Pierce Thesis Summary Page 44
w,Rmin
zm
This is combined with the current diameter of the marker fragments and the mean fragment
diameter within the host IMZ disk to obtain an estimate of the mean percolation distance, L , for
the marker. The standard deviation in percolation distance, L*, is estimated via:
Ld*L b
A key assumption in this calculation is that the Peclet number for caved rock under draw is the
same as for isolated fines percolating through a mono-sized bed (i.e. Pe = 2). This requires
further investigation and could be addressed by quantifying the variation in percolation distance
exhibited by the PFC3D models developed in this thesis. Finally, the mean and standard
deviations in percolation distance calculated define a Gaussian distribution that is sampled
randomly to establish the percolation distance for the current marker.
7.4 Testing and Validation
The fines migration logic was tested through back-analysis of the scaled physical models of
Castro (2006) that incorporated fine particles of varying diameter. A good match to Castro‘s
results can be obtained by assuming that instantaneous shear strain rates within the IMZ are low
and that lateral movements are restricted during percolation, as suggested by the results of
drawpoint-scale DEM simulations. While percolation velocities are initially high in this case,
they ultimately stagnate near the IMZ limit as they reach the lower part of the IMZ, where it
curves inward. Fines initially located near the IMZ periphery have a good potential to stop
completely by percolating into the underlying stagnant material.
A good match also can be obtained with Castro‘s (2006) results by allowing lateral movement
during percolation and assuming high instantaneous shear-strain rates within the IMZ. However
this results in a poorer match between predicted and observed standard deviations in percolation
rate.
M Pierce Thesis Summary Page 45
8.0 CASE STUDY
The REBOP model developed in this thesis was applied to the study of draw from the 7700
Level of Henderson Mine (Figure 30), employing the new logic for IMZ growth, internal
velocity profile, IMZ overlap, fines migration and secondary fragmentation. Because the new
logic relies on material properties rather than coefficients, this provides an opportunity to test
and validate the model as a predictor of material flow that can be used practically at an industrial
scale. The simulations focussed on analysis of draw from three areas that mine staff had
previously recognized as having distinct grade-tonnage signatures: the Urad Porphyry, Primos
Interior Porphyry and Southeast Boundary. The conclusions drawn from analysis of flow in these
three areas are as follows:
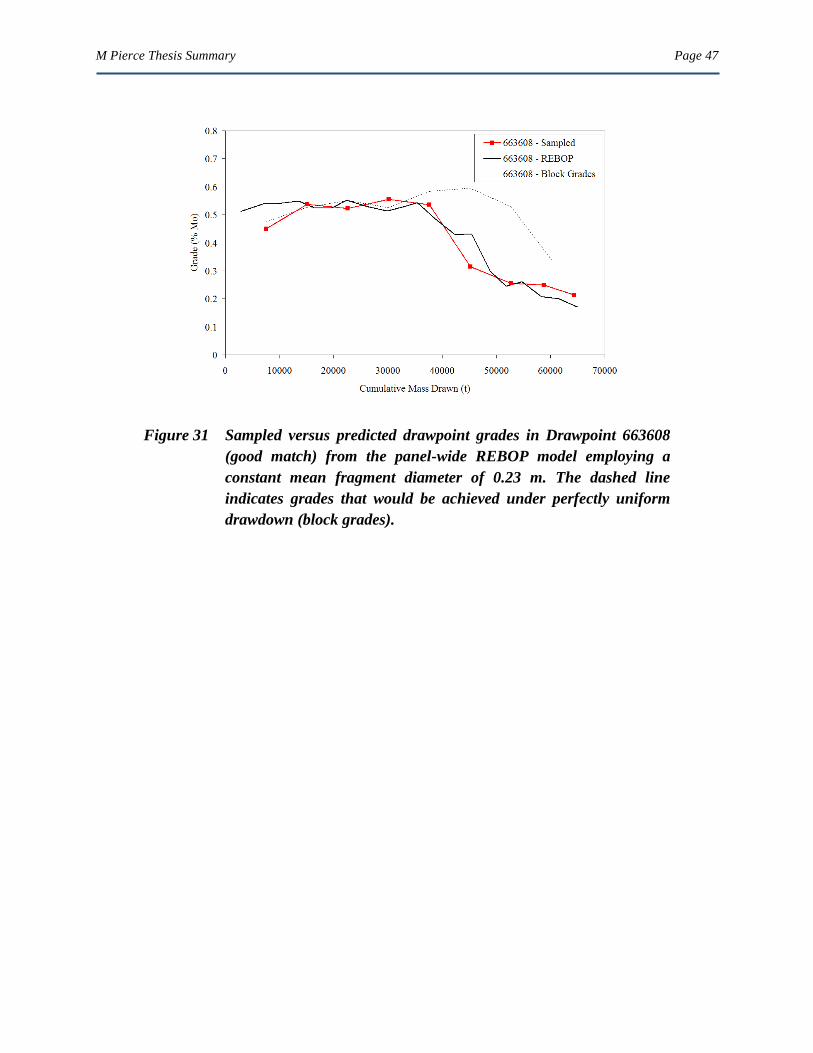
Using measures of fragmentation provided by the mine and reasonable
assumptions regarding final porosity and friction angle, REBOP predicts grade-
tonnage trends throughout most of the Urad porphyry that are in good agreement
with in situ measurements (Figure 31). The IMZs eventually overlap across both
the minor and major apexes under these conditions, which allows for good
recovery of ore in this unit. In certain Urad drawpoints, REBOP overpredicts
grades during mid-draw, as noted by Carlson et al. (2004) from early predictive
modelling work. A much better match could be obtained between predicted and
measured grades in these areas by simply decreasing the initial mean fragment
size by 35% (from 0.23m to 0.15m). This suggests local variations in
fragmentation are responsible for the observed trends and highlights the
importance of accurate fragmentation predictions/measures in obtaining
reasonable predictions of flow via REBOP.
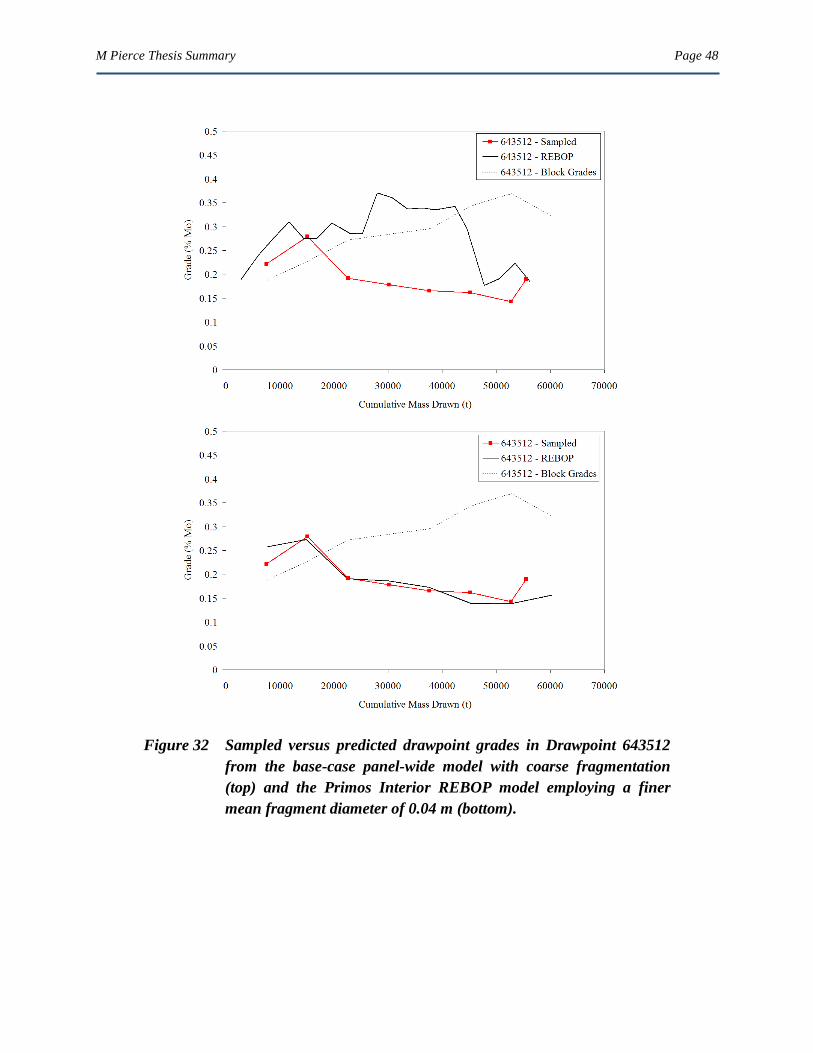
No quantitative measures of fragmentation were available for the Primos Interior
Porphyry. Mine staff had noted previously that the fragmentation in this area was
very fine and that early predictive models tended to overpredict grades during
early draw. By employing a very fine initial fragment diameter of 0.04m in
REBOP, a good match could be obtained between measured and predicted grades
for drawpoints located in the centre of this unit (Figure 32). The IMZs were very
narrow in this case and indicated that isolated draw conditions existed. For
drawpoints located near the contact with the Urad porphyry, a fragment size
intermediate between the Urad and Primos units (0.13m) resulted in a good fit,
suggesting a reasonable mixture of materials there.
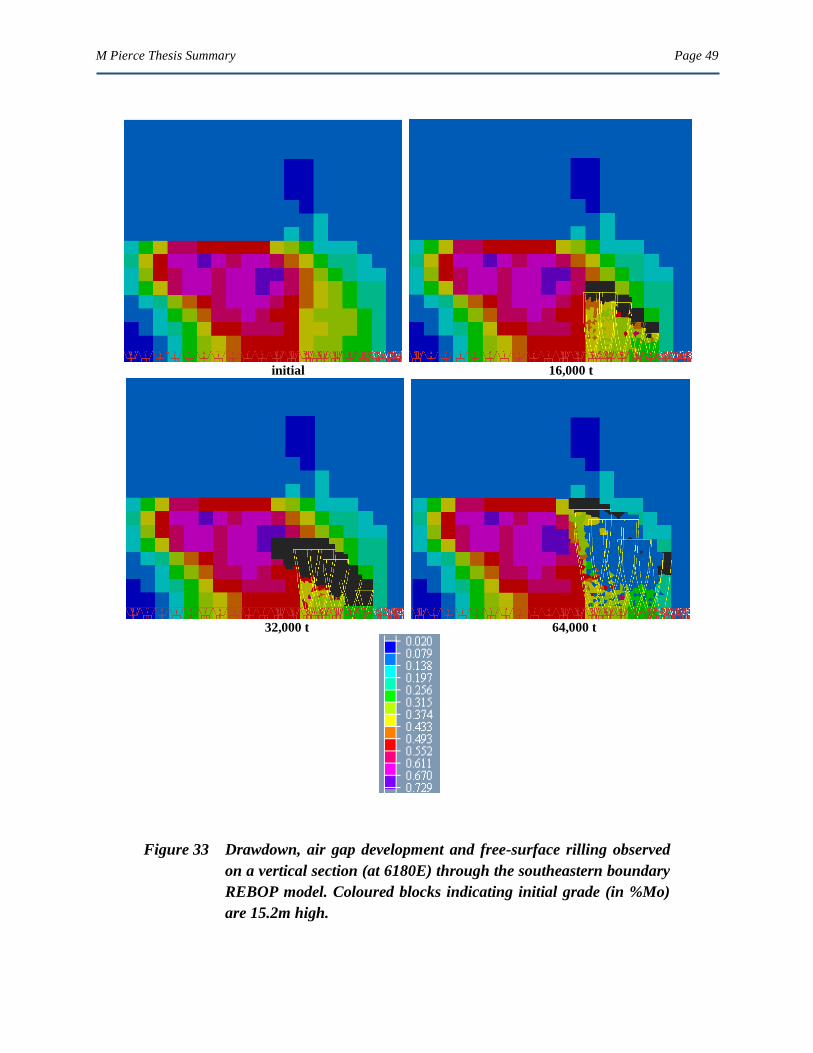
Many of the drawpoints located near the southeast boundary of 7700 panel lie
beyond the southern limits of the overlying 8100 Level panel. Carlson et al.
(2004) attributed the higher than expected grades (late in draw) here to the rilling
of higher grade material from further north in the cave along this angled
boundary. This hypothesis was supported by REBOP modelling in which the cave

M Pierce Thesis Summary Page 46
advance and associated free surface rilling were accounted for (Figure 33). While
the match between observed and measured grades was improved significantly by
including these mechanisms, the results are sensitive to the assumed cave advance
rate and shape. Modelling of flow in such cases would benefit greatly from good
cave monitoring data so that cave advance (relative to the draw schedule) can be
properly accounted for.
When compared to actual measures of fragmentation made in Urad Porphyry
drawpoints on 7700 Level at Henderson, REBOP over-predicts the degree of
secondary fragmentation. This is attributed to the physical experiments of
Bridgwater et al. (2003), upon which the shearing logic is based, which employed
materials with initially uniform sizing.
Application of the fines migration logic to simulation of 7700 Level draw at
Henderson Mine suggests that there is a potential for lower grade fines from the
overlying 8100 Level to migrate preferentially toward the drawpoint, causing an
earlier drop in both mean fragment diameter and grade. When fines migration is
active, the waste from 8100 Level enters the drawpoint earlier, resulting in a
lower average grade toward the middle to late draw.
Figure 30 Vertical section through Henderson Mine (after Doepken 1998).
M Pierce Thesis Summary Page 47
Figure 31 Sampled versus predicted drawpoint grades in Drawpoint 663608
(good match) from the panel-wide REBOP model employing a
constant mean fragment diameter of 0.23 m. The dashed line
indicates grades that would be achieved under perfectly uniform
drawdown (block grades).
M Pierce Thesis Summary Page 48
Figure 32 Sampled versus predicted drawpoint grades in Drawpoint 643512
from the base-case panel-wide model with coarse fragmentation
(top) and the Primos Interior REBOP model employing a finer
mean fragment diameter of 0.04 m (bottom).
M Pierce Thesis Summary Page 49
initial 16,000 t
32,000 t 64,000 t
Figure 33 Drawdown, air gap development and free-surface rilling observed
on a vertical section (at 6180E) through the southeastern boundary
REBOP model. Coloured blocks indicating initial grade (in %Mo)
are 15.2m high.
M Pierce Thesis Summary Page 50
9.0 CONCLUSIONS
A model for gravity flow of fragmented rock was developed in this thesis that relies on the
properties of the fragmented rock to provide predictions of movement and extraction in block
caving mines. In the process, original contributions were made to the understanding of material
property controls and mechanisms governing the size, shape, advance, overlap and interaction of
movement zones, the stresses that develop internal to a cave and the fines migration, secondary
fragmentation and free surface rilling phenomena. These advances relied on a critical review of
available data and a number of DEM and continuum modelling simulations. In the process, a
number of new techniques were developed for the study of gravity flow and associated
mechanisms using these tools. A novel empirical-analytical methodology for the prediction of
stresses inside a cave under draw was also developed and embedded within the code.
Comparison of model predictions with the results of physical modelling studies demonstrated
that the model can provide accurate predictions of movement and extraction in the far-field under
isolated and overlapping draw conditions as well as the fines migration that accompanies draw in
materials with a wide range of sizes. The comparison also demonstrated that the model would
benefit from improvements in the representation of near-field flow, including the potential for
bending of the IMZ axis under overlap conditions and the potential for near-field narrowing of
the IMZ in coarsely fragmented rock. The stress logic requires further testing and validation but
was shown to offer promise as a means to predict how draw control impacts stress redistribution
within the cave and to infer where interactive draw conditions might exist. Once validated, it
could be used to incorporate additional stress-driven mechanisms, such as compression-induced
secondary fragmentation.
Ore grades and fragmentation measured in drawpoints of the 7700 Level panel cave at
Henderson Mine were used to test the newly developed model on a full-scale problem. Good
matches were obtained between predicted and measured drawpoint grades where accurate
measures of initial fragment size were available. In other areas, poor matches between measured
and expected grades could be accounted for in the new model via differences in fragmentation
and by the tendency for materials to rill long distances horizontally beneath uncaved ground.
Fines migration and secondary fragmentation mechanisms were predicted to have a measurable,
but secondary influence on recovery and dilution. The secondary fragmentation logic over
predicted the degree of breakage observed on the mine, suggesting that the underlying empirical
model should be extended and improved. Overall, the model would benefit greatly from further
analysis of mine case studies.
M Pierce Thesis Summary Page 51
10.0 REFERENCES
Note: This is a reference list for the complete thesis. This summary document references a subset
of this list.
Alfaro, M, A. 2002, ‘Mathematical Model of Gravity Flow in Block Caving Mines. Final Report:
Research Project FONDEF 1037.‘ University of Chile, Santiago (in Spanish).
Barraza, M and Corkran, P 2002, ‗Esmeralda Mine Exploitation Project‘, in Proceedings of
MassMin 2000, Brisbane, October-November 2000, ed. G Chitombo, AusIMM, Carlton,
Victoria, Australia
Baxter, J, Tuzun, U, Burnell, J and Heyes, DM 1997, ‗Granular dynamics simulations of two
dimensional heap formation‘, Physical Review E, vol. 55, p. 3546.
Bazant, MZ 2004, ‗A theory of cooperative diffusion in dense granular flow‘, unpublished.
Bell, FG 1992, Engineering properties of soil and rock, 3rd edn, Butterworth-Heinemann,
Oxford.
Blair-Fish, PM and Bransby PL 1973, ‗Flow patterns and wall stresses in a mass-flow bunker‘,
Journal of Engineering for Industry, vol. 95, pp. 17-26.
Bridgwater, J and Ingram, ND 1971, ‗Rate of spontaneous interparticle percolation‘,
Transactions of the Institute of Chemical Engineers, vol. 49, pp. 163−169.
Bridgwater, J, Cooke, MH and Scott, AM 1978, ‗Inter-particle percolation: Equipment
development and mean percolation velocities‘, Transactions of the Institution of
Chemical Engineers, vol. 56, 157.
Bridgwater, J, Sharpe, NW and Stocker, DC 1969, ‗Particle mixing by percolation‘, Transactions
of the Institution of Chemical Engineers‘, vol. 47, 114.
M Pierce Thesis Summary Page 52
Bridgwater, J, Utsumi, R, Zhang, Z and Tuladhar, T 2003, ‗Particle attrition due to shearing –
The effects of stress, strain and particle shape‘, Chemical Engineering Science, vol. 58,
pp. 4649-4665.
Brown, ET (ed.) 1981, Rock characterization, testing and monitoring – ISRM suggested
methods, pp. 171-183, Pergamon, Oxford.
Brown, ET 2003, Block caving geomechanics (The International Caving Study I, 1997-2000),
University of Queensland, JKMRC Monograph Series in Mining and Mineral
Processing, vol. 3, JKMRC, Indooroopilly, Australia.
Brown, RL and Richards, JC 1965, ‗Kinematics of the flow of dry powders and bulk solids‘,
Rheological Acta, vol. 4, pp. 153–165.
Calderon, C, Alfaro, M and Saavedra, J 2004, ‘Computational model for simulation and
visualization of granular flow,‘ in Proud to be miners (Proceedings, MassMin 2004,
Santiago, August 2004), eds A Karzulovic and MA Alfaro, Mineria Chilena, Santiago,
pp. 185-188.
Cardew, PT 1981, ‗Percolation and mixing in failure zones‘, Powder Technology, vo1.28,
pp.119-128.
Carlson, G, Tyler D, DeWolfe, C and Lorig, L 2004, ‗Understanding gravity flow for mix and
dilution modeling at Henderson Mine,‘ in Proud to be miners (Proceedings, MassMin
2004, Santiago, August 2004), eds A Karzulovic and MA Alfaro, Mineria Chilena,
Santiago, pp. 231-237.
Carranza-Torres, C, Alonso, E, Alejano, LR, Varas, F and Fdez-Mamin, G 2002, ‗Elasto-plastic
analysis of deep tunnels in brittle rock using a scaled form of the Mohr-Coulomb failure
criterion‘, in NARMS-TAC 2002: Mining and tunnelling innovation and opportunity,
eds R. Hammah et al., University of Toronto Press, Toronto, vol. 1, pp. 283-293.
Castro, R. 2006, ‗Study of the mechanisms of granular flow for block caving‘, PhD thesis,
University of Queensland.
M Pierce Thesis Summary Page 53
Chevoir, F, Prochnow, M, Moucheront, P, da Cruz, F, Bertrand, F, Gilbaud, J-P, Coussot, P and
Roux, J-N 2001, ‗Dense granular flows in a vertical chute‘, in Powder and Grains 2001,
ed. Y. Kishino, Balkema, Amsterdam 2001, pp. 399–402.
Choi, J, Kudrolli, A and Bazant, MZ 2005, ‘Velocity profile of granular flows inside silos and
hoppers‘, Journal of Physics: Condensed. Matter, vol. 17, S2533–S2548.
Christakis, N, Patel, MK, Cross, M, Baxter, J, Abou-Chakra, H and Tüzün, U 2002, ‗Predictions
of segregation of granular material with the aid of PHYSICA, a 3-D unstructured, finite-
volume modelling framework‘, International Journal for Numerical Methods in Fluids,
vol. 40, pp. 281-291.
Cleary, PW and Sawley, ML 2002, ‗DEM modelling of industrial granular flows: 3D case
studies and the effect of particle shape on hopper discharge,‘ Applied Mathematical
Modelling, vol. 26, pp. 89-111.
Coop, MR, Sorensen, KK, Bodas Freitas, T and Georgoutsos, G 2004, ‗Particle breakage during
shearing of a carbonate sand,‘ Géotechnique, vol. 54, no. 3, pp. 157-163.
Cundall, PA and Strack, DL 1979, ‗A distinct element model for granular assemblies‘,
Géotechnique, vol. 29, pp. 47–65.
Cundall, P, Mukundakrishnan, B and Lorig, L 2000, ‗REBOP (Rapid Emulator Based on
PFC3D) formulation and user‘s guide‘, Itasca Consulting Group, Inc., Report to the
International Caving Study, ICG00-099-7-20, October.
Diering, T 2000, ‗PC-BC: A block cave design and draw control system‘, in Proceedings of
MassMin 2000, Brisbane, October-November 2000, ed. G Chitombo, AusIMM, Carlton,
Victoria, Australia, pp. 469-484.
Deutsch, GP and Clyde, DH 1967, ‗Flow and pressure of granular materials in silos‘, Journal of
Engineering Mechanics ASCE, vol. 93, no. 103. p. 125.
M Pierce Thesis Summary Page 54
Doepken, WG 1982, ‗The Henderson Mine‘, in Underground mining methods handbook, 1st
edn., ed. W Hustrulid, Society for Mining Metallurgy and Exploration: Littleton,
Colorado. pp. 990-997.
Doepken, WG 1998, ‗Henderson Mine,‘ in Techniques in underground mining: Selections from
Underground Mining Methods Handbook, eds RE Gertsch and RL Bullock. Society for
Mining, Metallurgy, and Exploration, Littleton, Colorado.
Drescher, A 1998, ‗Some aspects of flow of granular materials in hoppers,‘ Proceedings of the
Royal Society London, Transactions A, vol. 356, pp. 2649-2666.
Duncan, JM, Byrne, P, Wong, KS and Mabry, P 1980, ‗Strength, stress-strain and bulk modulus
parameters for finite element analysis of stress and movements in soil masses‘,
University of California, Berkeley, Report No UCB/GT/80-01, August.
Ferjani, M 2003, ‗An investigation of the plug/funnel-flow model‘, MS thesis, University of
Minnesota.
Flores, G, Karzulovic, A and Brown, ET 2004, ‗Current practices and trends in cave mining‘, in
Proud to be miners (Proceedings, MassMin 2004, Santiago, August 2004), eds A
Karzulovic and MA Alfaro, Mineria Chilena, Santiago
Fukumoto, T 1992, ‗Particle breakage characteristics in granular soils‘, Soils and Foundation,
vol. 32, no. 1, pp. 26-40.
Gatt, FC 1973, ‗Flow of spheres and near spheres in cylindrical vessels, Part IV - Individual flow
paths in recirculated random packings‘, Australian Nuclear Science Technology
Organisation.
Gemcom for Windows 1999, PC-BC, ver. 98.02, Block-cave mining, User manual and tutorial,
Gemcom Software International Inc., Vancouver, Canada.
Geminard, J-C and Losert, W 2002, ‗Frictional properties of bidisperse granular matter‘,
Physical Review E, vol. 65, 041301, doi:10.1103/PhysRevE. 65.041301.
M Pierce Thesis Summary Page 55
Gerolymos, N and Gazetas, G 2007, ‗A model for grain-crushing-induced landslides —
Application to Nikawa, Kobe 1995‘, Soil Dynamics and Earthquake Engineering, vol.
27, pp. 803-817.
Ghadiri, M, Ning, Z, Kenter, SJ and Puik, E 2000, ‗Attrition of granular solids in a shear cell‘,
Chemical Engineering Science, vol. 55, pp. 5445–5456.
Ghazavi M, Hosseini M and Mollanouri, M 2008, ‗A comparison between angle of repose and
friction angle of sand‘, Geomechanics in the emerging social & technological age (CD
Proceedings, 12th IACMAG Conference, Goa, India, October 2008), X-CD Technologies Inc.,
Toronto, Paper No. M33.
Guest, A.R. (2008). Personal communciation.
Hardin, BO 1985, ‗Crushing of soil particles‘, Journal of Geotechnical Engineering ASCE, vol.
111, no. 10, pp. 1177-1192.
Heslop, TG and Laubscher, D 1981, ‗Draw control in caving operations on Southern African
chrysotile asbestos mines‘, in Design and operation of caving and sublevel stoping
mines, ed. D Stewart, Society of Mining Engineers – AIME, New York, pp.755-774.
Hoek, E and Brown, ET 1980, Underground excavations in rock. Institution of Mining and
Metallurgy, London.
Hustrulid, W. 2001, ‗Review of panel caving – The Henderson Mine‘, 57 pages.
Itasca 1999, PFC3D (Particle Flow Code in 3 Dimensions), ver. 2.0, Itasca Consulting Group,
Inc., Minneapolis, Minnesota, USA.
Itasca 2003, PFC3D (Particle Flow Code in 3 Dimensions), ver. 3.1, Itasca Consulting Group,
Inc., Minneapolis, Minnesota, USA.
Itasca 2008, PFC3D (Particle Flow Code in 3 Dimensions), ver. 4.0, Itasca Consulting Group,
Inc., Minneapolis, Minnesota, USA.
M Pierce Thesis Summary Page 56
Itasca 2009, 3DEC (Three Dimensional Distinct Element Code), ver. 4.1, Itasca Consulting
Group, Inc., Minneapolis, Minnesota, USA.
Jaeger, JC 1967, ‗Failure of rocks under tensile conditions‘, International Journal of Rock
Mechanics and Mining Science, vol. 4, pp. 219-227.
Jaeger, HM and Nagel, SR 1992, ‗Physics of the granular state‘, Science, vol. 233, no. 5051, pp.
1523-1531 (March).
Janelid, J and Kvapil R 1966, ‗Sublevel Caving‘, International Journal of Rock Mechanics and
Mining Science & Geomechanical Abstracts, vol. 3, pp. 129-153.
Jansen, U and Stoyan, D 2000, ‗On the validity of the Weibull failure model for brittle particles‘,
Granular Matter, vol. 2, 165.
Janssen, HA 1895, ‗Experiments regarding grain pressure in soils‘, Zeitschrift Des Vereines
Deutscher Ingenieure, vol. 39, no. 35, pp.1045-1049, Translated from German by W
Hustrulid and N Krauland. in Proud to be miners (Proceedings, MassMin 2004,
Santiago, August 2004), eds A Karzulovic and MA Alfaro, Mineria Chilena, Santiago,
pp. 201-214.
Jolley, D. 1968, 'Computer simulations of the movement of ore and waste in an underground
mine‘, CIMM Bulletin, 61: 854-859.
Karlsson, P, Klisinski, M and Runesson, K 1998, ‗Finite element simulations of granular
material flow in plane silos with complicated geometry‘, Powder Technology, vol. 99,
29-39.
Kézdi, A 1962, Erddrucktheorien, Springer Verlag, Berlin.
Kvapil, R 1964, ‗Gravity flow of granular materials in hoppers and bins‘, International Journal
of Rock Mechanics and Mining Science, vol. 1, pp. 35-41.
Kvapil, R 2004, 'Gravity Flow in Sublevel and Panel Caving - A Common Sense Approach',
Book/CD published with limited circulation.
M Pierce Thesis Summary Page 57
Lade, PV and Yamamuro, JA 1996, ‗Undrained sand behaviour in axisymmetric tests at high
pressures‘, Journal of Geotechnical Engineering ASCE, vol. 122, no. 2, pp. 120-129.
Laetzel, M 2003, ‗From microscopic simulations towards a macroscopic description of granular
media‘, PhD thesis, Universität Stuttgart.
Lambe, TW and Whitman, RV 1969, Soil mechanics, John Wiley & Sons, New York.
Laubscher, D 1994, ‗Cave mining-the state of the art‘, Journal of the South African Institute of
Mining and Metallurgy, pp. 279-293.
Laubscher, DH 2000, ‗Block caving manual‘, prepared for International Caving Study, JKMRC
and Itasca Consulting Group, Inc.
Lee, DM 1992, ‗The angles of friction of granular fills‘, PhD dissertation, University of
Cambridge.
Lee, KJ and Farhoomand, I 1967, ‗Compressibility and crushing of granular soils in anisotropic
triaxial compression‘, Canadian Geotechnical Journal, vol. 4, no. 1, pp. 68-86.
Lee, KL and Seed, HB 1967, ‗Drained strength characteristics of sands‘, Journal of the Soil
Mechanics and Foundations Division, ASCE, Vol. 93, No. SM6, pp. 117-141.
Litwiniszyn, J 1963, ‗The model of a random walk of particles adapted to researches on
problems of mechanics of loose media‘, Bulletin de L' Académie Polonaise des Sciences
Techniques, vol. XI, pp. 593-602.
Lorig, L 2000a, ‗The role of numerical modelling in assessing caveability‘, Report to the
International Caving Study, ICG00-099-3-16, Itasca Consulting Group, Inc., October.
Lorig, L 2000b, ‗Relation between caved column height and vertical stress at the cave base‘,
Final Report, International Caving Study, ed. ET Brown, JKMRC and Itasca Consulting
Group, Inc.
Lorig, L 2002, ‗Modeling of drawpoint flows and dilution at Henderson Mine‘, Report to
Henderson Mine, ICG02-2188-4, Itasca Consulting Group, Inc., January.

M Pierce Thesis Summary Page 58
Lorig, L. 2004, 'Numerical Modeling for Assessment of Rock Mechanics Issues Associated with
Caving on the 7210 Production Level at Henderson Mine — Task 1, Mine Scale Model,'
Itasca Consulting Group, Inc., Report to Henderson Mine, ICG04-2267-43, July.
Lorig, L and Cundall, PA 2000, ‗A rapid gravity flow simulator‘, Final Report, International
Caving Study, ed. ET Brown, JKMRC and Itasca Consulting Group, Inc.
Månsson, A 1995, ‗Development of body of motion under controlled gravity flow of bulk
solids‘, Licentiate Thesis, Luleå University of Technology, Department of Mining
Engineering, ISSN 0280-8242.
Marachi, ND, Chan, CK and Seed, HB 1972, ‗Evaluation of properties of rockfill materials,
Journal of Soil Mechanics, vol. SM1, pp. 95-114 (January).
Marano, G 1980, ‗The interaction between adjacent draw points in free flowing materials and it
application to mining‘, Chamber of Mines Journal, vol. 22, pp. 25-32.
Marsal, RJ 1967, ‗Large scale testing of rockfill materials‘, Journal of Soil Mechanics and
Foundations Division ASCE, vol. 93, no. 2, pp. 27-43.
McDowell, GR 2005, ‗A physical justification for log e – log s based on fractal crushing and
particle kinematics‘, Géotechnique, vol. 55, no. 9, pp. 697-698.
McDowell, GR and Bolton, MD 1998, ‗On the micromechanics of crushable aggregates‘,
Géotechnique, vol. 48, no. 5, pp. 667-679.
McDowell, GR and Humphries, A 2002, ‗Yielding of granular materials‘, Granular Matter, vol.
4, pp. 1–8.
McDowell GR, Bolton MD and Robertson D 1996, ‗The fractal crushing of granular materials‘,
Journal of the Mechanics and Physics of Solids, vol. 44, no. 12, pp. 2079-2102
(December).
M Pierce Thesis Summary Page 59
Melo, F, Vivancoa, F. Fuentes, C and Apablaza, V 2008, ‗Kinematic model for quasi static
granular displacements in block caving: Dilatancy effects on drawbody shapes‘,
International Journal of Rock Mechanics and Mining Sciences, vol. 45, no. 2, pp. 248-
259 (February).
Michalowski, RL 1987, ‗Flow of granular media through a plane parallel/converging bunker‘,
Chemical Engineering Science, vol. 42, pp. 2587-2596.
Mueth, DM, Debregeas, GF, Karczmar, GS, Eng PJ, Nagel SR and Jaeger, HM 2000,
‗Signatures of granular micro-structure in dense shear flows‘, Nature, vol. 406, pp. 385-
389.
Nakata, Y, Hyodo, M, Hyde, AFL, Kato, Y and Murata, H 2001, ‗Microscopic particle crushing
and sand subjected to one-dimensional compression,‘ Soils and Foundations, vol. 41,
no. 1, pp. 69–82.
Natarajan, VVR, Hunt, ML and Taylor, ED 1995, ‗Local measurements of velocity fluctuations
and diffusion coefficients for a granular material flow‘, Journal of Fluid Mechanics,
vol. 253, p. 1.
Nedderman, RM 1995, ‗The use of the kinematic model to predict the development of the
stagnant zone boundary in the batch discharge of a bunker‘, Chemical Engineering
Science, vol. 50, pp. 959-965.
Nedderman, M. and Laohakul, C 1980, ‗The thickness of the shear zone of flowing granular
materials‘, Powder Technology, vol. 25, pp. 91-100.
Nedderman, RM and Tüzün, U 1979, ‗A kinematic model for the flow of granular materials‘,
Powder Technology, vol. 22, pp. 243-253.
Nguyen, TV, Brennen, CE and Sabersky RH 1980, ‗Funnel flow in hoppers‘, Journal of Applied
Mechanics, Transactions ASME. Series E, vol. 47, pp. 729-735.
M Pierce Thesis Summary Page 60
Ouchterlony, F 2005, ‗The Swebrec function: Linking fragmentation by blasting and crushing‘,
Transactions of the Institution of Mining and Metallurgy, Section A, Mining
Technology, vol. 114, no. 1, pp. 29-44 (March).
Paramanathan, BK and Bridgwater, J 1983, ‗Attrition of solids — II: Material behaviour and the
kinetics of attrition‘, Chemical Engineering Science, vol. 38, pp. 207–224.
Pierce, M, Cundall, P, Potyondy, D and Mas Ivars, D 2007, ‗A synthetic rock mass model for
jointed rock‘, in Rock mechanics: Meeting society's challenges and demands
(Proceedings, 1st Canada-U.S. Rock Mechanics Symposium, Vancouver, Canada, May
2007),
eds. E Eberhardt et al., vol. 1, pp. 341-349, Taylor & Francis Group, London.
Potyondy, DO and Cundall, PA 2004, ‗A bonded-particle model for rock‘, International Journal
of Rock Mechanics and Mining Science, vol. 41, pp. 1329-1364.
Pouliquen, O and Gutfraind, R 1996, ‗Stress fluctuations and shear zones in quasi-static granular
chutes flows‘, Physical Review E, vol. 53, pp. 552-561.
Power, G 2004, ‗Modelling granular flow in caving mines: Large scale physical models and full
scale experiments,‘ PhD Thesis, University of Queensland, Brisbane.
Power, G 2007, Personal communication.
Powers, MC 1953, ‗A new roundness scale for sedimentary particles‘, Journal of Sedimentary
Petrology, vol. 23, pp.117-119.
Pretorius, D (2008). Personal communication.
Roscoe, KH 1970, ‗Tenth Rankine Lecture: The influence of strains in soil mechanics,
Géotechnique, vol. 20, pp. 129-170.
Samadani, A, Pradham, A and Kudrolli, A 1999, ‗Size segregation of granular matter in silo
discharges‘, Physical Review E, vol. 60, pp. 7203–7209.
M Pierce Thesis Summary Page 61
Savage, S 1984, ‗The mechanics of rapid granular flows‘, Advances in Applied Mechanics, vol.
24, p. 289.
Savage, SB 1979, ‗Gravity flow of cohesionless granular materials in chutes and channels‘,
Journal of Fluid Mechanics, vol. 92, no. 1, pp. 53-96.
Schulz, D 2009, ‗Stresses in silos‘, http://www.dietmar-schulze.de/spanne.html.
Sielamowicz, I, Blonski, S and Kowalewski, TA 2005, ‗Optical technique DPIV in
measurements of granular material flows, Part 1 of 3-plane hoppers‘, ChES, vol. 60, no.
2, pp. 589-598.
Stazhevsky, SB 1990, ‗Summary of major research results achieved by the Inst. Of Min.,
Novosibirisk in the Science of Gravitational Flow of Free-Flowing Bulk Materials', OSS
Stazhevsky, SB 1992, ‗Gravity flow of disrupted rocks – Report for the years 1991-1992.
Summary of major research results achieved by the Inst. Of Min., Novosibirisk in the
Science of Gravitational Flow of Free-Flowing Bulk Materials', OSS.
Susaeta, A 2004a, ‗Theory of gravity flow (Part 1)‘, in Proud to be miners (Proceedings,
MassMin 2004, Santiago, August 2004), eds A Karzulovic and MA Alfaro, Mineria
Chilena, Santiago, pp. 167-172.
Susaeta, A 2004b, ‗Theory of gravity flow (Part 2)‘, in Proud to be miners (Proceedings,
MassMin 2004, Santiago, August 2004), eds A Karzulovic and MA Alfaro, Mineria
Chilena, Santiago, pp. 173-178.
Susaeta, A and Diaz, H 2000, ‗State of the art on the modelling of gravity flow in block caving
mines (in Spanish)‘, Minerales, vol. 55, pp. 17-26.
Takahashi, H and Yanai, H 1973 ‗Flow profile and void fraction of granular solids in a moving
bed‘, Powder Technology, vol. 7, p. 205.
M Pierce Thesis Summary Page 62
Tüzün, U and Nedderman, RM 1979, ‗Experimental evidence supporting kinematic modelling of
the flow of granular media in the absence of air drag‘, Powder Technology, vol. 24, pp.
257-266.
Tüzün, U and Nedderman, RM 1982, ‗An investigation on the flow boundary during steady-state
discharge from a funnel-flow bunker‘, Powder Technology, vol., 31, pp. 27-43.
Waters, AJ and Drescher, A 2000, ‗Modeling plug flow in bins/hoppers‘, Powder Technology,
vol. 113, pp. 168–175.
Watson, GR 1993, ‗Flow patterns in flat bottomed silos‘, PhD thesis, University of Edinburgh.
Watson, GR and Rotter, JM 1996, ‗A finite element kinematic analysis of planar granular solids
flow‘, Chemical Engineering Science, vol. 51, pp. 3967– 3978.
Weibull, W 1951, ‗A statistical distribution function of wide applicability‘ Journal of Applied
Mechanics, vol. 9, pp. 293-297.
Xu, Y, Kafui, KD, Thornton, C and Lian, G 2002, ‗Effects of material properties on granular
flow in a silo using DEM simulation‘, Part. Sci. and Tech, vol. 20, pp. 109-124.
Yamamuro, JA 1993, ‗Instability and behaviour of granular materials at high pressures‘, PhD
thesis, University of California.
Yamamuro, JA and Lade, PV 1996, ‗Drained sand behaviour in axisymmetric tests at high
pressures‘, Journal of Geotechnical Engineering, ASCE, vol. 122, no. 2, pp. 109-119.
Yamamuro, JA, Bopp, PA and Lade, PV 1996, ‗One-dimensional compression of sands at high
pressures‘, Journal of Geotechnical Engineering, ASCE, vol. 122, no. 2, pp. 147-154.
Yang, S-C and Hsiau, S-S 2001, ‗The simulation and experimental study of granular materials
discharged from a silo with the placement of inserts‘, Powder Technology, vol. 120, no.
3, pp. 244-255.

M Pierce Thesis Summary Page 63
Yoshinaka, R, Osada, M, Park, H, Sasaki, T and Sasaki, K 2008, ‗Practical determination of
mechanical design parameters of intact rock considering scale effect‘, Engineering
Geology, vol. 96, pp. 173-186.