A Model for Assessing Relative Interest in E-books Compared to Print
44
Steven A. Knowlton, M.L.I.S. University of Memphis Libraries A Model for Assessing Relative Interest in E-books Compared to Print Tenn-Share Fall Conference Nashville Public Library September 26, 2014
-
Upload
sknwlton -
Category
Government & Nonprofit
-
view
32 -
download
0
Transcript of A Model for Assessing Relative Interest in E-books Compared to Print
Steven A. Knowlton, M.L.I.S.
University of Memphis
Libraries
A Model for Assessing Relative
Interest in E-books Compared to
Tenn-Share Fall Conference
Nashville Public Library
September 26, 2014
What library statistic
would you like to have –
That hasn’t been
invented yet?
How the heck can we
compare
e-book usage stats
to print circulation stats?
Why it would be useful We use circulation statistics (often in conjunction
with ILL statistics) for collection development and
assessment
Areas of strength/weakness
Weeding
Changing allocations by disciplines
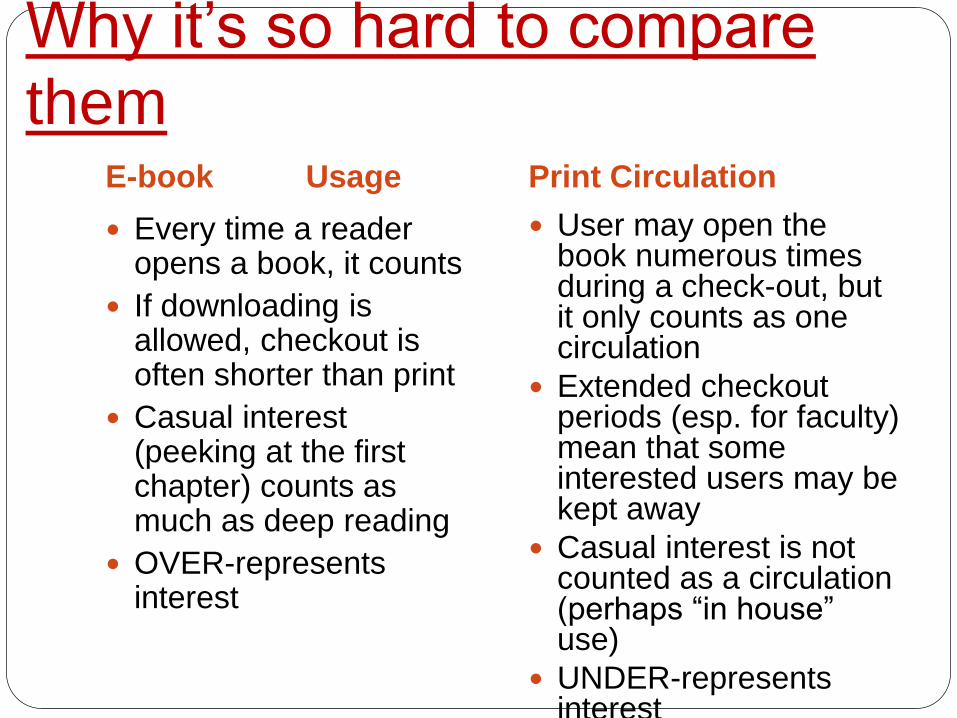
Why it’s so hard to compare
themE-book Usage Print Circulation
Every time a reader opens a book, it counts
If downloading is allowed, checkout is often shorter than print
Casual interest (peeking at the first chapter) counts as much as deep reading
OVER-represents interest
User may open the book numerous times during a check-out, but it only counts as one circulation
Extended checkout periods (esp. for faculty) mean that some interested users may be kept away
Casual interest is not counted as a circulation (perhaps “in house” use)
UNDER-represents interest
Why I want to compare
them Many questions remain regarding whether our
patrons like e-books
Polarized reactions on the reference desk
Campus reactions vary widely
We have some stereotypical ideas (“science is best
in e-books”) but no firm ideas about what suits the
needs of our patrons
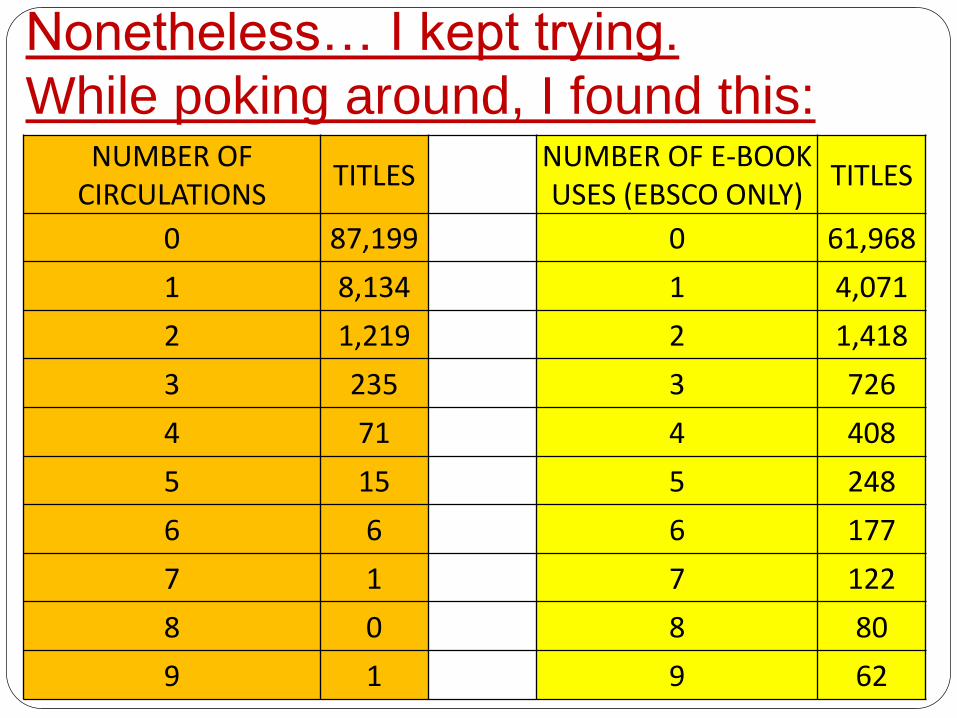
Nonetheless… I kept trying.
While poking around, I found this:NUMBER OF
CIRCULATIONSTITLES
NUMBER OF E-BOOK USES (EBSCO ONLY)
TITLES
0 87,199 0 61,968
1 8,134 1 4,071
2 1,219 2 1,418
3 235 3 726
4 71 4 408
5 15 5 248
6 6 6 177
7 1 7 122
8 0 8 80
9 1 9 62
My epiphany
It is much more common for a book – whether print or electronic – to have no recorded use in a given year than to have any level of use
That means…
The level of use is a “marginal
variable”; it is not crucial to
making informed collection
decisions. We can simply
look at whether a book was
used, not how much.
So…
We don’t have to try to make comparisons between print circulation and e-book usage statistics.
We just have to look at whether the book received any use.
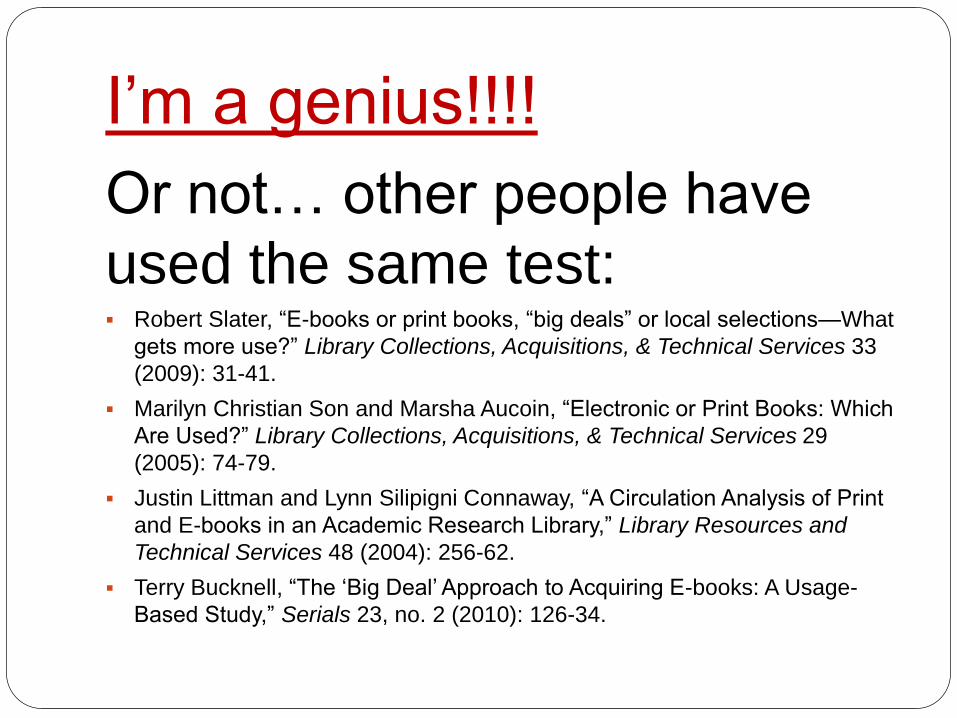
I’m a genius!!!!
Or not… other people have
used the same test: Robert Slater, “E-books or print books, “big deals” or local selections—What
gets more use?” Library Collections, Acquisitions, & Technical Services 33
(2009): 31-41.
Marilyn Christian Son and Marsha Aucoin, “Electronic or Print Books: Which
Are Used?” Library Collections, Acquisitions, & Technical Services 29
(2005): 74-79.
Justin Littman and Lynn Silipigni Connaway, “A Circulation Analysis of Print
and E-books in an Academic Research Library,” Library Resources and
Technical Services 48 (2004): 256-62.
Terry Bucknell, “The ‘Big Deal’ Approach to Acquiring E-books: A Usage-
Based Study,” Serials 23, no. 2 (2010): 126-34.
But…They don’t measure local preferencesThey measure whether e-books get more use than print books, and in which disciplines e-books get most use
But they don’t control for the size and strength of e-book collection vs. print collection
New epiphany!
Combine the
binary test of
use with a test
of “strength of
interest” used in
assessing print
collections
Strength of interestAssume that the proportion of the collection represented by a discipline should also be the proportion of titles used.
IfHistory books = 10% of the titles heldThenHistory books should = 10% of titles usedVariation shows where our patrons like what we’re offering, and where they don’t find it helpful
Percentage of Expected
Use
Again, not a new idea (see
below).
But, if we combine the binary test
of use + percentage of expected
use,
we can see where we should buy
e-books and where we should buy
Terry R. Mills, “The University of Illinois Film Center Collection Use Study.” ERIC report ED 227 821 (1982).
William Aguilar, “The Application of Relative Use and Interlibrary Demand in Collection Development,” Collection Management 8
(1986): 15-24.
John N. Ochoa, “Use of Circulation Statistics and Interlibrary Loan Data in Collection Management,” Collection Management 7
(2003): 1-13.
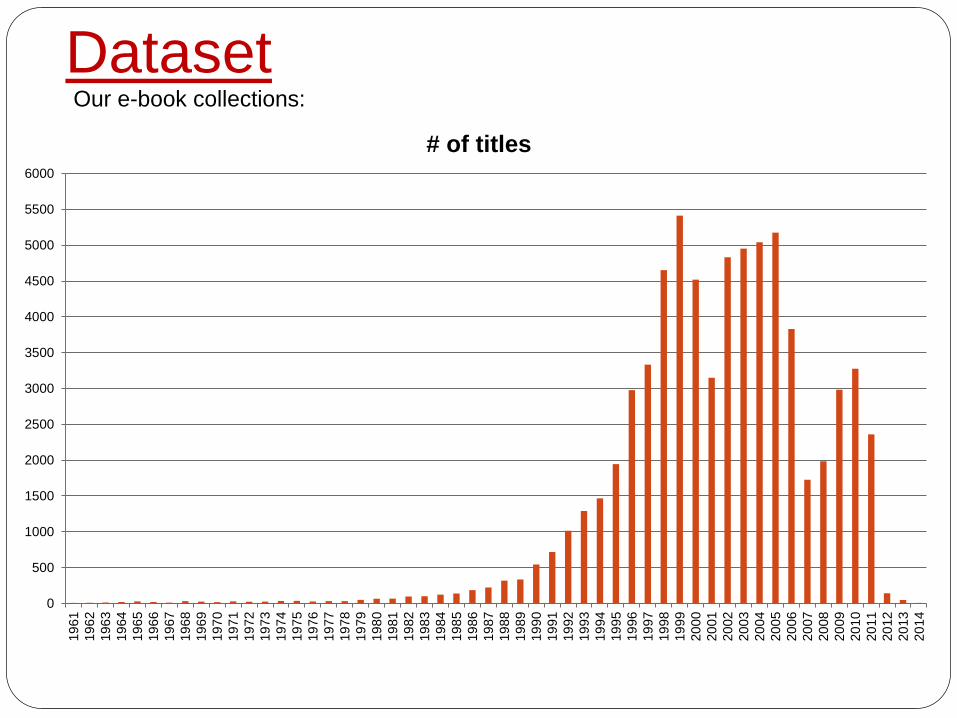
DatasetOur e-book collections:
0
500
1000
1500
2000
2500
3000
3500
4000
4500
5000
5500
6000
19
61
19
62
19
63
19
64
19
65
19
66
19
67
19
68
19
69
19
70
19
71
19
72
19
73
19
74
19
75
19
76
19
77
19
78
19
79
19
80
19
81
19
82
19
83
19
84
19
85
19
86
19
87
19
88
19
89
19
90
19
91
19
92
19
93
19
94
19
95
19
96
19
97
19
98
19
99
20
00
20
01
20
02
20
03
20
04
20
05
20
06
20
07
20
08
20
09
20
10
20
11
20
12
20
13
20
14
# of titles
Dataset
1990 – first year more than 500
ebooks represented
Need to use records with LC
Classification numbers
Dataset
Decided upon:
All EBSCO and Springer e-books
published 1990-2014
All print books available for
circulation published 1990-2014
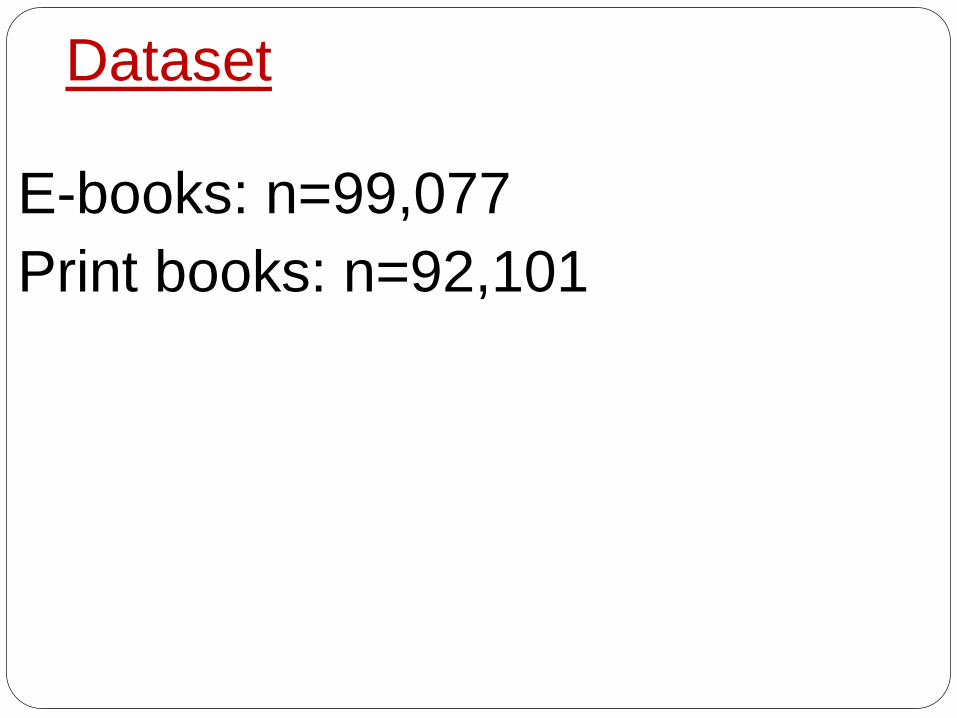
Dataset
E-books: n=99,077
Print books: n=92,101
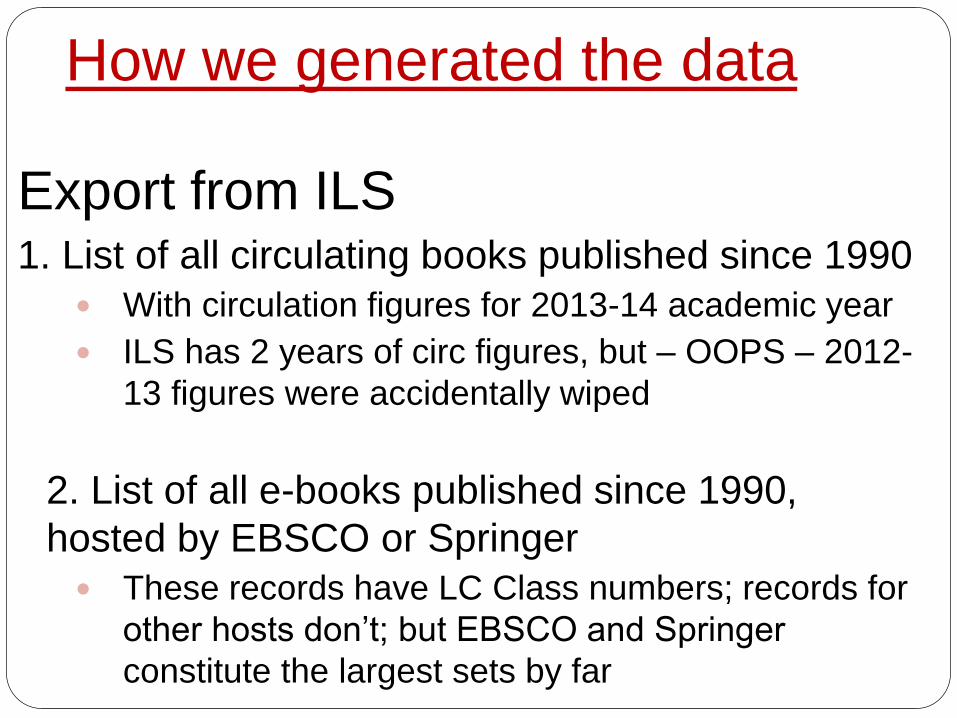
How we generated the data
Export from ILS1. List of all circulating books published since 1990
With circulation figures for 2013-14 academic year
ILS has 2 years of circ figures, but – OOPS – 2012-
13 figures were accidentally wiped
2. List of all e-books published since 1990,
hosted by EBSCO or Springer
These records have LC Class numbers; records for
other hosts don’t; but EBSCO and Springer
constitute the largest sets by far
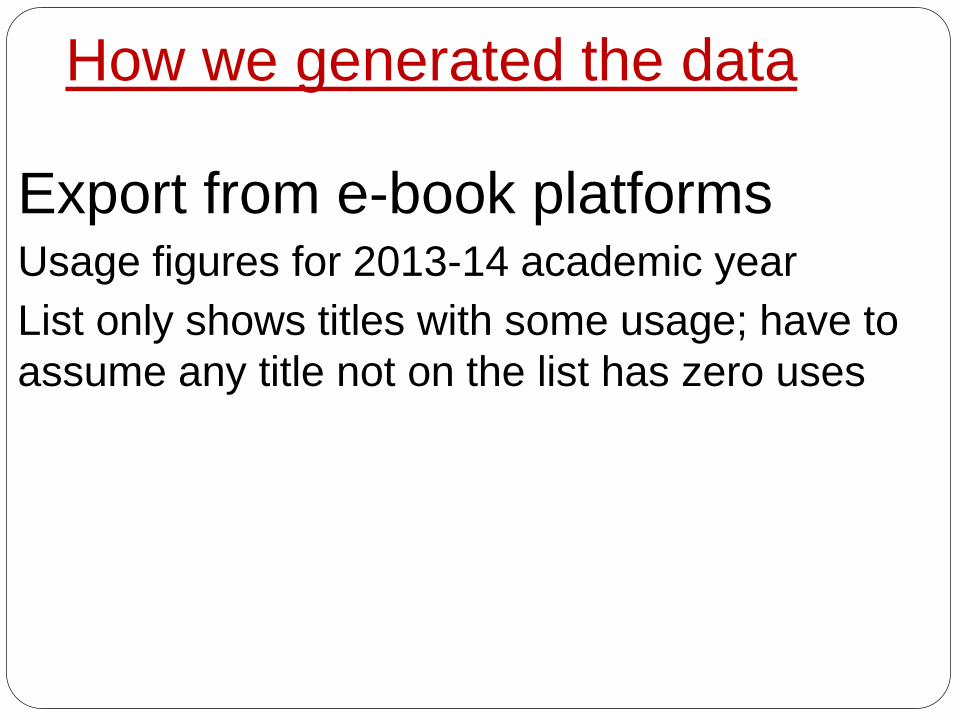
How we generated the data
Export from e-book platformsUsage figures for 2013-14 academic year
List only shows titles with some usage; have to
assume any title not on the list has zero uses
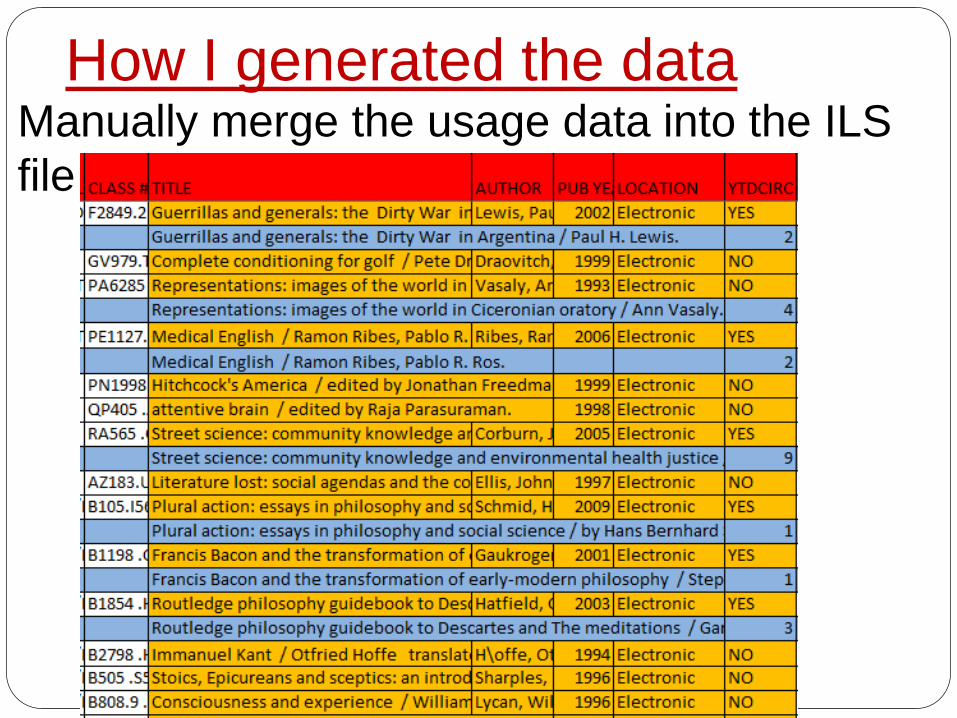
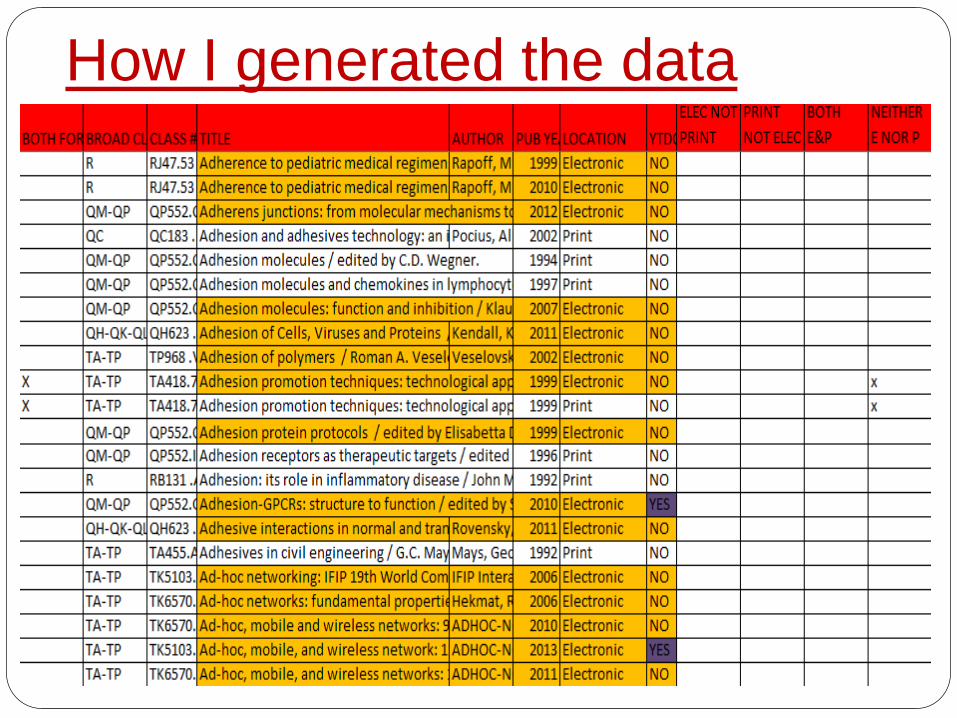
How I generated the dataManually merge the usage data into the ILS
file
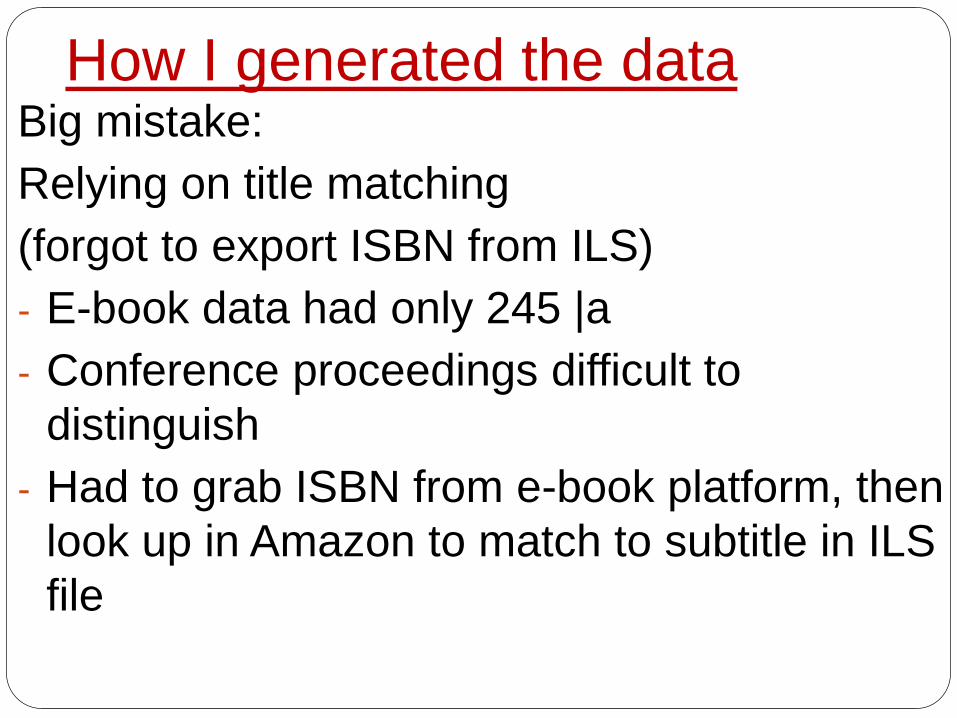
How I generated the dataBig mistake:
Relying on title matching
(forgot to export ISBN from ILS)
- E-book data had only 245 |a
- Conference proceedings difficult to
distinguish
- Had to grab ISBN from e-book platform, then
look up in Amazon to match to subtitle in ILS
file
How I generated the dataConvert all numeric values of circulation or e-
book usage:
1 to YES
0 to NO
How I generated the dataMarked any titles that we held in both print
and electronic:
Used in print but not electronic
Used in electronic but not print
Used in both print and electric
Not used in either format
How I generated the data
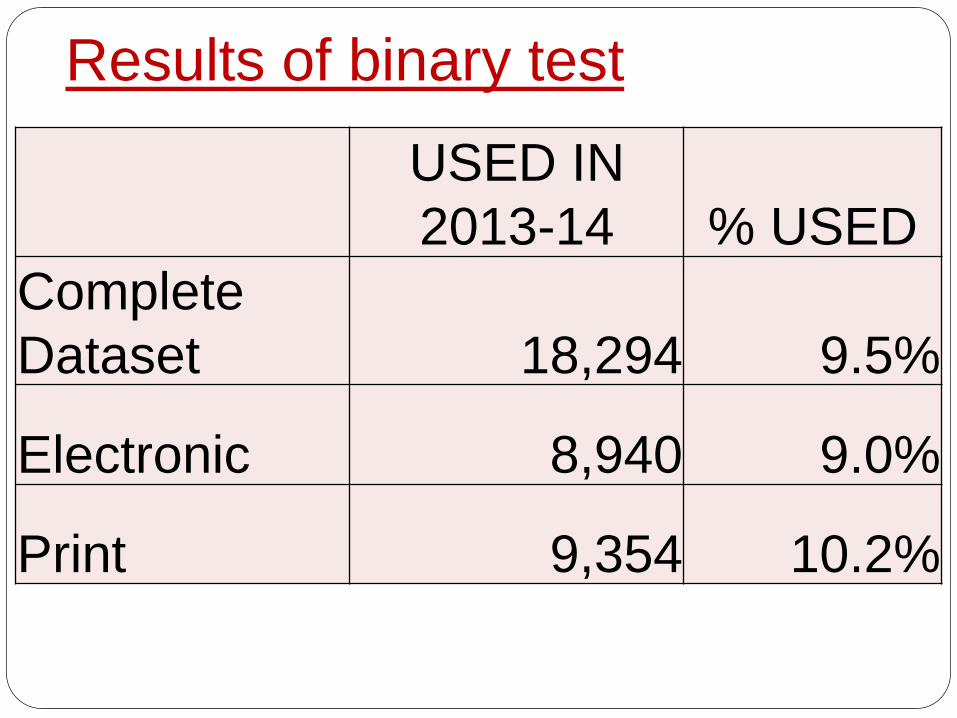
Results of binary test
USED IN
2013-14 % USED
Complete
Dataset 18,294 9.5%
Electronic 8,940 9.0%
Print 9,354 10.2%
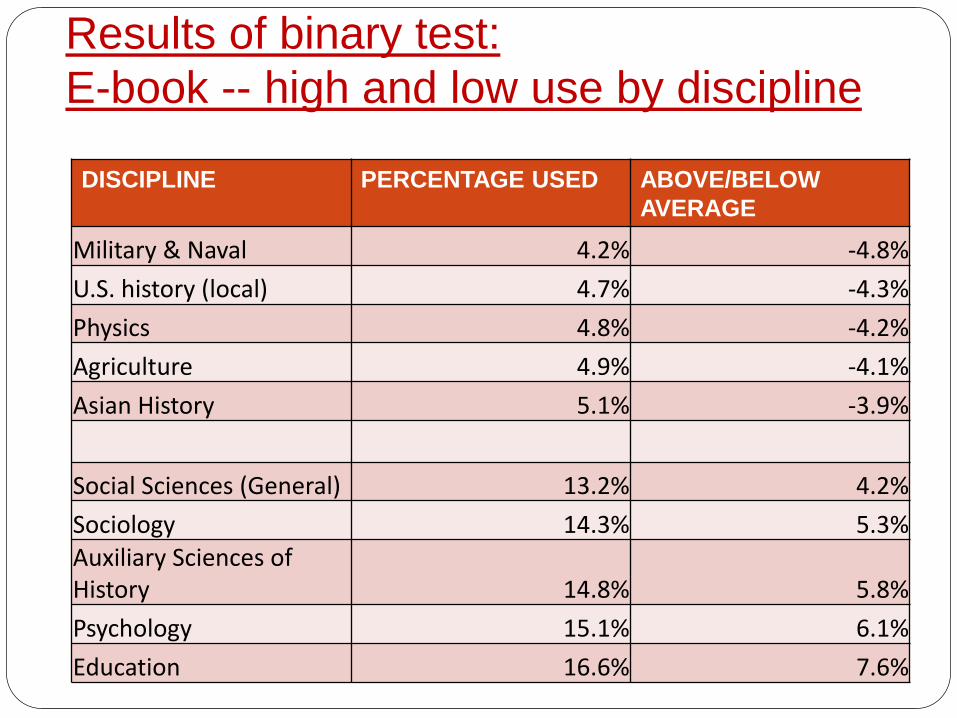
Results of binary test:
E-book -- high and low use by discipline
DISCIPLINE PERCENTAGE USED ABOVE/BELOW
AVERAGE
Military & Naval 4.2% -4.8%
U.S. history (local) 4.7% -4.3%
Physics 4.8% -4.2%
Agriculture 4.9% -4.1%
Asian History 5.1% -3.9%
Social Sciences (General) 13.2% 4.2%
Sociology 14.3% 5.3%Auxiliary Sciences of History 14.8% 5.8%
Psychology 15.1% 6.1%
Education 16.6% 7.6%

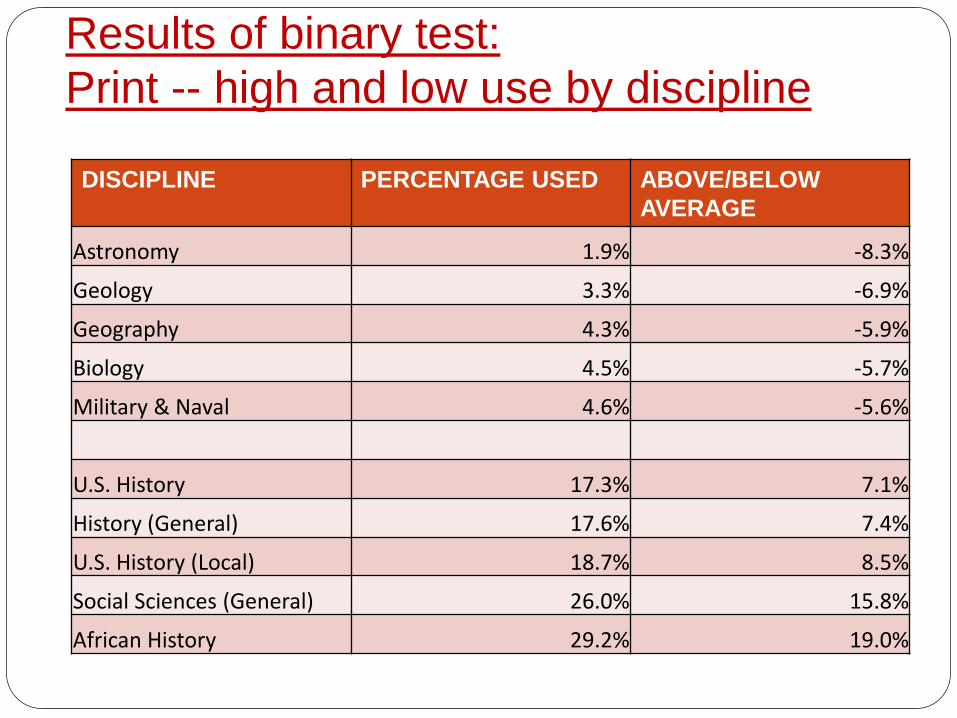
Results of binary test:
Print -- high and low use by discipline
DISCIPLINE PERCENTAGE USED ABOVE/BELOW
AVERAGE
Astronomy 1.9% -8.3%
Geology 3.3% -6.9%
Geography 4.3% -5.9%
Biology 4.5% -5.7%
Military & Naval 4.6% -5.6%
U.S. History 17.3% 7.1%
History (General) 17.6% 7.4%
U.S. History (Local) 18.7% 8.5%
Social Sciences (General) 26.0% 15.8%
African History 29.2% 19.0%
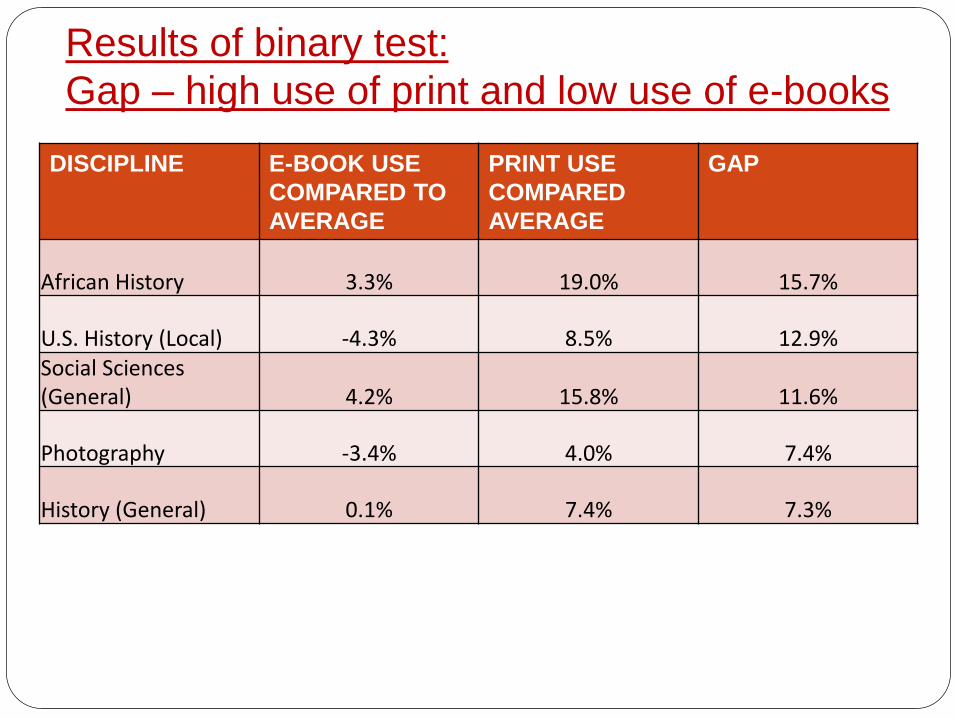
Results of binary test:
Gap – high use of print and low use of e-books
DISCIPLINE E-BOOK USE
COMPARED TO
AVERAGE
PRINT USE
COMPARED
AVERAGE
GAP
African History 3.3% 19.0% 15.7%
U.S. History (Local) -4.3% 8.5% 12.9%Social Sciences (General) 4.2% 15.8% 11.6%
Photography -3.4% 4.0% 7.4%
History (General) 0.1% 7.4% 7.3%
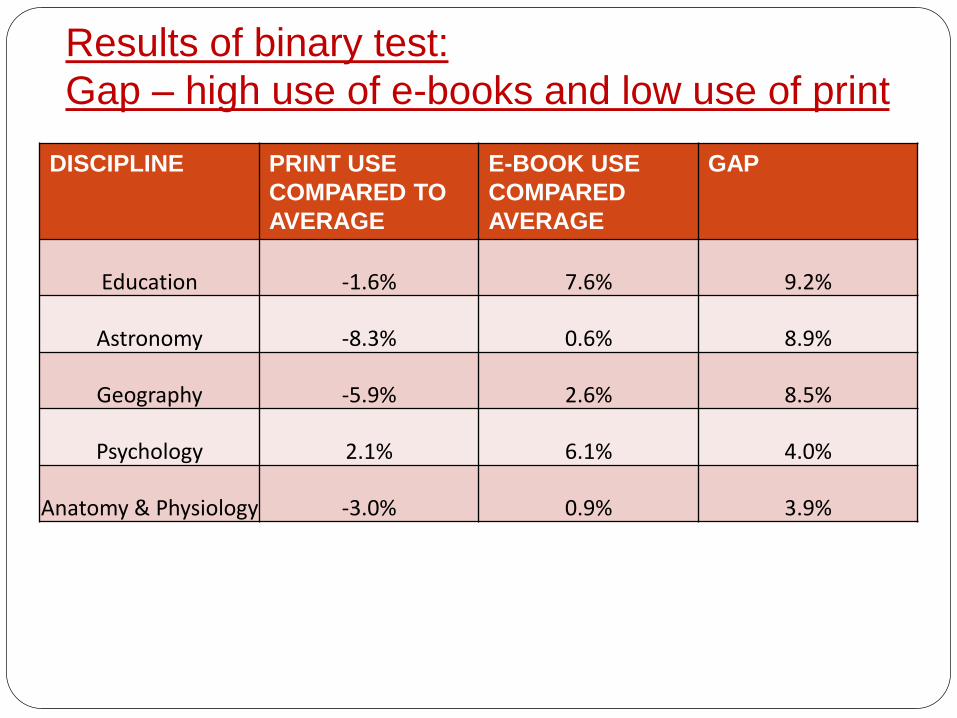
Results of binary test:
Gap – high use of e-books and low use of print
DISCIPLINE PRINT USE
COMPARED TO
AVERAGE
E-BOOK USE
COMPARED
AVERAGE
GAP
Education -1.6% 7.6% 9.2%
Astronomy -8.3% 0.6% 8.9%
Geography -5.9% 2.6% 8.5%
Psychology 2.1% 6.1% 4.0%
Anatomy & Physiology -3.0% 0.9% 3.9%
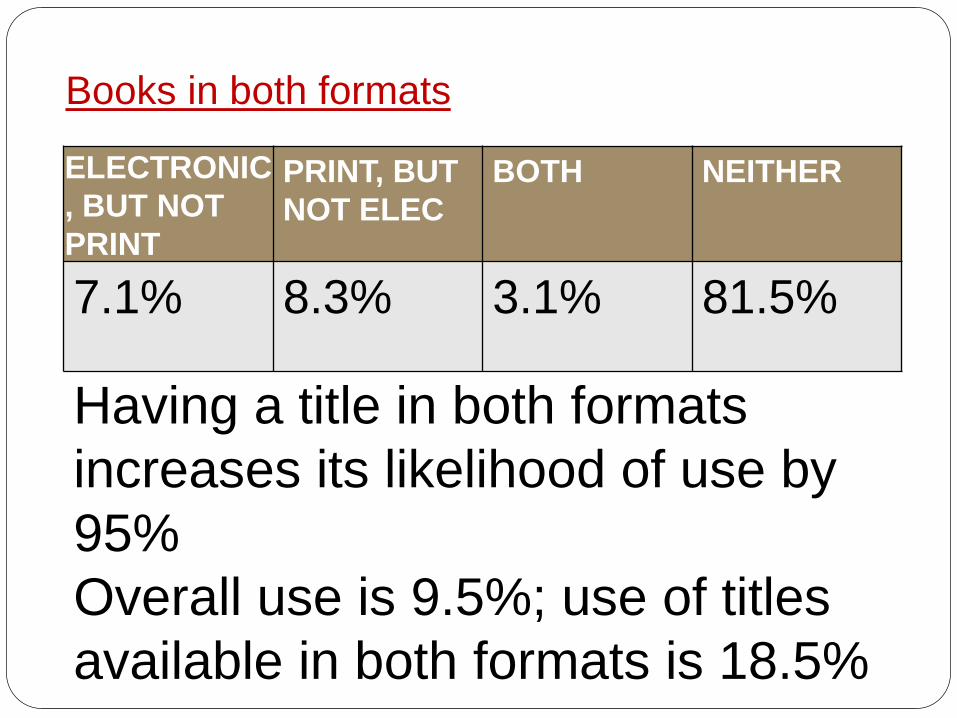
Books in both formats
ELECTRONIC
, BUT NOT
PRINT, BUT
NOT ELEC
BOTH NEITHER
7.1% 8.3% 3.1% 81.5%
Having a title in both formats
increases its likelihood of use by
95%
Overall use is 9.5%; use of titles
available in both formats is 18.5%
Books in both formats
Probably indicates that patrons
have a strong format preference
If use is so much higher for titles
without a format restriction, then
they are likely bypassing books in
the format they don’t like
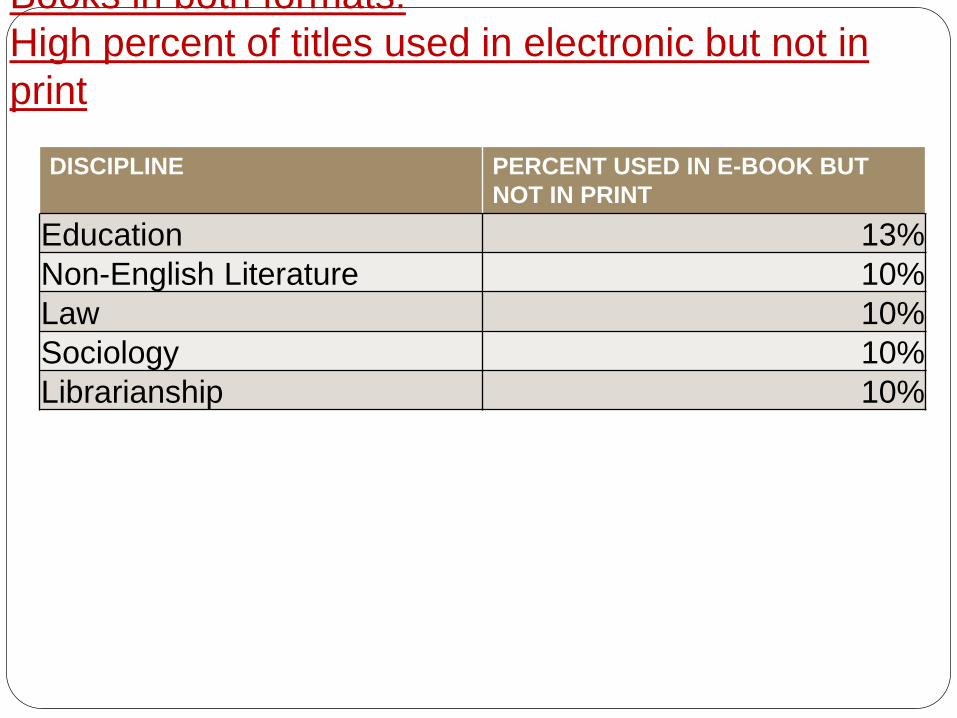
Books in both formats:
High percent of titles used in electronic but not in
DISCIPLINE PERCENT USED IN E-BOOK BUT
NOT IN PRINT
Education 13%
Non-English Literature 10%
Law 10%
Sociology 10%
Librarianship 10%
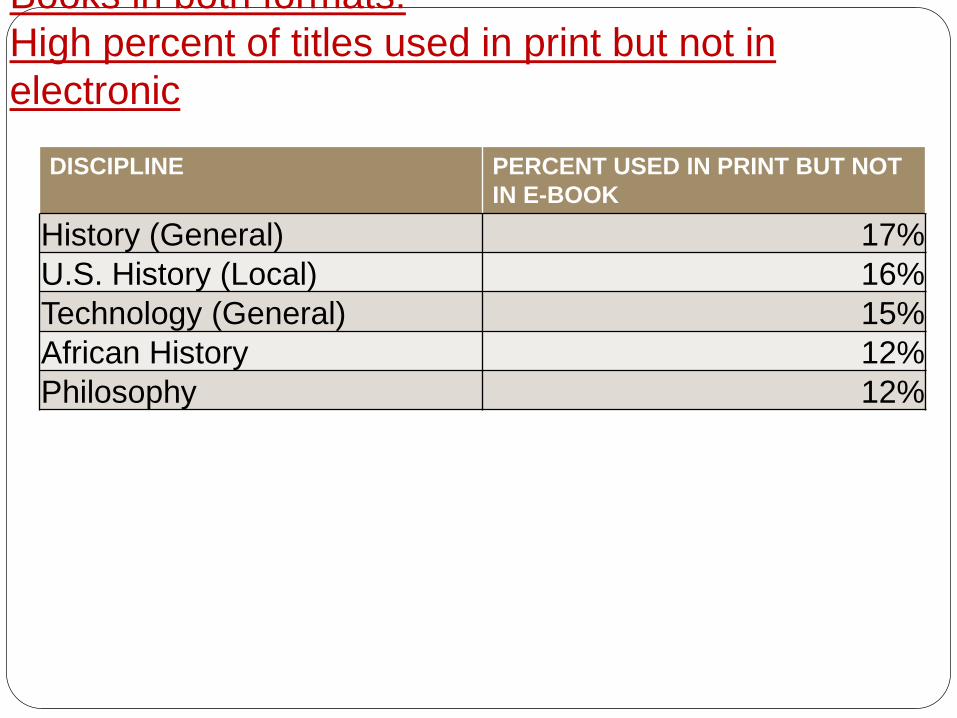
Books in both formats:
High percent of titles used in print but not in
electronic
DISCIPLINE PERCENT USED IN PRINT BUT NOT
IN E-BOOK
History (General) 17%
U.S. History (Local) 16%
Technology (General) 15%
African History 12%
Philosophy 12%
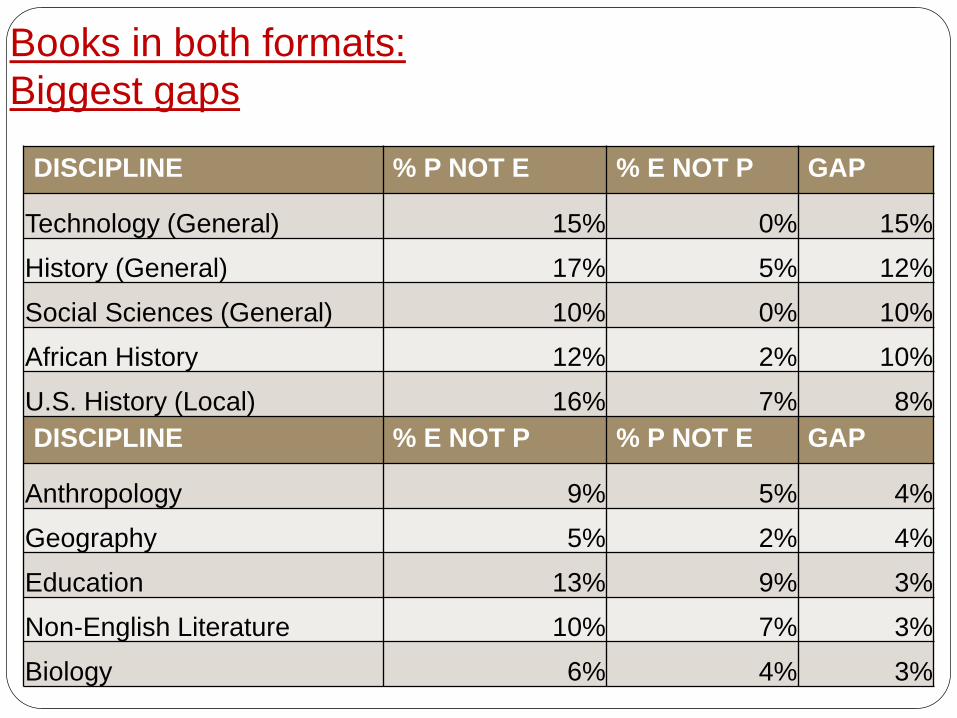
Books in both formats:
Biggest gaps
DISCIPLINE % P NOT E % E NOT P GAP
Technology (General) 15% 0% 15%
History (General) 17% 5% 12%
Social Sciences (General) 10% 0% 10%
African History 12% 2% 10%
U.S. History (Local) 16% 7% 8%
DISCIPLINE % E NOT P % P NOT E GAP
Anthropology 9% 5% 4%
Geography 5% 2% 4%
Education 13% 9% 3%
Non-English Literature 10% 7% 3%
Biology 6% 4% 3%
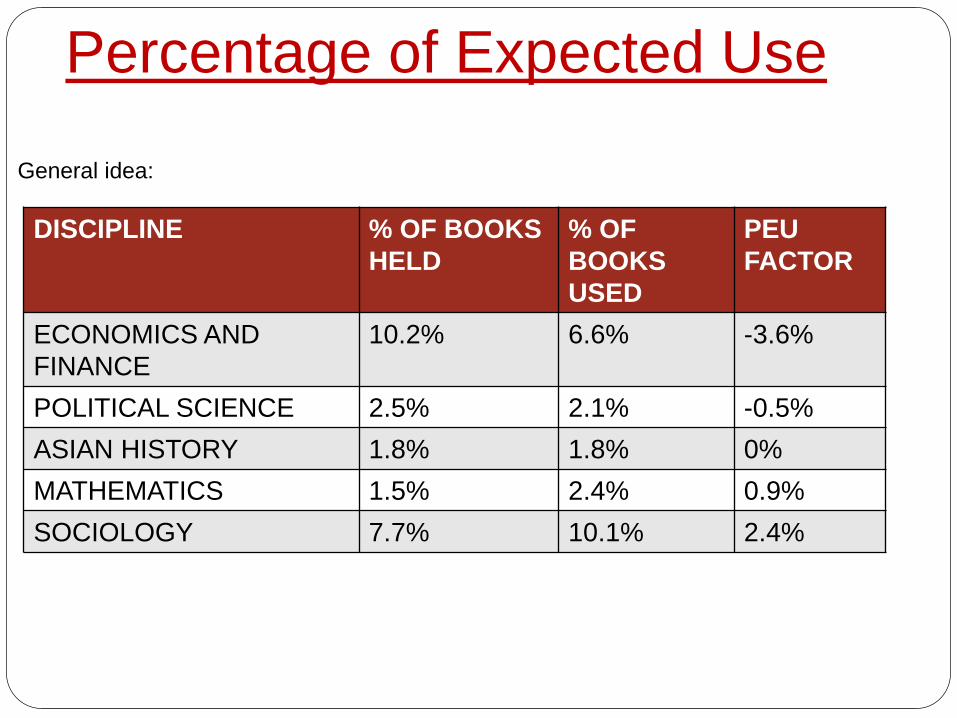
Percentage of Expected Use
General idea:
DISCIPLINE % OF BOOKS
HELD
% OF
BOOKS
USED
PEU
FACTOR
ECONOMICS AND
FINANCE
10.2% 6.6% -3.6%
POLITICAL SCIENCE 2.5% 2.1% -0.5%
ASIAN HISTORY 1.8% 1.8% 0%
MATHEMATICS 1.5% 2.4% 0.9%
SOCIOLOGY 7.7% 10.1% 2.4%
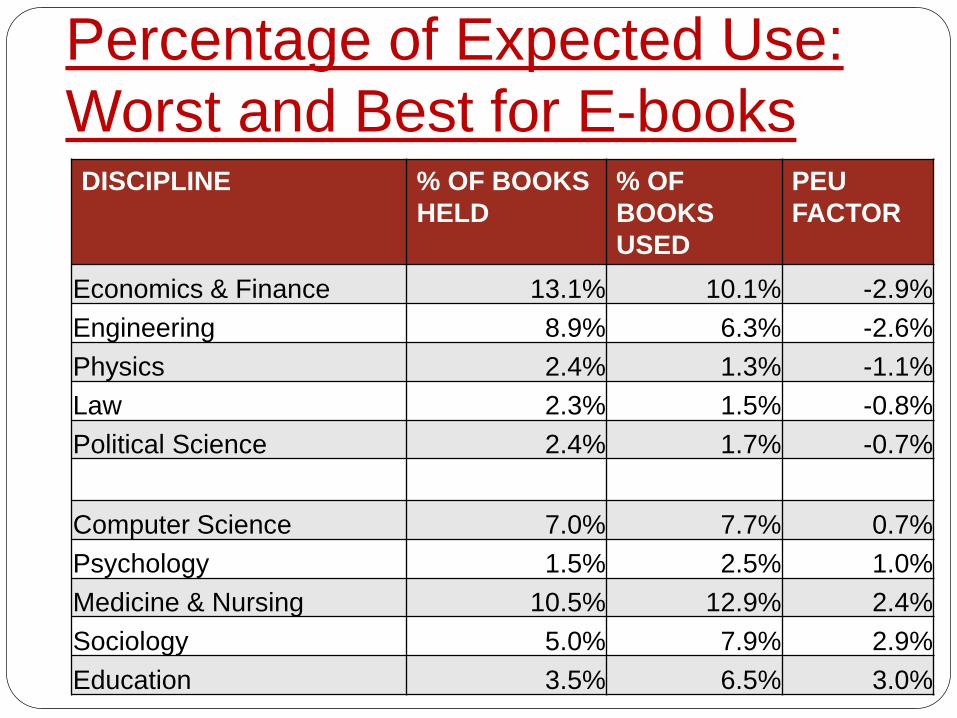
Percentage of Expected Use:
Worst and Best for E-booksDISCIPLINE % OF BOOKS
HELD
% OF
BOOKS
USED
PEU
FACTOR
Economics & Finance 13.1% 10.1% -2.9%
Engineering 8.9% 6.3% -2.6%
Physics 2.4% 1.3% -1.1%
Law 2.3% 1.5% -0.8%
Political Science 2.4% 1.7% -0.7%
Computer Science 7.0% 7.7% 0.7%
Psychology 1.5% 2.5% 1.0%
Medicine & Nursing 10.5% 12.9% 2.4%
Sociology 5.0% 7.9% 2.9%
Education 3.5% 6.5% 3.0%
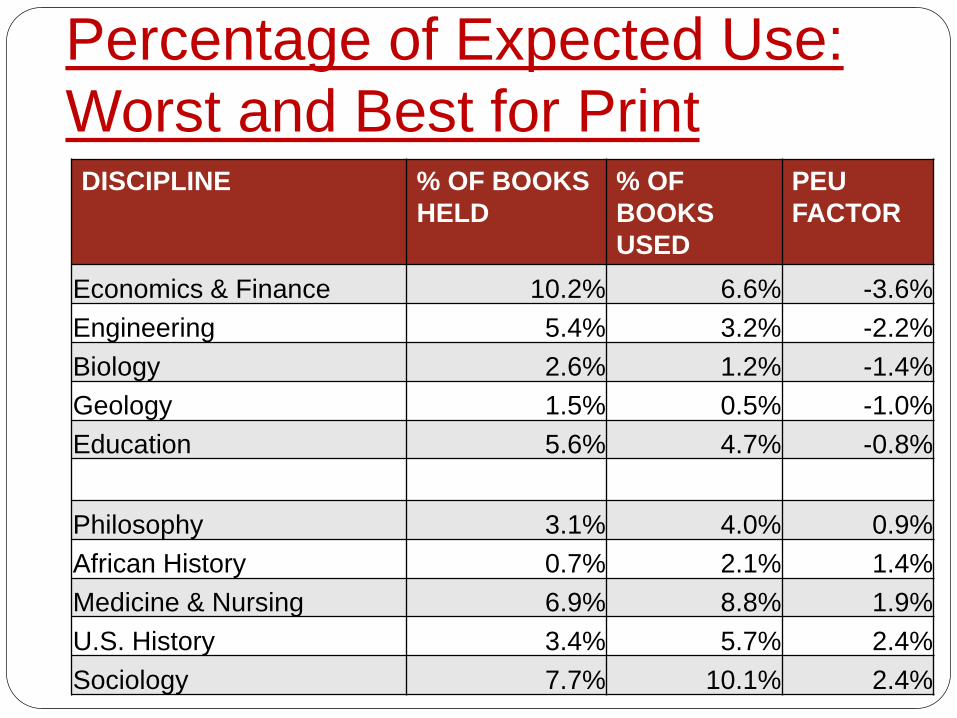
Percentage of Expected Use:
Worst and Best for PrintDISCIPLINE % OF BOOKS
HELD
% OF
BOOKS
USED
PEU
FACTOR
Economics & Finance 10.2% 6.6% -3.6%
Engineering 5.4% 3.2% -2.2%
Biology 2.6% 1.2% -1.4%
Geology 1.5% 0.5% -1.0%
Education 5.6% 4.7% -0.8%
Philosophy 3.1% 4.0% 0.9%
African History 0.7% 2.1% 1.4%
Medicine & Nursing 6.9% 8.8% 1.9%
U.S. History 3.4% 5.7% 2.4%
Sociology 7.7% 10.1% 2.4%
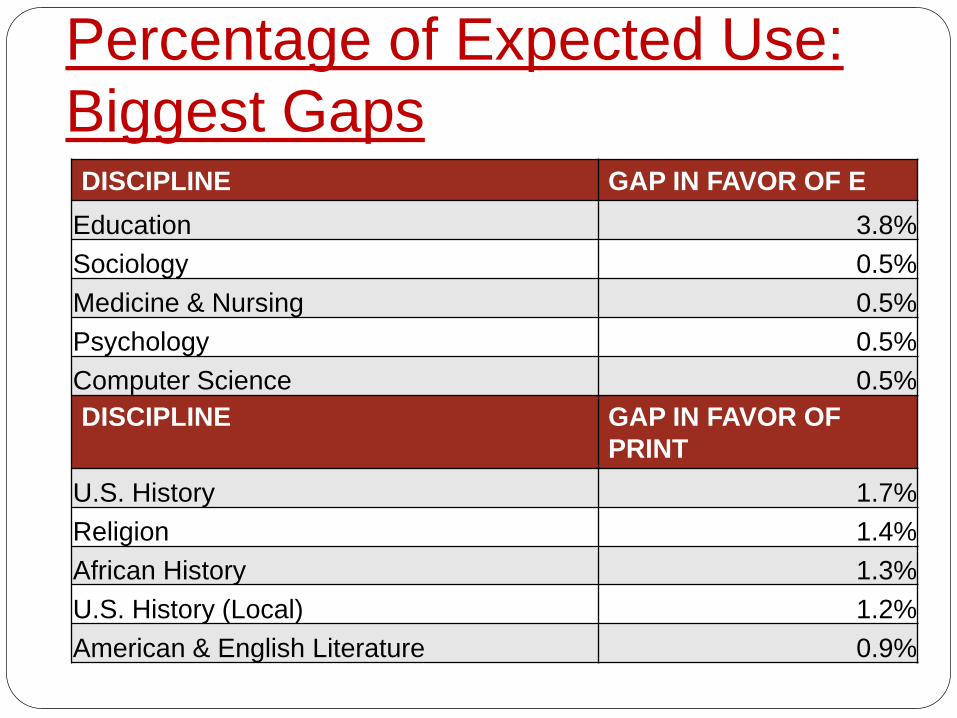
Percentage of Expected Use:
Biggest GapsDISCIPLINE GAP IN FAVOR OF E
Education 3.8%
Sociology 0.5%
Medicine & Nursing 0.5%
Psychology 0.5%
Computer Science 0.5%
DISCIPLINE GAP IN FAVOR OF
U.S. History 1.7%
Religion 1.4%
African History 1.3%
U.S. History (Local) 1.2%
American & English Literature 0.9%
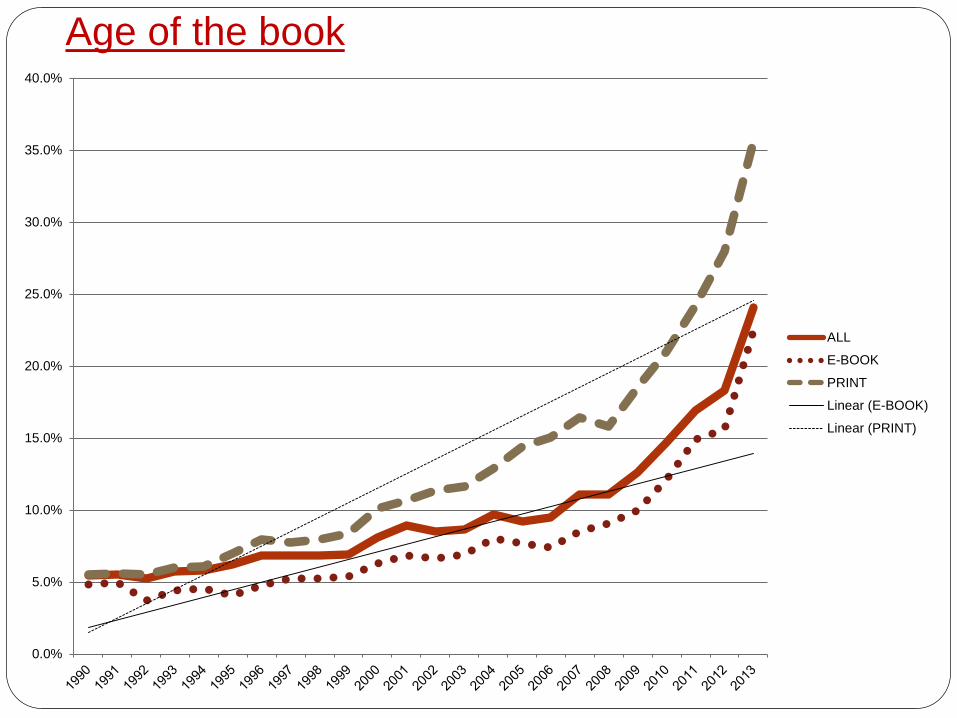
Age of the book
0.0%
5.0%
10.0%
15.0%
20.0%
25.0%
30.0%
35.0%
40.0%
ALL
E-BOOK
Linear (E-BOOK)
Linear (PRINT)
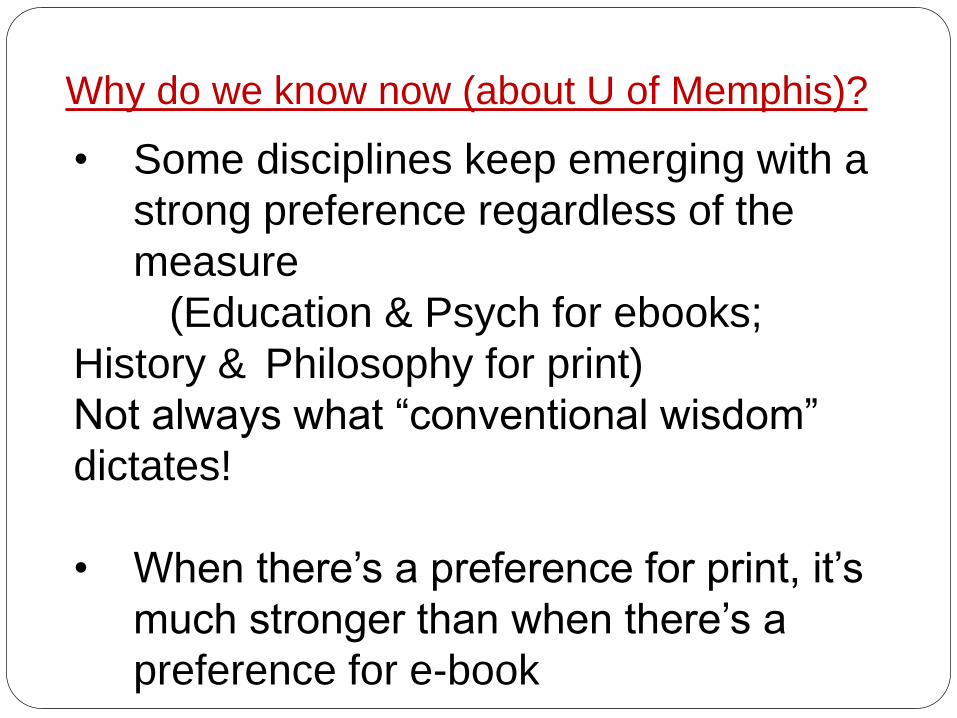
Why do we know now (about U of Memphis)?
• Some disciplines keep emerging with a
strong preference regardless of the
measure
(Education & Psych for ebooks;
History & Philosophy for print)
Not always what “conventional wisdom”
dictates!
• When there’s a preference for print, it’s
much stronger than when there’s a
preference for e-book
Why do we know now (about U of Memphis)?
• Newness of a book has more effect on use
of print books than e-books
• (And, by the way)
Those disciplines whose faculty tell us we
shouldn’t buy books are right! (Economics &
Finance, Engineering)