
A Mixed Reality Approach to Contextualizing … Mixed Reality Approach to Contextualizing Simulation...
31
A Mixed Reality Approach to Contextualizing Simulation Models with Physical Phenomena with an Application to Anesthesia Machines JOHN QUARLES, PAUL FISHWICK, SAMSUN LAMPOTANG, AND BENJAMIN LOK University of Florida ________________________________________________________________________ The design, manipulation, and implementation of models for computer simulation are key parts of the discipline. Models are constructed as a means to understand physical phenomena as state changes occur over time. One issue that arises is the need to correlate models and their components with the things being modeled. A part of an engine needs to be placed into cognitive context with the diagrammatic icon that represents that part's function. The typical solution to this problem is to display the dynamic model of the engine in one window and the engine's CAD model in another. Users are expected to mentally combine the dynamic model and the physical phenomena into the same context. However, this contextualization is not trivial in many applications. Our approach improves upon this form of user interaction by specifying two ways in which simulation models and the physical phenomena may be viewed, and experimented with, within the same human interaction space. We illustrate the problem to be addressed and demonstrate an example solution using a machine designed to deliver gas during anesthesia. Categories and Subject Descriptors: General Terms: Additional Key Words and Phrases: ________________________________________________________________________ 1. INTRODUCTION In simulation, the modeler must consider how the simulation model is related to the phenomena being simulated. Understanding this relationship between the simulation and the phenomena being simulated is integral to the simulation creation process. For example, to create a simulation based on a functional block model of a real machine, the modeler must know which parts of the machine that each functional block represents -- the modeler must understand the mapping from the real phenomenon to each functional block. In turn, the modeler must also understand the mapping from the phenomenon to the visualization of the simulation. The purpose of this research presented is to offer methods of visualizing this mapping between an abstract simulation and the physical phenomena being simulated. Understanding and creating these mappings is not always trivial. In an abstract simulation visualization, complex physical and spatial relationships are often simplified or abstracted away. Through this abstraction, the mapping from the simulation to the phenomenon being simulated often becomes more ambiguous for the user. For example, consider an abstract 2D simulation of an anesthesia machine (Figure 1.2), called the ________________________________________________________________________________________ Permission to make digital/hard copy of part of this work for personal or classroom use is granted without fee provided that the copies are not made or distributed for profit or commercial advantage, the copyright notice, the title of the publication, and its date of appear, and notice is given that copying is by permission of the ACM, Inc. To copy otherwise, to republish, to post on servers, or to redistribute to lists, requires prior specific permission and/or a fee.
Transcript of A Mixed Reality Approach to Contextualizing … Mixed Reality Approach to Contextualizing Simulation...

A Mixed Reality Approach to Contextualizing Simulation Models with Physical Phenomena with an Application to Anesthesia Machines JOHN QUARLES, PAUL FISHWICK, SAMSUN LAMPOTANG, AND BENJAMIN LOK University of Florida ________________________________________________________________________ The design, manipulation, and implementation of models for computer simulation are key parts of the discipline. Models are constructed as a means to understand physical phenomena as state changes occur over time. One issue that arises is the need to correlate models and their components with the things being modeled. A part of an engine needs to be placed into cognitive context with the diagrammatic icon that represents that part's function. The typical solution to this problem is to display the dynamic model of the engine in one window and the engine's CAD model in another. Users are expected to mentally combine the dynamic model and the physical phenomena into the same context. However, this contextualization is not trivial in many applications.
Our approach improves upon this form of user interaction by specifying two ways in which simulation models and the physical phenomena may be viewed, and experimented with, within the same human interaction space. We illustrate the problem to be addressed and demonstrate an example solution using a machine designed to deliver gas during anesthesia. Categories and Subject Descriptors: General Terms: Additional Key Words and Phrases: ________________________________________________________________________ 1. INTRODUCTION
In simulation, the modeler must consider how the simulation model is related to the
phenomena being simulated. Understanding this relationship between the simulation and
the phenomena being simulated is integral to the simulation creation process. For
example, to create a simulation based on a functional block model of a real machine, the
modeler must know which parts of the machine that each functional block represents --
the modeler must understand the mapping from the real phenomenon to each functional
block. In turn, the modeler must also understand the mapping from the phenomenon to
the visualization of the simulation. The purpose of this research presented is to offer
methods of visualizing this mapping between an abstract simulation and the physical
phenomena being simulated.
Understanding and creating these mappings is not always trivial. In an abstract
simulation visualization, complex physical and spatial relationships are often simplified
or abstracted away. Through this abstraction, the mapping from the simulation to the
phenomenon being simulated often becomes more ambiguous for the user. For example,
consider an abstract 2D simulation of an anesthesia machine (Figure 1.2), called the
________________________________________________________________________________________ Permission to make digital/hard copy of part of this work for personal or classroom use is granted without fee provided that the copies are not made or distributed for profit or commercial advantage, the copyright notice, the title of the publication, and its date of appear, and notice is given that copying is by permission of the ACM, Inc. To copy otherwise, to republish, to post on servers, or to redistribute to lists, requires prior specific permission and/or a fee.

Figure 1.1: Left: the VAM with the flow meters (A) and the vaporizer(B) highlighted. Right: a real
anesthesia machine with the flow meters (A) and the vaporizer(B) highlighted. Note that the flow meters and
vaporizer are spatially reversed in the abstract representation of the Virtual Anesthesia Machine (VAM).
.
Virtual Anesthesia Machine (VAM) [Lampotang 2006]. The VAM gives anesthesiology
students a conceptual understanding of how a generic anesthesia machine operates.
Students are expected to first learn the anesthesia machine concepts with the VAM, and
later apply those concepts when practicing the real machine.
To apply the concepts from the VAM when using a real machine, students must
identify the mapping between the components of the VAM simulation and the
components of the real machine. For example, as shown in figure 1.1, the green knob of
A (the gas flow meters) controls the amount of oxygen flowing through the system while
the blue knob controls the amount of N2O, an anesthetic gas. These gasses flow from the
gas flow meters and into B, the vaporizer. The yellow arrow shows how the real
components are mapped to the VAM. Note how the spatial relationship between the flow
meters(A) and the vaporizer(B) is laid out differently in the VAM than in the real
machine.
Also note that the flow meters have been spatially reversed in the VAM. In the
VAM, the N2O meter is on the right and the O2 is on the left. In the anesthesia machine
the N2O meter is on the left and the O2 meter is on the right. The purpose of this spatial
reversal is to make the gas flow visualization in the VAM easier to visualize and simpler
to understand. Because the VAM simplifies spatial relationships, understanding the
functional relationships of the components is easier (i.e. understanding that the gas flows
from the gas meters to the vaporizer).
However, this simplification can create difficulties for students when mapping the
VAM to the anesthesia machine. E.g. a student who is training to use a real machine
could memorize to turn the left knob to increase the O2. Then, when the student interacts
A B
A B
with the real machine, he or she will accidentally increase the N2O instead. This could
lead to negative training transfer and could be potentially fatal to a patient. Although
understanding the mapping between the VAM and the anesthesia machine is critical to
the anesthesia training process, mentally identifying the mapping is not always obvious.
Thus, in cases like this, the simulation could offer a visualization of the mapping to help
the user visualize the relationships between the simulation and the real phenomena being
simulated.
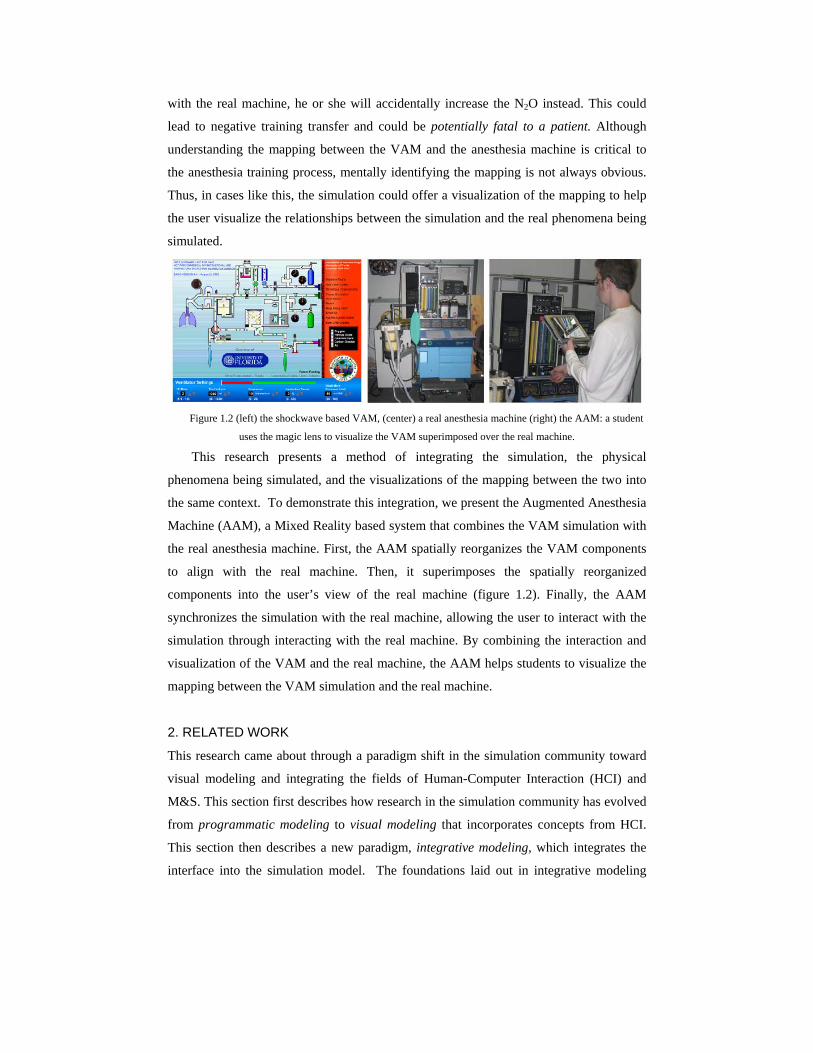
Figure 1.2 (left) the shockwave based VAM, (center) a real anesthesia machine (right) the AAM: a student
uses the magic lens to visualize the VAM superimposed over the real machine.
This research presents a method of integrating the simulation, the physical
phenomena being simulated, and the visualizations of the mapping between the two into
the same context. To demonstrate this integration, we present the Augmented Anesthesia
Machine (AAM), a Mixed Reality based system that combines the VAM simulation with
the real anesthesia machine. First, the AAM spatially reorganizes the VAM components
to align with the real machine. Then, it superimposes the spatially reorganized
components into the user’s view of the real machine (figure 1.2). Finally, the AAM
synchronizes the simulation with the real machine, allowing the user to interact with the
simulation through interacting with the real machine. By combining the interaction and
visualization of the VAM and the real machine, the AAM helps students to visualize the
mapping between the VAM simulation and the real machine.
2. RELATED WORK
This research came about through a paradigm shift in the simulation community toward
visual modeling and integrating the fields of Human-Computer Interaction (HCI) and
M&S. This section first describes how research in the simulation community has evolved
from programmatic modeling to visual modeling that incorporates concepts from HCI.
This section then describes a new paradigm, integrative modeling, which integrates the
interface into the simulation model. The foundations laid out in integrative modeling

research provided the basis for our research in combining abstract simulation with the
corresponding physical phenomena.
2.1 From Programmatic Modeling to Visual Modeling
M&S evolved from hand-driven mathematical simulation (such as Monte Carlo methods)
into the world of computer science where it has been a vital area of research since the
1950s [Nance and Sargent 2002]. Because M&S has been driven by computer science,
much M&S research has been towards creating specialized simulation programming
languages to aid developers in simulation programming [Pollacia 1989]. These
languages provide the programmer with code libraries that support a wide variety of
general simulation constructs, such as queuing models and discrete event systems. Many
of the earlier discrete event modeling [Zeigler et al 2000] languages, such as SIMULA
[Dahl 1966], GASP [Pritsker 1974], and Simscript [Kiviat 1973], have unique syntax and
compilers and are optimized for simulation processing efficiency. Because of the unique
aspects of the languages, many simulation programmers still prefer the more familiar
general-purpose languages (i.e C++). Thus, many simulation programming languages
have been extended as modules into the more general and widely used programming
languages.
With simulation programming languages, models are represented in program code
(for numerous examples see [Law and Kelton 2000] ) or mathematical equations [Banks
et al. 2001], but many of these models can also have visual representations. Near the end
of 1970s, modeling languages, such as GASP, began to incorporate more interactivity,
computer graphics, and animation. For example, GASPIV incorporated model diagrams,
which could easily be translated into GASP code. This was one of the earlier efforts to
merge simulation programming with visual modeling. The success of languages like
GASPIV resulted in a shift in focus from programmatic modeling to visual modeling. A
good repository of visual model types can be found in [Fishwick 1995]. Models types
such as Petri Nets, Functional Block models, state machines, and system dynamics
models are used in many different types of simulations and can be represented in a visual
way. They are similar in appearance to a flow chart that non-programmers and non-
mathematicians can understand and use.
This shift to visual modeling made modeling tools more accessible and usable for
modelers across the field of simulation. For example, Dymola [Otter 1996] and Modelica
[Mattsson 1998] are languages that support real-time modeling and simulation of
electromechanical systems. Dymola and Modelica both support continuous modeling,
which evolved from analog computation [Cellier 1991]. Thus, Dymola and Modelica

users create visual continuous models in the form of bond graphs, using sinks, power
sources and energy flows as visual modeling tools.
2.2 Visual Modeling Tools and Editors
To aid modelers in building visual models for simulation, there exist a variety of visual
tools and editors. These tools allow the user to use various visual model types to create
simulation visualizations. The tools generally consist of a graphical user interface with a
wide range of interaction widgets and visual model types, allowing modelers to create
fully functional simulations with minimal programming experience. Thus, these tools
allow modelers to concentrate more on the model than the underlying implementation.
Many of these visual tools are created for more specific tasks such as multi-agent
simulation [Luke et al 2005], [Falchuk and Karmouch 1998] or agro-ecological
simulation [Muetzelfeldt and Massheder 2003]. However, many editors have focused on
maximizing extensibility and applicability with modular and component model design
[Pidd et al 1999], such as Extend [Krahl 2002] or the Virtual Simulation Environment
(VSE) [Balci et al 1997]. For example, the VSE allows modelers to build their
simulation models graphically (rather than programmatically) using an object-oriented
paradigm. Once the model is built, the VSE aids the modeler in simulation, animation
and analysis. Thus it integrates modeling, simulation, visualization, and simulation
analysis into one graphical package and is targeted toward facilitating the creation of
many types of models and simulations (i.e. education and training, system design, and
manufacturing).
2.3 Simulation and HCI
With the shift towards visual modeling with graphical user interfaces, some M&S
researchers have begun to consider Human Computer Interaction (HCI) factors, such as
usability, in their visual modeling tool designs. Usability is defined by the International
Standards Organization as: “the degree to which specific users can achieve specific goals
within a particular environment; effectively, efficiently, comfortably, and in an
acceptable manner.” [Booth 1989]. Usability has become a major concern for visual
modeling editor developers. For example in [Kuljis 1996], six of the top current Visual
Modeling Environments were empirically evaluated for usability. The main finding was
that although most of these visual modeling tools had desirable functionality, their user
interfaces were deficient in many ways. While the tools were effective and efficient (i.e.
they have excellent performance and efficient processing), they were often not accepted
by users because the interfaces were uncomfortable or cumbersome to use. To the user,

the interface is the system [Hix and Hartson 1993] and the quality of the interaction is
just as important as the quality of performance [Jordan 2002], if not more important
[Larson 1992]. With a less usable interface, the quality of the model could suffer.
[Pidd 1996] outlines major principals that can aid in designing a discrete event
modeling editor with high usability and acceptance by users. According to Pidd, the most
usable interfaces are simple, intuitive, disallowing of dangerous behavior, and offer the
user instant and intelligible feedback in the event of an error. These principals are derived
from more general HCI principals presented in [Norman 1988], and supported by theories
about learning and cognitive psychology [Kay 1990]. However, these principals are often
overlooked in the creation of visual modeling editors.
2.4 Integrative Modeling
Although M&S has adopted some HCI methodologies to aid in the creation of models
and modeling tools, minimal research has been conducted in effectively integrating user
interfaces and visualization into the models. Integrative modeling [Fishwick 2004] [Park
2004] [Shim 2007] is an emerging field that addresses these issues. The goal of
integrative modeling is to blend abstract model representations with more concrete
representations, such as a geometric representation. This blending is achieved through a
combination of HCI, Visualization, and Simulation techniques. Novel interfaces are
incorporated as part of the simulation model, helping the user to visualize how the
abstract and concrete representations are related. For example, [Park 2005] use morphing
as a way to visually connect a functional block model of the dynamics of aircraft
communication to the 3D aircraft configurations during flight. That work served as a
preliminary study into the use of ontologies for generating one particular domain model
integration.
The work presented in this paper relies on the concepts laid out by the previous work
in integrative modeling. This paper presents an integrative method to combine an abstract
simulation with the physical phenomenon being simulated and facilitate visualization of
this combination with a display device that has been seamlessly integrated into the
simulation, a magic lens (explained in the next section). Much of the technology used in
this approach comes from another emerging field of research, Mixed Reality.
3. MIXED REALITY
3.1 Virtual Reality

In 1965, Ivan Sutherland laid out the foundations of virtual reality with his seminal vision
of the Ultimate Display [Sutherland 1965]. The display would be a fully immersive room
that could control the existence of matter; for example the room could display a chair
where the user could actually sit or display a bullet that could actually harm the user. The
user would perceive everything displayed to be completely real.
Currently, VR has been able to approximate some aspects such as immersion,
auditory feedback, and haptic feedback. VR users of today can put on a tracked Head
Mounted Display(HMD) and visualize rendered 3D graphics, hear 3D audio and interact
with a 3D haptic device. VEs use this technology to supplement the users senses, which
makes virtual objects inside the VE seem perceptibly real to the user. For example, with
the use of a force feedback haptic glove, a user can grasp a virtual object and feel the
shape of the object in their hand. The force feedback glove simulates the physical
properties of a similar real object.
3.2 Mixed Reality Definition
In 1994, Milgram and Kishino [Migram and Kishino 1994] laid the framework for new
area of Virtual Reality research called Mixed Reality (MR). MR takes a different
approach to interaction and visualization. Instead of simulating a purely virtual world,
MR systems combine the virtual world with the real world. In MR, users visualize and
interact with both real and virtual objects in the same space and context. For example, in
MR, users can visualize some virtual objects but they can also see the real world and
interact with real objects. Often the real objects are tracked and are used as interfaces to
the virtual world. Then, by interacting with real objects, users can interact with the virtual
world.
Figure 3.1: The Virtuality Continuum.
Milgram and Kishino proposed the Virtuality Continuum (figure 3.1). The
continuum spans from real environments, where all objects have an actual objective
existence, to virtual environments, where all objects are virtual or simulated. Mixed
Reality encompasses the area of the continuum in between the completely real and the

completely virtual. Along with this continuum, Milgram presents a taxonomy of the
different categories in which Mixed Reality can “mix” virtual and real objects in a Mixed
Environment. The authors laid out two main categories of combining the virtual and real
worlds in MR:
1. Augmented Reality (AR): Virtual objects and information are superimposed into the
real world so that they appear to be real, often by means of superimposing 3D
graphics over a live video stream. AR systems use overlaid virtual information to
augment the user’s perception of the real world. Thus, in an AR environment, users
view and interact with a higher proportion of real objects than virtual objects (i.e. a
Heads up display (HUD)).
2. Augmented Virtuality (AV): Real world objects or information are superimposed into
the visualization of a virtual world, often by means of some type of 3D
reconstruction of a real object. Thus, AV systems integrate real objects into the
virtual world to augment the user’s perception of the virtual world. Thus, in an AV
environment, users view and interact with a higher proportion of virtual objects than
real objects.
3.3 MR Technology Overview
Since the purpose of MR is to combine the virtual world with the real world, much of the
previous MR research has focused on engineering the necessary hardware and algorithms
that facilitate this combination. In general, previous MR research has focused on
registration, interaction, and displays.
3.4 Registration
Registration research focuses on solving the problem of accurately aligning virtual
objects with real objects so that they appear to exist in the same space. Extensive research
has been conducted in this area since accurate registration is critical to many MR
applications. For example, if a surgeon is performing an laparoscopic surgery augmented
with AR, the real surgical tools must align with the virtual representation of the patient’s
internals (such as live MRI data); even registration inaccuracies of millimeters could
cause the surgeon to make a mistake that would be harmful to the patient. As with this
example, accurate registration of virtual objects is needed for many MR applications to
be usable. Thus, much MR registration research has been conducted to discover how to
accurately register virtual objects with real objects. For a good survey of registration and
AR research, see [Azuma 1997] chapter 5.
3.5 Interaction: Tangible Interfaces and Real Object Interfaces
One field of research that focuses on using real world objects as interfaces to the virtual
world is Tangible Interfaces [Ishii 1997]. A tangible interface is an interface that employs
real objects “as both representations and controls for computational media.”[Ullmer
2001] For example, a classic interface for a computer simulation is a Graphical User
Interface (GUI) in which the user clicks on buttons and sliders etc. to control the
simulation. The sole purpose of a GUI is for control. Like a GUI, a tangible user interface
(TUI) is used for control of the simulation, but the TUI is also an integral part of that
simulation; rather than just being a simulation control, a TUI also represents a virtual
object that is part of the simulation.
One way to combine real and virtual world interaction is to use a real object as a
tangible interface to a virtual representation (virtual correlate) of that object. In this way,
interacting with the real object facilitates interaction with both the real world and the
virtual world at the same time. For example, in [Lok 2004b], NASA engineers performed
a virtual assembly using real tools in MR. Through interacting with a real tool’s virtual
correlate, they were able to interact with the virtual objects and complete the assembly.
Since these real objects are interfaces to the virtual world, they allow users to interact
with the virtual objects more naturally and realistically than traditional VR interfaces
such as tracked 6DOF joysticks and 3D mice.
3.6 MR Displays
In addition to creating the Virtuality Continuum, Milgram and Kishino also outlined a
taxonomy for MR displays. Like the continuum, these displays range from visualizing
the real world to visualizing a purely virtual world. There are six classes of displays listed
but this section will only review one type of display that is relevant to the presented
work: Magic Lenses.
3.6.1 Magic Lens
Magic Lenses were originally created as 2D interfaces, outlined in [Bier 1993]. 2D magic
lenses are movable, semi-transparent ‘regions of interest’ that show the user a different
representation of the information underneath the lens. They were used for such operations
as magnification, blur, and previewing various image effects. Each lens represented a
specific effect. If the user wanted to combine effects, two lenses could be dragged over
the same area, producing a combined effect in the overlapping areas of the lens. The

overall purpose of the magic lens, showing underlying data in a different context or
representation, remained when it was extended from 2D into 3D [Viega 1996]. Instead of
using squares and circles to affect the underlying data on a 2D plane, boxes and spheres
were used to give an alternate visualization of volumetric data.
Figure 3.2: A user interacts with a magic lens.
In Mixed and Augmented reality these lenses have again been extended to become,
hand-held tangible user interfaces and display devices as in [Looser 2004]. With an
augmented reality lens, the user can look through a lens and see the real world augmented
with virtual information within the lens’s ‘region of interest’ (i.e. LCD screen of a tablet
pc based lens). The lens acts as a filter or a window for the real world and is shown in
perspective with the user’s first-person perspective of the real world. Thus, the MR/AR
lens is similar to the original 2D magic lens metaphor, but has been implemented as a
6DOF tangible user interface instead of a 2DOF graphical user interface object.
A magic lens is a tracked, hand-held “window” into the virtual (or augmented) world
(figure 3.2). Virtual information is displayed in context with the real world and from a
first person perspective. However, unlike the HMD, the magic lens is a non-immersive
display; it doesn’t block the users visual periphery. A magic lens allows the user to see
the real world around them and view the virtual information displayed on the lens in
context with the surrounding real world. The non-immersive and portable design of the
lens allows it to be viewed by several people at once or easily handed off to others for
sharing. Since the lens is easily sharable, it is also ideal for collaborative visualization.
One of the other main advantages of the lens is that it can be used as a tangible
interface to control the visualization. Since the lens is hand held and easy to physically

manipulate, the user can interact with one lens or multiple lenses to represent different
types of viewing or filtering of the real world. In fact, most previous research that has
been conducted with magic lenses concentrates on the lens’s tangible interface aspects. In
[Looser 2004], the researchers use multiple magic lenses to facilitate visualization
operations such as semantic zooming and information filtering.
4. THE VAM AND THE REAL ANESTHESIA MACHINE
The purpose of the presented research is to offer methods of combining real phenomena
with a corresponding abstract simulation. A case study with a real anesthesia machine
and the corresponding abstract simulation is presented as an example application. In this
application, students interact with a real anesthesia machine while visualizing the abstract
simulation in context with the real machine’s components. Before detailing the methods
and implementation of this combination, this section describes how students interact with
the real machine and the abstract simulation – the VAM – in the current training process.
The following example shows how students interact with one anesthesia machine
component – the gas flow meters – and describes how students are expected to mentally
map the VAM gas flow meters map to the real gas flow meters.
4.1 The Gas Flow Meters in the Real Anesthesia Machine
Figure 4.2: a magnified view of the gas flow meters on the real machine.
A real anesthesia machine anesthetizes patients by pumping anesthetic gasses in and out
of the patient’s lungs. It is the anesthesiologist’s job to monitor and adjust the flow of
these gasses to make sure that the patient stays safe and under anesthesia. The
anesthesiologist does this by manually adjusting the gas flow knobs and monitoring the
gas flow meters as shown in figure 4.2. The two knobs at the bottom of the right picture

control the flow of gasses in the anesthesia machine and the meters above them display
current flow rate. If a user turns the color-coded knobs, the gas flow changes and the
meters read a different measurement.
4.2 The Gas Flow Meters in the VAM
The VAM models these gas flow knobs and meters with a 2D icon (figure 4.3) that
resembles the gas flow knobs and meters on the real machine. As with the real machine,
the user can adjust the gas flow in the VAM by turning the knobs. Since the VAM is a 2D
online simulation, the user clicks and drags with the mouse in order to adjust the knobs.
When the user turns a knob, the rate of gas flow changes in the visualization; animated
color-coded gas particles (e.g. blue particles = N2O; green particles = O2) change their
movement speed accordingly. These gas particles and the connections between the
various machine components are invisible in the real machine. The VAM models the
invisible gas flow, invisible connections, interaction, and the appearance of the real gas
flow meters. Within this modeling, there is an inherent mapping between the real
machine’s gas flow meters and the VAM’s.
Figure 4.3: A magnified view of the gas flow knobs and level meters in the VAM.
Students are expected to mentally map the concepts learned with the VAM (i.e.
invisible gas flow) to their interactions with the real machine. Because the VAM and the
real machine are complex and spatially organized differently, 10% to 20% of students
have difficulty mentally mapping the VAM to the real machine. This inhibits their
understanding of how the real machine works internally. In order to resolve this problem,
this research proposes to combine the visualization of the VAM with the interaction of

the real machine. Methods to perform this combination are presented in the following
section.
5. CONTEXTUALIZATION
5.1 Contextualization Definition
If the user needs to understand the mappings between the simulation and the phenomena
being simulated, it could be helpful to incorporate a visualization of these mappings into
the simulation visualization. One way of visualizing these mappings is to ‘contextualize’
the simulation with the real phenomena being simulated. Contextualization involves two
criteria (1) Registration: superimpose parts of the simulation over the corresponding parts
of the real phenomena (or vice versa) and (2) Synchronization: synchronize the
simulation with the real phenomena.
5.2 An Example Contextualization: Gas flow meters
5.2.1 Registration
Consider contextualizing the VAM’s gas flow meters with the real anesthesia
machine’s gas flow meters. One method of contextualization is to superimpose the
VAM’s gas flow meters simulation visualization directly over the real gas flow meters
(figure 5.1 top). Superimposing the VAM gas glow meters simulation over the real
machine requires us to overlay computer graphics (the VAM gas flow meters) on the
users view of the real world. In effect, the users view of the real gas meters is combined
with a synthetic view of the VAM gas meters.
To visualize the superimposed gas meters, users look through a tracked 6DOF magic
lens (figure 5.1 bottom). Through the lens, they view the real gas meters from a first
person perspective with the VAM simulated gas meters shown in-context with the real
gas meters. The machine visualization appears on the lens in the same position and
orientation as the real machine, as if the lens were a transparent window and the user was
looking through it. The relationship between the user’s head and the lens is analogous to
the OpenGL camera metaphor. The camera is positioned at the users eye, and the
projection plane is the lens; the lens renders the VAM simulation directly over the
machine from the perspective of the user.
This in-context juxtaposition of the VAM gas meters and the real gas meters will
help lens users visualize the mapping between the VAM simulation and the real machine.
The magic lens facilitates the first criterion for contextualization -- superimposing the
simulation component over the corresponding real component.

Figure 5.1: Top: The user’s view of the AAM. The VAM gas meters icon has been superimposed over the
real machine. The gas flow is visualized by 3D particles that flow between the various components. Bottom: the
user visualizes the overlaid gas meters VAM icon through the magic lens.

Figure 5.2. A user uses the real machine as an interface to the simulation. Thus, the simulation must be
synchronized to the real machine.
5.2.2 Synchronization
To meet the second criterion, the VAM gas meters simulation visualization (i.e. the gas
particles’ flow rate) must be synchronized with the real machine. Thus, changes in the
rate of the simulated gas flow must correspond with changes in the real gas flow. To
facilitate this synergy, this system uses computer vision techniques of motion detection to
track the readout of the meters. This readout corresponds to the real gas flow rate of the
machine. Then, the gas flow rates (as shown by the real meters) are then sent to the
simulation in order to set the flow rate of the simulated gases. In effect, if a user turns O2
knob on the real machine to increase the real O2 rate (figure 5.2), the simulated O2 rate
will increase as well. Then the user can visualize the rate change on the magic lens
interactively, as the green particles (representing the O2) will visually increase in speed
until the user stops turning the knob. Thus, the real machine is an interface to control the
simulation of the machine. The simulation of the gas meters is synchronized to the real
machine, which meets the second criterion for contextualization – synchronizing the
simulation visualization (i.e. invisible gas flow) with the real machine.

6. CONTEXTUALIZATION METHODS
Contextualizing an entire simulation, which may consist of many models and
components, is not as simple as contextualizing the gas flow meters in the previous
example. Simply superimposing an entire simulation ‘as is’ into the real world (or vice
versa) is arguably not enough for the contextualization to make sense to the viewer. For
example, the geometric layout of the simulation may differ vastly from the geometric
layout of the real phenomena (i.e. figure 1.1). In order to effectively contextualize a
simulation with its real world counterpart, some spatial reorganization of either the
simulation or the real phenomenon must occur. To spatially reorganize one object to align
with the other, one object must be ‘cut out’ of its original context and ‘pasted’ into the
corresponding object’s context. Otherwise, although the two objects in question will be
shown in context, the rest of the objects may not be in context.
Either the simulation’s or the real phenomenon’s components must be spatially
reorganized to be co-located in one context. There are at least two methods of visualizing
these mappings: (1) spatially reorganize the components of the real phenomenon to be
registered with the corresponding components of the simulation or (2) spatially
reorganize the components of the simulation to be registered with the corresponding
components of the real phenomenon. These methods are described here through the
example of mapping the VAM simulation to the anesthesia machine.
The purpose of these two specific methods is to help students orient themselves to
the real machine after learning with the VAM. The students start with the VAM, and
proceed through the following contextualization methods before learning with the
anesthesia machine. Through interaction with the AAM, it is expected that students will
better understand the mapping from the VAM to the anesthesia machine and enhance
their overall knowledge of anesthesia machines.
6.1 Contextualization Method 1: VAM-Context
One way to visualize the mapping between a real phenomenon and its simulation is to
spatially reorganize the real phenomenon so that its components are superimposed into
the context of the simulation. Thus, using this method, the components of the real
machine (e.g. the gas flow meters, the vaporizer, the ventilation bag etc) are reorganized
and superimposed into the context of the VAM simulation (figure 6.1). Each real
component is repositioned to align with the corresponding simulated component in the
VAM. Through this alignment, the user is able to visualize the mapping between the
VAM and the real machine.
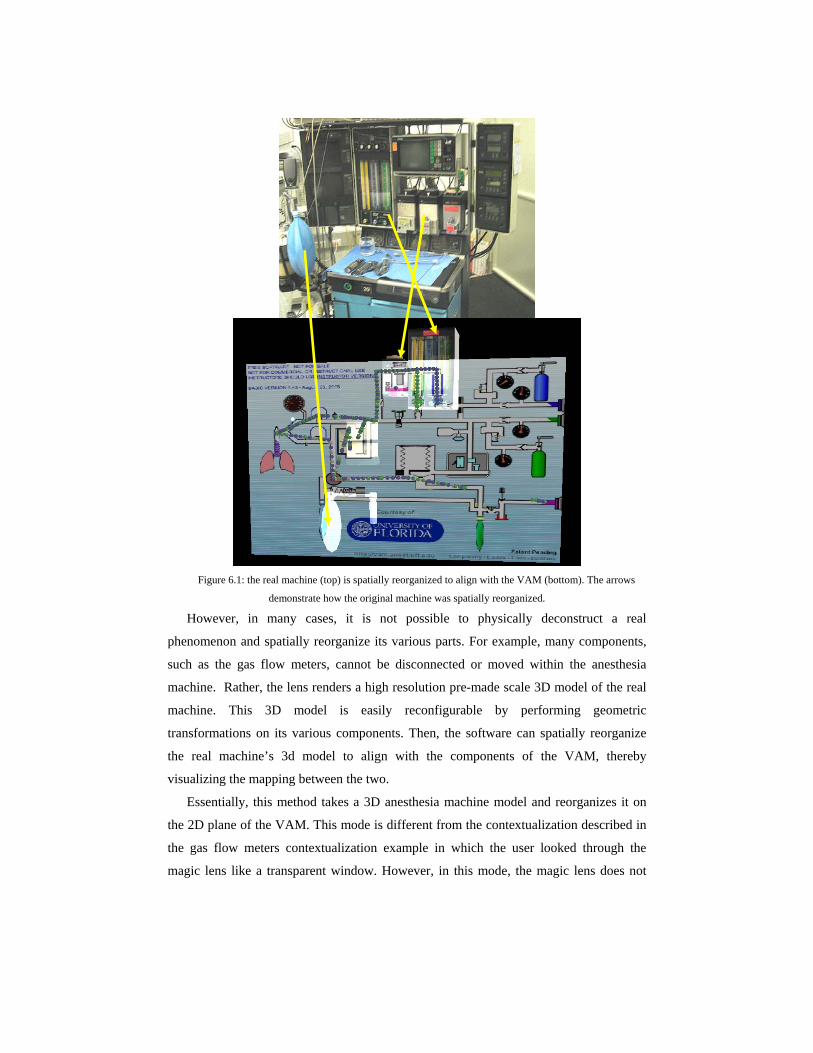
Figure 6.1: the real machine (top) is spatially reorganized to align with the VAM (bottom). The arrows
demonstrate how the original machine was spatially reorganized.
However, in many cases, it is not possible to physically deconstruct a real
phenomenon and spatially reorganize its various parts. For example, many components,
such as the gas flow meters, cannot be disconnected or moved within the anesthesia
machine. Rather, the lens renders a high resolution pre-made scale 3D model of the real
machine. This 3D model is easily reconfigurable by performing geometric
transformations on its various components. Then, the software can spatially reorganize
the real machine’s 3d model to align with the components of the VAM, thereby
visualizing the mapping between the two.
Essentially, this method takes a 3D anesthesia machine model and reorganizes it on
the 2D plane of the VAM. This mode is different from the contextualization described in
the gas flow meters contextualization example in which the user looked through the
magic lens like a transparent window. However, in this mode, the magic lens does not
appear to be see-through anymore. After aligning to the VAM, the 3D model of the
machine is no longer registered to the real machine. In this mode, it makes more sense to
align the VAM plane to the screen, similar to the appearance of the original 2D VAM.
With this method, the lens is just a hand held screen that displays the simulation, rather
than being a see-through window.
The interaction style stays the same as in the previous gas meters contextualization
example. Users can interact with the real machine as an interface to the simulation. To
interact with a specific simulation component, users must first identify the superimposed
real machine component on the lens, and then interact with the real component on the real
machine. This maintains the second criterion of contextualization, synchronizing the
simulation with the real phenomenon, and allows the users to see how their real machine
interactions map to the context of the VAM simulation.
6.2 Contextualization Method 2: Real Machine-Context
Another way to visualize the mapping between the simulation and real phenomena is to
spatially reorganize the simulation and superimpose the simulation components over the
corresponding components of the real phenomenon. Thus, using this method, the
components of the VAM (i.e. gas meters icon, vaporizer icon, ventilator icon etc) are
spatially reorganized and superimposed into the context of the real machine (figure 6.2).
Each simulation component is repositioned in 3D to align with the corresponding real
component. Through this alignment, the user is able to visualize the mapping between the
VAM and the real machine.
This method ‘cuts out’ the 2D simulation components, and ‘pastes’ them over the
corresponding parts of the real machine. This transforms the components from 2D
positions in the VAM to 3D positions in the context of the real machine. The icons
themselves remain on 2D planes, realized in the AAM by creating several flat
quadrilaterals and texturing each quadrilateral with the graphics of a component from the
2D VAM. These quadrilaterals are then scaled to the relative size of the corresponding
component of the real anesthesia machine. Then the quadrilaterals are positioned and
oriented (registered) to align with the components of the real machine. Once this process
is completed, the VAM components can be visualized superimposed over the real
machine as seen in figure 6.2. This overlay helps the user to visualize the mapping
between the real machine and the simulation.

Figure 6.2: The VAM (top) is spatially reorganized to align with the real machine (bottom).
Note that with both contextualization methods presented here, the underlying
simulation model stays the same. For example, in this method, although the reorganized
simulation components no longer maintain the original simulation’s spatial relationships,
they do maintain the same functional relationships. In the AAM, the gas particle
visualization still flows between the same components, but the flow visualization takes a
different path between the components -- a 3D path through the real machine.
6.2.2 Visualization with the Magic Lens

Figure 6.3. The real view and the magic lens view of the machine show from the same viewpoint.
This method uses a magic lens as a see-through window into the world of the 3D
simulation. The lens allows users to move freely around the machine and view the
simulation from a first person perspective by looking through the lens (figure 6.3). The
graphics displayed on the lens align to the user’s view of the real machine, thereby
augmenting their visual perception of the real machine with the overlaid VAM simulation
graphics.
For the see-through effect, the lens displays a scale high-resolution 3D model of the
machine that is registered to the real machine. To facilitate this registration, computer
vision 3D tracking techniques are employed (see section 7 for details). By tracking the
lens’ position and orientation information along with the known position of the real
machine, the lens can display the 3D model of the machine from a perspective that is
consistent with user’s first-person perspective of the real machine. To the user, the lens
appears to be a see-through window.
There are many reasons why the see-though was implemented with a 3D model of the
machine registered to the real machine. This method was chosen over a video see-though
technique (prevalent in many AR applications) in which the VAM components would be
superimposed over a live video stream. The two main reasons for this type of
implementation are:
1. To facilitate video-see-through, a camera would have to be mounted to the lens.
Limitations of camera field of view and positioning make it difficult to maintain the
magic lens’ window metaphor.
2. Using a 3D model of the machine increases the visualization possibilities. For
example, the parts of the real machine cannot be physically separated but the parts in
a 3D model visualization can. This facilitates visualization in the VAM-Context
method and the visual transformation between the methods as described in the next
section.

There are many other types of displays that could be used to visualize the VAM
superimposed over the real machine (such as see-though Head Mounted Display (HMD)).
The lens was chosen because it facilitates both VAM-Context and AAM-Context
visualizations. More immersive displays (i.e. HMDs) are difficult to adapt to the 2D
visualization of the VAM-Context without obstructing the user’s view of the real
machine. However, as technology advances, we will reconsider alternative display
options to the magic lens.
6.2.3 HUD
Figure 6.4. The HUD at the bottom points the user in the direction of each spatially reorganized VAM
component in 3D.
In the case of anesthesia machine training, students become familiar with the VAM
before ever using the real machine. Thus, since students are already familiar with the 2D
VAM, this method’s spatially reorganization of the VAM could be disorienting. To
ameliorate this disorientation, a heads-up-display (HUD) was implemented (figure 6.4).
The HUD shows the familiar VAM icons which are screen aligned and displayed along
the bottom of the lens screen; each icon has a 3D arrow associated with it that always
points at the corresponding component in the anesthesia machine. Thus, if the user needs
to find a specific VAM component’s new location in the context of the anesthesia
machine, the user can follow the arrow above the HUD icon and easily locate the
spatially reorganized VAM component. Once the user has located all the reorganized
VAM components, the user can optionally press a GUI button to hide the HUD.
6.2.4 Interaction

Figure 6.5. A user turns the gas knobs on the real machine and visualizes how this interaction affects the
overlaid VAM simulation.
With this method, users visualize a spatially reorganized VAM simulation that has been
superimposed over the real machine. Users interact with the simulation through their
interactions with the real machine. For example, a user can turn the N2O knob on the real
machine to increase the flow rate of N2O in the real machine (figure 6.5). Then, the user
can look at the flow meters through the magic lens and see the animation of the simulated
N2O particles increase in speed. With this method, the user can visualize how their
interactions with the real machine affect the simulation in context with the real machine;
the overlaid simulation allows users to visualize how the real components of the machine
are functionally and spatially related and thereby visualize how the machine works
internally. Thus, this coupling of the overlaid VAM visualization and real machine
interaction helps the user to visualize the mappings between the VAM simulation and the
real machine being simulated.
6.3 Transformation between VAM-Context and Real Machine-Context
Choosing the appropriate contextualization method for a given application is not trivial.
In many cases, users might prefer to interactively switch between two methods. If users
have the ability to switch between methods, it is beneficial to display a visual
transformation between the contextualizations.
To create a smooth transition between VAM-Context and Real Machine-Context, a
geometric transformation can be implemented. The 3D models (the machine, the 3D
VAM icons) animate smoothly between the differing spatial organizations of each
contextualization method. This transformation ‘morphs’ from one contextualization
method to the other with an animation of a simple geometric transformation (figure 6.6).
For example, when converting from VAM-Context to Real Machine-Context , the VAM-

Context visualization can be projected onto a quadrilateral in the space of the 3D machine
model in Real Machine-Context. Then, a simple 3D transform animation can be
employed to visualize the spatial reorganization of the various components (including the
reorganization of the paths that the particles follow) in each visualization method.
Figure 6.6: Top left: The VAM components are organized to align with the real machine. Top Right: The
transformation to VAM-Context begins. Bottom left: The components begin to take on positions similar to the
VAM. Bottom Right: The real components are organized to align with the VAM.
Consider the 3D gas meters model in Real Machine-Context as they are integrated
with the 3D model of the real machine. The user presses a GUI button on the lens to start
the transformation and the 3D model of the gas meters translate in an animation to its
respective position just behind the gas meters icon in the VAM (after the VAM is
projected onto a quadrilateral in 3D space). Once the transformation into VAM-Context
is complete, the visualization becomes screen aligned again, essentially transforming it
into the 2D visualization. Similarly, to transform gas meters from VAM-Context to Real
Machine-Context, the previous transformations are merely inverted. These transformation
animations visualize the mappings between the real machine and the VAM simulation.
6.3.1 Transformation Implementation
To facilitate this transformation between the two methods, an explicit mapping
between the components positions in each method must be implemented. One way to
implement such a mapping is with a semantic network. The semantic network is a graph
in which there exists a series of ‘links’ or edges between the components in each method.

The structure of the semantic network is simple, although, there are many components
that must be linked. Each 3D model of a real machine component (i.e. the gas meters) is
linked to a corresponding VAM icon. This icon is linked to a position in the VAM and a
position in the real machine. Likewise, the path nodes that facilitate the gas particle
visualizations (i.e. blue particles representing N2O) also have links to path node positions
in both the real machine and the VAM. Then, when the user changes the visualization
method, the components and the particles all translate in an animation to the positions
contained in their semantic links. These links represent the mappings between the real
machine and the VAM; these links also represent the mappings that exist between the two
visualization methods. The animation of the transformation visualizes the mappings
between the components in each method.
7. AAM SYSTEM IMPLEMENTATION
This paper presents methods for contextualizing a simulation with the real phenomena
being simulated by using MR technology. The example application of contextualization
described throughout this paper is called the Augmented Anesthesia Machine (AAM).
The AAM consists of an anesthesia machine augmented with MR technology (tracking
devices, magic lens) to facilitate the contextualization of the VAM with the real machine.
This section will describe the implementation details of the AAM system. Specifically,
this section will explain the details of tracking and display technology that the AAM uses
to enable contextualization.
7.1 Tracking Systems
As described in section 5.1, contextualization involves two criteria: (1) Registration:
superimpose parts of the simulation over the corresponding parts of the real phenomena
(or vice versa) and (2) Synchronization: synchronize the simulation with the real
phenomena. To implement both of these criteria in the AAM, computer vision based
tracking technology was used. There are two separate tracking systems used. One system
tracks the position and orientation of the magic lens, which enables registration. The
other system tracks the meters and gauges of the real machine, which is used to drive the
simulation and enable synchronization.
7.1.1 Tracking the Magic Lens
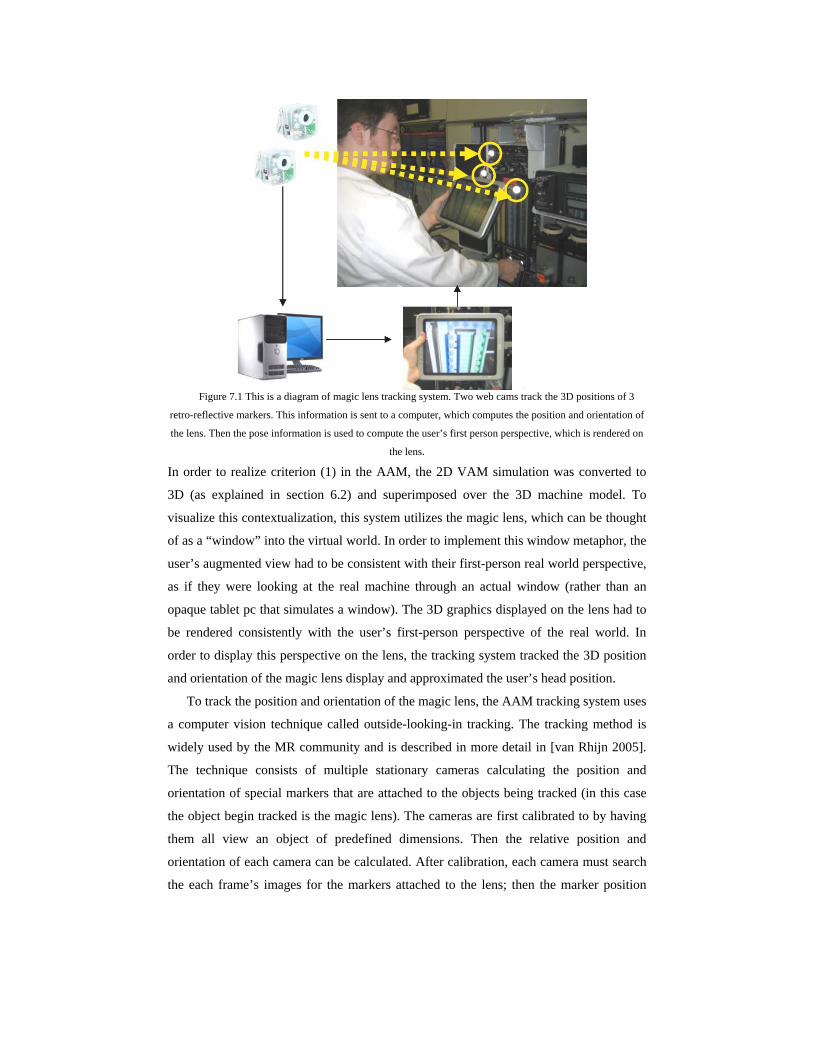
Figure 7.1 This is a diagram of magic lens tracking system. Two web cams track the 3D positions of 3
retro-reflective markers. This information is sent to a computer, which computes the position and orientation of
the lens. Then the pose information is used to compute the user’s first person perspective, which is rendered on
the lens.
In order to realize criterion (1) in the AAM, the 2D VAM simulation was converted to
3D (as explained in section 6.2) and superimposed over the 3D machine model. To
visualize this contextualization, this system utilizes the magic lens, which can be thought
of as a “window” into the virtual world. In order to implement this window metaphor, the
user’s augmented view had to be consistent with their first-person real world perspective,
as if they were looking at the real machine through an actual window (rather than an
opaque tablet pc that simulates a window). The 3D graphics displayed on the lens had to
be rendered consistently with the user’s first-person perspective of the real world. In
order to display this perspective on the lens, the tracking system tracked the 3D position
and orientation of the magic lens display and approximated the user’s head position.
To track the position and orientation of the magic lens, the AAM tracking system uses
a computer vision technique called outside-looking-in tracking. The tracking method is
widely used by the MR community and is described in more detail in [van Rhijn 2005].
The technique consists of multiple stationary cameras calculating the position and
orientation of special markers that are attached to the objects being tracked (in this case
the object begin tracked is the magic lens). The cameras are first calibrated to by having
them all view an object of predefined dimensions. Then the relative position and
orientation of each camera can be calculated. After calibration, each camera must search
the each frame’s images for the markers attached to the lens; then the marker position

information from multiple cameras is combined to create a 3D position. To reduce this
search, the AAM tracking system uses cameras with infrared lenses and retro-reflective
markers that reflect infrared light. Thus, the cameras see only the reflective balls in the
image plane. The magic lens has three retro-reflective balls attached to it. Each ball has a
predefined relative position to the other two balls. Triangulating and matching the balls
from at least two camera views can facilitate calculation of the 3D position and
orientation of the balls. Then this position and orientation can be used for the position and
orientation of the magic lens.
The AAM system uses the position and orientation of the magic lens to render the 3D
machine from the user’s current perspective. Although tracking the lens alone does not
result in rendering the exact perspective of the user, it gives a good approximation as long
as the user knows where to hold the lens in relation to the user’s head. To view the
correct perspective in the AAM system, the user must hold the lens approximately 25cm
away from their eyes and orient the lens perpendicular to their eye gaze direction. To
accurately render the 3D machine from the user’s perspective independent of where the
user holds the lens in relation to the head, both the user’s head position and the lens must
be tracked. Tracking both the head and the lens will be considered in future work.
7.1.2 Tracking the Real Machine’s Meters and Gauges
In order to synchronize the VAM simulation to the real machine as in contextualization
criterion (2), the AAM tracking system must also track the output (i.e. gas meters,
pressure gauges) of the real machine and use it to drive the simulation. When the user
turns the N2O knob, the N2O level meter moves up. The tracking system detects this
change and sends the new N2O rate information to the simulation visualized on the magic
lens. Then the simulation changes the speed of the N2O gas particles and the user can
directly observe this change. In order for the tracking system to detect these changes a
computer vision based tracking system is employed.
The tracking system used to track the machine’s meters and gauges is much less
complex than the system used to track the lens. The meter and gauge tracking system
consists of stationary webcams that are coupled with OpenCV based software that detects
motion from live webcam streams. The image processing routines used to perform
motion tracking are built in functions to the OpenCV library [Bradski 2000]. Using these
techniques, the real machine’s meters and gauges can be tracked and the simulation can
be synchronized to this tracking information.

7.2 Hardware
The system consists of three computers: (1) the magic lens is an HP tc1100 tablet pc (2) a
Pentium IV computer for tracking the magic lens and (3) a Pentium IV computer for
tracking the machine’s meters and knobs. These computers interface with six 30hz
Unibrain Fire-I webcams. Two webcams are used for tracking the lens. The four other
webcams are used for tracking the machines meters and knobs. The anesthesia machine is
an Ohmeda Modulus II. Except for the anesthesia machine, all of the hardware
components used are inexpensive and commercially available off-the-shelf equipment.
8. CONCLUSIONS
This paper presented the concept of contextualizing simulation with the real phenomena
being simulated. If a user needs to understand the mapping between the simulation and
the real phenomena, it could be helpful to incorporate a visualization of this mapping into
the simulation visualization. One way of visualizing these mappings is to ‘contextualize’
the simulation with the real phenomena being simulated. Effective contextualization
involves two criteria: (1) superimpose parts of the simulation over the corresponding
parts of the real phenomena (or vice versa) and (2) synchronize the simulation with the
real phenomena. This combination of visualization as in (1) and interaction as in (2)
allows the user to interact with and visualize the simulation in context with the real
world.
This paper presented two methods of contextualizing simulation with the real
phenomena being simulated, exemplified by an application to anesthesia machine
training. An abstract anesthesia machine simulation, the VAM, was contextualized with
the real anesthesia machine that it was simulating. Thus, two methods of
contextualization were applied: (1) spatially reorganize the components of the real
machine and superimpose them into the context of the abstract simulation and (2)
spatially reorganize the abstract simulation and superimpose it into the context of the real
phenomena. This superimposing is a visualization of the relationship, or mapping,
between the simulation and the real phenomena. Although this mapping is not usually
visualized in most simulation applications, it can help the simulation user to understand
the applicability of the simulation content and better understand both the simulation and
the real phenomena being simulated.
To facilitate an in-context visualization of the mapping between the real phenomena
and the simulation, we used MR technology such as a magic lens and tracking devices.
The magic lens allowed users to visualize the VAM superimposed into the context of the
real machine from a first-person perspective. The lens acted as a window into the world
of the overlaid 3D VAM simulation. In addition, MR technology combined the
simulation visualization with the interaction of the real machine. This allowed users to
interact with the real machine and visualize how this interaction affected the abstract
simulation of the machine’s internal workings.
The main contribution of this research is the concept of integrating abstract simulation
with the real phenomena being simulated through combining visualization and
interaction. The system presented in this paper combines the visualization and interactive
aspects of both the simulation and the real phenomena using MR technology. The
purpose of this system is to visualize the inherent relationship between the simulation and
the real phenomena being simulated. As in the case of anesthesia machine training, this
contextualization may enhance the users overall understanding of both the simulation and
the real phenomena.
9. FUTURE WORK
We plan to formally evaluate the system by conducting user studies with anesthesiology
residents. By comparing the knowledge acquisition of students who learn with the AAM
to students who learn with the current methods (i.e. the VAM and the Anesthesia
Machine), we can investigate whether our methods of contextualization are in fact
beneficial to the end user. Furthermore, to better generalize this work, we will investigate
the needs of other applications besides anesthesiology that could benefit from combining
abstract simulation with the real world. In this effort, we will work to engineer a general
software framework that aids application developers (i.e. educators rather than MR
researchers) in combining simulation and real world phenomena.
10. REFERENCES Azuma, R. T. (1997). "A survey of augmented reality." Presence: Teleoperators and Virtual
Environments(1054-7460) 6(4): 355-385. Balci, O., A. I. Bertelrud, C. M. Esterbrook and R. E. Nance (1997). "The Visual Simulation Environment
Technology Transfer." Simulation Conference Proceedings, 1997. Winter: 1323-1329. Banks, J. and J. S. Carson (2001). Discrete-event system simulation, Prentice Hall Upper Saddle River, NJ. Bier, E. A., M. C. Stone, K. Pier, W. Buxton and T. D. DeRose (1993). "Toolglass and magic lenses: the see-
through interface." Proceedings of the 20th annual conference on Computer graphics and interactive techniques: 73-80.
Booth, P. A. (1989). An Introduction to Human-Computer Interaction, Psychology Press (UK). Bradski, G. (2000). "The OpenCV Library." Dr. Dobb’s Journal November 2000, Computer Security.

Cellier, F. E. (1991). Continuous System Modeling, Springer. Dahl, O. J. and K. Nygaard (1966). "SIMULA: an ALGOL-based simulation language." Communications of the
ACM 9(9): 671-678. Falchuk, B. and A. Karmouch (1998). "Visual modeling for agent-based applications." Computer 31(12): 31-38. Fishwick, P., T. Davis and J. Douglas (2005). "Model representation with aesthetic computing: Method and
empirical study." ACM Transactions on Modeling and Computer Simulation (TOMACS) 15(3): 254-279. Fishwick, P. A. (1995). Simulation Model Design and Execution: Building Digital Worlds, Prentice Hall PTR
Upper Saddle River, NJ, USA. Fishwick, P. A. (2004). "Toward an Integrative Multimodeling Interface: A Human-Computer Interface
Approach to Interrelating Model Structures." SIMULATION 80(9): 421. Hix, D. and H. R. Hartson (1993). Developing user interfaces: ensuring usability through product & process,
John Wiley & Sons, Inc. New York, NY, USA. Hopkins, J. and P. A. Fishwick (2000). "Synthetic Human Agents for Modeling and Simulation." Proceedings
of the IEEE. Insko, B. E., M. Meehan, M. Whitton and F. P. Brooks Jr (2001). "Passive Haptics Significantly Enhances
Virtual Environments." Proceedings of 4th Annual Presence Workshop, Philadelphia, PA. Ishii, H. and B. Ullmer (1997). "Tangible bits: towards seamless interfaces between people, bits and atoms."
Proceedings of the SIGCHI conference on Human factors in computing systems: 234-241. Jordan, P. W. (2002). Designing pleasurable products: An Introduction to the New Human Factors., Routledge
Press. Kato, H. and M. Billinghurst (1999). "Marker Tracking and HMD Calibration for a Video-based Augmented
Reality Conferencing System." Proceedings of the 2nd IEEE and ACM International Workshop on Augmented Reality 99: 85-94.
Kay, A. (1990). "User Interface: A Personal View." The Art of Human-Computer Interface Design: 191-207. Kiviat, P. J., R. Villanueva, H. M. Markowitz and E. C. Russell (1973). SIMSCRIPT II. 5: Programming
Language, Consolidated Analysis Centers. Krahl, D. (2002). "Extend: the Extend simulation environment." Proceedings of the 34th conference on Winter
simulation: exploring new frontiers: 205-213. Kuljis, J. (1996). "HCI and simulation packages." Simulation Conference Proceedings, 1996. Winter: 687-694. Lampotang, S., D. E. Lizdas, N. Gravenstein and E. B. Liem (2006). "Transparent reality, a simulation based on
interactive dynamic graphical models emphasizing visualization." Educational Technology 46(1): 55–59. Larson, J. A. (1992). Interactive software, Yourdon Press. Law, A. M. and W. D. Kelton (2000). Simulation Modeling and Analysis, McGraw-Hill Higher Education. Levoy, M. (1999). "The digital Michelangelo project." 3-D Digital Imaging and Modeling, 1999. Proceedings.
Second International Conference on: 2-11. Lok, B., S. Naik, M. Whitton and F. P. Brooks Jr (2004a). "Experiences in Extemporaneous Incorporation of
Real Objects in Immersive Virtual Environments." Beyond Glove and Wand Based Interaction Workshop, IEEE Virtual Reality.
Lok, B. C. (2004b). "Toward the merging of real and virtual spaces." Communications of the ACM 47(8): 48-
53.

Looser, J., M. Billinghurst and A. Cockburn (2004). "Through the looking glass: the use of lenses as an interface tool for Augmented Reality interfaces." Proceedings of the 2nd international conference on Computer graphics and interactive techniques in Australasia and Southe East Asia: 204-211.
Luke, S., C. Cioffi-Revilla, L. Panait, K. Sullivan and G. Balan (2005). "MASON: A Multiagent Simulation
Environment." SIMULATION 81(7): 517. Mattsson, S. E., H. Elmqvist and M. Otter (1998). "Physical system modeling with Modelica." Control
Engineering Practice 6(4): 501-510. Matusik, W., C. Buehler, R. Raskar, S. J. Gortler and L. McMillan (2000). Image-based visual hulls, ACM
Press/Addison-Wesley Publishing Co. New York, NY, USA. Milgram, P. and F. Kishino (1994). "A Taxonomy of Mixed Reality Visual Displays." IEICE Transactions on
Information Systems 77: 1321-1329. Muetzelfeldt, R. and J. Massheder (2003). "The Simile visual modelling environment." European Journal of
Agronomy 18(3-4): 345-358. Nance, R. E. and R. G. Sargent (2002). "Perspectives on the Evolution of Simulation." Operations Research
50(1): 161-172. Norman, D. A. (1988). The psychology of everyday things, Basic Books New York. Otter, M., H. Elmqvist and F. E. Cellier (1996). "Modeling of multibody systems with the object-oriented
modeling language Dymola." Nonlinear Dynamics 9(1): 91-112. Park, M. and P. A. Fishwick (2004). "An Integrated Environment Blending Dynamic and Geometry Models."
2004 AI, Simulation and Planning In High Autonomy Systems 3397: 574–584. Park, M. and P. A. Fishwick (2005). "Integrating Dynamic and Geometry Model Components through
Ontology-Based Inference." SIMULATION 81(12): 795. Pidd, M. (1996). "Model development and HCI." Proceedings of the 28th conference on Winter simulation:
681-686. Pidd, M., N. Oses and R. J. Brooks (1999). "Component-based simulation on the Web?" Simulation Conference
Proceedings, 1999. Winter 2. Pollacia, L. F. (1989). "A survey of discrete event simulation and state-of-the-art discrete event languages."
ACM SIGSIM Simulation Digest 20(3): 8-25. Pritsker, A. A. B. (1974). The GASP IV Simulation Language, John Wiley and Sons, Inc., New York. Russell, E. C. (1983). Building Simulation Models with SIMSCRIPT II. 5, CACI. Shim, H. and P. Fishwick (2007). "Enabling the Concept of Hyperspace by Syntax/Semantics Co-Location
within a localized 3D Visualization Space." Human-Computer Interaction in Cyberspace: Emerging Technologies and Applications.
State, A., K. P. Keller and H. Fuchs (2005). "Simulation-Based Design and Rapid Prototyping of a Parallax-
Free, Orthoscopic Video See-Through Head-Mounted Display." Proceedings of the Fourth IEEE and ACM International Symposium on Mixed and Augmented Reality: 28-31.
Sutherland, I. (1965). "The Ultimate Display." Proceedings of the IFIP Congress 2(506-508). Ullmer, B. and H. Ishii (2000). "Emerging frameworks for tangible user interfaces." IBM Systems Journal
39(3): 915-931. van Rhijn, A. and J. D. Mulder (2005). "Optical Tracking and Calibration of Tangible Interaction Devices."
Proceedings of the Immersive Projection Technology and Virtual Environments Workshop 2005. Viega, J., M. J. Conway, G. Williams and R. Pausch (1996). "3D magic lenses." Proceedings of the 9th annual
ACM symposium on User interface software and technology: 51-58.

Wang, X., A. Kotranza, J. Quarles, B. Lok and B. D. Allen (2005). "A Pipeline for Rapidly Incorporating Real Objects into a Mixed Environment." Proceedings of the 4th IEEE and ACM International Symposium on Mixed and Augmented Reality, Vienna, Austria.
Ware, C. and J. Rose (1999). "Rotating virtual objects with real handles." ACM Transactions on Computer-
Human Interaction (TOCHI) 6(2): 162-180. Zeigler, B. P., T. G. Kim and H. Praehofer (2000). Theory of Modeling and Simulation, Academic Press, Inc.
Orlando, FL, USA.


![State of Augmented Reality, Virtual Reality and Mixed Reality · State of Augmented Reality, Virtual Reality and Mixed Reality [Microsoft Hololen] [Ready Player One] Augmented Reality](https://static.fdocuments.in/doc/165x107/5f82ab6da2d89130b90d78c7/state-of-augmented-reality-virtual-reality-and-mixed-reality-state-of-augmented.jpg)