A microfluidic study of oil-water separation kinetics€¦ · A microfluidic study of oil-water...
12
A microfluidic study of oil-water separation kinetics T. Krebs 1,2 , C. P. G. H. Schroen 2 & R. M. Boom 2 1 Institute for Sustainable Process Technology, The Netherlands 2 Wageningen University, Food Process Engineering Group, The Netherlands Abstract We present the results of experiments studying droplet coalescence in a dense layer of emulsion droplets using microfluidic circuits. The microfluidic structure allows direct observation of shear-induced collisions and coalescence events between oil droplets dispersed in water. A mineral oil was chosen as the dispersed phase and a 9 wt% NaCl aqueous solution as the continuous phase. We determine the coalescence rate as a function of the droplet velocity and droplet concentration from image sequences measured with a high-speed camera. A trajectory analysis of colliding droplet pairs allows evaluation of the film drainage profile and coalescence time t c . From the coalescence times obtained for ten thousands of droplet pairs we calculate the coalescence time distributions for each set of experimental parameters, which are the mean droplet approach velocity v 0 and the mean dispersed phase fraction φ . We discuss the potential of the procedure for the prediction of emulsion stability in industrial applications. Keywords: emulsion, microfluidic, coalescence, kinetics, image analysis, droplet, film drainage, petroleum. 1 Introduction The control of emulsion stability is an important issue in many industrial applications. Our motivation is rooted in the field of crude-oil/water separation which is a key processing step in oil production. In this application, a common way to separate the liquid mixture is by using mechanical devices [1], like gravity settlers, centrifugal separators such as hydrocyclones or in-line swirl elements [2]. A criterion for the successful operation of these separators is www.witpress.com, ISSN 1743-3533 (on-line) WIT Transactions on Engineering Sciences, Vol 74, © 201 WIT Press 2 doi:10.2495/AFM120 1 38 Advances in Fluid Mechanics IX 427
Transcript of A microfluidic study of oil-water separation kinetics€¦ · A microfluidic study of oil-water...

A microfluidic study of oil-waterseparation kinetics
T. Krebs1,2, C. P. G. H. Schroen2 & R. M. Boom2
1Institute for Sustainable Process Technology, The Netherlands2Wageningen University, Food Process Engineering Group,The Netherlands
Abstract
We present the results of experiments studying droplet coalescence in a dense layerof emulsion droplets using microfluidic circuits. The microfluidic structure allowsdirect observation of shear-induced collisions and coalescence events between oildroplets dispersed in water. A mineral oil was chosen as the dispersed phaseand a 9 wt% NaCl aqueous solution as the continuous phase. We determine thecoalescence rate as a function of the droplet velocity and droplet concentrationfrom image sequences measured with a high-speed camera. A trajectory analysisof colliding droplet pairs allows evaluation of the film drainage profile andcoalescence time tc. From the coalescence times obtained for ten thousands ofdroplet pairs we calculate the coalescence time distributions for each set ofexperimental parameters, which are the mean droplet approach velocity 〈v0〉 andthe mean dispersed phase fraction 〈φ〉. We discuss the potential of the procedurefor the prediction of emulsion stability in industrial applications.Keywords: emulsion, microfluidic, coalescence, kinetics, image analysis, droplet,film drainage, petroleum.
1 Introduction
The control of emulsion stability is an important issue in many industrialapplications. Our motivation is rooted in the field of crude-oil/water separationwhich is a key processing step in oil production. In this application, a commonway to separate the liquid mixture is by using mechanical devices [1], likegravity settlers, centrifugal separators such as hydrocyclones or in-line swirlelements [2]. A criterion for the successful operation of these separators is
www.witpress.com, ISSN 1743-3533 (on-line) WIT Transactions on Engineering Sciences, Vol 74, © 201 WIT Press2
doi:10.2495/AFM120 138
Advances in Fluid Mechanics IX 427

that the demulsification time of the oil/water mixture must be smaller thanthe residence time of the fluids in the separator. To recover pure oil andwater phases, coalescence between emulsion droplets needs to take place; thiscoalescence time will depend on the nature of the flow as well as the presenceof emulsifying agents. To assess the feasibility of a device to separate a crude-oil/water mixture, the kinetic parameters governing coalescence must be known.This becomes especially important in view of Enhanced Oil Recovery methodsthat use surfactants, which may lead to the formation of stable emulsions. As theseparation typically is performed on the oil rig, a fast and robust method to assesscrude-oil/water emulsion stability using lab-scale experiments would be useful,which may aid in separator design for a given produced fluid.
A large number of theoretical and experimental studies on droplet coalescencehave been performed until now. Generally, the physical processes determiningcoalescence are well understood [3,4], but difficult to model, as the solution of theinvolved equations, such as the Navier-Stokes equations to describe the drainageof continuous phase between the droplets, is only possible numerically [5]. Thepresence of surfactants causes additional complications due to the introductionof colloidal forces [6] and modification of the interfacial rheology [7]. For thesereasons, simplified models are often used [8, 9], which provide the necessaryaccuracy to reliably predict coalescence only for chemically simple systems, andif the droplet deformation during film drainage is not significant.
Extensive experimental studies on coalescence between isolated droplet pairscolliding in simple shear flow have been performed. The influence of collisiongeometry [10], viscosity ratio of the liquids [11] and the flow field [12] on thedroplet trajectories and coalescence probability was studied. As these methodstypically use light microscopy to study droplet interactions, density-matchedliquids are employed to avoid movement of droplets out of the focal plane dueto buoyancy. In doing this, the choice of liquids is limited to very specificmodel systems. An experimental route to study coalescence in dilute emulsionsis to optically measure the evolution of the droplet size distribution of asheared emulsion in a rheometer. Both ex-situ [13] and in-situ [14] droplet sizemeasurements have been reported. In the work of Korobko et al. [14], a meancoalescence probability was evaluated from the temporal evolution of the dropletsize distribution.
The rate ri j of coalescence between droplets of volume Vi and Vj can beexpressed as [15]:
ri j = Θi j pi j = Θi je−〈ti j〉/〈τi j〉 (1)
In eq. (1), Θi j and pi j are the collision frequency and coalescence probability;〈ti j〉 and 〈τi j〉 are the mean coalescence time and the mean contact time betweenthe two droplets for a given flow and fluid properties. Θi j can be calculated fromΘi j = nin jσi j∆vi j, where ni and n j are the concentrations of the droplets, σi j is thecollision cross section, and ∆vi j is a characteristic velocity difference between thedroplets. From an application point of view, it would be ideal being able to directlymeasure ri j for a given experimental condition, or to measure Θi j,〈ti j〉 and 〈τi j〉
www.witpress.com, ISSN 1743-3533 (on-line) WIT Transactions on Engineering Sciences, Vol 74, © 201 WIT Press2
428 Advances in Fluid Mechanics IX

independently. Further, the set of ri j measured for a given flow condition and fluidproperties may be used as an input parameter in the coalescence rate equations ofpopulation balance equation (PBE) models [16]. The PBE are used in multiphaseComputational Fluid Dynamics methods to describe the evolution of droplet sizedistributions in fluid-liquid flows [17].
In this article, we present the results of a microfluidic analysis on dropletcoalescence in a dense two-dimensional oil-in-water emulsion without addedsurfactant. We monitor the interactions in an ensemble of droplets in a collisionchamber. We perform a detailed evaluation of the droplet interactions in themicrochannel and analyze the trajectories of colliding droplets which allows tocalculate the coalescence rates for different flow conditions. Further, we obtainthe individual coalescence times for droplet pairs as a function of the initialfilm drainage velocity of the droplets. From this data, we are able to calculatecoalescence time distributions for each set of experimental parameters. We willdiscuss the potential of the method as a predictive tool for crude-oil/waterdemulsification kinetics.
2 Experimental section
2.1 Chemicals
The physical properties of the mineral oil at 293 K are density ρ = 869 kg m−3 andviscosity η = 20.1 mPa s. The aqueous phase was a 9 wt. % solution of NaCl inwater (at 293 K: ρ = 1063 kg m−3, η = 1.18 mPa s). Purified water obtained froma Millipore Milli-Q system (ZMQS 50001) and sodium chloride (ACS reagent, ≥99%, Sigma Aldrich) were used to prepare the solution. All liquids were degassedbefore use. The interfacial tension of the oil/brine interface at 293 K was measuredto be 11 mN m−1.
2.2 Microfluidic experiments
Custom-designed microfluidic circuits were purchased from Micronit B.V., TheNetherlands. The microchips are made from glass and have a rectangular cross-section. Figure 1 displays the layout of the chip. All channels have a depth of 45µm. The width of the channels is 100 µm, except for the channel in the centerof the chip, where the droplets collide. This collision channel has a width of 500µm and a length of 5 mm. The chip contains four inlet and two outlet sections.For droplet creation T-junctions are used, where the continuous (flow rate qc)and dispersed phase channels (qd) intersect. By controlling the flow rate ratioqc/qd , the droplet volume and frequency can be controlled for a given T-junctiongeometry [18,19]. After formation, the droplets then enter a wider channel, wherethey undergo collisions and coalesce. In this collision channel the droplets arenot spherical, but take on a flattened, disk-like shape. The effective hydraulicdiameter dh of a droplet is given by dh = 4A/P, where A and P are the crosssectional area and the perimeter of the droplet. For a disk-shaped droplet, we obtain
www.witpress.com, ISSN 1743-3533 (on-line) WIT Transactions on Engineering Sciences, Vol 74, © 201 WIT Press2
Advances in Fluid Mechanics IX 429

Figure 1: Layout of the microfluidic chips used for the experiments. qd and qc
denote the inlet sections of the continuous and dispersed phases; qout,1and qout,2 denote the outlet sections for the liquids. The channels have auniform depth of 45 µm, the width of all channels is 100 µm, except forthe wider channel in the center of the chip. The width of this channel is0.5 mm, and the length 5 mm.
dh = 4h(dd − (1−π/4)h)/(πh+2(dd −h)), where dd is the diameter of the disk-like droplet and h the channel height. For the flow conditions used in this work, weobtained 70 µm < dd <110 µm, corresponding to 55 µm < dh < 64 µm.
Before each experiment, the microfluidic chips underwent a cleaning procedureto ensure the hydrophilicity of the channels. First, the channels were filled withan alkaline cleaning solution (Decon 90, Decon Laboratories Ltd.), sonicated for15 minutes, and afterwards flushed with water. The chips were then blown dryand baked out in an oven for 3 h at 600 C. Finally, the chips were subjectedto an oxygen plasma for 10 minutes (Zepto B Plasma Cleaner, Diener ElectronicGmbH).
The microfluidic chips are mounted on a chip holder (4515 Nanoport, MicronitB.V., The Netherlands). The inlet sections of the chips are connected to silicacapillary tubing (Grace Altech, inner diameter 150 µm). The liquids are dosedusing syringe pumps (NE 1000, New Era Pump Systems, Inc.). The flow rates ofdispersed phase qd at the two different inlets of the dispersed phase were alwayskept equal, as were the flow rates of continuous phase qc. This was done to assureidentical droplet volumes and formation rates obtained from both T-junctions. Thetwo outlet sections have the same hydraulic resistance. To change the flow rateratio qout,1/qout,2 of the outlet sections, and thus the flow rate ratio in the upperand lower part of the collision channel, capillary tubings of different length (innerdiameter 50 µm) were attached to the outlet sections.
The droplet interactions in the collision channel are monitored using amicroscope (Axiovert 200 MAT, Carl Zeiss GmbH, 2.5× magnification) and acamera (HS4, IDT Inc.). The frame rate of the recorded movies was 10000 s−1.Sequences of images were recorded from one half-section of the collision channel,thereby sampling an area of 0.5×2 mm2. Experimental parameters were thecontinuous and dispersed phase flow rates, qc and qd , as well as the outlet flowrates qout,1 and qout,2. By varying these parameters, the mean drop velocity inthe collision chamber vd and the dispersed volume fraction φ can be controlledindependently from each other. For each experimental condition, movies with alength of 2 s were recorded (Motion Studio Software, IDT Inc.). The range of
www.witpress.com, ISSN 1743-3533 (on-line) WIT Transactions on Engineering Sciences, Vol 74, © 201 WIT Press2
430 Advances in Fluid Mechanics IX

Figure 2: Snapshot of the collision channel. Monodisperse oil droplets (dd = 97µm in this example) dispersed in the aqueous phase enter the chamberfrom two inlets, where they collide and coalesce. The total fluid flow ratein the collision channel is 60 µ l min−1. ys and ye denote the start and endy-coordinate for the evaluation of coalescence events in the chamber.The red dotted rectangle encloses a droplet that was formed throughcoalescence between the displayed and the previous frame.
experimental parameters was 0.21 < qd/qc < 0.71, 2 µ l min−1 < qt < 300µ lmin−1 and 70 µm < dd < 110 µm. qt denotes the total fluid flow rate, qt = qc +qd .
3 Results and discussion
Figure 2 displays a snapshot of the collision channel during an experiment as anexample. Monodisperse oil droplets with dd ≈ 97 µm enter the channel from twoinlets and then move into the wider channel were they undergo collisions. The flowrate qout in each section of the collision channel in this example is qout ≈ 60 µ lmin−1. The flow rate ratio is qd/qc ≈ 0.15, but the dispersed phase fraction φ inthe collision channel is φ ≈ 0.29. This difference is caused by the fact that thedisk-shaped droplets in the collision channel will experience a larger drag due tocontact with the wall and will thus move significantly slower than the continuousphase. Due to this effect, there will be a holdup of droplets in the collision channel.
The mean droplet size increases as the droplets move downstream in thecollision channel. This growth in droplet size is caused by coalescence betweencolliding droplets, which will lead to droplet sizes in the channel ranging fromthe original volume of a droplet V1 entering the chamber, to a droplet volumeof Vi = iV1, where i− 1 indicates the number of coalescence events that led tothe formation of the droplet. The collisions are caused by differences in dropletvelocity, which originate from local differences in hydraulic resistance causedby the presence of neighboring drops, and from the velocity profile that existsin laminar channel flow.
3.1 Evaluation of the coalescence rate
Counting the number of coalescence events permits to calculate the coalescencerate ri j . We define ri j for a combination of droplets of volume Vi and Vj as
www.witpress.com, ISSN 1743-3533 (on-line) WIT Transactions on Engineering Sciences, Vol 74, © 201 WIT Press2
Advances in Fluid Mechanics IX 431

Figure 3: Coalescence rate r11 of the oil/brine system for droplets of relativevolume Vi/V1 = 1, as a function of the mean dispersed phase flux 〈φ〉〈vy〉(shown in panel A). 〈φ〉 denotes the mean dispersed phase volumefraction and 〈vy〉 the mean y-component of the droplet velocity in thecollision channel. Panel B displays the specific coalescence rate q11 ofthe oil/brine system as a function of the mean y-component of the dropletvelocity 〈vy〉 in the collision channel. The mean hydraulic diameter of thedroplets entering the collision channel was d = (58 ± 4.7) µm.
ri j = nc,i j/Actexp, where nc,i j is the number of coalescence events between dropletsi and j, Ac is the area of the collision channel, and texp the experiment time. Theprocedure to determine ri j from the image sequences is described elsewhere [20].Only coalescence events occurring between the y-coordinates ys and ye werecounted (see Figure 2).
r11 is shown in Figure 3A as a function of the mean dispersed phase flux 〈φ〉〈vy〉in the collision channel. 〈φ〉 denotes the mean dispersed phase volume fraction and〈vy〉 the mean y-component of the droplet velocity in the collision channel. Themean hydraulic diameter of the droplets was (58 ± 4.7) µm. The scatter of thedata points is significant, this is caused by the relatively small number of dropletspassing through the chamber in 2 s, which ranged from 200–5000, dependingon the flow rate. The ri j for i ≥ 1 and j > 1 are not shown. r12 was on averageapproximately one order of magnitude smaller than r11 and all other ri j were onaverage zero.
The measured dependence r11(〈φ〉〈vy〉) can be qualitatively explained fromequation (1). The mean shear rate 〈γ〉 in the microchannel is related to vy by〈γ〉 ∝ vy [21]. In simple shear, the collision frequency will depend on 〈γ〉 as Θi j ∝ γand the coalescence probability ln(pi j) ∝ γ−n. Korobko et al. found n = 1.5 ±1 from experiments on coalescence in simple shear flow [14]. The flow in themicrofluidic channel is not simple shear flow due to the large dispersed phasefractions, but qualitatively we would expect a similar scaling of the parametersin equation 1 in our system. Depending on the value of n, ri j may increasemonotonously or pass through a maximum in a given range of γ .
To account for the effect of droplet concentrations on the coalescence rate,we calculate the specific coalescence rate q11 = r11/〈n1〉2. 〈n1〉 is the mean
www.witpress.com, ISSN 1743-3533 (on-line) WIT Transactions on Engineering Sciences, Vol 74, © 201 WIT Press2
432 Advances in Fluid Mechanics IX

concentration of droplets with volume V1 in the collision channel. q11 is formallyequivalent to a second-order rate constant. Figure 3B displays q11 as a functionof the mean y-component of droplet velocity 〈vy〉 in the collision channel. Fromeq. (1), the decrease of qi j with vy indicates a decrease of the coalescenceprobability pi j with increasing vy, as Θi j will increase with increasing 〈vy〉.
3.2 Evaluation of the film drainage profiles and coalescence times
If experimental data for qi j is not available, then eq. (1) can, in principle, be usedto predict qi j. For turbulent flow and laminar shear flow, analytical relations forthe collision frequency Θi j and contact time τi j can be derived if the characteristicvelocity variation ∆v between droplets in the flow is known. For the turbulent flowthis property is related to the rate of energy dissipation ε through ∆v ∝ ε1/3 [22].For laminar shear flow the shear rate γ will determine the magnitude of ∆v,γ ∝ ∆v [15, 22]. For the coalescence time tc no general analytical equation can bederived, except for certain idealized situations, which are typically not encounteredin applications. Hence, a possible experimental measurement of tc(∆v) can also beuseful for coalescence modeling. We argue that the tc(∆v), which we measure, canalso be used to describe coalescence in other flow conditions. On a microscopicscale the approach velocity and force will determine the timescale of coalescence,rather than the mechanism which is bringing the droplets together in the flow.In this section, we will derive tc(∆v) from the recorded trajectories of coalescingdroplets in the microchannels.
Evaluation of the trajectories of colliding droplets permits to calculate thecoalescence time tc, which we define as the time it takes the droplets to approacheach other from a given initial distance h0 to a critical thickness hc at which
coalescence takes place, i.e. tc =∫ hc
h0dh/v f . In the equation, v f = −dh/dt denotes
the velocity of drainage of the continuous phase film between the two droplets.Due to the limited spatial resolution of the microscope that was used in theexperiments we cannot resolve the film drainage process until hc is reached, ashc < 100 nm [23]. We can, however, identify a coalescence event. The occurrenceof coalescence indicates that h ≤ hc between two recorded frames, thus permittingto calculate tc ≈ (F(h0)− F(hc))/ f , whereas F indicates the frames with therelevant film thicknesses and f indicates the frame rate of the camera.
The inset in Figure 4 schematically displays the geometry of a pair of collidingdroplets k and l. The film thickness can be calculated from h ≈ ((xk − xl)
2 +(yk −yl)
2 − (rk + rl))1/2. In doing this, a spherical shape of the droplets is assumed. The
validity of this assumption was checked by evaluation of the circularity parameterc = 4πA/P2. For circular objects, c = 1. It was found that for∼ 90% of all analyzeddroplets c was > 0.95, which indicated circular or almost circular shape of thedroplets. Droplets for which c < 0.95 were discarded from the analysis.
As long as the droplets are still visibly separated, the drag force on a dropletwill be balanced by the force exerted by the flow. Thus, we can calculate a relativeinitial approach or film thinning velocity of the droplets along the line connecting
www.witpress.com, ISSN 1743-3533 (on-line) WIT Transactions on Engineering Sciences, Vol 74, © 201 WIT Press2
Advances in Fluid Mechanics IX 433
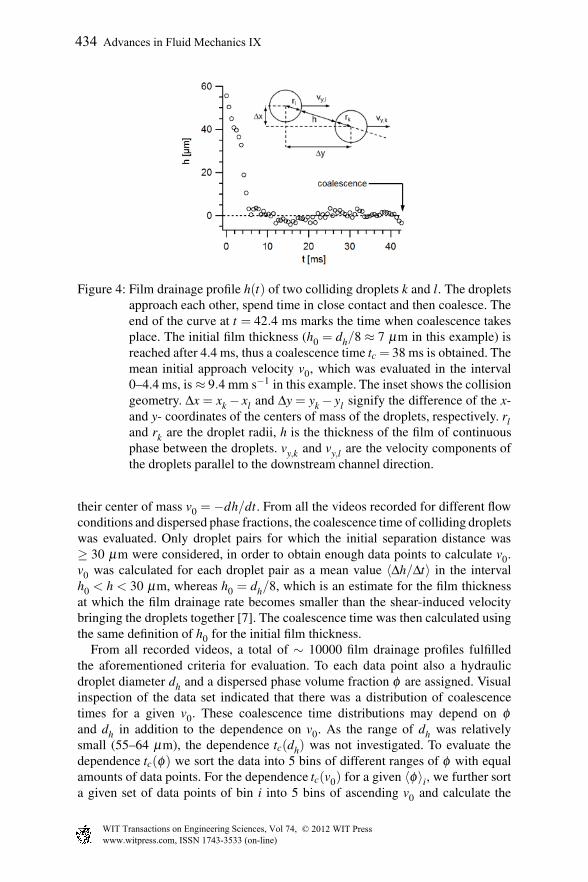
Figure 4: Film drainage profile h(t) of two colliding droplets k and l. The dropletsapproach each other, spend time in close contact and then coalesce. Theend of the curve at t = 42.4 ms marks the time when coalescence takesplace. The initial film thickness (h0 = dh/8 ≈ 7 µm in this example) isreached after 4.4 ms, thus a coalescence time tc = 38 ms is obtained. Themean initial approach velocity v0, which was evaluated in the interval0–4.4 ms, is ≈ 9.4 mm s−1 in this example. The inset shows the collisiongeometry. ∆x = xk − xl and ∆y = yk − yl signify the difference of the x-and y- coordinates of the centers of mass of the droplets, respectively. rland rk are the droplet radii, h is the thickness of the film of continuousphase between the droplets. vy,k and vy,l are the velocity components ofthe droplets parallel to the downstream channel direction.
their center of mass v0 = −dh/dt. From all the videos recorded for different flowconditions and dispersed phase fractions, the coalescence time of colliding dropletswas evaluated. Only droplet pairs for which the initial separation distance was≥ 30 µm were considered, in order to obtain enough data points to calculate v0.v0 was calculated for each droplet pair as a mean value 〈∆h/∆t〉 in the intervalh0 < h < 30 µm, whereas h0 = dh/8, which is an estimate for the film thicknessat which the film drainage rate becomes smaller than the shear-induced velocitybringing the droplets together [7]. The coalescence time was then calculated usingthe same definition of h0 for the initial film thickness.
From all recorded videos, a total of ∼ 10000 film drainage profiles fulfilledthe aforementioned criteria for evaluation. To each data point also a hydraulicdroplet diameter dh and a dispersed phase volume fraction φ are assigned. Visualinspection of the data set indicated that there was a distribution of coalescencetimes for a given v0. These coalescence time distributions may depend on φand dh in addition to the dependence on v0. As the range of dh was relativelysmall (55–64 µm), the dependence tc(dh) was not investigated. To evaluate thedependence tc(φ) we sort the data into 5 bins of different ranges of φ with equalamounts of data points. For the dependence tc(v0) for a given 〈φ〉i, we further sorta given set of data points of bin i into 5 bins of ascending v0 and calculate the
www.witpress.com, ISSN 1743-3533 (on-line) WIT Transactions on Engineering Sciences, Vol 74, © 201 WIT Press2
434 Advances in Fluid Mechanics IX

Figure 5: Distribution of coalescence times nc(tc) for 〈φ〉 = 0.61 ± 0.087 and〈v0〉= (5.8±1.1) mm s−1. The mean hydraulic diameter of the collidingdroplets was (54 ± 4.7) µm. The solid line is a log normal distributionwhich was fitted to the data points. The expected value Etc of this dataset is 53 ms.
distribution of coalescence times for each bin. The upper and lower boundariesof the v0 bins were chosen in a way to obtain the same geometric mean 〈v0〉 j fordifferent 〈φ〉i, to allow a better comparison of the results. Figure 5 displays thedistribution of coalescence events nc(tc) for the bin with 〈φ〉i = 0.61±0.087 and〈v0〉 = 5.8± 1.1 mm s−1 as an example. It was found that all nc(tc) distributionscalculated in this way could be well described by log normal distributions:
nc(tc) ∝1√
2πtcσe−
(lntc−µ)2
2σ2 (2)
The expected value Etc and standard deviation σtc of the distribution can be
calculated from the parameters µ and σ , Etc = eµ+0.5σ 2and σtc = Etc
√eσ 2 −1.
From all the distributions obtained for the different 〈φ〉i and 〈v0〉 j bins, we evaluateEtc and σtc . Etc is shown in Figure 6 as a function of 〈v0〉 for the different〈φ〉i. It can be seen that Etc decreases weakly with increasing 〈v0〉. From powerlaw fits to the data series, we obtain Etc = (31.7± 2.8)× 10−3〈v0〉−0.097±0.012.
Hydrodynamical theory predicts tc ∝ ˙γ−0.5 in the limit of Ca = ηcdhγ/σ → 0 [12],and an increase of the exponent −0.5 to a maximum value of 0.5 for Ca → ∞ [7].We can calculate a local shear rate of colliding droplets for our experiments fromγkl = (vy,l − vy,k)/(| xl − xk |) (see Figure 4). From plotting Etc vs. 〈γkl〉 we obtain
Etc = (37.6±2.7)×10−2〈γkl〉−0.067±0.009 from a power law fit to the data points.The range of 10−3 m s−1 < v0 < 10−1 m s−1 corresponds approximately to a rangeof shear rates 1 s−1 < γkl < 1000 s−1. The exponent of -0.067 found by us for ourexperimental system thus lies within the range of theoretically possible values.
www.witpress.com, ISSN 1743-3533 (on-line) WIT Transactions on Engineering Sciences, Vol 74, © 201 WIT Press2
Advances in Fluid Mechanics IX 435

Figure 6: Expected values Etc (panel A) and standard deviations σtc (panel B)of the coalescence time distributions as a function of the mean initialapproach velocity 〈v0〉 for different mean dispersed phase fractions 〈φ〉i.
There is no trend of tc for the different 〈φ〉i for a given 〈v0〉, which indicatesthat the presence or absence of neighboring droplets does not modify the averagecoalescence time. Panel B of Figure 6 displays σtc as a function of 〈v0〉 for thedifferent 〈φ〉i. Neither a clear trend of σtc as a function of 〈v0〉 and 〈φ〉i can beobserved. Thus we can conclude that the presence of neighboring droplets alsodoes not lead to a broadening of the coalescence time distributions.
Even though we do not know why the coalescence time distribution can bedescribed by a log-normal distribution, we think that the major reason for theexistence of a rather wide distribution is that the droplets are moving in an externalflow field. During the collision, the leading droplet will induce a wake whichwill effect the drag force acting on the trailing droplet [24]. Depending on themagnitude of the absolute velocities of the droplets and the collision angle, thewake effect can cause a net attraction or repulsion of the droplets [25]. Themagnitude of the effect increases with decreasing h. Further, as the droplets aresubjected to shear flow, droplet deformation during the collision can be expectedto be asymmetrical. These factors will influence the timescale of film drainage andmagnitude of droplet deformation. Additionally, the critical film thickness itselfin a quiescent emulsion has a probability distribution, which contributes to theobserved coalescence time distribution [3, 8].
4 Conclusions and outlook
We have presented a method to evaluate the demulsification kinetics of liquid-liquid mixtures. The coalescence rate in a hexadecane-in-water emulsion withoutadded surfactant was measured, which is a parameter that has been difficult toobtain directly until now. Due to the simplicity of the experimental setup and theevaluation procedure, the method provides an easy-to-use diagnostic tool for theassessment of the stability of flowing dispersions. As the flow rates can be adjustedquickly, a complete set of coalescence parameters can be obtained as a function ofthe experimental variables d, φ and qt within a few hours.
www.witpress.com, ISSN 1743-3533 (on-line) WIT Transactions on Engineering Sciences, Vol 74, © 201 WIT Press2
436 Advances in Fluid Mechanics IX

In the current design, the method is best suited for the investigation ofoil-in-water emulsions. For crude-oil-production, the breakup of water-in-oilemulsions is equally important. When using glass chips, the channels can be madetemporarily hydrophobic in a simple manner by adsorption of alkylsilanes on theglass surface for the duration of an experiment [26], to enable the formation ofwater droplets. Alternatively, the microstructures can be made from hydrophobicmaterials [27].
The measured coalescence times are smaller than the residence times of thedroplets in the collision channels, which in our experiments ranged from 0.1 to 2seconds, depending on the fluid flow rate. If the viscosity of the continuous phaseis increased, or surfactant is present in the system, then the coalescence time willbe increased [8]. For these systems, the length of the collision channel can beincreased to increase the residence time of the droplets.
The range of accessible hydraulic diameters is currently limited due to thedroplet being squeezed into a disk-like shape in the collision channel. This issuemay be solved by producing microstructures with a non-uniform depth, where theheight of the collision channel will be several times larger than the height of theT-junction. This will allow the droplet to take on a spherical shape, thus increasingits hydraulic diameter.
Acknowledgement
This work is carried out as part of a project of the Institute for Sustainable ProcessTechnology: development of an Ω2R separator focusing on oil/water separation(project number OG 00-04).
References
[1] Lyons, W., Standard Handbook of Petroleum and Natural Gas Engineering.Elsevier, 2nd edition, 2004.
[2] Slot, J., Van Campen, L., Hoeijmakers, H. & Mudde, R., Separation of oildroplets in swirling water flow. 7th International Conference on MultiphaseFlow - ICMF 2010 Proceedings, p. 11.4.2, 2010.
[3] Walstra, P., Physical Chemistry of Foods. Marcel Dekker, 1st edition, 2003.[4] Sjöblom, J., (ed.) Encyclopedic Handbook of Emulsion Technology. Marcel
Dekker, 1st edition, 2001.[5] Hartland, S., Yang, B. & Jeelani, S., Dimple formation in the thin film
beneath a drop or bubble approaching a plane surface. Chem Eng Sci, 49(9),pp. 1313–1322, 1994.
[6] Danov, K., Petsev, D. & Denkov, D., Pair interaction energy betweendeformable drops and bubbles. J Chem Phys, 99(9), pp. 7179–7189, 1993.
[7] Chesters, A. & Bazhlekov, I., Effect of insoluble surfactants on drainage andrupture of a film between drops interacting under a constant force. J ColloidInterf Sci, 230, pp. 229–243, 2000.
[8] Ivanov, I., Danov, K. & Kralchevsky, P., Flocculation and coalescence ofmicron-size emulsion droplets. Colloid Surface A, 152, pp. 161–182, 1999.
www.witpress.com, ISSN 1743-3533 (on-line) WIT Transactions on Engineering Sciences, Vol 74, © 201 WIT Press2
Advances in Fluid Mechanics IX 437

[9] Rommel, W., Meon, W. & Blass, E., Hydrodynamic modeling of dropletcoalescence at liquid-liquid interfaces. Separ Sci Technol, 27(2), pp. 129–159, 1992.
[10] Guido, S. & Simeone, M., Binary collision of drops in simple shear flowbycomputer-assisted video optical microscopy. J Fluid Mech, 357, pp. 1–20,1998.
[11] Baldessari, F. & Leal, G., Effect of overall drop deformation on flow-inducedcoalescence at low capillary numbers. Phys Fluids, 18, pp. 013602 1–20,2006.
[12] Yang, H., Park, C., Hu, Y. & Leal, L., The coalescence of two equal-sizeddrops in a two-dimensional linear flow. Physics of Fluids, 13, pp. 1087–1106,2001.
[13] Nandi, A., Mehra, A. & Khakhar, D., Coalescence in a surfactant-lessemulsion under simple shear flow. AIChE J, 52(3), pp. 885–894, 2006.
[14] Korobko, A., Van Den Ende, D., Agterof, W. & Mellema, J., Coalescencein semiconcentrated emulsions in simple shear flow. J Chem Phys, 123, pp.204908 1–11, 2005.
[15] Prince, M. & Blanch, H., Bubble coalescence and break-up in air-spargedbubble columns. AIChe J, 36, pp. 1485–1499, 1990.
[16] Schütz, S., Gorbach, G. & Piesche, M., Modeling fluid behavior and dropletinteractions during liquid-liquid separation in hydrocyclones. Chem Eng Sci,64, pp. 3935–3952, 2009.
[17] Ansys cfx user manual.http://www1.ansys.com/customer/content/documentation/120/cfx/xthry.pdf.
[18] Christopher, G. & Anna, S., Microfluidic methods for generating continuousdroplet streams. J Phys D Appl Phys, 40, pp. R319–R336, 2007.
[19] Garstecki, P., Fuerstman, M., Stone, H. & Whitesides, G., Formation ofdroplets and bubbles in a microfluidic t-junction - scaling and mechanismof break-up. Lab Chip, 6, pp. 437–446, 2006.
[20] Krebs, T., Schroen, C. & Boom, R., to be submitted for publication.[21] Bruus, H., Theoretical Microfluidics. Oxford University Press, 1st edition,
2008.[22] Chesters, A., The modelling of coalescence processes in fluid-liquid
dispersions: A review of current understanding. Trans IChemE, 69A, pp.259–270, 1991.
[23] Birdi, K., Handbook of Surface and Colloid Chemistry. CRC Press, 2ndedition, 2003.
[24] Happel, J. & Brenner, H., Low Reynolds Number Hydrodynamics: WithSpecial Applications to Particulate Media. Prentice-Hall, 1st edition, 1965.
[25] Hallez, Y. & Legendre, D., Interaction between two spherical bubbles risingin a viscous liquid. Journal of Fluid Mechanics, 673, pp. 406–431, 2011.
[26] Butt, H., Graf, K. & Kappl, M., Physics and Chemistry of Interfaces. WileyVCH, 1st edition, 2003.
[27] Xia, Y. & Whitesides, G., Soft lithography. Annual Reviews in MaterialScience, 28, pp. 153–184, 1998.
www.witpress.com, ISSN 1743-3533 (on-line) WIT Transactions on Engineering Sciences, Vol 74, © 201 WIT Press2
438 Advances in Fluid Mechanics IX