A microfluidic antibody bioarray for detection of human ...
84
A microfluidic antibody bioarray for detection of human interleukins by Mahsa Gharibi Marzancola M.Sc., Sharif University of Technology, 2010 Thesis Submitted in Partial Fulfillment of the Requirements for the Degree of Master of Science in the Department of Chemistry Faculty of Science © Mahsa Gharibi Marzancola 2016 SIMON FRASER UNIVERSITY Fall 2016
Transcript of A microfluidic antibody bioarray for detection of human ...

A microfluidic antibody bioarray for detection of human interleukins
by Mahsa Gharibi Marzancola
M.Sc., Sharif University of Technology, 2010
Thesis Submitted in Partial Fulfillment of the
Requirements for the Degree of
Master of Science
in the
Department of Chemistry
Faculty of Science
© Mahsa Gharibi Marzancola 2016
SIMON FRASER UNIVERSITY Fall 2016

ii
Approval
Name: Mahsa Gharibi Marzancola Degree: Master of Science Title: A microfluidic antibody bioarray for detection of
human interleukins Examining Committee: Chair:
Paul C. H. Li Senior Supervisor Professor
George Agnes Supervisor Professor
Jonathan Choy Supervisor Associate Professor
Bingyun Sun Internal Examiner Assistant Professor
Date Defended/Approved: December, 16, 2016

iii
Abstract
The purpose of the present work is to investigate the factors affecting antibody
immobilization, and antibody-antigen interactions on a microfluidic chip. The results of
this study will be utilized for the development of a microfluidic antibody bioarray for
detection of two target proteins. Two interleukins of diagnostic value have been selected:
Interleukin-6 (IL-6), and Interleukin-2 (IL-2). The micromosaic array is used for detection
of IL-2 and IL-6 on a microfluidic chip. This method is used to optimize a variety of
factors that affect antibody immobilization on the surface of a microfluidic chip, as well as
bioarray conditions for enhancement of signals. Surface Plasmon Resonance (SPR)
spectroscopy is used to obtain the association and dissociation rate constants for
antibody-antigen binding in this work.
Keywords: antibody bioarray; Polydimethylsiloxane (PDMS); microfluidics; antibody immobilization; antibody-antigen interaction; sandwich Enzyme linked immunosorbent assay (ELISA)

iv
Dedication
I would like to dedicate this thesis to my parents and my
sister, for their continuous love and support.

v
Acknowledgements
I would like to thank my senior supervisor Dr. Paul Li for all the guidance, patience, and
encouragement throughout my journey of graduate work. He always provided me with
insightful advice and guided me in deciding the best course of action to pursue.
I would also like to thank Dr. George Agnes and Dr. Jonathan Choy for their continuous
support, invaluable advice, as well as taking me on as their student even with their busy
schedules.
I would also like to thank the past and present members of Dr. Li’s research group,
especially Dr. Abootaleb Sedighi and Mr. Jonathan Lee for training me on the chip
functionalization, and their continuous help and encouragement.
Finally I would like to thank my friends and family who have supported me throughout
the entirety of this stage in my life.

vi
Table of Contents
Approval ............................................................................................................................. iiAbstract ............................................................................................................................. iiiDedication ......................................................................................................................... ivAcknowledgements ............................................................................................................ vTable of Contents .............................................................................................................. viList of Tables ................................................................................................................... viiiList of Figures ................................................................................................................... ixList of Acronyms .............................................................................................................. xii
Chapter 1. Introduction ............................................................................................... 11.1. Protein microarrays .................................................................................................. 11.2. Antibody bioarrays ................................................................................................... 41.3. Microarray formats ................................................................................................... 6
1.3.1. Microspot arrays .......................................................................................... 61.3.2. Microwell arrays .......................................................................................... 71.3.3. Micromosaic arrays ..................................................................................... 7
1.4. Surface modification strategies for immobilization of antibodies ............................. 81.4.1. Physical immobilization of antibodies .......................................................... 8
Polystyrene surface ................................................................................................. 9Poly-L-lysine surface ............................................................................................... 9
1.4.2. Chemical immobilization of antibodies ...................................................... 10Glutaraldehyde surface ......................................................................................... 11
1.5. The effect of increased surface area in antibody immobilization ........................... 121.5.1. Zinc oxide nanostructures synthesis ......................................................... 13
The vapor phase synthesis ................................................................................... 13The solution phase synthesis ................................................................................ 13
1.6. Strategies for well-oriented immobilization of antibodies ....................................... 151.7. Detection techniques in antibody arrays ................................................................ 161.8. Importance of interleukins ...................................................................................... 19
1.8.1. Biological role of interleukin-2 ................................................................... 211.8.2. Biological role of interleukin-6 ................................................................... 21
1.9. Thesis objectives.................................................................................................... 22
Chapter 2. Experimental Section .............................................................................. 242.1. Materials and Instruments ...................................................................................... 24
2.1.1. Materials and reagents .............................................................................. 242.1.2. Instruments ............................................................................................... 26
2.2. Fabrication of PDMS microchips ............................................................................ 262.3. Surface modification methods ................................................................................ 29
2.3.1. Polystyrene ............................................................................................... 292.3.2. Poly-L-lysine surface ................................................................................. 292.3.3. Glutaraldehyde surface ............................................................................. 302.3.4. Synthesis of zinc oxide nanostructures on the chip .................................. 31
Seeding step ......................................................................................................... 31Growth step ........................................................................................................... 32

vii
2.4. Peptide and antibody immobilization on microfluidic chip ...................................... 322.4.1. Peptide immobilization .............................................................................. 322.4.2. Antibody immobilization ............................................................................ 34
2.5. Sandwich detection on the chip ............................................................................. 342.5.1. Probe immobilization ................................................................................. 342.5.2. Target binding ........................................................................................... 35
Chapter 3. Intersection approach in a microfluidic chip ........................................ 363.1. Initial results on microfluidic chip: peptide and antibody immobilization ................ 383.2. Sandwich detection on a microfluidic chip ............................................................. 43
Chapter 4. Optimizing conditions of the microfluidic chip .................................... 484.1. Increasing the amount of immobilized capture antibody on ZnO
nanostructures ....................................................................................................... 484.1.1. Synthesis of ZnO nanostructures on the microchip glass surface ............ 484.1.2. Effect of ZnO nanostructures on antibody immobilization ......................... 51
4.2. Antigen incubation time .......................................................................................... 524.3. Orientation of immobilized capture antibody .......................................................... 53
Effect of protein G in immobilization of capture antibody ...................................... 544.4. Effect of multiple passes of sample solution in microfluidic channels .................... 574.5. Development of an antibody array for detection of human interleukin-6 ................ 59
Chapter 5. Conclusions and Future Directions ....................................................... 615.1. Summary of the research and conclusion .............................................................. 615.2. Future directions .................................................................................................... 63
References .....................................................................................................................64Appendix A. Kinetic studies: effect of protein G sub-layer on antibody-antigen
interactions ............................................................................................................. 72

viii
List of Tables
Table 1.1. Detection limits obtained from recent protein microarrays ............................... 3Table 1.2. Surface modifications for protein immobilization (Rusmini et al., 2007) ........ 11Table 5.1, Summary of fluorescence signal fold-increase obtained from different
signal enhancement strategies in this work ............................................. 62

ix
List of Figures
Figure 1.1. Fluorescence signal generation methods: (1) Direct method for detection of target peptides (A), and target antibodies (B) using fluorescently labeled detection antibodies; and (2) Sandwich detection method using a fluorescently labeled detection antibody (A), using a fluorescently labeled tertiary antibody (B), and using a biotin-labeled detection antibody to be detected by a fluorescently labeled streptavidin (C). ............................................................................ 5
Figure 1.2. Schematic of the intersection approach used in micromosaic arrays ............. 8Figure 1.3. Chemical structures of poly-L-lysine (A) and polystyrene (B) ......................... 9Figure 1.4. Chemistry of antibody immobilization on glutaraldehyde surface ................. 12Figure 1.5. (A) structure of antibody showing the fragment antigen-binding (Fab),
fragment crystallizable (Fc), heavy and light chains. (B) Three orientations of antibody immobilized on a solid surface with Fc region on the surface, sideway immobilization, and Fab regions on the surface. .............................................................................................. 15
Figure 1.6. Methods for well-oriented immobilization of antibodies: DNA-directed antibody immobilization (A), and the use of antibody-binding proteins such as protein A and protein G (B) .......................................... 16
Figure 1.7. Schematic diagram of Surface Plasmon Resonance. The image is not drawn to scale. ........................................................................................ 18
Figure 2.1. Fabrication of mastermold and PDMS slab .................................................. 28Figure 2.2. Transfer of PDMS channel slab from photomask (A) to master mold
(B) and then to PDMS slab (C). The The PPMS chip size is 2.5 inch2 and channels dimensions in this PDMS chip are 150 µm wide and 35 µm deep. ............................................................................. 29
Figure 2.3. Preparation of aldehyde-functionalized glass chip: The steps 1, 2 and 3 show piranha cleaning, APTES functionalization and glutaraldehyde (GA) functionalization, respectively. ............................... 31
Figure 3.1. Schematic of the intersection method: Probe immobilization involves sealing PDMS slab 1 to glass slide and flowing probe solutions in channels (A). PDMS slab 1 is then removed (B). In the target binding step PDMS slab 2 is sealed on glass perpendicular to the previous position of PDMS chip 1, and target solution followed by detection reagent are introduced to channels (C). Finally PDMS slab 2 is removed (D) and glass slide is scanned using a fluorescence scanner. ............................................................................. 37

x
Figure 3.2. Immobilization of peptide probes using the intersection method. The patches (150 µm x 150 µm) created at the intersection of BioHA probe lines and vertical channels filled with streptavidin-Cy5 (SA/Cy5). Since HA does not have biotin, there is no signal associated with it at the intersections. ..................................................... 38
Figure 3.3. Detection of BioHA peptide (A), HA peptide (B), and anti-HA antibody (C) on a microfluidic chip surface at the intersection of probe lines and sample channels. Each red patch on the chip depicts fluorescence detection of binding between probes that are immobilized on the surface and targets. This figure is simplified and not drawn into scale. ........................................................................ 39
Figure 3.4. Detection of peptides and antibodies via the intersection method in a microfluidic chip. a: Fluorescence image of the scanned chip. A: Inset for peptide immobilization confirmation, B: Inset for peptide immobilization, antibody binding, and antibody-antibody interaction. C: Inset for immobilization of antibody and detection of antibody-antibody interaction. ................................................................. 41
Figure 3.5. The histogram shows fluorescence signals for detection of BioHA (100 µg/mL), HA (50 µg/mL), and antiHA (100 µg/mL) in a microfluidic chip on three different surfaces: polystyrene, poly-L-lysine, and glutaraldehyde. The error bars show the standard deviation of 4 replicates. Each replicate is the signal value for one square-shaped patch. .............................................................................. 42
Figure 3.6. Schematic of sandwich detection on a microfluidic chip ............................... 44Figure 3.7. Scanned results of sandwich method on a chip for detection of human
Interleukin-2 (100 ng/mL) on glutaraldehyde surface. Empty vertical channels are not labeled. IL-2 Incubation time was 60 min, during which the solution inside the channels was refreshed 4 times (4 injections). ................................................................................. 44
Figure 3.8. Antibody bioarray results for detection of human interleukin-2 (50 ng/mL) on (A) polystyrene, (B) poly-L-lysine, and (C) glutaraldehyde surfaces: Fluorescence scanned chips (Top), and Fluorescence signal intensities (Bottom). IL-2 Incubation time was 120 min, during which the solutions inside the channels were refreshed 4 times (4 injections). .............................................................. 46
Figure 3.9. The histogram shows fluorescence signals for detection of human IL-2 (10 ng/mL) in a microfluidic chip on three different surfaces: poly styrene (PS), poly-L-lysine (PLL), and glutaraldehyde (GA). The incubation time for IL-2 was 90 min, during which the solution inside the channels was refreshed 4 times (4 injections).The error bars show the standard deviation of 4 replicates. Each replicate is the signal value for one square-shaped patch. ....................................... 47

xi
Figure 4.1. Comparison of the results for BioHA (50 µg/mL) immobilization on GA surface of 1. Seeded ZnO chips and 2. Non-seeded ZnO chips. A) Scanned image of chips, B) signal intensity of the patch, and C) SEM image of the ZnO surface before aldehyde functionalization. The growth solution concentration was 25 mM and growth time was 30 min in both experiments. ............................................................. 50
Figure 4.2. Peptide and antibody immobilization on the glutaraldehyde (GA) surface on: (A) ZnO nanostructure modified chip, and (B) plain chip. The signal intensities obtained from 4 replicates of immobilized biotin-labeled antibody (BioIgG) are compared on two GA chips with and without ZnO pre-coating (n=4) (C). ........................... 51
Figure 4.3. Effect of IL-2 (10 ng/mL) incubation time on fluorescence signal intensity of sandwich detection method on the aldehyde functionalized microfluidic chip (n=4). IL-2 solution inside the channels was refreshed 4 times (4 injections) in all cases. The background signal is subtracted and corrected fluorescence signal is reported. .............................................................................................. 53
Figure 4.4. Protein G sub-layer increases fluorescence signal of sandwich detection, probably by improving the orientation of capture antibody. IL-6 Incubation time was 120 min, during which the solutions inside the channels were refreshed 4 times (4 injections). ............................................................................................... 55
Figure 4.5. False positive signal of IL-2 due to binding between anti-IL-2 detection antibody and protein G ............................................................ 56
Figure 4.6. Effects of different concentrations of protein G used as sub-layer for capture antibody immobilization. The concentration of both capture antibody is 125 µg/mL, and that of both interleukins is 30 ng/mL. The incubation time was 120 min, during which the solution inside the channels was refreshed 4 times (4 injections). The error bars show the standard deviation of 4 replicates. ................... 57
Figure 4.7. Multiple stop-flow (12X) introduction of analyte (5 ng/mL solution of human IL-2) vs. single stop-flow (1X): A) Scanned image of the chip, B) Fluorescence signals, and C) Histogram of signal intensities (4 replicates). IL-2 Incubation time was 120 min. No protein G was used in these experiments. .............................................. 59
Figure 4.8. Detection of human interleukin-6 on the microfluidic chip. The IL-6 incubation time was 120 min and consisted of 12 passes of this protein solution. A sub-layer of protein G (1 mg/mL) was coated in horizontal channels prior to capture antibody immobilization. ................. 60

xii
List of Acronyms
Ab Antibody
Ag Antigen
APTES 3-aminopropyltriethoxysilane
Bio Biotin
BSA Bovine serum albumin
CapAb Capture antibody
Cy5 Cyanine 5
DetAb Detection antibody
DI Deionized
ELISA Enzyme Linked Immunosorbent Assay
GA Glutaraldehyde
HA Hemagglutinin
HRP Horseradish peroxidase
IgG Immunoglobulin G
IL-2 Interleukin-2
IL-6 Interleukin-6
PBS Phosphate buffered saline
PDMS Polydimethylsiloxane
PLL Poly-L-lysine
POC Point of care
PS Polystyrene
SA Streptavidin
SPR Surface Plasmon Resonance
TPBS Tween20-Phosphate buffered saline

1
Chapter 1. Introduction
Microfluidics systems use channels with dimensions of tens to hundreds of
micrometers to process or manipulate small (10-9 to 10-18 litres) amounts of fluids,
(Whitesides, 2006). Microfluidic devices offer a number of capabilities: low cost, short
analysis time, small size, high sensitivity, and the use of small quantities of samples and
reagents. Moreover, laminar flow, as the characteristic of fluids in microchannels, offers
the control of concentrations of molecules in space and time (Whitesides, 2006).
1.1. Protein microarrays
Protein microarrays are used in many bioanalytical applications of microfluidic
systems. A protein array consists of a 2D arrangement of immobilized protein spots.
Each spot can contain a homogeneous or heterogeneous set of probe molecules. The
probe molecule can be an antibody (Angenendt et al., 2002), a recombinant protein or
peptide (MacBeath and Schreiber, 2000), or an aptamer (i.e. a nucleic acid) (Chen et al.,
2014).
The concept of protein microarrays was introduced in 2000 by MacBeath et al.
They defined protein arrays as miniaturized assays that accommodate extremely low
sample volumes and enable the rapid and simultaneous processing of thousands of
proteins (MacBeath and Schreiber, 2000). In their experiment, a robot was used to spot
protein samples onto chemically functionalized glass slides at high densities. The
proteins that were covalently immobilized on the surface interacted with other target
proteins or small molecules in solutions.

2
In contrast to nucleic acid microarrays, the structural diversity and complexity in
proteins has made the development of protein arrays technically very difficult (Talapatra
et al., 2002). A number of these challenges are listed below (Borrebaeck and Wingren,
2009)(Liotta et al., 2003):
• Dynamic range of the proteome: There is a wide range of concentrations that should be detected for proteins. Protein concentrations exist over a broad dynamic range (by up to a factor of 1010). Moreover, a low abundance of proteins always exists in a complex biological mixture containing an excess amount of contaminating proteins (i.e. proteins that may non-specifically bind to the protein array surface). Cross reactivity of proteins is one of the challenges that make the signal to noise ratio of the array unacceptable because of an increase in the background.
• Sensitivity requirements: Direct amplification methods, similar to polymerase chain reaction (PCR) for nucleic acids, do not exist for proteins. Therefore, indirect amplification methods, such as purification and pre-concentration steps, need to be used for proteins. These steps need to be reproducible over a large dynamic range to ensure reliable quantitative analysis. Also, for the purpose of analyzing clinical samples, the protein array needs to be capable of analyzing body fluids directly. The volume of such samples is low, and the total concentration of target protein in them is usually very low. This fact also requires high sensitivity in detection method.
• The need for specific high affinity antibodies and other probe molecules: The availability of high-quality and specific antibodies, or other probe molecules like aptamers and protein ligands, is a limiting factor in the protein array technology. There are sets of high-quality antibodies commercially available; however, not for all proteins. This shortage of high-quality probe molecules is observed even more for other types of probe molecules that are recently being developed, like aptamers.
• Substrates for protein array: The types of substrate and the substrate-probe interactions that are used for protein immobilization may vary from one sample to another. Moreover, although planar substrates can be useful for highly abundant proteins, these substrates cannot attain sufficient surface area per spot for detection of low concentrations of proteins. Optimal substrates for protein arrays must have high binding capacity, high surface area, and low background signal.
Researchers of protein microarrays have overcome a number of these challenges such
as successful immobilization of different proteins in their active conformation on a single
glass slide. There are valuable advantages for protein arrays such as multiplexing

3
capability, low-volume sample consumption, high sensitivity, efficient sample-to-result
time, and low price. Therefore, protein arrays have the potential for use in a number of
applications including evaluation of antibody response in allergy and infectious disease
diagnostics, detection of autoantibodies (for autoimmunity diagnostics), and profiling
cancer biomarkers. Protein microarrays have been developed for applications such as
identification of protein-protein interactions (Rao et al., 2014), protein-phospholipid
interactions (Hall et al., 2007a), detection of small molecule targets (Bidlingmaier and
Liu, 2015), and clinical diagnostics (Zhong et al., 2005) and monitoring (Urbanowska et
al., 2003) of disease states. However, the development of protein microarrays for
diagnostics is still limited within the research environment because of various
challenges. Among the challenges that this technology faces are: quality of the probe-
printing process, mass transport limitations, cross-reactivity of bio-reagents, assay
automation and quantification of proteins by a calibrated method (Cretich et al., 2013). A
summary of detection limits obtained from different detection methods in recent protein
microarrays is presented in Table 1.1.
Table 1.1. Detection limits obtained from recent protein microarrays
Detection method Analyte Capture probe Detection limit Reference Fluorescence Prostate-specific
antigen (PSA) Antibody-
functionalized microbeads
1 ng/mL (Han et al., 2015)
Surface Plasmon Resonance
Bovine growth hormone (BGH)
Antibody-coated Au nanoparticles
3.7 ng/mL (SadAbadi et al., 2013)
Chemiluminescence Anti-rabbit IgG Rabbit IgG 2 nM (Novo et al., 2014) DVD-ROM optical
detection Platelet-derived
growth factor (PDGF)
Aptamer 10 nM (Bosco et al., 2013)
Fluorescence HIV-p24 antigen Antibody-coated microbeads
2 pg/mL (Li et al., 2014)
Enzymatic detection α-fetoprotein (AFP) Antibody-carbon spheres
0.02 ng/mL (Du et al., 2010)
Fluorescence Tumor necrosis factor (TNF-α)
Anti-TNF- α 0.02 ng/mL (Cohen et al., 2015)
Voltammetry TNF- α INF-γ
Aptamers on electrode
10 ng/mL or 0.06 nM (Liu et al., 2015)
4
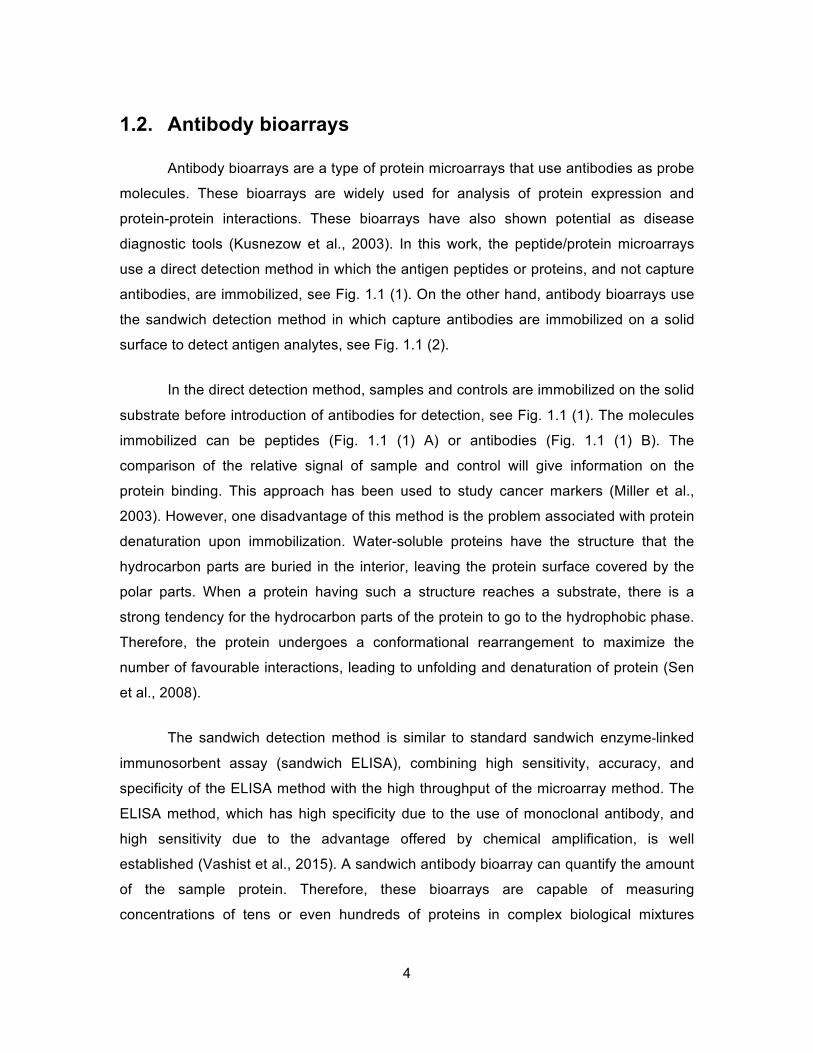
1.2. Antibody bioarrays
Antibody bioarrays are a type of protein microarrays that use antibodies as probe
molecules. These bioarrays are widely used for analysis of protein expression and
protein-protein interactions. These bioarrays have also shown potential as disease
diagnostic tools (Kusnezow et al., 2003). In this work, the peptide/protein microarrays
use a direct detection method in which the antigen peptides or proteins, and not capture
antibodies, are immobilized, see Fig. 1.1 (1). On the other hand, antibody bioarrays use
the sandwich detection method in which capture antibodies are immobilized on a solid
surface to detect antigen analytes, see Fig. 1.1 (2).
In the direct detection method, samples and controls are immobilized on the solid
substrate before introduction of antibodies for detection, see Fig. 1.1 (1). The molecules
immobilized can be peptides (Fig. 1.1 (1) A) or antibodies (Fig. 1.1 (1) B). The
comparison of the relative signal of sample and control will give information on the
protein binding. This approach has been used to study cancer markers (Miller et al.,
2003). However, one disadvantage of this method is the problem associated with protein
denaturation upon immobilization. Water-soluble proteins have the structure that the
hydrocarbon parts are buried in the interior, leaving the protein surface covered by the
polar parts. When a protein having such a structure reaches a substrate, there is a
strong tendency for the hydrocarbon parts of the protein to go to the hydrophobic phase.
Therefore, the protein undergoes a conformational rearrangement to maximize the
number of favourable interactions, leading to unfolding and denaturation of protein (Sen
et al., 2008).
The sandwich detection method is similar to standard sandwich enzyme-linked
immunosorbent assay (sandwich ELISA), combining high sensitivity, accuracy, and
specificity of the ELISA method with the high throughput of the microarray method. The
ELISA method, which has high specificity due to the use of monoclonal antibody, and
high sensitivity due to the advantage offered by chemical amplification, is well
established (Vashist et al., 2015). A sandwich antibody bioarray can quantify the amount
of the sample protein. Therefore, these bioarrays are capable of measuring
concentrations of tens or even hundreds of proteins in complex biological mixtures

5
simultaneously, in a single experiment with sample amounts usually only sufficient for a
single assay performed in a conventional microtiter plate (Borrebaeck and Wingren,
2009). A recent example of assaying multiple proteins was the work of Wu et al. for
screening 274 proteins that were potential serum markers of systemic lupus
erythematosus in 22 patients as well as healthy controls (Wu et al., 2016).
Figure 1.1. Fluorescence signal generation methods: (1) Direct method for
detection of target peptides (A), and target antibodies (B) using fluorescently labeled detection antibodies; and (2) Sandwich detection method using a fluorescently labeled detection antibody (A), using a fluorescently labeled tertiary antibody (B), and using a biotin-labeled detection antibody to be detected by a fluorescently labeled streptavidin (C).
In antibody arrays using the sandwich detection method, see Fig. 1.1 (2), a group of
antibodies are first immobilized on the surface to specifically capture their respective
protein analytes (capture antibodies). The binding reaction occurs each at a particular
region on the protein analyte (epitope). Then, a secondary antibody (detection antibody)
binds to a different part of antigen that is recognized by antibody (i.e. a different epitope
on the target protein). The detection antibody can be labeled with a fluorescence dye
(Fig 1.1 (2) (A)). This approach makes the assay simple, but requires chemical labeling
of the detection antibody. Another method is using a fluorescently labeled tertiary
antibody that binds to detection antibody (Fig 1.1 (2) (B)). For instance, if detection

6
antibody is a goat antibody, the tertiary antibody is anti-goat antibody. This approach
avoids the expensive steps of chemical modification and purification of the fluorescent
monoclonal detection antibody; however, it limits the types of capture antibody that can
be used for the assay, due to the chance of cross-reaction between capture antibody
and tertiary antibody, and false positive signals. An alternative method that is
commercially available is the use of a biotin-labeled detection antibody (Fig 1.1 (2) (C)),
which is detected by a fluorescently labeled streptavidin. Streptavidin is tetrameric
protein that binds to biotin with a high binding affinity or low dissociation constant (Kd=10 -15M) (Weber et al., 1989).
1.3. Microarray formats
Today many different formats have been developed to construct protein
microarrays. Some examples are microspot arrays, microwell arrays, and microfluidic
chips.(Glökler and Angenendt, 2003).
1.3.1. Microspot arrays
Early developments of the protein microarray technology included the generation
of low-density protein arrays spotted on nitrocellulose membranes (Ge, 2000). The
spotting patterns were based on the 96-well microtiter plate format. MacBeath and
Schreiber demonstrated spotting proteins and antibodies onto glass slides, that were
functionalized with aldehyde groups (MacBeath and Schreiber, 2000). Microspot arrays
that are developed by automated printing of antibodies using robotic arms are still used
today. However, these arrays may have technical difficulties such as contamination
caused by mixing two types of probe molecules in one spot (due to printing two spots
that are too close to each other) or inconsistencies caused by non-uniform printing of
antibodies, which leads to having different amounts of the same probe molecules of the
same concentrations printed on different spots.

7
1.3.2. Microwell arrays
In addition to flat surfaces, there is a technology that uses microwells to construct
microwell arrays. Zhu et al. employed microwells of 1.4 mm in diameter and 300 µm in
depth to study protein kinases. These microwells could carry up to 300 nL of solution
(Zhu et al., 2000). Microwells of smaller dimensions (2.5 µm diameter and 5 µm depth)
have also been fabricated for arraying single live cells (Biran and Walt, 2002). Yang et
al. have recently used this method for detection of rare tumor cells using an antibody
array (Yang et al., 2016). The microwell chip in this study consisted of 15000 microwells
of 60 pL size each.
1.3.3. Micromosaic arrays
Micromosaic arrays were first proposed by Bernard et al. in 2001 as a new
format for immunoassays (Bernard et al., 2001). This method allows for multiple protein
probes to react with multiple samples simultaneously.
In the micromosaic array, a PDMS channel slab is sealed on the planar substrate
to create closed channels. Then, the biomolecules that act as probes (capture antibody,
aptamer, peptide) are immobilized on the surface as printed rectangular stripes. Then
this PDMS slab is removed, and another PDMS channel slab is sealed on the printed
surface, in an orientation perpendicular to the position of the first PDMS slab. Therefore,
when the target biomolecule is introduced to the channels, they can react with the probe
molecules on the surface, at the intersections of the probe stripes and target channels.
These interactions can be detected by either directly labeling the biomolecules or by
introducing a labeled detection molecule (sandwich systems). This method has been
previously developed in our research group for nucleic acid analysis, such as fast
discrimination of fungal pathogenic DNA (Wang and Li, 2010), or detection of Kras gene
mutations (Sedighi and Li, 2014). Chapter 3 discusses application of this method for
protein analysis. The advantage of micromosaic array over previous methods is the high
throughput of this method. By immobilizing one probe line horizontally on the glass
surface (which requires below one microliter of the probe solution), multiple samples that
are introduced to the vertical channels can be analyzed at the intersections. Figure 1.2
shows a schematic of the intersection approach.

8
Figure 1.2. Schematic of the intersection approach used in micromosaic arrays
1.4. Surface modification strategies for immobilization of antibodies
The type of solid surface of an antibody microarray has a tremendous influence
on the sensitivity of the array experiment. It is important to find the optimal method to
attach antibodies to the chip surface without affecting their function. Various factors
affect the quality of an antibody bioarray, such as surface modification, the type of cross-
linker for immobilization, and the concentration of antibody.
Two different methods for antibody immobilization are commonly used: physical
immobilization and chemical immobilization. In this thesis polystyrene (PS) and poly-L-
lysine (PLL) surfaces were experimented as the matrix for physical adsorption of
antibodies. Also, glutaraldehyde (GA) surface was investigated as the surface for
chemical immobilization of antibodies. In this section, we briefly describe common
antibody immobilization techniques, with an emphasis on the methods that are studied in
this thesis.
1.4.1. Physical immobilization of antibodies
The first and simplest immobilization method of proteins is on surfaces that have
a high inherent binding energy to proteins in general. This binding is a type of physical
9
adsorption which is generally used to immobilize capture antibodies in ELISAs. The
advantage of this type of immobilization is that it is very easy to perform because it does
not require any linkers and modification of the protein for its attachment to the surface
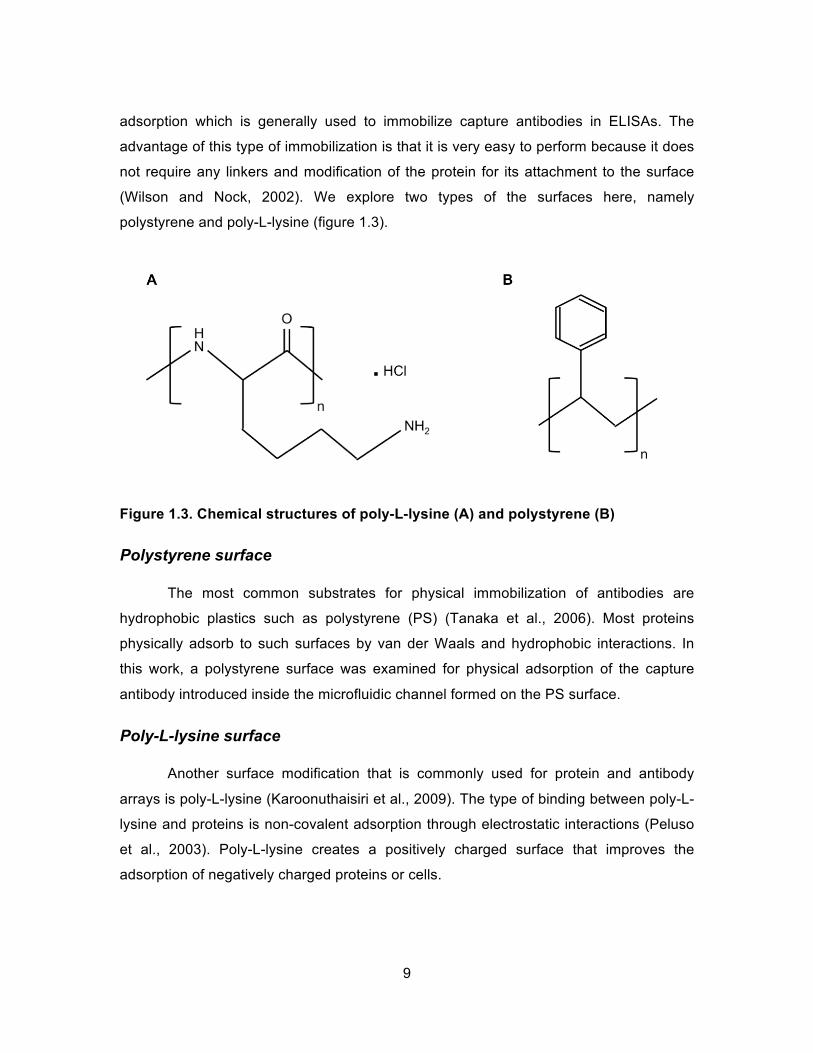
(Wilson and Nock, 2002). We explore two types of the surfaces here, namely
polystyrene and poly-L-lysine (figure 1.3).
Figure 1.3. Chemical structures of poly-L-lysine (A) and polystyrene (B)
Polystyrene surface
The most common substrates for physical immobilization of antibodies are
hydrophobic plastics such as polystyrene (PS) (Tanaka et al., 2006). Most proteins
physically adsorb to such surfaces by van der Waals and hydrophobic interactions. In
this work, a polystyrene surface was examined for physical adsorption of the capture
antibody introduced inside the microfluidic channel formed on the PS surface.
Poly-L-lysine surface
Another surface modification that is commonly used for protein and antibody
arrays is poly-L-lysine (Karoonuthaisiri et al., 2009). The type of binding between poly-L-
lysine and proteins is non-covalent adsorption through electrostatic interactions (Peluso
et al., 2003). Poly-L-lysine creates a positively charged surface that improves the
adsorption of negatively charged proteins or cells.

10
Although non-covalent adsorption of the capture antibodies onto a surface (e.g.
polystyrene, or poly-L-lysine coated glass) is simple and straightforward, for many
applications this immobilization method has its disadvantages. Firstly, when the
concentration of immobilized antibodies is too low, physical immobilization fails to form a
densely packed layer of antibody coating on the surface. Secondly, the physical and
non-covalent protein adsorption onto surfaces is mainly heterogeneous. Therefore,
immobilized proteins cluster together in patches, instead of creating a uniform layer
(Jenkins and Pennington, 2001). Thirdly, the chance of antibody denaturation on these
surfaces is higher. Lastly, due to the reversible nature of non-covalent attachment,
desorption of bound antibodies may occur while in contact with solution, leading to the
instability of the adsorbed surfaces (Wen et al., 2009).
1.4.2. Chemical immobilization of antibodies
As an alternative for physical adsorption of antibodies on the chip surface, these
proteins can be covalently bound to chemically functionalized surfaces. The advantage
of this method over physical immobilization of antibodies is that, in this method a number
of strong bonds are formed between the antibody and surface, except in the area close
to the contact point, leaving the protein largely unaltered (Wilson and Nock, 2002).
Moreover, chemically functionalized surfaces result in lower detection limits compared to
surfaces that utilize physical adsorption of antibodies (Angenendt et al., 2003). Another
factor that is important in choosing the proper surface for antibody microarray is having
minimal background while maintaining a high signal. Microarray surfaces used for
chemical immobilization of antibodies result in lower backgrounds, and therefore are
more favorable (Olle et al., 2005).
Different surface with a variety of modifications are commercially available today,
which use different binding chemistries depending on the amino acids that are present in
the antibody. A number of these methods are summarized by Rusmini et al. and are
shown in table 1.2 (Rusmini et al., 2007).

11
Table 1.2. Surface modifications for protein immobilization (Rusmini et al., 2007)
Side group Amino Acid bound Surfaces -NH2 Lys, hydroxyl-Lys Carboxylic acid
Active ester (NHS) Epoxy Aldehyde
-SH Cys Maleimide Pyridyl disulfide Vinyl sulfone
-COOH Asp, Glu Amine -OH Ser, Thr Epoxy
Surface modifications that have been used for covalent immobilization of
antibodies mainly include amine-reactive surfaces, which modify lysine side chains (Zhu
et al., 2000) and aldehyde-reactive surfaces, which react with oxidized glycoproteins
(Arenkov et al., 2000). In this thesis, we used an aldehyde-functionalized surface to bind
to the amino acid lysine on the antibody and immobilize antibodies on the microfluidic
chip (see figure 1.4).
Glutaraldehyde surface
In this work, we studied the immobilization of antibodies through covalent
bonding between amine group on the antibody and the glutaraldehyde groups on the
glass surface.
Glass slides modified with aldehyde groups (see section 2.3.3) are widely used
for protein and antibody arrays since they are easy to prepare and handle, and have
long shelf life (Tam et al., 2002). As shown in figure 1.4 the chemistry of antibody
immobilization on the functionalized glass slide involves formation of a Schiff linkage.
This linkage is the formation of a double bond between nitrogen from primary amine
groups found on lysine on the antibody, and carbon from aldehyde groups on the
surface.

12
Figure 1.4. Chemistry of antibody immobilization on glutaraldehyde surface
1.5. The effect of increased surface area in antibody immobilization
In a typical antibody bioarray, antibodies are immobilized onto a two-dimensional
(2D) substrate of glass slides, silicon wafers, or gold films through either non-specific
adsorption or covalent bonding. The problem with 2D substrates is that they have a
limited surface area. One approach to overcome this disadvantage for antibody
patterning is the use of nanostructures that provide a 3D matrix. This can offer larger
surface areas for biomolecular immobilization(Liu et al., 2016). Metal oxides such as zinc
oxide nanostructures can be used for this purpose.
Porous nanostructures of metal oxide coatings have been attracting considerable
attention in the past decade due to their technological application (Topoglidis et al.,
2001). Some of the properties that make metal oxides interesting for such applications
are their high surface area, optical transparency, non-toxicity, ease of fabrication, and
chemical stability (Narahari et al., 2001).
Recently, nanostructures of ZnO have demonstrated a potential for protein
immobilization. This fact makes them favourable for development of optical and
electrochemical biosensors (Hatamie et al., 2015) (Kang et al., 2016). Various types of
ZnO nanostructure (such as nanorods, or nanowires) have been synthesized on the
glass surface, and some have been evaluated for protein immobilization. Liu et al.
reported development of a protein microarray on ZnO nanomulberry surface to detect
carcinoembryonic antigen (CEA), having a detection limit of 1 pgmL-1.

13
Several techniques are reported with regard to synthesis of ZnO nanostructures.
A short summary of them is listed in the next section.
1.5.1. Zinc oxide nanostructures synthesis
Zinc oxide nanostructures can be either grown independently or grown on certain
substrates. The synthesis methods of ZnO can be achieved in the vapour phase and
solution phase.
The vapor phase synthesis
The vapor phase synthesis is a method that takes place in a closed chamber.
Generally, the vapor phase synthesis process is carried out at higher temperatures (500-
1500°C) and produce high-quality nanostructures. Two of the commonly used vapor
phase methods for synthesis of ZnO nanoparticles are vapor-liquid-solid (VLS) and
metal organic chemical vapor deposition (MOCVD).
In VLS, vapor species are first produced by evaporation, chemical reduction,
and gaseous reaction. After that, the species are transferred and condensed onto the
surface of solid substrate. In VLS, the gaseous reactants interact with the nano-sized
liquid metal droplets (as catalysts) to facilitate the nucleation and growth of crystalline
ZnO nanostructures under the metal catalyst. The metal catalysts commonly used are
Au, Cu, Ni, and Sn. This method has been used to grow ZnO on a variety of surfaces
(e.g. sapphire, AlGaN). Several factors such as chamber pressure, and oxygen partial
pressure can affect the quality of the product (Suh et al., 2010).
The solution phase synthesis
Solution phase synthesis has many advantages over vapor phase synthesis,
such as low cost, low temperature, scalability, and ease of handling. Generally, solution
phase reactions occur at relatively low temperatures (below 200°C). Therefore, they
allow for greater choice of substrates. Due to many advantages, solution phase
synthesis methods attract increasing interest (Zhang et al., 2012)

14
Hydrothermal synthesis of ZnO is the most common solution-based synthesis of
ZnO nanoparticles (Kim et al., 2011). In this work, growth of ZnO nanostructures takes
place in an aqueous solution (growth solution) containing zinc nitrate hexahydrate and
hexamethylenetetramine (HMTA). The chemical equations for describing the formation
of ZnO nanostructures are provided as follows (Sugunan et al., 2006, Baruah and Dutta,
2009).
[Zn(H2O)6]2+ + H2O [Zn(H2O)5OH]+ + H3O+
[Zn(H2O)5OH]+ + H2O Zn(OH)2(s) + H3O+ + 4H2O
Zn(OH)2(s) à ZnO(s) + H2O
Meanwhile, the above two hydrolysis equilibria of Zn2+(aq) will shift to the right if
H3O+ is removed by the simultaneous protonation of a base. The base can be the
hexamethylenetetramine (HMTA), or (CH2)6N4, itself or the ammonia groups coming
from the decomposition of HMTA:
(CH2)6N4 + H3O+ à [(CH2)6N4]H+ + H2O
or
(CH2)6N4 + 6H2O à 6HCHO + 4NH3
NH3 + H3O+ à NH4+ + H2O
These equations provide the basis for describing the solution-phase formation of
the ZnO nanostructure.

15
1.6. Strategies for well-oriented immobilization of antibodies
Random immobilization of antibodies on the microarray surface does not allow
for a good control of the orientation of immobilized molecules (Kausaite-Minkstimiene et
al., 2010). Different possible orientations are shown in figure 1.5 (Schramm et al., 1993).
Figure 1.5. (A) structure of antibody showing the fragment antigen-binding (Fab),
fragment crystallizable (Fc), heavy and light chains. (B) Three orientations of antibody immobilized on a solid surface with Fc region on the surface, sideway immobilization, and Fab regions on the surface.
It is important to immobilize the antibodies on the surface in a well-oriented
manner so that the antigen-binding regions (Fab) are easily accessible for the target
protein to bind. Two methods are suggested in the literature for well-oriented
immobilization of antibodies: DNA-directed antibody immobilization, and the use of
antibody-binding proteins (Jung et al., 2008). The schematic diagram of these methods
is shown in figure 1.6.
In DNA-directed antibody immobilization (Bailey et al., 2007), single-stranded
DNA-antibody conjugates are immobilized onto a surface of complementary DNA
strands via DNA hybridization. Boozer et al. have used this immobilization technique and
showed a detection limit improvement from 5 ng mL-1 to 0.1 ng mL-1 for detection of
human chorionic gonadotropin (Boozer et al., 2006).
This method, however, is inconvenient since there should be a prior step for
antibody-DNA conjugation. Therefore, the other method, which was antibody-binding
proteins, was investigated for the work in this thesis.

16
Figure 1.6. Methods for well-oriented immobilization of antibodies: DNA-directed
antibody immobilization (A), and the use of antibody-binding proteins such as protein A and protein G (B)
One of the best ways to achieve well-oriented immobilization of antibody
molecules is their immobilization on a sub-layer of antibody-binding proteins consisting
of Fc-binding receptors, which specifically bind the Fc-part of antibody molecules
(Kausaite-Minkstimiene et al., 2010). Protein G and protein A are cell surface proteins
and they are found in most species of Streptococcus and Staphylococcus aureus. These
proteins are most extensively studied as antibody-binding proteins, since they
specifically interact with the Fc-part of an antibody that belongs to a class of
immunoglobulins G (IgG) (Boyle and Reis, 1987) (Bae et al., 2005) (Kausaite-
Minkstimiene et al., 2010). After this interaction the antigen-binding regions (Fab) of the
antibody are favorably located outwards and ready to bind to target proteins. Therefore,
protein G and protein A-based antibody immobilization leads to highly efficient
immunosensors.
It has been determined that the capacity of protein G and protein A for binding to
IgG antibody depends on the species from which the IgG is raised. In general, IgG
molecules have a higher affinity for protein G than for protein A. Moreover, protein G can
bind to IgG molecules raised from a much wider variety of species (Kausaite-
Minkstimiene et al., 2010).
1.7. Detection techniques in antibody arrays
Two types of methods are available for detection of antibody bioarrays: Label-
free detection and label-dependent detection.
17
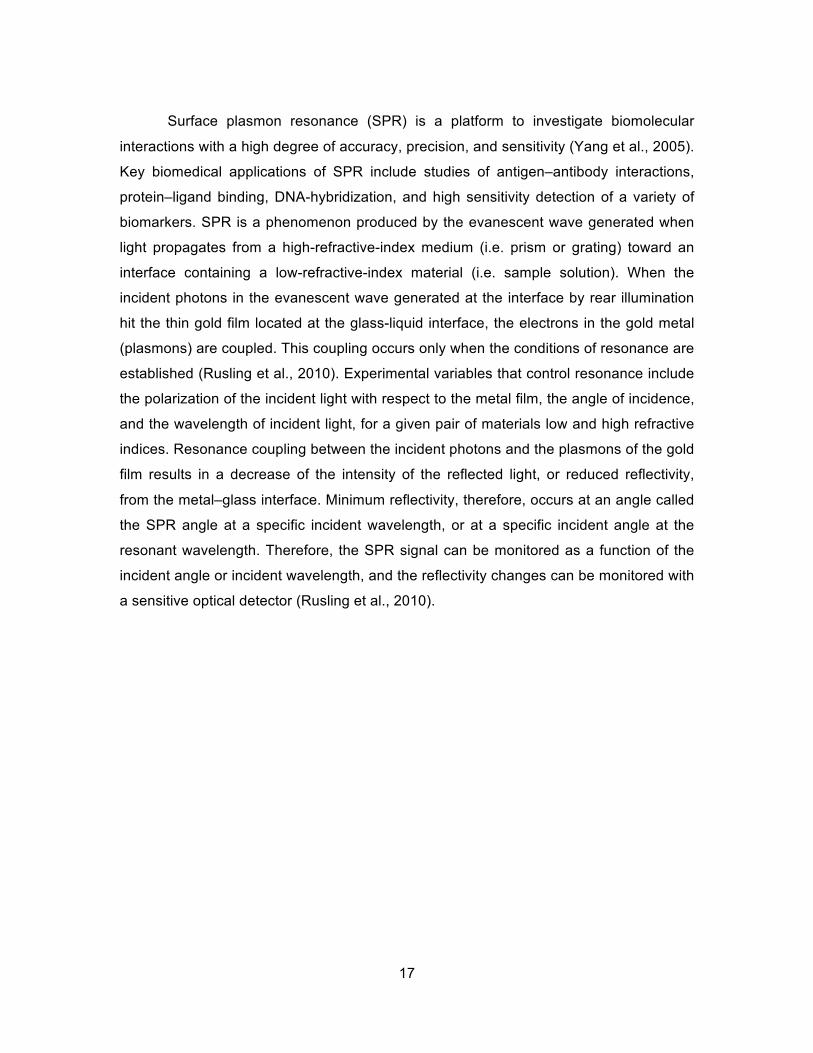
Surface plasmon resonance (SPR) is a platform to investigate biomolecular
interactions with a high degree of accuracy, precision, and sensitivity (Yang et al., 2005).
Key biomedical applications of SPR include studies of antigen–antibody interactions,
protein–ligand binding, DNA-hybridization, and high sensitivity detection of a variety of
biomarkers. SPR is a phenomenon produced by the evanescent wave generated when
light propagates from a high-refractive-index medium (i.e. prism or grating) toward an
interface containing a low-refractive-index material (i.e. sample solution). When the
incident photons in the evanescent wave generated at the interface by rear illumination
hit the thin gold film located at the glass-liquid interface, the electrons in the gold metal
(plasmons) are coupled. This coupling occurs only when the conditions of resonance are
established (Rusling et al., 2010). Experimental variables that control resonance include
the polarization of the incident light with respect to the metal film, the angle of incidence,
and the wavelength of incident light, for a given pair of materials low and high refractive
indices. Resonance coupling between the incident photons and the plasmons of the gold
film results in a decrease of the intensity of the reflected light, or reduced reflectivity,
from the metal–glass interface. Minimum reflectivity, therefore, occurs at an angle called
the SPR angle at a specific incident wavelength, or at a specific incident angle at the
resonant wavelength. Therefore, the SPR signal can be monitored as a function of the
incident angle or incident wavelength, and the reflectivity changes can be monitored with
a sensitive optical detector (Rusling et al., 2010).

18
Figure 1.7. Schematic diagram of Surface Plasmon Resonance. The image is not
drawn to scale.
When biomolecules bind to the external surface of the metal film, the resulting
change in the dielectric properties of the medium adjacent to the metal film results in
changes in the resonance conditions, and hence, modulates the intensity of the reflected
light (fig. 1.7). Thus, SPR can serve as a label-free detection technique to monitor the
refractive index changes of the medium adjacent to the metal film brought about by a
variety of events(Vashist et al., 2015). The SPR signal is extremely sensitive to the
dielectric constant as well as the mass of the material in contact with the gold film. For
example, binding of a ligand to a receptor attached to the metal surface will change the
intensity of the reflected light, and hence, generate an SPR signal that can be monitored
in real time. Kinetics of biomolecular interactions or concentrations of specific analytes
such as proteins that bind to molecules attached to the sensor surface can be monitored
during the SPR experiment. This method has been previously reported for kinetic
analysis of DNA hybridization by our research group (Sedighi et al., 2014, Sedighi et al.,
2015).
Label-free methods are advantageous since they eliminate the chance of
affecting protein activity due to labeling. Moreover, real-time measurements of protein
interactions are possible with these techniques (Sutandy et al., 2013). However, due to
the higher cost of such label-free methods, label-dependent techniques are still widely
used in antibody bioarrays.

19
Antibody bioarrays utilizing label-dependent detection methods are based on
tags that produce a measurable signal. The signal can be chemiluminescence (Wang et
al., 2012), fluorescence (Jenko et al., 2014), electrochemical (Fragoso et al., 2011) in
nature. This detection process can be achieved by either direct or indirect labeling of
biomolecules. For instance, in a sandwich ELISA system, the detection antibody can be
directly labeled with a fluorescence tag. On the other hand, the detection antibody can
be tagged with biotin, which then binds to a labeled-agent such as fluorescently labeled
streptavidin as indirect labeling. Enzymatic methods and fluorescence detection are
described in more detail below.
Enzymatic methods offer high sensitivity in signal detection, due to the
advantage of chemical amplification. In these methods, an enzyme catalyzes the
reaction of substrates (e.g. luminol) to produce chemiluminescent molecules. The most
commonly used enzyme is horseradish peroxidase (HRP). In a commercially available
sandwich ELISA kit, HRP is directly tagged to the detection antibody, or as a
streptavidin-HRP complex which binds to the biotin-labeled detection antibody. Luminol
generates the chemiluminescent product in solution, and so it should be confined in
microwells for detection. The issue with chemiluminescence detection is the short
lifetime of the reaction. Therefore, the detection must take place shortly after the
introduction of the substrate.
Fluorescence detection usually utilizes fluorescence dyes with narrow excitation
and emission spectra, such as cyanine dyes (Cy3 and Cy5). These dyes also provide a
wide linear detection range compared to other labeling systems (Hall et al., 2007b).
Although this method does not have sensitivity as high as chemiluminescence (due to
lack of chemical amplification), it has a potential for signal enhancement by increasing
the number of fluorescent tags per detection antibody. Since fluorescence detection can
be conveniently used in high throughput designs, we adopted it as our detection method.
1.8. Importance of interleukins
Interleukins are a sub-group of cytokines, which are low-molecular-weight
proteins produced by many different types of cells (Stenken and Poschenrieder, 2015).
20
Cytokines play critical roles in a wide range of physiological processes such as immune
response, inflammation, cell growth and differentiation. Data from clinical studies
strongly suggest the involvement of cytokines in the development of many common
diseases, particularly cancer(Rusling et al., 2010). Due to these roles of cytokines, there
is enormous clinical interest in the quantitation of these molecules in biological fluids.
Also, it is important that we can detect multiple cytokines simultaneously for biological
studies.
Interleukins (ILs) are a large group of cytokines (IL-1 to IL-35), that are mainly
produced by leukocytes (or white blood cells), although some of them are made by
auxiliary cells or polymorphonuclear phagocytes. Interleukins have a variety of functions,
including involvement in cell communication and proliferation. Each interleukin acts on a
specific, limited group of cells that express a certain receptor for that interleukin(Mizel,
1989).
ELISA is the most common method used to measure interleukins expression
levels due to its high specificity and sensitivity. Although this methodology is well-studied
for single interleukin analysis, it suffers from difficulties such as limitations in analysis
time, sample size, equipment cost, and measuring a collection of many proteins(Rusling
et al., 2010). It is desirable to simultaneously measure multiple interleukins from a
relatively small sample size in a rapid fashion. This is particularly important in drug
discovery. Among the methods that have been developed for detection of multiple
interleukins, the use of antibody arrays and aptamer arrays are among the most
promising ones(Liu et al., 2015)(Huang et al., 2005).
The analyte proteins that we have studied for our research are interleukin-2 (IL-2)
and interleukin-6 (IL-6). These two interleukins were selected due to their potential
diagnostic values as biomarkers, and their roles in a variety of diseases such as
tuberculosis (Sargentini et al., 2009) for IL-2, rheumatoid arthritis (Nishina et al., 2013)
for IL-6.

21
1.8.1. Biological role of interleukin-2
In 1976, Morgan et al. made the important observation that conditioned medium
from stimulated human T cells contained a factor that allowed normal T cells to
continuously proliferate for an indefinite period in vitro(Mizel, 1989). Although the factor,
now called IL-2, was not characterized biochemically, the findings of Morgan et al.
started a new era in the study of T cell biology. IL-2 is a 15.5-kDa protein, produced
mainly by helper T cells following stimulation by either T cell mitogens or allogeneic
cells. IL-2 is also produced and secreted following specific antigen stimulation(Farrar et
al., 1982). IL-2 has been shown to augment the proliferation and generation of cytotoxic
cells by antigen-stimulated T cell populations, and in this process induces the synthesis
of immune interferon by the antigen-stimulated T cells(Farrar et al., 1982).
1.8.2. Biological role of interleukin-6
As with several of the interleukins, IL-6 has a broad spectrum of cell targets, and
thus can influence an equally broad range of immune and inflammatory responses in
vitro and possibly in vivo. IL-6 is a protein of 23-30 kDa that is produced by a wide
variety of cells, including fibroblasts, macrophages, T cells and B cells(Mizel, 1989). IL-6
belongs to a group of cytokines called IL-6-type cytokines. This group of cytokines
utilizes tyrosine kinases of the Jak family and transcription factors of the STAT family as
major mediators of signal transduction, a feature that is shared with the interferons and
many other cytokines and growth factors(Heinrich et al., 1998).
The receptors involved in IL-6-type cytokine signalling, which are type I
membrane proteins (extracellular N-terminus, one transmembrane domain), belong to
the cytokine receptor class I family. This receptor family is defined by the presence of at
least one cytokine-binding module. All these receptors contain an IgG-like domain
located either at the N-terminus, or between the two cytokine-binding modules(Heinrich
et al., 1998).
In IL-6 receptor (or IL-6R), since the IgG-like domain of IL-6R is dispensable for
biological activity, the residues crucial for ligand binding are located in the cytokine-
binding module (CBM). Mainly, residues in the loops near the hinge region between the

22
two domains of CBM are involved in recognition of the IL-6 ligand. The cell signalling will
occur after IL-6 binds to IL-6R (Mihara et al., 2012).
1.9. Thesis objectives
Proper strategies for antibody immobilization vary from one assay to another,
and they are initially determined by the type of the assay, and by the solid substrate
used for the system (Jung et al., 2008). The selection of the optimal solid support for
each assay is also a key step in successful development of protein and antibody arrays
(Angenendt et al., 2002). Moreover, the best method of antibody immobilization depends
on the demand from assays (such as sensitivity, signal consistency, and cost).
Therefore, there is a need to study the factors affecting the immobilization process of
capture antibody molecules on the surface, and to understand how they influence the
final result in the microarray experiment.
The measured signal in these studies is the fluorescence signal intensity
obtained from a sandwich antibody bioarray. The thesis objectives are to examine the
fluorescence signal intensity resulted from different antibody immobilization methods
inside a microfluidic channel, and to measure the fold-increase in fluorescence signal
intensity obtained from various signal amplification strategies.
Factors including surface modification of the antibody bioarray, orientation of the
immobilized antibody, relative probe density (amount of immobilized antibody) in the
presence and absence of zinc oxide nanostructures, as well as the effect of antigen
incubation time and multiple stop-flow sample introduction were studied; and, the fold-
increase in fluorescence signal intensity achieved from each one of these optimizations
was measured.
The antibody bioarray system was based on the intersection approach. In this
method, horizontal probe lines are immobilized on the chip surface, and then the probes
react to samples that are introduced in vertical channels. Since the sandwich antibody
bioarray method that we aimed to use for detection of interleukins was complex and it
involved multiple steps, the initial studies were performed on less complicated systems

23
such as direct detection of immobilized peptides or antibodies. Then, the sandwich
antibody detection method was performed on the chip operated at optimized conditions.
24
Chapter 2. Experimental Section
In this chapter, the experimental methods used in this thesis are described. The
methods involved in antibody bioarrays such as microchip fabrication, functionalization
of glass surface, peptide and antibody immobilization, sandwich detection method, and
fluorescence detection are provided in detail.
2.1. Materials and Instruments
2.1.1. Materials and reagents
The negative photoresist SU-8 50 and SU-8 developer were purchased from
MicroChem Corp (Newton, MA, USA). Circular silicon wafers (4-inch diameter) were
obtained from Cemat Silicon SA (Warsaw, Poland). SYLGARD 184 silicone elastomer kit
and silicone sealant 732 were provided by Dow Corning Corp. (Midland, MI). The
channel pattern for photomask was designed by Dr. Abootaleb Sedighi using either
Visual Basic or L-Edit software. Dimethyldichlorosilane solution 2% in
octamethylcyclotetrasiloxane (Repel silane) was obtained from GE Healthcare (Uppsala,
Sweden). Rectangular microscope slides (3 × 2 inch) were obtained from Precision
Glass & Optics (Santa Ana, CA, USA). A polystyrene petri dish cover was used as the
polystyrene surface for our experiments.
The peptides (HA and BioHA) were obtained from GL Biochem (Shanghai). The
antiHA and BioIgG antibodies were obtained from Invitrogen (Burlington, ON). The IL-2
and IL-6 ELISA kits were obtained from eBioSciences (SanDiego, CA, US).
The solutions used in this work were prepared as follows:

25
• Piranha solution: sulfuric acid (98%) was mixed with hydrogen peroxide (30%) in a 7:3 ratio.
• Sparkleen detergent: 10% w/v of Sparkleen powder was dissolved in DI water in a wash bottle.
• Chip clean solution: The concentrated Liqui-Nox (Alconox, White Plains, NY) was diluted in 10 volumes of deionized (DI) water (18 MΩ cm-1).
• APTES solution: 2% v/v of 3-aminopropyltriethoxysilane (APTES) obtained from Sigma-Aldrich (Oakville, ON, Canada) was prepared in anhydrous ethanol.
• Phosphate buffer saline (PBS) 20X: 60.00 g NaCl (≥99.0%), 2.00 g KCl (≥99.0%), 14.4 g Na2HPO4 (99.95%) and 2.4 g KH2PO4 (≥99.0%) were dissolved in 500 mL of DI water.
• 5% Glutaraldehyde solution: 20 mL glutaraldehyde (25% in H2O, Grade I) obtained from Sigma-Aldrich (Oakville, ON, Canada), 5 mL PBS 20X and 75 mL of DI water were mixed.
• Poly-L-lysine coating solution: 1 mL of the Poly-L-Lysine solution obtained from Sigma-Aldrich (Oakville, ON, Canada) was diluted in 10 mL of DI water as manufacturer’s protocol for coating glass slides.
• Tween-PBS (TPBS) wash solution: 0.05% v/v of Tween-20 was dissolved in 1X PBS.
• Blocking solution: 20 mg of bovine serum albumin (≥98.0%, Sigma-Aldrich, Oakville, ON, Canada) was dissolved in 20 mL 1X PBS solution, used for blocking nonspecific binding.
• Anti IL-2 capture antibody solution: The concentration of stock solution provided in the ELISA kit was 500 µg/mL. This antibody was used at this concentration, unless stated otherwise.
• Anti-IL-2 detection antibody solution: The concentration of stock solution provided in the ELISA kit was 15 µg/mL. This antibody was used at this concentration for all experiments.
• Anti IL-6 capture antibody solution: The concentration of stock solution provided in the ELISA kit was 125 µg/mL. This antibody was used at this concentration, unless stated otherwise.

26
• Anti-IL-6 detection antibody solution: The concentration of stock solution provided in the ELISA kit was 15 µg/mL. This antibody was used at this concentration for all experiments.
• Target Interleukin-2 (IL-2) solutions: The stock concentration of standard IL-2 target solution provided in ELISA kit was 1 µg/mL. This solution was diluted in 1X PBS to prepare a concentration range.
• Target Interleukin-6 (IL-6) solutions: Lyophilized human IL-6 standard form eBioscience was diluted in 0.5 mL DI water to produce 30 ng/mL solutions. Further dilutions were done in 1X PBS.
• SA/Cy5 solution (50 µg/mL): 5 µL of streptavidin-Cy5 stock solution (1 mg/L) (Life Technologies, Burlington, ON, Canada) was mixed with 95 µL of TPBS (0.05%) solution.
• Zinc acetate (99.999%) powder was from Sigma-Aldrich (Oakville, ON, Canada).
• Zinc nitrate hexahydrate (99.999%) was purchased from Sigma-Aldrich (Oakville, ON, Canada).
• Hexamethylene tetramine (>99.0%) was purchased from Sigma-Aldrich (Oakville, ON, Canada).
2.1.2. Instruments
• The fluorescence signals were obtained using a confocal fluorescence scanner called Typhoon Trio+ instrument (GE Healthcare). In all the reported fluorescence signal intensities in this work, the background signal is subtracted and corrected fluorescence signal is reported.
• The SPR measurements were performed using a BIAcore X100 instrument (GE Healthcare).
2.2. Fabrication of PDMS microchips
In the early years, microfluidic devices were mostly constructed by materials
such as glass, quartz and silicon. Although these materials offer facile surface
chemistries, their physical rigidities limit the required operations for fabrication of
microstructures (Becker and Gärtner, 2008). Polymeric materials, on the other hand, are
widely selected for the use in microfluidic devices because they offer the versatile and

27
cost-effective materials for fabrication, which are useful in disposable microfluidic
devices as demanded for bio-diagnostic applications (Becker and Gärtner, 2008).
Polydimethylsiloxane (PDMS) is widely used in microfluidic devices. This flexible and
hydrophobic polymer can be reversibly sealed to a solid substrate. Moreover, PDMS
slabs can be sealed irreversibly on a variety of substrates including glass, silicon, metal,
fluorocarbon and polycarbonate substrates (Fujii, 2002). Furthermore, the non-toxicity of
PDMS favours its applications in biology and its optical transparency and chemical
inertness suit the fabrication of lab-on-a-chip devices.
In this research, we use a photolithographic technique to prepare a master mold
containing the relief structures. The mold is fabricated on SU-8 spin-coated on a silicon
substrate. Afterwards, the structures formed on the master mold are transferred to
PDMS microchips using the soft lithographic technique.
The diagram in figure 2.1 shows different steps of fabrication of a PDMS
microchip. The detailed procedure as follows:
1. Piranha solution cleaning: A silicon wafer was placed inside a Pyrex dish (500 mL) in the fume hood and 100 mL of piranha solution was added to the dish. The dish was incubated at 80 °C on a hot plate for 15 min. After incubation the wafer was removed from the dish and was rinsed in turn with water, ethanol (95%) and water, and was finally dried by nitrogen gas.
2. Spin coating: The centre of the silicon wafer was adjusted on the stage of the spin coater and then ~3 mL of SU-8 50 (photoresist) was poured on the centre of the wafer. In order to achieve the film thickness of 35 µm, the spin rates of first 500 rpm for 5 s, and then 3000 rpm for 30 s were applied (Wang and Li, 2007).
3. Soft bake: After spin-coating, the wafer was baked at 65 °C for 5 min. to remove the solvent of the photoresist.
4. UV exposure: the channel pattern was created on the coated wafer by first covering the wafer with a photomask, and then exposing the wafer to UV radiation for 5 s. The photomask is shown in Figure 2.2 (a).
5. Post-exposure or hard bake: After UV exposure, the wafer was baked at 95 °C for 3 min. to complete cross-linking of the exposed SU-8 polymer.

28
6. SU-8 development: 20 mL of SU-8 developer solution was added to the wafer in a Pyrex dish to dissolve and remove the SU-8 regions that were not cross-linked. The solution was swirled for 10 min. at room temperature. Then, the wafer was dried by nitrogen gas (Figure 2.2 (b)).
7. Formation of border for casting: A circular border was created near the perimeter the wafer to retain PDMS during casting. This was achieved with silicone sealant 732 and the wafer was left for one day at room temperature for curing of the silicone sealant.
8. PDMS casting and cure: a mixture of PDMS elastomer base and curing agent (10:1 ratio) was prepared and was kept in -20 °C for 1 h in order to remove any air bubbles. Before casting, the surface of master mold was rinsed with Nox solution and treated with repel silane (dichloro dimethyl silane, a release agent) and was left to dry for 5-10 min. Next, the PDMS mix was poured on the wafer until a layer with 2 mm thickness was attained and the elastomer was left to cure at room temperature for one day.
9. PDMS peel off, trim and hole-punch: The edges of the PDMS chip were cut using a knife blade and then the chip was gently peeled off from the master mold surface. The chip reservoirs were made using a 1.5 mm diameter hole-punch (a sharpened gauge 18 needle tip). Finally, the PDMS chip was washed with Nox solution and was dried by nitrogen gas (Figure 2.2 (c)).
Figure 2.1. Fabrication of mastermold and PDMS slab

29
Figure 2.2. Transfer of PDMS channel slab from photomask (A) to master mold (B)
and then to PDMS slab (C). The The PPMS chip size is 2.5 inch2 and channels dimensions in this PDMS chip are 150 µm wide and 35 µm deep.
The PDMS slab is then reversibly sealed to the surface of a glass slide.
2.3. Surface modification methods
Different surface modifications were compared in order to find the optimal
conditions for antibody immobilization, as discussed in subsequent sections.
2.3.1. Polystyrene
The polystyrene sheet (Perti dish cover) was cleaned by washing with Nox
solution, and 75% ethanol, and DI water. Without further modifications, the PDMS slab
was then reversibly sealed on this sheet to form microchannels.
2.3.2. Poly-L-lysine surface
Poly-L-Lysine (PLL) surface was created by coating a layer of this liquid polymer
on a microscope glass slide as instructed by the manufacturer. The coating procedure is
described below:
1. Slide cleaning: The glass slide was washed with Sparkleen solution and rinsed with DI water. The slide was put inside a Pyrex dish and 100 mL of piranha solution (H2SO4/H2O2) was poured on the slide. The dish was placed on a hot plate at 80 °C for 15 min. Afterwards, the slide was

30
removed, rinsed with DI water, ethanol (95%) and DI water and, finally, dried by nitrogen gas.
2. Poly-L-lysine coating: The clean glass slide was placed in a plastic container containing 50 mL of freshly made Poly-L-lysine (PLL) solution (10% v/v in DI water) for 10 min. The polymer was physically adsorbed on the glass surface during this process.
3. The glass slide was then placed in the oven at 60°C for 1 hour. Then, the slide was removed from the oven, washed with DI water, and dried by nitrogen gas. Although the manufacturer suggests that the glass slide can be stored at 4°C for a week, in all the experiments PLL surface was freshly made prior to use.
2.3.3. Glutaraldehyde surface
The surface of glass chip was modified to generate aldehyde groups. As shown
in figure 2.3, this process involves three steps, which are optimized by Dr. Lin Wang, a
previous PhD student in our group (Wang, 2012). The details of the optimization process
can be found in Dr. Lin Wang’s PhD thesis. The summary of the steps is described
below:
1. Slide cleaning: The glass slide was washed with Sparkleen solution and rinsed with water. The slide was put inside a Pyrex dish and 100 mL of piranha solution (H2SO4/H2O2) was poured on the slides to activate silanol groups. The dish was placed on a hot plate at 80 °C for 15 min. Afterwards, the slide was removed, rinsed with DI water, ethanol (95%) and DI water and, finally, dried by nitrogen gas.
2. APTES functionalization: 100 mL of 3-aminopropyltriethoxysilane (APTES) solution was added to the slide in the Pyrex dish and the solution was purged with nitrogen gas to remove oxygen. The dish was sealed by Parafilm and incubated at room temperature for 20 min. The dish was swirled manually once every minute. Then it was removed, rinsed with 95% ethanol, dried by nitrogen gas and incubated in the oven for 1 h at 120 °C.
3. Aldehyde functionalization: 100 mL of 5% glutaraldehyde solution was added to the glass slide in the Pyrex dish. The dish was sealed with a glass lid and placed in the fridge for 1 h. Then, the slide was removed from the fridge, washed with DI water, and dried by nitrogen gas.

31
Figure 2.3. Preparation of aldehyde-functionalized glass chip: The steps 1, 2 and 3
show piranha cleaning, APTES functionalization and glutaraldehyde (GA) functionalization, respectively.
2.3.4. Synthesis of zinc oxide nanostructures on the chip
In order to increase the surface area of binding on the glass slide, and create
more binding sites for the capture antibody, zinc oxide (ZnO) nanostructures were
synthesized on glass slide, and then the surface was functionalized with aldehyde
groups. The synthesis of ZnO nanostructures consists of two major steps: seeding step,
and growth step.
Seeding step
The seeding step involved coating the glass slide with a layer of ZnO in order to
create a more uniform surface of ZnO nanostructures in the growth step. The process is
described below:
1. Slide cleaning: The glass slide was washed with Sparkleen solution and rinsed with DI water. The slide was put inside a Pyrex dish and 100 mL of piranha solution (H2SO4/H2O2) was poured on the slide. The dish was placed on a hot plate at 80 °C for 15 min. Afterwards, the slide was removed, rinsed with DI water, ethanol (95%) and DI water and, finally, dried by nitrogen gas.
2. Coating step: The glass slide was soaked in an aqueous solution of zinc acetate (5 mM) for 1 min, and then removed. The glass slide was then placed in a covered Pyrex dish, and heated in the oven at 350°C for 10

32
min. for annealing purpose. This process was repeated 3 times (total of 30 min.) to create a ZnO seed layer on the glass surface.
3. The seeded glass slide is washed with DI water and dried by nitrogen gas.
Growth step
In the growth step, the glass slide was placed upside-down in a 15mM equimolar
solution of zinc nitrate hexahydrate, Zn(NO3)2.6H2O, and hexamethylene tetramine
(HMTA) at 90°C for 60 min to form ZnO nanostructures on the glass surface. This ZnO
glass slides were then functionalized with glutaraldehyde as described in section 2.3.3.
2.4. Peptide and antibody immobilization on microfluidic chip
The glass surface was first functionalized by either glutaraldehyde (GA), or
polystyrene (PS), or poly-L-lysine (PLL). Then, a PDMS channel slab was sealed on the
surface to form a microfluidic chip with sealed microchannels, and peptide and antibody
samples were immobilized in the microfluidic chip as described in the subsequent
sections.
2.4.1. Peptide immobilization
For tests on peptides using the direct detection method, we immobilized peptides, i.e.
HA and BioHA, on the chip surface. HA is derived from hemagglutinin, a glycoprotein
from influenza A virus; BioHA is HA labeled with biotin. The amino acid sequences of
these peptides, as previously described (Lee et al., 2012), were synthesized by GL
Biochem (Shanghai) Co., Ltd. and are shown in figure 2.4.

33
Figure 2.4. The amino acid sequence of peptide probes
These peptides were either immobilized through physical adsorption to the
surface (in case of PS and PLL), or immobilized on the GA surface by coupling primary
amine groups to the aldehyde groups on the surface of the chip.
The steps involved in immobilization and detection of these peptides are
summarized below:
1. After sealing the PDMS channel slab on the PLL, PS, or GA surface, we formed the microfluidic chip that consisted of microchannels. We applied 0.5 µL of the peptide solution inside the channels of the microfluidic chip for probe line printing.
2. The chip was incubated at room temperature for 30 min. Then the peptide solution was removed from channels by suction, and the channels were washed two times with TPBS buffer.
3. After printing the peptide probe lines on the surface, the PDMS channel slab was removed, and another PDMS channel slab was sealed on the surface perpendicular to the probe lines.
4. In the case of BioHA, a 50 µg/mL solution of Cy-5 conjugated streptavidin (SA/Cy5) was introduced to the channels. The presence of peptide was examined through binding of the biotin in BioHA with streptavidin in SA/Cy5 and detection of fluorescence signal.
5. To investigate immobilization of HA, an anti-HA antibody solution (500 µg/mL) was introduced to the channels.
6. After 15 min incubation, the channels were emptied, washed with TPBS buffer twice, and then a biotin-labeled secondary antibody (BioIgG) was introduced to the channels (6 µg/mL). This antibody binds to antiHA, which can be detected via binding of biotin in BioIgG to streptavidin in SA/Cy5.

34
2.4.2. Antibody immobilization
As a model antibody, anti-HA was immobilized on various surfaces of the
microfluidic chip for protein detection. The steps involved in immobilization and detection
of anti-HA are summarized below:
1. After sealing a PDMS channel slab on the PLL, PS, or GA surface, we formed the microfluidic chip that consisted of microchannels. We applied 0.5 µL of the antiHA antibody solution (500 µg/mL) inside channels of the microfluidic chip.
2. The system was incubated at room temperature for 60 min. Then the antibody solution was removed from channels by suction, and the channels were washed with TPBS buffer two times.
3. After printing the antibody probe lines on the surface, the PDMS channel slab was removed, and another PDMS channel slab was sealed on the surface perpendicular to the probe lines.
4. A biotin-labeled secondary antibody (BioIgG) was introduced to the channels (6 µg/mL). This antibody binds to antiHA. After 15 min incubation, the solution was removed and the channels were washed with TPBS buffer twice.
5. A 50 µg/mL solution of Cy-5 conjugated streptavidin (SA/Cy5) was introduced to the channels. The presence of antiHA was examined through binding of the biotin in BioIgG with SA and detection of fluorescence signal produced by Cy5.
2.5. Sandwich detection on the chip
Human interleukins are detected using the antibody bioarrays using the sandwich
detection method. The steps involved with sandwich detection on the microfluidic chip
were similar to conventional ELISA, and are summarized in the subsequent sections.
2.5.1. Probe immobilization
The probe immobilization step consisted of immobilizing either anti-IL-2 or anti-
IL-6 capture antibodies (CapAb) on the chip surface. This step involves a prior
immobilization of protein G as described in chapter 4. The details are given below:

35
1. The functionalized chip surface, either glutaraldehyde (GA), or polystyrene (PS), or poly-L-lysine (PLL), was first cleaned by DI water. Then, PDMS channel slab was sealed on the glass or PS surface to form a microfluidic chip.
2. A solution of protein G (an immunoglobulin-binding protein derived from cell wall of beta-hemolytic Streptococci) was introduced to the channels and incubated at room temperature for 30 min.
3. Then, the channels were emptied using suction, and washed with TPBS buffer twice.
4. Next, the capture antibody was introduced to the channels. The concentration for anti-IL-2 CapAb was 500 µg/mL, and for anti-IL-6 CapAb 125 µg/mL in all our experiments, unless stated otherwise. The CapAb solution was incubated on the chip for 60 min.
5. Finally, the antibody solution was removed from channels by suction, and the channels were washed with TPBS buffer two times.
2.5.2. Target binding
After the probe immobilization step, the PDMS slab was removed from the glass
surface. A second PDMS slab was sealed on the surface, perpendicular to the previous
position of the first PDMS slab. The steps involved in target binding are summarized
below:
1. The target protein (either IL-2 or IL-6) solutions were introduced to channels. The incubation time as well as incubation method (stop-flow vs. multiple stop-flow) were optimized as discussed in chapter 4.
2. After incubation, the channels were emptied and washed twice with TPBS buffer. Then the relevant biotin-labeled detection antibodies (15 µg/mL) were introduced to the channels and incubated for 30 min. Again, channels were emptied and washed after incubation.
3. Finally, a 50 µg/mL solution of Cy-5 conjugated streptavidin (SA/Cy5) was introduced to the channels. The presence of the sandwich complex was examined through binding of the biotin in biotin-labeled detection antibody with SA and detection of fluorescence signal produced by Cy5.

36
Chapter 3. Intersection approach in a microfluidic chip
As described in chapter 2, the microfluidic chip in this work consists of a PDMS
channel slab reversibly sealed to a microscope glass slide. The glass surface is usually
either modified by a coating (e.g. poly-L-lysine), or functionalized with different functional
groups (e.g. aldehyde) for immobilization of a specific type of target in the sample
solution. The microfluidic chip utilizes the intersection approach for peptide and protein
detection. As summarized in figure 3.1, the first step is immobilization of probes on the
microfluidic chip surface. First, PDMS slab 1 is sealed on the glass slide to create
horizontal channels. Then, probe reagents (antibody, or peptide) are filled in the
channels and immobilized on the surface (fig. 3.1 (A)). After incubation, solutions of
probe reagents are removed from channels through suction, and Tween20-PBS (TPBS)
is introduced to the channels as the wash buffer. Next, PDMS slab 1 is removed (fig. 3.1
(B)), and PDMS slab 2 is sealed on the glass slide in perpendicular to the previous
position of PDMS slab 1. Afterwards, in the target binding step, the solution containing
target molecules is introduced to the chip via vertical channels (fig. 3.1 (c)). At the
intersection of horizontal probe lines and vertical channels containing target molecules,
the binding occurs (red patches in figure 3.1 (C)). This is called intersection method for
detection. Following the incubation and wash steps, a detection agent is bound to the
target for the detection process. In this work, fluorescence detection is used and
therefore Cy5, a fluorescent dye, is used for fluorescence tagging of the probe-target
complex. Finally, PDMS chip 2 is removed (fig. 3.1 (D)) and the glass slide is scanned
using a fluorescence scanner.

37
Figure 3.1. Schematic of the intersection method: Probe immobilization involves
sealing PDMS slab 1 to glass slide and flowing probe solutions in channels (A). PDMS slab 1 is then removed (B). In the target binding step PDMS slab 2 is sealed on glass perpendicular to the previous position of PDMS chip 1, and target solution followed by detection reagent are introduced to channels (C). Finally PDMS slab 2 is removed (D) and glass slide is scanned using a fluorescence scanner.
Initial experiments on the microfluidic chip were performed to evaluate the
intersection method. For this purpose, a biotin-labeled peptide sample called BioHA
(see section 2.4.1) was detected using this system. Since this peptide is labeled with
biotin molecules, its presence can be detected using Cy5-conjugated streptavidin
(SA/Cy5).
The surface of the glass slide for initial experiments was functionalized with
aldehyde groups (see section 2.3.3). The BioHA peptide was immobilized through
horizontal channels, and SA/Cy5 flowed through vertical channels to detect BioHA.
HA was used as a negative control in this experiment; since HA is not biotin-
labeled, there should be no signal present for it. As shown in figure 3.2 below, the
presence of patches at the intersection between horizontal BioHA probe lines and
vertical channels filled with SA/Cy5 proved that the immobilization of peptide on the
aldehyde surface was successful.

38
Figure 3.2. Immobilization of peptide probes using the intersection method. The
patches (150 µm x 150 µm) created at the intersection of BioHA probe lines and vertical channels filled with streptavidin-Cy5 (SA/Cy5). Since HA does not have biotin, there is no signal associated with it at the intersections.
This chapter present the results of comparing three different surface
modifications for performing a four-step sandwich detection method (capture antibody
immobilization, protein analyte, detection antibody, and SA/Cy5) on the microfluidic chip.
First, each microfluidic chip surface was examined by probe-target systems that involve
fewer steps in their process, and therefore are less complicated than the sandwich
method (e.g. peptide immobilization, or antibody immobilization). Afterwards, multi-step
sandwich detection was performed on these surfaces.
3.1. Initial results on microfluidic chip: peptide and antibody immobilization
The procedures involved in peptide and antibody immobilization have been
described in section 2.4. Figure 3.3 is a cartoon representation of the probe-target
complexes (antibody-antigen, and peptide-antibody) formed on the microfluidic chip
surface at the end of the experiment.

39
Figure 3.3. Detection of BioHA peptide (A), HA peptide (B), and anti-HA antibody
(C) on a microfluidic chip surface at the intersection of probe lines and sample channels. Each red patch on the chip depicts fluorescence detection of binding between probes that are immobilized on the surface and targets. This figure is simplified and not drawn into scale.
The first step is probe immobilization, which involves introduction of the probe
solution in horizontal channels and incubation for immobilization of the peptides/antibody
on the glass surface. Three different probe solutions were introduced: BioHA peptide,
HA peptide, and anti-HA antibody (see figure 3.3). After incubation, probe solution is
removed via suction and the surfaces are washed with TPBS buffer twice.
In the target binding step, four types of target solutions are introduced to vertical
channels and incubated to allows for binding of the targets with probe lines. We tested
three systems of detection separately. Figure 3.3 (A) shows the first system that
streptavidin will bind to BioHA which contains biotin to allow for fluorescence detection
using SA/Cy5.
Figure 3.3 (B) shows the second system that anti-HA antibody binds to HA in
probe lines. After incubation and washing with TPBS buffer, a secondary antibody is

40
introduced in order to bind to anti-HA. Since this secondary antibody is biotin-labeled, its
presence can be detected utilizing SA/Cy5.
Figure 3.3 (C) shows the third system that the secondary antibody (BioIgG) binds
to anti-HA. After incubation, solution removal, and TPBS wash, SA/Cy5 is introduced to
bind to this biotin-labeled antibody (BioIgG).
As mentioned earlier in this chapter, three different surfaces are examined for
initial experiments to immobilize and detect peptide and antibody samples: poly-L-lysine
(PLL), polystyrene (PS), and glutaraldehyde surface (GA). Below, in figure 3.4 the
results of the initial experiments on GA surface are shown.
Figure 3.4 (a) demonstrates the fluorescence square-shaped patches resulted
from the whole microfluidic chip for confirmation of peptide immobilization, antibody
binding, and secondary antibody detection in this experiment. Sections A, B, C in Figure
3.4 show the results that correspond to fig.3.3 A, B, C respectively.

41
Figure 3.4. Detection of peptides and antibodies via the intersection method in a
microfluidic chip. a: Fluorescence image of the scanned chip. A: Inset for peptide immobilization confirmation, B: Inset for peptide immobilization, antibody binding, and antibody-antibody interaction. C: Inset for immobilization of antibody and detection of antibody-antibody interaction.
In Figure 3.4 (A) BioHA was introduced in the first horizontal probe channel, and
the presence of BioHA was confirmed by a patch appearing at the intersection with the
vertical channels that contain SA/Cy5. Such a patch also appears at the intersections
with all the vertical channels that contain SA/Cy5 in their final step.
Figure 3.4 (B) shows the results obtained from first immobilizing a peptide (HA)
as horizontal probe lines and then introducing primary antibody (anti-HA) and secondary
antibody (BioIgG) in vertical channels. Since anti-HA is a mouse antibody, BioIgG, which
is an anti-mouse antibody, binds to it. The patches present in figure 3.4 (B) are the proof
of the success for the multi-step detection of HA first by anti-HA and then by BioIgG. The
negative control for this experiment is shown in figure 3.4 (a) where HA in horizontal
probe lines did not produce a signal by BioIgG and SA/Cy5 in the absence of anti-HA.
Figure 3.4 (C) presents the third system we investigated (summarized in figure
3.3 (C)). Here, an antibody (antiHA) was directly immobilized as probe lines on the GA

42
surface through Schiff base linkage. Then, in vertical channels, a secondary antibody
(BioIgG) that binds to anti-HA was first introduced. Since the secondary antibody is
biotin-labeled, it can be detected using SA/Cy5. Due to the presence of patches in fig.
3.4 (C) we concluded that the immobilization of antibody on the surface using the
intersection method was successful. Moreover, in separate vertical channels, BioHA is
introduced to the channels followed by SA/Cy5 in the next step; this is to confirm that
anti-HA is immobilized successfully. The negative control for this experiment is shown in
figure 3.4 (a) where antiHA did not produce a signal by SA/Cy5 alone because of the
absence of BioIgG.
As mentioned earlier, the results presented in figure 3.4 are obtained from the
aldehyde-functionalized glass chip. Similar microarrays were performed on polystyrene
(section 2.3.1) and poly-L-lysine (section 2.3.2) surfaces, and the fluorescence signal
intensities obtained from them are summarized in figure 3.5 below. These experiments
were meant to investigate the feasibility of performing microarray on these surfaces as
well as obtaining high signal intensities on each surface.
Figure 3.5. The histogram shows fluorescence signals for detection of BioHA (100
µg/mL), HA (50 µg/mL), and antiHA (100 µg/mL) in a microfluidic chip on three different surfaces: polystyrene, poly-L-lysine, and glutaraldehyde. The error bars show the standard deviation of 4 replicates. Each replicate is the signal value for one square-shaped patch.

43
Figure 3.5 demonstrates fluorescence signals obtained from peptide and antibody
immobilization using the intersection method on all surfaces. Based on the results shown
in figure 3.5, glutaraldehyde (GA) surface seems to result in better immobilization of
peptides and antibodies as opposed to polystyrene (PS) or poly-L-lysine (PLL) surfaces,
showing higher fluorescence signal intensities on the GA surface.
3.2. Sandwich detection on a microfluidic chip
The successful results obtained from peptide immobilization allowed us to
proceed with investigating the intersection approach for detection of a more complicated
system: sandwich detection.
The steps involved in performing a sandwich detection on the chip are shown in
figure 3.6. The first step (fig. 3.6 (A)) is probe immobilization, which involves the
introduction of capture antibodies in horizontal channels. Antibody solutions are pipetted
into the reservoirs in one end of channels in PDMS slab, and then introduced to the
channels by applying suction to the reservoir at the other end of each channel. After
incubation, antibody solution is removed from channels via suction and the channels are
washed with TPBS buffer twice. In the target binding step (fig. 3.6 (B)) the following
reagents are introduced to the vertical channels consecutively, followed by TPBS wash
twice after each step: First, the protein of interest, is introduced to the channels. At the
intersections between the horizontal probe lines and the vertical channels, protein
molecules bind to antibodies on the surface. Then, the biotin-labeled detection antibody
is introduced to the channels. At the intersections between the horizontal probe lines and
the vertical channels, formation of a sandwich antibody-antigen-antibody complex will
form. Finally, Cy-5 conjugated streptavidin (SA/Cy5) is introduced to the channels and
binds to biotin-labeled detection antibody. This will create patches that can be detected
utilizing a Typhoon fluorescence scanner.

44
Figure 3.6. Schematic of sandwich detection on a microfluidic chip
The initial experiment to investigate performing sandwich detection on a
microfluidic chip was done on a glutaraldehyde surface. This experiment involved
performing sandwich detection for interLeukin-2 (IL-2), a cytokine protein, along with
detection of antiHA and BioHA as controls. Figure 3.7 illustrates the bioarray results for
detection of a 100ng/mL solution of this protein.
Figure 3.7. Scanned results of sandwich method on a chip for detection of human
Interleukin-2 (100 ng/mL) on glutaraldehyde surface. Empty vertical channels are not labeled. IL-2 Incubation time was 60 min, during which the solution inside the channels was refreshed 4 times (4 injections).
As a positive control to ensure the aldehyde surface was functional, BioHA was
introduced as the first horizontal probe line, and a signal patch was produced at each of
the intersections with all vertical channels that contain SA/Cy5.
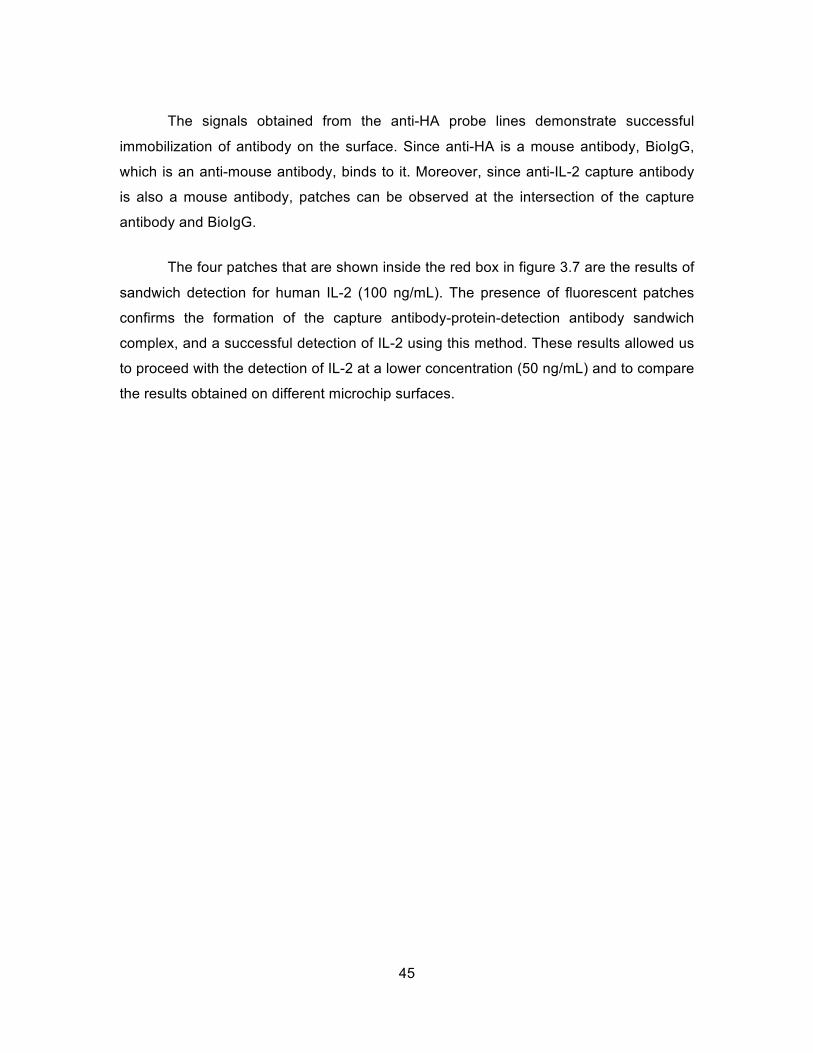
45
The signals obtained from the anti-HA probe lines demonstrate successful
immobilization of antibody on the surface. Since anti-HA is a mouse antibody, BioIgG,
which is an anti-mouse antibody, binds to it. Moreover, since anti-IL-2 capture antibody
is also a mouse antibody, patches can be observed at the intersection of the capture
antibody and BioIgG.
The four patches that are shown inside the red box in figure 3.7 are the results of
sandwich detection for human IL-2 (100 ng/mL). The presence of fluorescent patches
confirms the formation of the capture antibody-protein-detection antibody sandwich
complex, and a successful detection of IL-2 using this method. These results allowed us
to proceed with the detection of IL-2 at a lower concentration (50 ng/mL) and to compare
the results obtained on different microchip surfaces.

46
Figure 3.8. Antibody bioarray results for detection of human interleukin-2 (50
ng/mL) on (A) polystyrene, (B) poly-L-lysine, and (C) glutaraldehyde surfaces: Fluorescence scanned chips (Top), and Fluorescence signal intensities (Bottom). IL-2 Incubation time was 120 min, during which the solutions inside the channels were refreshed 4 times (4 injections).
Figure 3.8 illustrates the results of sandwich detection of human IL-2 (50 ng/mL)
on three surfaces of interest: polystyrene (PS), poly-L-lysine (PLL), and glutaraldehyde
(GA). The fluorescence signal intensities obtained for detection of IL-2 on PLL surface
are higher than that of PS. This pattern for IL-2 detection in Fig 3.8 is different from the
observed pattern in antiHA immobilization signals in figure 3.5. One possibility that may
explain this observation could be when antiHA or anti-IL-2 capture antibodies are
immobilized on the surface, the amount of antibody that is immobilized on PS surface
might be higher than PLL, but the antibody is subject to more denaturation on PS
surface, thus lowering the binding capability of anti-IL-2 on the PS surface. Therefore,
the amount of antibody as detected by BioIgG can be high on the PS surface, but the
binding capability of the immobilized antibody as detected by IL-2 can be low on PLL
surface.

47
The comparison of fluorescence signal intensities obtained for the sandwich
method to detect a lower concentration of human IL-2 (10 ng/mL) by capture antibodies
immobilized on these three surfaces is shown in figure 3.9. It is proved that the GA
surface provides a higher signal intensity than the PLL surface (~1.5 times) for human IL-
2 detection. Moreover, in repetitive experiments, we observed that the GA results are
reproducible as well (as shown by low RSD values in figure 3.9). Due to higher signal
intensities and reproducible results, glutaraldehyde surface was chosen for the
microfluidic antibody bioarrays in future experiments.
Figure 3.9. The histogram shows fluorescence signals for detection of human IL-2
(10 ng/mL) in a microfluidic chip on three different surfaces: poly styrene (PS), poly-L-lysine (PLL), and glutaraldehyde (GA). The incubation time for IL-2 was 90 min, during which the solution inside the channels was refreshed 4 times (4 injections). The error bars show the standard deviation of 4 replicates. Each replicate is the signal value for one square-shaped patch.

48
Chapter 4. Optimizing conditions of the microfluidic chip
In the previous chapter, different methods for modification of the microfluidic chip
surface were compared, and it was determined that glutaraldehyde was the most
suitable one for our sandwich detection experiment.
In this chapter, we present various conditions that affect the signal intensity
obtained on the microfluidic chip, and optimize these factors to achieve the lowest limit
of detection possible with this method. Wherever appropriate, initial tests were
performed with peptide or antibody samples, similar to chapter 3.
4.1. Increasing the amount of immobilized capture antibody on ZnO nanostructures
One way to enhance the signal is to increase the amount of probe molecules that
are immobilized on the chip surface. By increasing the surface area on the chip we can
immobilize more probe molecules on the surface. In this section, we describe how
growing zinc oxide nanostructures on the glass surface may increase the surface area
for probe immobilization and therefore the fluorescence signal.
The glass slide was coated with ZnO nanostructures (see section 2.3.4) and
then functionalized with glutaraldehyde. The results obtained from this chip were then
compared to the results produced by a glutaraldehyde-functionalized plain glass chip.
4.1.1. Synthesis of ZnO nanostructures on the microchip glass surface
Among different approaches for synthesis of ZnO nanostructures, solution phase
growth methods such as chemical bath deposition (CBD) have received a lot of attention
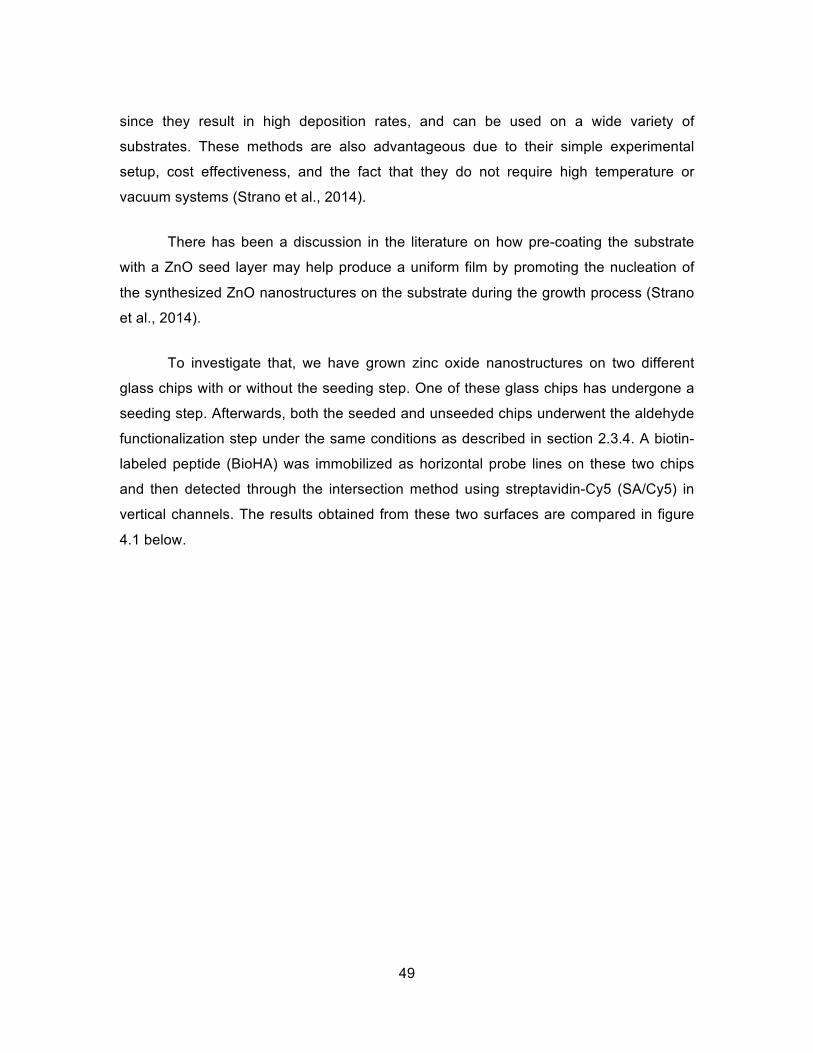
49
since they result in high deposition rates, and can be used on a wide variety of
substrates. These methods are also advantageous due to their simple experimental
setup, cost effectiveness, and the fact that they do not require high temperature or
vacuum systems (Strano et al., 2014).
There has been a discussion in the literature on how pre-coating the substrate
with a ZnO seed layer may help produce a uniform film by promoting the nucleation of
the synthesized ZnO nanostructures on the substrate during the growth process (Strano
et al., 2014).
To investigate that, we have grown zinc oxide nanostructures on two different
glass chips with or without the seeding step. One of these glass chips has undergone a
seeding step. Afterwards, both the seeded and unseeded chips underwent the aldehyde
functionalization step under the same conditions as described in section 2.3.4. A biotin-
labeled peptide (BioHA) was immobilized as horizontal probe lines on these two chips
and then detected through the intersection method using streptavidin-Cy5 (SA/Cy5) in
vertical channels. The results obtained from these two surfaces are compared in figure
4.1 below.
50
Figure 4.1. Comparison of the results for BioHA (50 µg/mL) immobilization on GA
surface of 1. Seeded ZnO chips and 2. Non-seeded ZnO chips. A) Scanned image of chips, B) signal intensity of the patch, and C) SEM image of the ZnO surface before aldehyde functionalization. The growth solution concentration was 25 mM and growth time was 30 min in both experiments.
Scanning electron microscopy (SEM) was conducted to examine the morphology
of ZnO nanostructures. As the SEM images in figure 4.1 (C) clearly indicate, the seeded
glass chip forms a denser ZnO nanostructure surface. Moreover, after functionalizing
both glass chips with aldehyde groups and immobilizing a peptide (BioHA) on both
surfaces, binding of SA/Cy5 with BioHA results in a higher fluorescence signal on the
seeded glass chips (fig. 4.1 (B)). This indicates a higher level of peptide immobilization
on the seeded chip, which can be resulted from more binding sites being present on the
chip due to the denser ZnO nanostructure surface formed on this chip. Therefore, ZnO
nanostructures were grown on a pre-seeded glass chip, and then aldehyde-
functionalized for future experiments. The effect of ZnO nanostructure coated on the
chip surface on improvement of antibody immobilization was investigated afterwards.

51
4.1.2. Effect of ZnO nanostructures on antibody immobilization
After obtaining the synthesis conditions for ZnO nanostructures on glass using
fluorescence SA/Cy5 signal to compare the amount of BioHA peptide immobilization on
the surface, antibody immobilization was performed on the GA-functionalized ZnO-
nanostructured glass chips. Figure 4.2 below compares the results for immobilization of
a biotin-labeled antibody (BioIgG) on the GA-functionalized ZnO-nanostructured chip
versus the plain GA-modified chip. As the sample, BioIgG antibody was immobilized as
horizontal probe lines; as a control, BioHA peptide was also immobilized as horizontal
probe lines. Then, SA/Cy5 was introduced to vertical channels to react with probe lines
to create the patches (fig. 4.2 (A) and (B)). After repeating the experiment, the
fluorescence signal intensities obtained from ZnO-nanostructured chips was compared
to plain chips. Figure 4.2 (C) presents the results of this comparison.
Figure 4.2. Peptide and antibody immobilization on the glutaraldehyde (GA)
surface on: (A) ZnO nanostructure modified chip, and (B) plain chip. The signal intensities obtained from 4 replicates of immobilized biotin-labeled antibody (BioIgG) are compared on two GA chips with and without ZnO pre-coating (n=4) (C).
The glutaraldehyde surface on the chip that was modified with ZnO
nanostructures showed 2 times higher signal for immobilization of the same antibody

52
sample compared to the chips with no ZnO coating. This higher signal might be
explained by the increase in surface area and therefore more sites for antibody
immobilization on ZnO chips.
Although there was an improvement in signal intensity on ZnO chips, the
improvement was modest, and more importantly, we observed several technical
difficulties associated with the use of ZnO nanostructures in our microfluidic chips. The
sealing of PDMS channel slab to glass slide is not satisfactory on ZnO chips, and we
witnessed liquid leaking in several cases. Therefore, we decided to move forward with
GA chips on plain glass surface in our future experiments to avoid such problems.
4.2. Antigen incubation time
One of the factors that affect the fluorescence signal intensity obtained by the
sandwich detection method is the incubation time of the analyte protein.
The results shown in figure 4.3 compare different signal intensities obtained from
experiments using a series of incubation times for IL-2.
First, anti-IL-2 capture antibody was immobilized on the glutaraldehyde surface
as horizontal probe lines. Then, in vertical channels, a solution of IL-2 (10 ng/mL) was
introduced and incubated for different incubation times. Next, anti-IL-2 detection
antibody was flown through the vertical channels to create the sandwich complex.
Detection antibody is biotin-labeled, and therefore introducing SA/Cy5 to vertical
channels as the final step results in patches detectable using the fluorescence scanner.

53
Figure 4.3. Effect of IL-2 (10 ng/mL) incubation time on fluorescence signal
intensity of sandwich detection method on the aldehyde functionalized microfluidic chip (n=4). IL-2 solution inside the channels was refreshed 4 times (4 injections) in all cases. The concentration of capture antibody and detection antibody are 500 µg/mL and 15 µg/mL respectively. The background signal is subtracted and corrected fluorescence signal is reported.
As demonstrated in figure 4.3, by increasing the incubation time, the
fluorescence signal increases. After 100 min, there is no further increase, and no
significant difference occurs between signal intensities obtained at 100 and 120 min.
4.3. Orientation of immobilized capture antibody
As discussed in section 1.4.2, covalent immobilization of antibodies is more
stable, and more reproducible, as compared to physical adsorption(Peluso et al., 2003).
Therefore, this immobilization method leads to higher signal. However, covalent
immobilization of antibodies may cause disordered antibody orientation, which results in
a reduced binding capacity. Random orientation of the antibody molecules, and steric
hindrance caused by improper orientation of the antibody toward the surface of the chip
substrate will result in signal reduction.
In our initial experiments for detection of IL-6, no signal was obtained at the
intersections of capture antibody probe lines, and IL-6 and detection antibody vertical
54
channels. The results shown in control section of figure 4.4 are a representative of such
lack of signal intensity. With the anti IL-6 capture antibody having a lower concentration
compared to anti IL-2 capture antibody, the well-oriented immobilization of capture
antibody molecules becomes more important, in order to use the full capacity of the
probe antibody molecules immobilized on the surface. Therefore, we examined the
effect of protein G to improve the orientation of immobilized capture antibodies.
In this section, the effect of a sub-layer of protein G is employed to assist
immobilization of capture antibody and to achieve a higher fluorescence signal is
investigated. As described in section 1.6 protein G binds to the Fc region of the capture
antibody, leaving its antigen-binding sites (Fab regions) up and ready for binding to the
target protein in the sample solutions.
Effect of protein G in immobilization of capture antibody
We designed two sandwich detection methods on the microfluidic chip in the
presence and absence of a protein G sub-layer, and therefore we study the effect of
protein G on the improvement of fluorescent signals. We performed these experiments
using the human interleukin, IL-6.
On a GA surface, two sets of horizontal probe lines (each made of two
replicates) were constructed. In the first set, a capture antibody against human
interleukin-6 was immobilized (anti-IL-6 capture antibody). In the second set, a solution
of protein G (0.5 mg/mL in PBS) was first immobilized on the surface; after emptying the
channels and washing the unbound solution, anti-IL-6 capture antibody was introduced
to the channels and incubated.
In the target binding step, the target protein (human IL-6) was first introduced to
the vertical channels. This step was followed by introduction of biotin-labeled detection
antibody and SA/Cy5. Figure 4.4 presents the results of this experiment.

55
Figure 4.4. Protein G sub-layer increases fluorescence signal of sandwich
detection, probably by improving the orientation of capture antibody. IL-6 incubation time was 120 min, during which the solutions inside the channels were refreshed 4 times (4 injections). Detection antibody concentration is 15 µg/mL.
In the presence of protein G, the fluorescent signal of IL-6 is increased.
Therefore, IL-6 can be detected down to 5 ng/mL when 62.5 µg/mL of anti-IL-6 capture
antibody is used. Although the concentration of capture antibody in probe lines that do
not have a protein G sub-layer is twice as high as when protein G is used, there is still
no detectable signal. Since in the presence of protein G sub-layer, 10 ng/mL of IL-6 is
detectable, and in the absence of protein G sub-layer, even 30 ng/mL of IL-6 cannot be
detected, it can be said that the use of protein G sub-layer resulted in at least 3 fold
increase in the signal intensity. This fold-increase might be even more than 3 times, but
since the highest IL-6 concentration available to us (the stock solution) was 30 ng/mL,
we could not test higher IL-6 concentrations in the absence of protein G, and find the IL-
6 concentration that is detectable without a protein G sub-layer. Therefore, the exact
fold-increase in signal cannot be measured. The increase in fluorescent signal in the
presence of protein G may be attributed to the improvement of the association rate
constant of the capture antibody and IL-6; see a kinetic study experiment (Appendix A).

56
Although the use of protein G clearly improves the signal intensity, there are
some technical difficulties associated with its use. For example, there is a chance of
binding between detection antibody and protein G, resulting in a false positive signal
(figure 4.5). This could be due to different origins of the two antibodies, since protein G
has different affinities for different antibodies. Anti-IL-2 detection antibody is a mouse
IgG which has a high affinity for protein G (Björck and Kronvall, 1984). This problem did
not exist for anti-IL-6 detection antibody (Fig 4.4), which might be due to it being a rat
IgG.
Figure 4.5. False positive signal of IL-2 due to binding between anti-IL-2 detection
antibody and protein G. The IL-6 Incubation time was 60 min, during which the solutions inside the channels were refreshed 4 times (4 injections).
Further experiments involved comparison of 3 different concentrations of protein
G in obtaining the fluorescence signal from the chip. In the case of IL-2 experiments, the
background signal was always subtracted from the reported fluorescence signal for IL-2
detection in order to correct for the effect of interactions between anti-IL-2 detection
antibody and protein G. In the case of IL-6 experiments, no correction is needed. The
results are summarized in figure 4.6 below.

57
Figure 4.6. Effects of different concentrations of protein G used as sub-layer for
capture antibody immobilization. The concentration of both capture antibody is 125 µg/mL, and that of both interleukins is 30 ng/mL. The incubation time was 120 min, during which the solution inside the channels was refreshed 4 times (4 injections). The error bars show the standard deviation of 4 replicates.
As indicated by figure 4.6, the signal obtained from 1 mg/mL of protein G is
higher than that obtained from 0.5 mg/mL of protein G. However, the signal does not
significantly change from 1 to 2 mg/mL. Therefore, we used 1 mg/mL of protein G in our
further experiments.
4.4. Effect of multiple passes of sample solution in microfluidic channels
The microfluidic experiments that we used throughout our studies follow a stop-
flow procedure. This procedure involves static incubation of analyte solution, where the
bulk solution remains in the microchannel for an extended period of time. During the
immunoassay inside microchannels in a stop-flow method, the concentration of antigen
(IL-6) might undergo depletion due to the large surface-to-volume ratio of microchannels
(Lionello et al., 2005). This concentration depletion will lead to less availability of the
sample to the immobilized probes, and result in a lower signal. Renewing the solution by

58
sequential fillings of the microchannel, or “multiple stop-flow incubations” can reduce this
problem (Lionello et al., 2005).
In terms of scaling law, the depletion of analyte concentration can be attributed to
the fast diffusion or short diffusion time occurring in microchannels (Wautelet, 2001). It is
because the scaling law suggests the diffusion time scales with the squares of length,
i.e. a decrease of 1-mm scale in microtitre plate to 10-µm scale in microfludic channel
results in the reduction of 10000-fold in analyte diffusion time (Wautelet, 2001).
In order to study this depletion effect, we compared two strategies for protein
introduction: in the first chip, we introduced the target protein (5 ng/mL solution of IL-2)
into the microfluidic channels once, and allowed it to incubate for 120 minutes (stop-flow
incubation). In the second chip, we performed a sequence of injections for the same
protein solution (multiple stop-flow incubation). We introduced the target protein (5
ng/mL IL-2) 12 times and let it incubate for 10 minutes each time. After each incubation
step, we used suction to empty the channels and introduced fresh sample solutions. The
total incubation time of protein for both methods was 120 minutes. Other factors were all
the same for both chips.
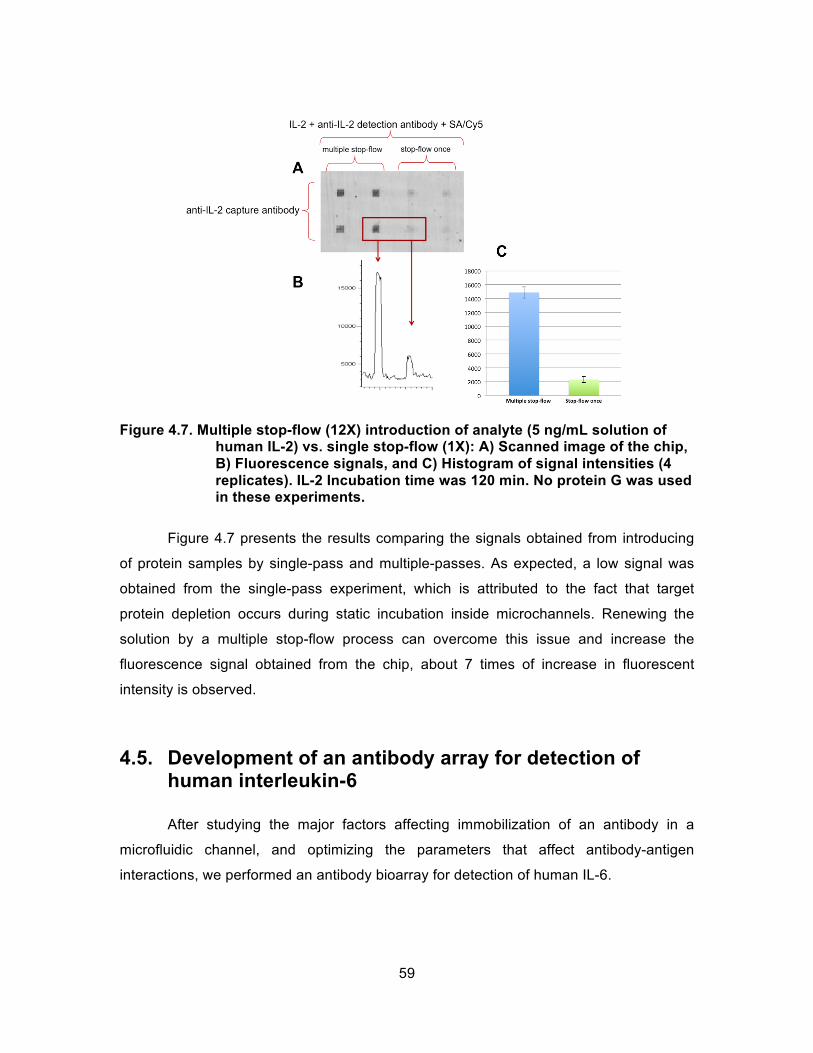
59
Figure 4.7. Multiple stop-flow (12X) introduction of analyte (5 ng/mL solution of
human IL-2) vs. single stop-flow (1X): A) Scanned image of the chip, B) Fluorescence signals, and C) Histogram of signal intensities (4 replicates). IL-2 Incubation time was 120 min. No protein G was used in these experiments.
Figure 4.7 presents the results comparing the signals obtained from introducing
of protein samples by single-pass and multiple-passes. As expected, a low signal was
obtained from the single-pass experiment, which is attributed to the fact that target
protein depletion occurs during static incubation inside microchannels. Renewing the
solution by a multiple stop-flow process can overcome this issue and increase the
fluorescence signal obtained from the chip, about 7 times of increase in fluorescent
intensity is observed.
4.5. Development of an antibody array for detection of human interleukin-6
After studying the major factors affecting immobilization of an antibody in a
microfluidic channel, and optimizing the parameters that affect antibody-antigen
interactions, we performed an antibody bioarray for detection of human IL-6.

60
Figure 4.8. Detection of human interleukin-6 on the microfluidic chip. The IL-6
incubation time was 120 min and consisted of 12 passes of this protein solution. A sub-layer of protein G (1 mg/mL) was coated in horizontal channels prior to capture antibody immobilization.
The detection limit for human IL-6 was 3 ng/mL, which was obtained from the
concentration that results in a signal-to-noise ratio of 3. This shows an increase of over
10 times in detection limit concentration compared to the absence of optimizations, since
without optimization even 30 ng/mL of IL-6 was not detectable (data shown in figure 4.4).
Obtaining the exact fold-increase resulted by our optimizations was not possible, since
the highest IL-6 concentration available to us (stock solution concentration) was 30
ng/mL, and even at such a high concentration the signal was not detectable (see fig 4.4)
before the signal enhancement strategies (e.g. protein G) that we experimented.
However, after optimizations, concentrations as low as 3 ng/mL were detectable (data
shown in fig. 4.8).
61
Chapter 5. Conclusions and Future Directions
5.1. Summary of the research and conclusion
In this work, we have introduced a sandwich antibody bioarray for detection of
human IL-2 and human IL-6 using the micromosaic array approach. We studied different
factors affecting the signal intensity in an antibody bioarray and obtained the fold-
increase of the signal that each modification strategy results in. Our investigations were
categorized in two groups: Factors affecting probe molecule, capture antibody,
immobilization on the surface, and factors affecting the antibody-antigen binding inside a
microfluidic channel.
For antibody immobilization on a microfluidic microarray surface, first we studied
different factors affecting antibody immobilization on a microfluidic microarray surface.
First, we compared three different types of surface for both physical and chemical
immobilization of antibodies. Polystyrene and poly-L-lysine-modified surfaces were used
for physical immobilization, and glutaraldehyde-functionalized surface was used for
chemical immobilization. The results that we obtained showed a higher signal from the
use of the glutaraldehyde surface. This type of surface was selected for performance of
sandwich detection of human interleukins.
Next, we studied the effect of increased surface area on the glass slide in order
to increase the amount of antibodies immobilized on the surface. The results of peptide
and antibody immobilization on a surface modified by zinc oxide nanostructures showed
an increase (~ 2 times) in signal. However, due to technical difficulties associated with
this method such as sealing problem between PDMS channel chip and glass slide, we
decided not to use this method in our further experiments.

62
Moreover, we studied factors (e.g. incubation time) that affect antibody-antigen
interactions in order to increase the fluorescence signal. An important factor that we
investigated was how the antibody orientation on the surface affects the antibody-
antigen interaction at the intersections of probe lines and sample channels. For this
purpose, we immobilized a sub-layer of protein G prior to antibody immobilization.
Protein G improved direct immobilization of antibody, and therefore made it more
accessible to bind to target proteins. A series of SPR studies were also performed to
compare antibody-antigen binding rate constants in the presence and absence of protein
G (Appendix A). The results show an improvement for association rate constant in the
presence of protein G. This can be due to the antibodies being immobilized in a manner
that are more readily accessible to bind to proteins.
The microfluidic chip that we used was utilizing stop-flow incubation for
antibodies and target protein. We investigated the effect of introducing sample solution
several times in a multiple stop-flow incubation. The results showed an improvement of
signal.
After all the optimizations, we performed the sandwich detection for human IL-6
and obtained a detection limit of 3 ng/mL for this protein (fig 4.8). This showed a signal
fold-increase of over 10 times compared to the result reported in fig 4.4. The
optimization data are summarized in table 5.1. Although this detection limit is not
comparable to conventional ELISA (2 pg/mL), the microfluidic antibody bioarray has the
advantage of less sample consumption and shorter analysis time.
Table 5.1, Summary of fluorescence signal fold-increase obtained from different signal enhancement strategies in this work
Signal enhancement strategy Fluorescence signal fold-increase Use of covalent immobilization (GA surface vs. PLL surface)
1.5
Well-oriented antibody immobilization (protein G vs. no protein G)
> 3
sample introduction (Multiple stop-flow vs. single stop-flow)
7

63
5.2. Future directions
The main challenge in further development of our microfluidic microarray is
reaching the desired detection limit at the pg/mL level. There are two ways that we can
achieve that: first, improvement of reagent accessibility, and second, the use of signal
enhancement methods.
We have demonstrated in section 4.4 that only the use of a multiple stop-flow
system for sample introduction can improve the signal approximately 7 times. Likewise,
having a continuous flow of samples, can further improve the signal intensity by
increasing the sample replenishment to the surface for binding to probe molecules.
Pre-concentration of the target protein in sample solution is also a step that can
help the detection of low amounts of target proteins on the microfluidic chip.
Moreover, optimizing the detection method can improve the signal intensity.
Common examples are the use of a brighter fluorescence dye compared to Cy5 (such
as fluorescein with a quantum yield of 0.95 compared to 0.27 for Cy5), as well as
increasing the number of fluorescence tags per binding (e.g. the use of SA/Cy5 beads
that are capable of having more Cy5 molecules attached to one bead depending on the
bead size). The use of quantum dots instead of organic fluorescence dyes is another
strategy that has been reported to increase the fluorescence signal intensity by a factor
of 30 (Chinen et al., 2015). Quantum dots are a group of inherently fluorescent
nanoparticles that are in the form of semiconductor single nanocrystals. Some of the
advantages of quantum dots (QDs) over organic fluorescence dyes are: longer
fluorescence lifetime (above 10 ns as opposed to 1-5 ns) which leads to significant
improvement of signal to noise ratio; and size-dependent absorption and emission which
can be used in tunable design of QDs in multicolor labeling of targets(Chinen et al.,
2015).

64
References
Angenendt, P., Glökler, J., Murphy, D., Lehrach, H., Cahill, D.J., 2002. Toward optimized antibody microarrays: a comparison of current microarray support materials. Anal. Biochem. 309, 253–260.
Angenendt, P., Glökler, J., Sobek, J., Lehrach, H., Cahill, D.J., 2003. Next generation of protein microarray support materials:: Evaluation for protein and antibody microarray applications. J. Chromatogr. A 1009, 97–104.
Arenkov, P., Kukhtin, A., Gemmell, A., Voloshchuk, S., Chupeeva, V., Mirzabekov, A., 2000. Protein microchips: use for immunoassay and enzymatic reactions. Anal. Biochem. 278, 123–131.
Bae, Y.M., Oh, B.-K., Lee, W., Lee, W.H., Choi, J.-W., 2005. Study on orientation of immunoglobulin G on protein G layer. Biosens. Bioelectron. 21, 103–110. doi:10.1016/j.bios.2004.09.003
Bailey, R.C., Kwong, G.A., Radu, C.G., Witte, O.N., Heath, J.R., 2007. DNA-encoded antibody libraries: a unified platform for multiplexed cell sorting and detection of genes and proteins. J. Am. Chem. Soc. 129, 1959–1967.
Baruah, S., Dutta, J., 2009. Effect of seeded substrates on hydrothermally grown ZnO nanorods. J. Sol-Gel Sci. Technol. 50, 456–464.
Becker, H., Gärtner, C., 2008. Polymer microfabrication technologies for microfluidic systems. Anal. Bioanal. Chem. 390, 89–111.
Bernard, A., Michel, B., Delamarche, E., 2001. Micromosaic immunoassays. Anal. Chem. 73, 8–12.
Bidlingmaier, S., Liu, B., 2015. Utilizing yeast surface human proteome display libraries to identify small molecule-protein interactions. Yeast Surf. Disp. Methods Protoc. Appl. 203–214.
Biran, I., Walt, D.R., 2002. Optical imaging fiber-based single live cell arrays: a high-density cell assay platform. Anal. Chem. 74, 3046–3054.
Björck, L., Kronvall, G., 1984. Purification and some properties of streptococcal protein G, a novel IgG-binding reagent. J. Immunol. 133, 969–974.

65
Boozer, C., Ladd, J., Chen, S., Jiang, S., 2006. DNA-Directed Protein Immobilization for Simultaneous Detection of Multiple Analytes by Surface Plasmon Resonance Biosensor. Anal. Chem. 78, 1515–1519. doi:10.1021/ac051923l
Borrebaeck, C.A., Wingren, C., 2009. Design of high-density antibody microarrays for disease proteomics: key technological issues. J. Proteomics 72, 928–935.
Bosco, F.G., Bache, M., Yang, J., Chen, C.H., Hwu, E.-T., Lin, Q., Boisen, A., 2013. Micromechanical PDGF recognition via lab-on-a-disc aptasensor arrays. Sens. Actuators Phys. 195, 154–159. doi:10.1016/j.sna.2012.06.030
Boyle, M.D.P., Reis, K.J., 1987. Bacterial Fc receptors. Nat. Biotechnol. 5, 697–703.
Chen, Y., Pui, T.S., Kongsuphol, P., Tang, K.C., Arya, S.K., 2014. Aptamer-based array electrodes for quantitative interferon-γ detection. Biosens. Bioelectron. 53, 257–262. doi:10.1016/j.bios.2013.09.046
Chinen, A.B., Guan, C.M., Ferrer, J.R., Barnaby, S.N., Merkel, T.J., Mirkin, C.A., 2015. Nanoparticle Probes for the Detection of Cancer Biomarkers, Cells, and Tissues by Fluorescence. Chem. Rev. 115, 10530–10574. doi:10.1021/acs.chemrev.5b00321
Cohen, N., Sabhachandani, P., Golberg, A., Konry, T., 2015. Approaching near real-time biosensing: Microfluidic microsphere based biosensor for real-time analyte detection. Biosens. Bioelectron. 66, 454–460. doi:10.1016/j.bios.2014.11.018
Cretich, M., Damin, F., Chiari, M., 2013. Protein microarray technology: how far off is routine diagnostics? Analyst 139, 528–542. doi:10.1039/C3AN01619F
Du, D., Zou, Z., Shin, Y., Wang, J., Wu, H., Engelhard, M.H., Liu, J., Aksay, I.A., Lin, Y., 2010. Sensitive Immunosensor for Cancer Biomarker Based on Dual Signal Amplification Strategy of Graphene Sheets and Multienzyme Functionalized Carbon Nanospheres. Anal. Chem. 82, 2989–2995. doi:10.1021/ac100036p
Farrar, J.J., Benjamin, W.R., Hilfiker, M.L., Howard, M., Farrar, W.L., Fuller-Farrar, J., 1982. The Biochemistry, Biology, and Role of Interleukin 2 in the Induction of Cytotoxic T Cell and Antibody-Forming B Cell Responses. Immunol. Rev. 63, 129–166.
Fragoso, A., Latta, D., Laboria, N., von Germar, F., Hansen-Hagge, T.E., Kemmner, W., Gärtner, C., Klemm, R., Drese, K.S., O’Sullivan, C.K., 2011. Integrated microfluidic platform for the electrochemical detection of breast cancer markers in patient serum samples. Lab. Chip 11, 625. doi:10.1039/c0lc00398k
Fujii, T., 2002. PDMS-based microfluidic devices for biomedical applications. Microelectron. Eng. 61, 907–914.

66
Ge, H., 2000. UPA, a universal protein array system for quantitative detection of protein–protein, protein–DNA, protein–RNA and protein–ligand interactions. Nucleic Acids Res. 28, e3–e3.
Glökler, J., Angenendt, P., 2003. Protein and antibody microarray technology. J. Chromatogr. B 797, 229–240.
Hall, D.A., Ptacek, J., Snyder, M., 2007a. Protein microarray technology. Mech. Ageing Dev., Functional Genomics of Aging III 128, 161–167. doi:10.1016/j.mad.2006.11.021
Hall, D.A., Ptacek, J., Snyder, M., 2007b. Protein microarray technology. Mech. Ageing Dev., Functional Genomics of Aging III 128, 161–167. doi:10.1016/j.mad.2006.11.021
Han, S.W., Jang, E., Koh, W.-G., 2015. Microfluidic-based multiplex immunoassay system integrated with an array of QD-encoded microbeads. Sens. Actuators B Chem. 209, 242–251.
Hatamie, A., Khan, A., Golabi, M., Turner, A.P., Beni, V., Mak, W.C., Sadollahkhani, A., Alnoor, H., Zargar, B., Bano, S., others, 2015. Zinc Oxide Nanostructure-Modified Textile and Its Application to Biosensing, Photocatalysis, and as Antibacterial Material. Langmuir 31, 10913–10921.
Heinrich, P.C., Behrmann, I., Müller-Newen, G., Schaper, F., Graeve, L., 1998. Interleukin-6-type cytokine signalling through the gp130/Jak/STAT pathway. Biochem. J. 334, 297–314.
Huang, R.-P., Yang, W., Yang, D., Flowers, L., Horowitz, I.R., Cao, X., Huang, R., 2005. The promise of cytokine antibody arrays in the drug discovery process. Expert Opin. Ther. Targets 9, 601–615. doi:10.1517/14728222.9.3.601
Jenkins, R.E., Pennington, S.R., 2001. Arrays for protein expression profiling: Towards a viable alternative to two-dimensional gel electrophoresis? Proteomics 1, 13–29.
Jenko, K.L., Zhang, Y., Kostenko, Y., Fan, Y., Garcia-Rodriguez, C., Lou, J., Marks, J.D., Varnum, S.M., 2014. Development of an ELISA microarray assay for the sensitive and simultaneous detection of ten biodefense toxins. Analyst 139, 5093–5102.
Jung, Y., Young Jeong, J., Hyun Chung, B., 2008. Recent advances in immobilization methods of antibodies on solid supports. Analyst 133, 697–701. doi:10.1039/B800014J
Kang, Z., Yan, X., Wang, Y., Zhao, Y., Bai, Z., Liu, Y., Zhao, K., Cao, S., Zhang, Y., 2016. Self-powered photoelectrochemical biosensing platform based on Au NPs@ ZnO nanorods array. Nano Res. 9, 344–352.

67
Karoonuthaisiri, N., Charlermroj, R., Uawisetwathana, U., Luxananil, P., Kirtikara, K., Gajanandana, O., 2009. Development of antibody array for simultaneous detection of foodborne pathogens. Biosens. Bioelectron. 24, 1641–1648. doi:10.1016/j.bios.2008.08.026
Kausaite-Minkstimiene, A., Ramanaviciene, A., Kirlyte, J., Ramanavicius, A., 2010. Comparative Study of Random and Oriented Antibody Immobilization Techniques on the Binding Capacity of Immunosensor. Anal. Chem. 82, 6401–6408. doi:10.1021/ac100468k
Kim, J.-Y., Cho, J.W., Kim, S.H., 2011. The characteristic of the ZnO nanowire morphology grown by the hydrothermal method on various surface-treated seed layers. Mater. Lett. 65, 1161–1164.
Kusnezow, W., Jacob, A., Walijew, A., Diehl, F., Hoheisel, J.D., 2003. Antibody microarrays: an evaluation of production parameters. Proteomics 3, 254–264.
Lee, J., Gulzar, N., Scott, J.K., Li, P.C., 2012. A nanofluidic bioarray chip for fast and high-throughput detection of antibodies in biological fluids, in: SPIE Nanosystems in Engineering+ Medicine. International Society for Optics and Photonics, p. 85481Q–85481Q.
Li, B., Li, L., Guan, A., Dong, Q., Ruan, K., Hu, R., Li, Z., 2014. A smartphone controlled handheld microfluidic liquid handling system. Lab Chip 14, 4085–4092. doi:10.1039/C4LC00227J
Lionello, A., Josserand, J., Jensen, H., Girault, H.H., 2005. Dynamic protein adsorption in microchannels by “stop-flow” and continuous flow. Lab. Chip 5, 1096–1103.
Liotta, L.A., Espina, V., Mehta, A.I., Calvert, V., Rosenblatt, K., Geho, D., Munson, P.J., Young, L., Wulfkuhle, J., Petricoin, E.F., 2003. Protein microarrays: meeting analytical challenges for clinical applications. Cancer Cell 3, 317–325.
Liu, C., Meng, F., Zheng, W., Xue, T., Jin, Z., Wang, Z., Cui, X., 2016. Plasmonic ZnO nanorods/Au substrates for protein microarrays with high sensitivity and broad dynamic range. Sens. Actuators B Chem. 228, 231–236.
Liu, Y., Liu, Y., Matharu, Z., Rahimian, A., Revzin, A., 2015. Detecting multiple cell-secreted cytokines from the same aptamer-functionalized electrode. Biosens. Bioelectron. 64, 43–50. doi:10.1016/j.bios.2014.08.034
MacBeath, G., Schreiber, S.L., 2000. Printing proteins as microarrays for high-throughput function determination. Science 289, 1760–1763.

68
Micromechanical PDGF recognition via lab-on-a-disc aptasensor arrays [WWW Document], n.d. URL http://www.sciencedirect.com/science/article/pii/S0924424712004190 (accessed 12.20.16).
Mihara, M., Hashizume, M., Yoshida, H., Suzuki, M., Shiina, M., 2012. IL-6/IL-6 receptor system and its role in physiological and pathological conditions. Clin. Sci. 122, 143–159.
Miller, J.C., Zhou, H., Kwekel, J., Cavallo, R., Burke, J., Butler, E.B., Teh, B.S., Haab, B.B., 2003. Antibody microarray profiling of human prostate cancer sera: antibody screening and identification of potential biomarkers. Proteomics 3, 56–63.
Mizel, S.B., 1989. The interleukins. FASEB J. 3, 2379–2388.
Narahari, C.R., Randers-Eichhorn, L., Strong, J.C., Ramasubramanyan, N., Rao, G., Frey, D.D., 2001. Purification of recombinant green fluorescent protein using chromatofocusing with a pH gradient composed of multiple stepwise fronts. Biotechnol. Prog. 17, 150–160.
Nishina, N., Kaneko, Y., Kameda, H., Kuwana, M., Takeuchi, T., 2013. Reduction of plasma IL-6 but not TNF-α by methotrexate in patients with early rheumatoid arthritis: a potential biomarker for radiographic progression. Clin. Rheumatol. 32, 1661–1666.
Novo, P., Chu, V., Conde, J.P., 2014. Integrated optical detection of autonomous capillary microfluidic immunoassays:a hand-held point-of-care prototype. Biosens. Bioelectron. 57, 284–291. doi:10.1016/j.bios.2014.02.009
Olle, E.W., Messamore, J., Deogracias, M.P., McClintock, S.D., Anderson, T.D., Johnson, K.J., 2005. Comparison of antibody array substrates and the use of glycerol to normalize spot morphology. Exp. Mol. Pathol. 79, 206–209.
Peluso, P., Wilson, D.S., Do, D., Tran, H., Venkatasubbaiah, M., Quincy, D., Heidecker, B., Poindexter, K., Tolani, N., Phelan, M., others, 2003. Optimizing antibody immobilization strategies for the construction of protein microarrays. Anal. Biochem. 312, 113–124.
Protein microarrays: challenges and promises - Google Search [WWW Document], n.d. URL https://www.google.ca/search?q=Ashley+Publications+Ltdwww.ashley-pub.comPERSPECTIVE2002+%C2%A9+Ashley+Publications+Ltd++ISSN+1462-2416Pharmacogenomics(2002)3(4)1Protein+microarrays:+challenges+and+promises&ie=utf-8&oe=utf-8&gws_rd=cr&ei=BkBYWP6pNIbRjAPWwrFY#q=Protein+microarrays:+challenges+and+promises (accessed 12.19.16).

69
Rao, V.S., Srinivas, K., Sujini, G.N., Kumar, G.N., 2014. Protein-protein interaction detection: methods and analysis. Int. J. Proteomics 2014.
Rusling, J.F., Kumar, C.V., Gutkind, J.S., Patel, V., 2010. Measurement of biomarker proteins for point-of-care early detection and monitoring of cancer. Analyst 135, 2496–2511.
Rusmini, F., Zhong, Z., Feijen, J., 2007. Protein Immobilization Strategies for Protein Biochips. Biomacromolecules 8, 1775–1789. doi:10.1021/bm061197b
SadAbadi, H., Badilescu, S., Packirisamy, M., Wüthrich, R., 2013. Integration of gold nanoparticles in PDMS microfluidics for lab-on-a-chip plasmonic biosensing of growth hormones. Biosens. Bioelectron. 44, 77–84. doi:10.1016/j.bios.2013.01.016
Sargentini, V., Mariotti, S., Carrara, S., Gagliardi, M., Teloni, R., Goletti, D., Nisini, R., 2009. Cytometric detection of antigen-specific IFN-γ/IL-2 secreting cells in the diagnosis of tuberculosis. BMC Infect. Dis. 9, 99. doi:10.1186/1471-2334-9-99
Schramm, W., Paek, S.-H., Voss, G., 1993. Strategies for the immobilization of antibodies. Immunomethods 3, 93–103.
Sedighi, A., Li, P.C.H., 2014. Kras gene codon 12 mutation detection enabled by gold nanoparticles conducted in a nanobioarray chip. Anal. Biochem. 448, 58–64. doi:10.1016/j.ab.2013.11.019
Sedighi, A., Li, P.C.H., Pekcevik, I.C., Gates, B.D., 2014. A Proposed Mechanism of the Influence of Gold Nanoparticles on DNA Hybridization. ACS Nano 8, 6765–6777. doi:10.1021/nn500790m
Sedighi, A., Whitehall, V., Li, P.C., 2015. Enhanced destabilization of mismatched DNA using gold nanoparticles offers specificity without compromising sensitivity for nucleic acid analyses. Nano Res. 8, 3922–3933.
Sen, P., Yamaguchi, S., Tahara, T., 2008. New Insight into the Surface Denaturation of Proteins: Electronic Sum Frequency Generation Study of Cytochrome c at Water Interfaces. J. Phys. Chem. B 112, 13473–13475. doi:10.1021/jp8061288
Stenken, J.A., Poschenrieder, A.J., 2015. Bioanalytical chemistry of cytokines–A review. Anal. Chim. Acta 853, 95–115.
Strano, V., Urso, R.G., Scuderi, M., Iwu, K.O., Simone, F., Ciliberto, E., Spinella, C., Mirabella, S., 2014. Double role of HMTA in ZnO nanorods grown by chemical bath deposition. J. Phys. Chem. C 118, 28189–28195.
Sugunan, A., Warad, H.C., Boman, M., Dutta, J., 2006. Zinc oxide nanowires in chemical bath on seeded substrates: role of hexamine. J. Sol-Gel Sci. Technol. 39, 49–56.

70
Suh, D.-I., Byeon, C.C., Lee, C.-L., 2010. Synthesis and optical characterization of vertically grown ZnO nanowires in high crystallinity through vapor–liquid–solid growth mechanism. Appl. Surf. Sci. 257, 1454–1456.
Sutandy, F.X.R., Qian, J., Chen, C.-S., Zhu, H., 2013. Overview of Protein Microarrays, in: Coligan, J.E., Dunn, B.M., Speicher, D.W., Wingfield, P.T. (Eds.), Current Protocols in Protein Science. John Wiley & Sons, Inc., Hoboken, NJ, USA, pp. 27.1.1–27.1.16.
Talapatra, A., Rouse, R., Hardiman, G., 2002. Protein microarrays: challenges and promises. Pharmacogenomics 3, 527–536.
Tam, S.W., Wiese, R., Lee, S., Gilmore, J., Kumble, K.D., 2002. Simultaneous analysis of eight human Th1/Th2 cytokines using microarrays. J. Immunol. Methods 261, 157–165.
Tanaka, G., Funabashi, H., Mie, M., Kobatake, E., 2006. Fabrication of an antibody microwell array with self-adhering antibody binding protein. Anal. Biochem. 350, 298–303.
Topoglidis, E., Cass, A.E.G., O’Regan, B., Durrant, J.R., 2001. Immobilisation and bioelectrochemistry of proteins on nanoporous TiO2 and ZnO films. J. Electroanal. Chem. 517, 20–27. doi:10.1016/S0022-0728(01)00673-8
Urbanowska, T., Mangialaio, S., Hartmann, C., Legay, F., 2003. Development of protein microarray technology to monitor biomarkers of rheumatoid arthritis disease. Cell Biol. Toxicol. 19, 189–202.
Vashist, S.K., Schneider, E.M., Luong, J.H., 2015. Rapid sandwich ELISA-based in vitro diagnostic procedure for the highly-sensitive detection of human fetuin A. Biosens. Bioelectron. 67, 73–78.
Wang, L., 2012. Microfluidic microarray for pathogenic DNA Analysis: single-base-pair-mismatch discrimination, and modeling/simulation of centrifugal flows and dynamic hybridization. Science: Department of Chemistry.
Wang, L., Li, P.C.H., 2010. Optimization of a microfluidic microarray device for the fast discrimination of fungal pathogenic DNA. Anal. Biochem. 400, 282–288. doi:10.1016/j.ab.2010.01.017
Wang, L., Li, P.C.H., 2007. Flexible Microarray Construction and Fast DNA Hybridization Conducted on a Microfluidic Chip for Greenhouse Plant Fungal Pathogen Detection. J. Agric. Food Chem. 55, 10509–10516. doi:10.1021/jf0721242
Wang, S., Ge, L., Song, X., Yu, J., Ge, S., Huang, J., Zeng, F., 2012. Paper-based chemiluminescence ELISA: lab-on-paper based on chitosan modified paper device and wax-screen-printing. Biosens. Bioelectron. 31, 212–218.

71
Wautelet, M., 2001. Scaling laws in the macro-, micro-and nanoworlds. Eur. J. Phys. 22, 601.
Weber, P.C., Ohlendorf, D.H., Wendoloski, J.J., Salemme, F.R., 1989. Structural Origins of High-Affinity Biotin Binding to Streptavidin. Science 243, 85–88.
Wen, X., He, H., Lee, L.J., 2009. Specific antibody immobilization with biotin-poly(l-lysine)-g-poly(ethylene glycol) and protein A on microfluidic chips. J. Immunol. Methods 350, 97–105. doi:10.1016/j.jim.2009.07.011
Whitesides, G.M., 2006. The origins and the future of microfluidics. Nature 442, 368–373. doi:10.1038/nature05058
Wilson, D.S., Nock, S., 2002. Functional protein microarrays. Curr. Opin. Chem. Biol. 6, 81–85.
Wu, T., Ding, H., Han, J., Arriens, C., Wei, C., Han, W., Pedroza, C., Jiang, S., Anolik, J., Petri, M., others, 2016. Antibody array based proteomic screening of serum markers in systemic lupus erythematosus–a discovery study. J. Proteome Res.
Yang, C.-Y., Brooks, E., Li, Y., Denny, P., Ho, C.-M., Qi, F., Shi, W., Wolinsky, L., Wu, B., Wong, D.T.W., Montemagno, C.D., 2005. Detection of picomolar levels of interleukin-8 in human saliva by SPR. Lab. Chip 5, 1017–1023. doi:10.1039/b504737d
Yang, L., Wang, Z., Deng, Y., Li, Y., Wei, W., Shi, Q., 2016. Single-Cell, Multiplexed Protein Detection of Rare Tumor Cells Based on a Beads-on-Barcode Antibody Microarray. Anal. Chem. 88, 11077–11083. doi:10.1021/acs.analchem.6b03086
Zhang, Y., Ram, M.K., Stefanakos, E.K., Goswami, D.Y., 2012. Synthesis, characterization, and applications of ZnO nanowires. J. Nanomater. 2012, 20.
Zhong, L., Hidalgo, G.E., Stromberg, A.J., Khattar, N.H., Jett, J.R., Hirschowitz, E.A., 2005. Using protein microarray as a diagnostic assay for non–small cell lung cancer. Am. J. Respir. Crit. Care Med. 172, 1308–1314.
Zhu, H., Klemic, J.F., Chang, S., Bertone, P., Casamayor, A., Klemic, K.G., Smith, D., Gerstein, M., Reed, M.A., Snyder, M., 2000. Analysis of yeast protein kinases using protein chips. Nat. Genet. 26, 283–289.

72
Appendix A. Kinetic studies: effect of protein G sub-layer on antibody-antigen interactions
The association rate constant (ka) and dissociation rate constant (kd) between human interleukin-6 (IL-6) and anti-IL-6 capture antibody were measured using the surface plasmon resonance (SPR) technique in the presence and absence of a protein G sub-layer. All the measurements were performed on BIAcore X100 (GE Healthcare).
Either the protein G or capture antibody molecules were immobilized on the CM5 sensor chip as instructed by the protocols provided by the manufacturer. Briefly, the sensor chip surface was activated by a 1:1 mixture of 1-ethyl-3-(3-dimethylaminopropyl) carbodiimide (EDC) and N-hydroxysuccinimide (NHS). These reagents converted the surface carboxylic groups to succinimide groups that are required to react with amine groups on proteins. Next, either protein G and/or capture antibody molecules were immobilized on the sensor surface by running the solution over the sensor surface. The concentrations of anti-IL-6 capture antibody and protein G were 125 µg/mL and 1 mg/mL, respectively. Finally, unreacted succinimide groups were deactivated using an ethanolamine hydrochloride solution (pH 8.5).
Different concentrations of human IL-6 (25, 15, 7.5, 5, 3 ng/mL) were used in a multi-cycle analysis approach to determine the rate constants for interactions between anti-IL-6 capture antibody and IL-6 protein using BIAevaluation software. The results are presented in table A1 below.
Table A1. Kinetic constants for interaction between anti-IL-6 capture antibody and IL-6 protein in the presence and absence of protein G sub-layer
Surface Association rate constant (ka) Dissociation rate constant (kd) anti-IL-6 capture antibody 2.88×10⁴ 1.72×10⁻⁴
Protein G + anti-IL-6 capture antibody 3.65×10⁵ 2.32×10⁻³
The results show an increase in association rate of Ab-Ag interactions in the presence of a protein G sub-layer. This may be due to the well-oriented immobilization of capture antibody molecules, and therefore their ease to interact with IL-6 molecules.