A micro-analytical approach to partition coeffi cients in ...
27
Revista Brasileira de Geociências Arquivo digital disponível on-line no site www.sbgeo.org.br 263 41(2): 263-289, junho de 2011 A micro-analytical approach to partition coefficients in plagioclase and clinopyroxene of basaltic sills in Serra Geral Formation, Paraná Basin, Brazil Leonardo Cardoso Renner 1 , Léo Afraneo Hartmann 2 , Wilson Wildner 3 , Hans-Joachim Massonne 4 & Thomas Theye 4 Abstract In the present study, detailed micro-analytical data (major and trace elements) in minerals from sills of Serra Geral Formation represents the first attempt to evaluate the partition coefficient of Sc, Ti, V, Cr, Co, Ni, Cu, Zn, Rb, Sr, Y, Zr, Nb, Mo, Cs, Ba, REE, Hf, Ta, Pb, Th and U among coexisting plagioclase, augite and pigeonite from 12 tholeiitic basaltic sills along the eastern border of the Paraná Basin, Brazil. These 12 samples come from Rio Grande do Sul, Paraná, São Paulo and Goiás states. Plagioclase/melt partition coefficients K D were determined in core, intermediate and rim zones using LA-ICP-MS and the results were compared with the variations of the elements Ca, Al, Na and Si in those areas. Partition coefficients of Sr and Eu decrease with the increase of Ca concentration in plagioclase. A reduction in temperature and consequently a rise in Na and Si levels increase the partition coefficients of Sr and Eu at the rim of mineral The K D of Ni and V in clinopyroxene has positive correlations with Mg 2+ , Ca 2+ and Al 3+ due to higher concentrations of those elements at the core and lower concentration towards the rim and negative correlations of K D of Sc, Cr, Co, Pb and Lu, due to preferential substitutions by Fe 2+ in sixfold coordination. The use of LA-ICP-MS and EPMA made possible the chemical quantification of major and trace elements and the determination of partition coefficients in coexisting plagioclase and clinopyroxene in basaltic melts. Keywords: Partition coefficient, plagioclase, clinopyroxene, Serra Geral Formation, LA-ICP-MS. Resumo Uma abordagem microanalítica dos coeficientes de partição em plagioclásio e clinopiroxênio de soleiras basálticas da Formação Serra Geral, Bacia do Paraná, Brasil. No presente estudo, dados detalhados de microanálise (elementos maiores e traços) em minerais de sills da Formação Serra Geral representam a primeira tentativa de avaliar o coeficiente de partição de Sc, Ti, V, Cr, Co, Ni, Cu, Zn, Rb, Sr, Y, Zr, Nb, Mo, Cs, Ba, REE, Hf, Ta, Pb, Th e U entre plagioclásio, augita e pigeonita coexistentes em 12 sills basálticos toleíticos ao longo da borda leste da Bacia do Paraná, Brasil. Estas 12 amostras são dos estados do Rio Grande do Sul, Paraná, São Paulo e Goiás. Coeficientes de partição em plagioclásio foram comparados em zonas de núcleo, intermédio e borda, usando LA-ICP-MS, e os resultados foram comparados com as variações das áreas de distribuição dos elementos Ca, Al, Na e Si. O coeficiente de partição do Sr e Eu diminui com o aumento da concentração de Ca no plagioclásio e aumenta para a borda, relacionado com o aumento da concentração de Na e Si e diminuição da temperatura. O K D do Ni e V nos clinopiroxênios analisados possui correlações positivas para Mg 2+ , Ca 2+ e Al 3+ devido a altas concentrações destes elementos no núcleo, diminuindo para a borda, e correlações negativas de K D Sc, Cr, Co, Pb e Lu, devido a substituição preferencial pelo Fe 2+ em coordenações octaédricas. O uso de LA-ICP-MS e EPMA possibilitam a caracterização química de elementos maiores e traços e a determinação do coeficiente de partição em minerais coexistentes e o líquido. Palavras-chave: Coeficiente de partição, plagioclásio, clinopiroxênio, Formação Serra Geral, LA-ICP-MS. INTRODUCTION Continental flood basalts are major igneous units and their investigation enables to understand the processes active in the mantle and crust. The Serra Geral Formation of South America comprises the Paraná magmatic province, constituted by basalts, basaltic andesites and acid rocks. Recent technological advances, such as the spot LA-ICP-MS analysis of selected small portions of crystals, have opened a window into processes related to the crystallization of the magmas. This is a detailed investigation of trace element content and zonation in plagioclase and clinopyroxene from Paraná province sills and dykes and of their partition coefficients with the magmatic liquid. Micro-analytical data (EPMA and LA-ICP-MS) and partitioning coefficients of Sc, Ti, V, Cr, Co, Ni, Cu, Zn, Rb, Sr, Y, Zr, Nb, Mo, Cs, Ba, REE, Hf, Ta, Pb, Th and U between plagioclase and clinopyroxene in basalt and andesite basaltic melts is here intensively 1 - Programa de Pós-graduação em Geociências, Instituto de Geociências, Universidade Federal do Rio Grande do Sul, Porto Alegre (RS), Brazil. E-mail: [email protected] 2 - Instituto de Geociências, Universidade Federal do Rio Grande do Sul, Porto Alegre (RS), Brazil. E-mail: [email protected] 3 - CPRM/SUREG-PA, Serviço Geológico do Brasil, Porto Alegre (RS), Brazil. E-mail: [email protected] 4 - Institut für Mineralogie und Kristallchemie, Stuttgart Universität, Germany. E-mail: [email protected], [email protected]
Transcript of A micro-analytical approach to partition coeffi cients in ...

Revista Brasileira de Geociências
Arquivo digital disponível on-line no site www.sbgeo.org.br 263
41(2): 263-289, junho de 2011
A micro-analytical approach to partition coeffi cients in plagioclase and clinopyroxene of basaltic sills in Serra Geral Formation, Paraná Basin, Brazil
Leonardo Cardoso Renner1, Léo Afraneo Hartmann2, Wilson Wildner3, Hans-Joachim Massonne4 & Thomas Theye4
Abstract In the present study, detailed micro-analytical data (major and trace elements) in minerals from sills of Serra Geral Formation represents the fi rst attempt to evaluate the partition coeffi cient of Sc, Ti, V, Cr, Co, Ni, Cu, Zn, Rb, Sr, Y, Zr, Nb, Mo, Cs, Ba, REE, Hf, Ta, Pb, Th and U among coexisting plagioclase, augite and pigeonite from 12 tholeiitic basaltic sills along the eastern border of the Paraná Basin, Brazil. These 12 samples come from Rio Grande do Sul, Paraná, São Paulo and Goiás states. Plagioclase/melt partition coeffi cients KD were determined in core, intermediate and rim zones using LA-ICP-MS and the results were compared with the variations of the elements Ca, Al, Na and Si in those areas. Partition coeffi cients of Sr and Eu decrease with the increase of Ca concentration in plagioclase. A reduction in temperature and consequently a rise in Na and Si levels increase the partition coeffi cients of Sr and Eu at the rim of mineral The KD of Ni and V in clinopyroxene has positive correlations with Mg2+, Ca2+ and Al3+ due to higher concentrations of those elements at the core and lower concentration towards the rim and negative correlations of KD of Sc, Cr, Co, Pb and Lu, due to preferential substitutions by Fe2+ in sixfold coordination. The use of LA-ICP-MS and EPMA made possible the chemical quantifi cation of major and trace elements and the determination of partition coeffi cients in coexisting plagioclase and clinopyroxene in basaltic melts.
Keywords: Partition coeffi cient, plagioclase, clinopyroxene, Serra Geral Formation, LA-ICP-MS.
Resumo Uma abordagem microanalítica dos coefi cientes de partição em plagioclásio e clinopiroxênio de soleiras basálticas da Formação Serra Geral, Bacia do Paraná, Brasil. No presente estudo, dados detalhados de microanálise (elementos maiores e traços) em minerais de sills da Formação Serra Geral representam a primeira tentativa de avaliar o coefi ciente de partição de Sc, Ti, V, Cr, Co, Ni, Cu, Zn, Rb, Sr, Y, Zr, Nb, Mo, Cs, Ba, REE, Hf, Ta, Pb, Th e U entre plagioclásio, augita e pigeonita coexistentes em 12 sills basálticos toleíticos ao longo da borda leste da Bacia do Paraná, Brasil. Estas 12 amostras são dos estados do Rio Grande do Sul, Paraná, São Paulo e Goiás. Coefi cientes de partição em plagioclásio foram comparados em zonas de núcleo, intermédio e borda, usando LA-ICP-MS, e os resultados foram comparados com as variações das áreas de distribuição dos elementos Ca, Al, Na e Si. O coefi ciente de partição do Sr e Eu diminui com o aumento da concentração de Ca no plagioclásio e aumenta para a borda, relacionado com o aumento da concentração de Na e Si e diminuição da temperatura. O KD do Ni e V nos clinopiroxênios analisados possui correlações positivas para Mg2+, Ca2+ e Al3+ devido a altas concentrações destes elementos no núcleo, diminuindo para a borda, e correlações negativas de KD Sc, Cr, Co, Pb e Lu, devido a substituição preferencial pelo Fe2+ em coordenações octaédricas. O uso de LA-ICP-MS e EPMA possibilitam a caracterização química de elementos maiores e traços e a determinação do coefi ciente de partição em minerais coexistentes e o líquido.
Palavras-chave: Coefi ciente de partição, plagioclásio, clinopiroxênio, Formação Serra Geral, LA-ICP-MS.
INTRODUCTION Continental fl ood basalts are major igneous units and their investigation enables to understand the processes active in the mantle and crust. The Serra Geral Formation of South America comprises the Paraná magmatic province, constituted by basalts, basaltic andesites and acid rocks. Recent technological advances, such as the spot LA-ICP-MS analysis of selected small portions of crystals, have opened a window into processes related to the crystallization
of the magmas. This is a detailed investigation of trace element content and zonation in plagioclase and clinopyroxene from Paraná province sills and dykes and of their partition coeffi cients with the magmatic liquid.
Micro-analytical data (EPMA and LA-ICP-MS) and partitioning coeffi cients of Sc, Ti, V, Cr, Co, Ni, Cu, Zn, Rb, Sr, Y, Zr, Nb, Mo, Cs, Ba, REE, Hf, Ta, Pb, Th and U between plagioclase and clinopyroxene in basalt and andesite basaltic melts is here intensively
1 - Programa de Pós-graduação em Geociências, Instituto de Geociências, Universidade Federal do Rio Grande do Sul, Porto Alegre (RS), Brazil. E-mail: [email protected] - Instituto de Geociências, Universidade Federal do Rio Grande do Sul, Porto Alegre (RS), Brazil. E-mail: [email protected] - CPRM/SUREG-PA, Serviço Geológico do Brasil, Porto Alegre (RS), Brazil. E-mail: [email protected] - Institut für Mineralogie und Kristallchemie, Stuttgart Universität, Germany. E-mail: [email protected], [email protected]

Revista Brasileira de Geociências, volume 41 (2), 2011264
A micro-analytical approach to partition coeffi cients in plagioclase and clinopyroxene of basaltic sills in Serra Geral Formation, Paraná Basin, Brazil
used in sills of Serra Geral Formation, Paraná Basin, Brazil (Fig. 1). We also utilize chemical data to examine how variations in major components in the plagioclase and clinopyroxene infl uence KD in basalt and basaltic andesite melts.
Plagioclase is affected by rebalancing of Ca2+Al3+ ↔ Na+Si4+ infl uencing in partition coeffi cients such as Sr, Eu and Pb in core, intermediate and rim zones. Clinopyroxene exerts major control on distributions of some trace elements and REE in substitutions of Fe and Mg (sixfold coordination), Ca (eightfold coordination) and Al (six or fourfold coordination).
The recent advances of micro-analytical techniques allow to determine the concentration of major, trace and REE elements in diversity zones of minerals, characterizing the chemical order of crystallization and observing probable variables that can infl uence in mineral/melt partition coeffi cients such as T, P, fO2 and bulk composition.
ANALYTICAL METHODS Samples were collected during fi eld trips in Rio Grande do Sul state, Brazil by CPRM (Geological Survey of Brazil) projects in the last fi ve years. These samples are representative of sills in
Figure 1 - Geological map showing the general rocks and distribution of sill samples of Paraná Basin in South America. Modifi ed from Bellieni et al. (1986), Melfi et al. (1988), Nardy et al. (2002) and Machado (2003).
Revista Brasileira de Geociências, volume 41 (2), 2011 265
Leonardo Cardoso Renner et al.
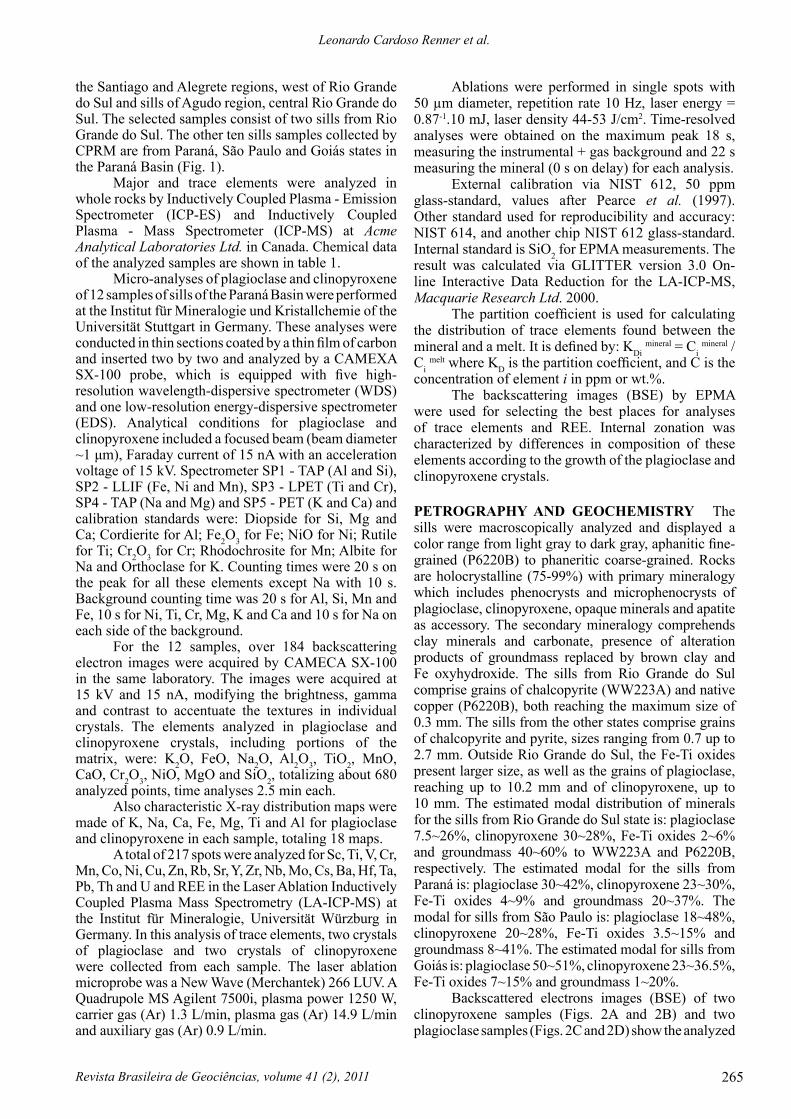
the Santiago and Alegrete regions, west of Rio Grande do Sul and sills of Agudo region, central Rio Grande do Sul. The selected samples consist of two sills from Rio Grande do Sul. The other ten sills samples collected by CPRM are from Paraná, São Paulo and Goiás states in the Paraná Basin (Fig. 1).
Major and trace elements were analyzed in whole rocks by Inductively Coupled Plasma - Emission Spectrometer (ICP-ES) and Inductively Coupled Plasma - Mass Spectrometer (ICP-MS) at Acme Analytical Laboratories Ltd. in Canada. Chemical data of the analyzed samples are shown in table 1.
Micro-analyses of plagioclase and clinopyroxene of 12 samples of sills of the Paraná Basin were performed at the Institut für Mineralogie und Kristallchemie of the Universität Stuttgart in Germany. These analyses were conducted in thin sections coated by a thin fi lm of carbon and inserted two by two and analyzed by a CAMEXA SX-100 probe, which is equipped with fi ve high-resolution wavelength-dispersive spectrometer (WDS) and one low-resolution energy-dispersive spectrometer (EDS). Analytical conditions for plagioclase and clinopyroxene included a focused beam (beam diameter ~1 μm), Faraday current of 15 nA with an acceleration voltage of 15 kV. Spectrometer SP1 - TAP (Al and Si), SP2 - LLIF (Fe, Ni and Mn), SP3 - LPET (Ti and Cr), SP4 - TAP (Na and Mg) and SP5 - PET (K and Ca) and calibration standards were: Diopside for Si, Mg and Ca; Cordierite for Al; Fe2O3 for Fe; NiO for Ni; Rutile for Ti; Cr2O3 for Cr; Rhodochrosite for Mn; Albite for Na and Orthoclase for K. Counting times were 20 s on the peak for all these elements except Na with 10 s. Background counting time was 20 s for Al, Si, Mn and Fe, 10 s for Ni, Ti, Cr, Mg, K and Ca and 10 s for Na on each side of the background.
For the 12 samples, over 184 backscattering electron images were acquired by CAMECA SX-100 in the same laboratory. The images were acquired at 15 kV and 15 nA, modifying the brightness, gamma and contrast to accentuate the textures in individual crystals. The elements analyzed in plagioclase and clinopyroxene crystals, including portions of the matrix, were: K2O, FeO, Na2O, Al2O3, TiO2, MnO, CaO, Cr2O3, NiO, MgO and SiO2, totalizing about 680 analyzed points, time analyses 2.5 min each.
Also characteristic X-ray distribution maps were made of K, Na, Ca, Fe, Mg, Ti and Al for plagioclase and clinopyroxene in each sample, totaling 18 maps.
A total of 217 spots were analyzed for Sc, Ti, V, Cr, Mn, Co, Ni, Cu, Zn, Rb, Sr, Y, Zr, Nb, Mo, Cs, Ba, Hf, Ta, Pb, Th and U and REE in the Laser Ablation Inductively Coupled Plasma Mass Spectrometry (LA-ICP-MS) at the Institut für Mineralogie, Universität Würzburg in Germany. In this analysis of trace elements, two crystals of plagioclase and two crystals of clinopyroxene were collected from each sample. The laser ablation microprobe was a New Wave (Merchantek) 266 LUV. A Quadrupole MS Agilent 7500i, plasma power 1250 W, carrier gas (Ar) 1.3 L/min, plasma gas (Ar) 14.9 L/min and auxiliary gas (Ar) 0.9 L/min.
Ablations were performed in single spots with 50 μm diameter, repetition rate 10 Hz, laser energy = 0.87-1.10 mJ, laser density 44-53 J/cm2. Time-resolved analyses were obtained on the maximum peak 18 s, measuring the instrumental + gas background and 22 s measuring the mineral (0 s on delay) for each analysis.
External calibration via NIST 612, 50 ppm glass-standard, values after Pearce et al. (1997). Other standard used for reproducibility and accuracy: NIST 614, and another chip NIST 612 glass-standard. Internal standard is SiO2 for EPMA measurements. The result was calculated via GLITTER version 3.0 On-line Interactive Data Reduction for the LA-ICP-MS, Macquarie Research Ltd. 2000.
The partition coeffi cient is used for calculating the distribution of trace elements found between the mineral and a melt. It is defi ned by: KDi
mineral = Ci mineral /
Ci melt where KD is the partition coeffi cient, and C is the
concentration of element i in ppm or wt.%.The backscattering images (BSE) by EPMA
were used for selecting the best places for analyses of trace elements and REE. Internal zonation was characterized by differences in composition of these elements according to the growth of the plagioclase and clinopyroxene crystals.
PETROGRAPHY AND GEOCHEMISTRY The sills were macroscopically analyzed and displayed a color range from light gray to dark gray, aphanitic fi ne-grained (P6220B) to phaneritic coarse-grained. Rocks are holocrystalline (75-99%) with primary mineralogy which includes phenocrysts and microphenocrysts of plagioclase, clinopyroxene, opaque minerals and apatite as accessory. The secondary mineralogy comprehends clay minerals and carbonate, presence of alteration products of groundmass replaced by brown clay and Fe oxyhydroxide. The sills from Rio Grande do Sul comprise grains of chalcopyrite (WW223A) and native copper (P6220B), both reaching the maximum size of 0.3 mm. The sills from the other states comprise grains of chalcopyrite and pyrite, sizes ranging from 0.7 up to 2.7 mm. Outside Rio Grande do Sul, the Fe-Ti oxides present larger size, as well as the grains of plagioclase, reaching up to 10.2 mm and of clinopyroxene, up to 10 mm. The estimated modal distribution of minerals for the sills from Rio Grande do Sul state is: plagioclase 7.5~26%, clinopyroxene 30~28%, Fe-Ti oxides 2~6% and groundmass 40~60% to WW223A and P6220B, respectively. The estimated modal for the sills from Paraná is: plagioclase 30~42%, clinopyroxene 23~30%, Fe-Ti oxides 4~9% and groundmass 20~37%. The modal for sills from São Paulo is: plagioclase 18~48%, clinopyroxene 20~28%, Fe-Ti oxides 3.5~15% and groundmass 8~41%. The estimated modal for sills from Goiás is: plagioclase 50~51%, clinopyroxene 23~36.5%, Fe-Ti oxides 7~15% and groundmass 1~20%.
Backscattered electrons images (BSE) of two clinopyroxene samples (Figs. 2A and 2B) and two plagioclase samples (Figs. 2C and 2D) show the analyzed

Revista Brasileira de Geociências, volume 41 (2), 2011266
A micro-analytical approach to partition coeffi cients in plagioclase and clinopyroxene of basaltic sills in Serra Geral Formation, Paraná Basin, Brazil
presents Ca concentration at the core higher than at rim identifying a normal crystallization from high to low temperature.
Bulk rock analyses (Tab. 1) led to chemical classifi cation of the studied rock into basalt and basaltic andesite based on alkali-silica diagram, Zanettin (1984). Na2O+K2O versus SiO2 wt.%. SiO2 concentrations varying from 48.6 to 54.7 wt.% and concentrations of Na2O+K2O between 3 to 5 wt.%. Using as well the major elements A = (Na2O+K2O), F = (FeO) and M = (MgO) in wt.% as shown in the AFM diagram (Irvine & Baragar 1971), all samples plot in tholeiitic magmas.
The EPMA analyses of clinopyroxene and plagioclase crystals were done on the same areas where LA-ICP-MS analyses were carried out. We also performed analyses showing lines along minerals highlighting the chemical differences in core, intermediate and rim zones (Fig. 2).
spots (laser ablation craters in A). The red circles indicate the area of laser ablation analyses and small fi lled circles show EPMA analyses. Clinopyroxene and plagioclase display chemical zoning in all crystals examined, but this zoning is either faded or banded in BSE images. In the BSE of clinopyroxene crystals (Fig. 2A), we can see a brighter rim and a diminishing intensity towards its core, identifying Fe increase from the core towards the rim, Ca and Mg decreasing concentration from core towards the rim. Thus we classify the clinopyroxene core as a high temperature augite and rim as being pigeonite of lower temperature (Fig. 2B). Figure 2D shows plagioclase oscillatory zonations identifi ed in some of the studied plagioclase samples. The zonations vary according to their chemical composition, core is Ca rich and darker rim is Na rich. The rim portions display higher Si, Na and K concentrations and lower Al and Ca concentrations. In most of the samples, plagioclase
Figure 2 - Backscattered electron images of clinopyroxene (A-) and plagioclase (C-D) analyzed in this study. Open circles show LA-ICP-MS analyses locations. The fi lled circles show EPMA analyses locations. (A) showing laser ablation craters. Recommendations by the IUGS Subcommission on the Systematics of Metamorphic Rocks: Pl = plagioclase; Qtz = quartz; Kfs = feldspar-K; Aug = augite; Pgt = pigeonite; Op = opaque minerals and Cb = carbonate minerals.
Revista Brasileira de Geociências, volume 41 (2), 2011 267
Leonardo Cardoso Renner et al.
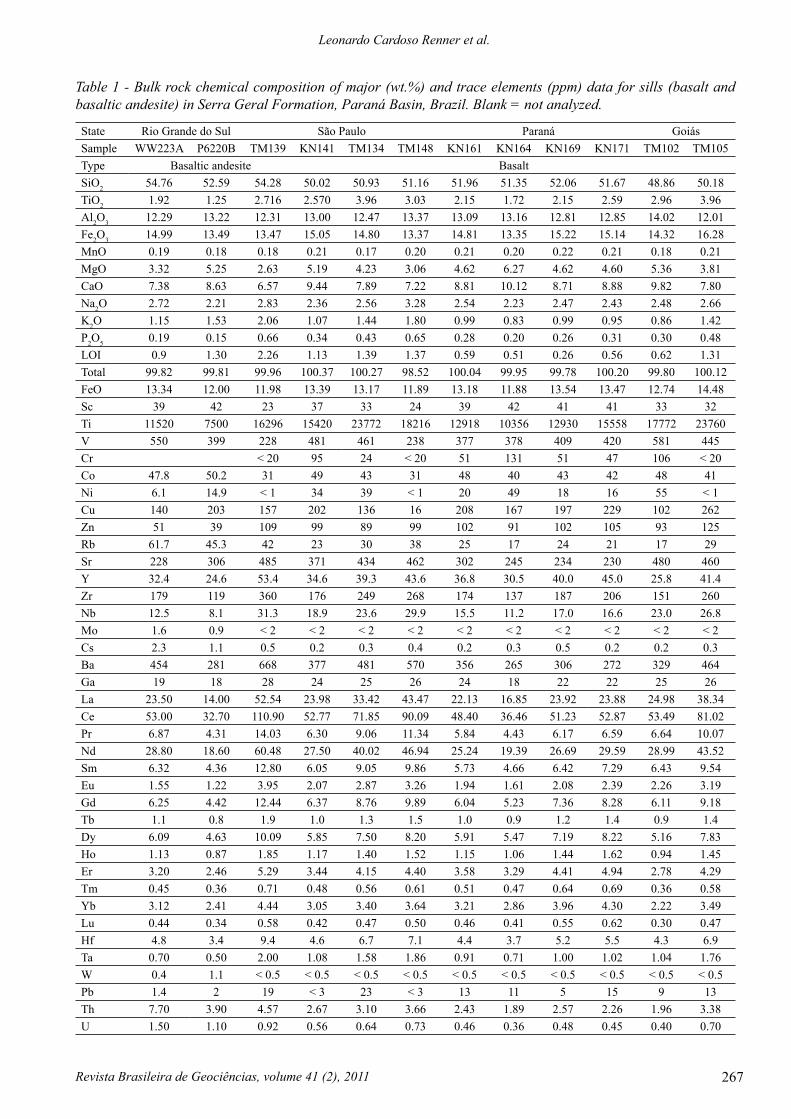
Table 1 - Bulk rock chemical composition of major (wt.%) and trace elements (ppm) data for sills (basalt and basaltic andesite) in Serra Geral Formation, Paraná Basin, Brazil. Blank = not analyzed.
State Rio Grande do Sul São Paulo Paraná GoiásSample WW223A P6220B TM139 KN141 TM134 TM148 KN161 KN164 KN169 KN171 TM102 TM105Type Basaltic andesite BasaltSiO2 54.76 52.59 54.28 50.02 50.93 51.16 51.96 51.35 52.06 51.67 48.86 50.18TiO2 1.92 1.25 2.716 2.570 3.96 3.03 2.15 1.72 2.15 2.59 2.96 3.96Al2O3 12.29 13.22 12.31 13.00 12.47 13.37 13.09 13.16 12.81 12.85 14.02 12.01Fe2O3 14.99 13.49 13.47 15.05 14.80 13.37 14.81 13.35 15.22 15.14 14.32 16.28MnO 0.19 0.18 0.18 0.21 0.17 0.20 0.21 0.20 0.22 0.21 0.18 0.21MgO 3.32 5.25 2.63 5.19 4.23 3.06 4.62 6.27 4.62 4.60 5.36 3.81CaO 7.38 8.63 6.57 9.44 7.89 7.22 8.81 10.12 8.71 8.88 9.82 7.80Na2O 2.72 2.21 2.83 2.36 2.56 3.28 2.54 2.23 2.47 2.43 2.48 2.66K2O 1.15 1.53 2.06 1.07 1.44 1.80 0.99 0.83 0.99 0.95 0.86 1.42P2O5 0.19 0.15 0.66 0.34 0.43 0.65 0.28 0.20 0.26 0.31 0.30 0.48LOI 0.9 1.30 2.26 1.13 1.39 1.37 0.59 0.51 0.26 0.56 0.62 1.31Total 99.82 99.81 99.96 100.37 100.27 98.52 100.04 99.95 99.78 100.20 99.80 100.12FeO 13.34 12.00 11.98 13.39 13.17 11.89 13.18 11.88 13.54 13.47 12.74 14.48Sc 39 42 23 37 33 24 39 42 41 41 33 32 Ti 11520 7500 16296 15420 23772 18216 12918 10356 12930 15558 17772 23760V 550 399 228 481 461 238 377 378 409 420 581 445 Cr < 20 95 24 < 20 51 131 51 47 106 < 20Co 47.8 50.2 31 49 43 31 48 40 43 42 48 41 Ni 6.1 14.9 < 1 34 39 < 1 20 49 18 16 55 < 1Cu 140 203 157 202 136 16 208 167 197 229 102 262 Zn 51 39 109 99 89 99 102 91 102 105 93 125 Rb 61.7 45.3 42 23 30 38 25 17 24 21 17 29 Sr 228 306 485 371 434 462 302 245 234 230 480 460 Y 32.4 24.6 53.4 34.6 39.3 43.6 36.8 30.5 40.0 45.0 25.8 41.4 Zr 179 119 360 176 249 268 174 137 187 206 151 260 Nb 12.5 8.1 31.3 18.9 23.6 29.9 15.5 11.2 17.0 16.6 23.0 26.8 Mo 1.6 0.9 < 2 < 2 < 2 < 2 < 2 < 2 < 2 < 2 < 2 < 2Cs 2.3 1.1 0.5 0.2 0.3 0.4 0.2 0.3 0.5 0.2 0.2 0.3 Ba 454 281 668 377 481 570 356 265 306 272 329 464 Ga 19 18 28 24 25 26 24 18 22 22 25 26 La 23.50 14.00 52.54 23.98 33.42 43.47 22.13 16.85 23.92 23.88 24.98 38.34 Ce 53.00 32.70 110.90 52.77 71.85 90.09 48.40 36.46 51.23 52.87 53.49 81.02 Pr 6.87 4.31 14.03 6.30 9.06 11.34 5.84 4.43 6.17 6.59 6.64 10.07 Nd 28.80 18.60 60.48 27.50 40.02 46.94 25.24 19.39 26.69 29.59 28.99 43.52 Sm 6.32 4.36 12.80 6.05 9.05 9.86 5.73 4.66 6.42 7.29 6.43 9.54 Eu 1.55 1.22 3.95 2.07 2.87 3.26 1.94 1.61 2.08 2.39 2.26 3.19 Gd 6.25 4.42 12.44 6.37 8.76 9.89 6.04 5.23 7.36 8.28 6.11 9.18 Tb 1.1 0.8 1.9 1.0 1.3 1.5 1.0 0.9 1.2 1.4 0.9 1.4 Dy 6.09 4.63 10.09 5.85 7.50 8.20 5.91 5.47 7.19 8.22 5.16 7.83 Ho 1.13 0.87 1.85 1.17 1.40 1.52 1.15 1.06 1.44 1.62 0.94 1.45 Er 3.20 2.46 5.29 3.44 4.15 4.40 3.58 3.29 4.41 4.94 2.78 4.29 Tm 0.45 0.36 0.71 0.48 0.56 0.61 0.51 0.47 0.64 0.69 0.36 0.58 Yb 3.12 2.41 4.44 3.05 3.40 3.64 3.21 2.86 3.96 4.30 2.22 3.49 Lu 0.44 0.34 0.58 0.42 0.47 0.50 0.46 0.41 0.55 0.62 0.30 0.47 Hf 4.8 3.4 9.4 4.6 6.7 7.1 4.4 3.7 5.2 5.5 4.3 6.9 Ta 0.70 0.50 2.00 1.08 1.58 1.86 0.91 0.71 1.00 1.02 1.04 1.76 W 0.4 1.1 < 0.5 < 0.5 < 0.5 < 0.5 < 0.5 < 0.5 < 0.5 < 0.5 < 0.5 < 0.5Pb 1.4 2 19 < 3 23 < 3 13 11 5 15 9 13 Th 7.70 3.90 4.57 2.67 3.10 3.66 2.43 1.89 2.57 2.26 1.96 3.38U 1.50 1.10 0.92 0.56 0.64 0.73 0.46 0.36 0.48 0.45 0.40 0.70
Revista Brasileira de Geociências, volume 41 (2), 2011268
A micro-analytical approach to partition coeffi cients in plagioclase and clinopyroxene of basaltic sills in Serra Geral Formation, Paraná Basin, Brazil
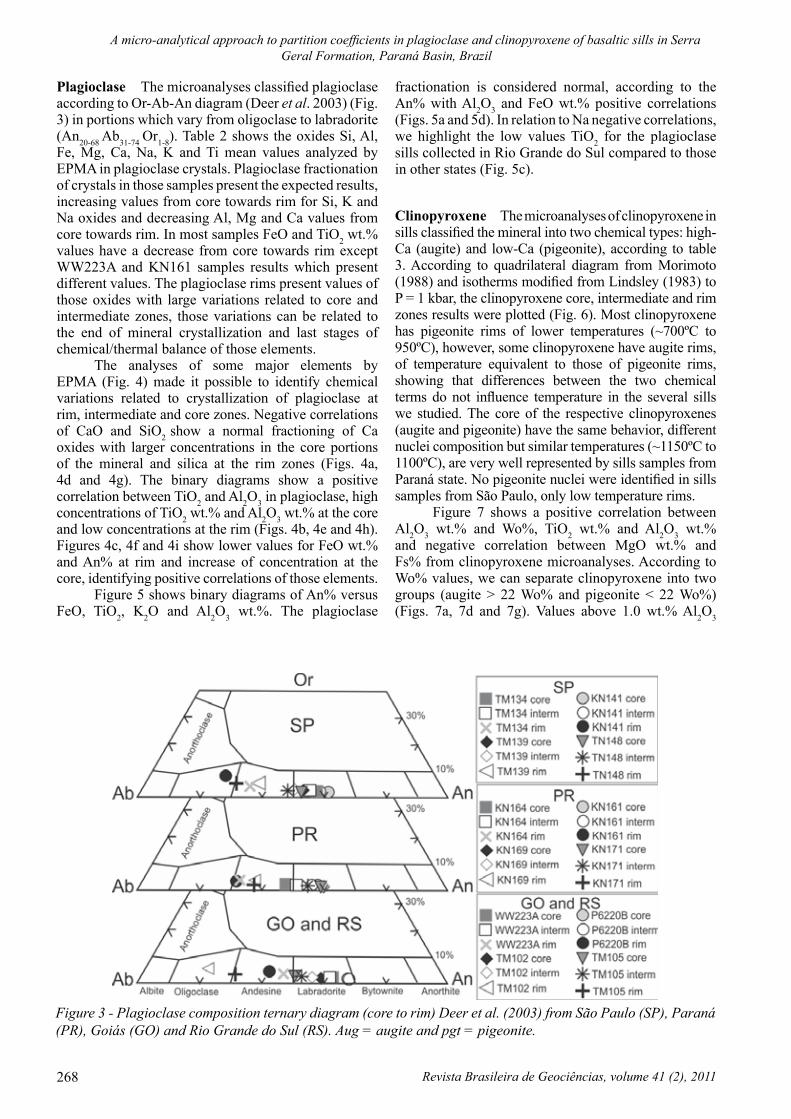
Plagioclase The microanalyses classifi ed plagioclase according to Or-Ab-An diagram (Deer et al. 2003) (Fig. 3) in portions which vary from oligoclase to labradorite (An20-68 Ab31-74 Or1-8). Table 2 shows the oxides Si, Al, Fe, Mg, Ca, Na, K and Ti mean values analyzed by EPMA in plagioclase crystals. Plagioclase fractionation of crystals in those samples present the expected results, increasing values from core towards rim for Si, K and Na oxides and decreasing Al, Mg and Ca values from core towards rim. In most samples FeO and TiO2 wt.% values have a decrease from core towards rim except WW223A and KN161 samples results which present different values. The plagioclase rims present values of those oxides with large variations related to core and intermediate zones, those variations can be related to the end of mineral crystallization and last stages of chemical/thermal balance of those elements.
The analyses of some major elements by EPMA (Fig. 4) made it possible to identify chemical variations related to crystallization of plagioclase at rim, intermediate and core zones. Negative correlations of CaO and SiO2 show a normal fractioning of Ca oxides with larger concentrations in the core portions of the mineral and silica at the rim zones (Figs. 4a, 4d and 4g). The binary diagrams show a positive correlation between TiO2 and Al2O3 in plagioclase, high concentrations of TiO2 wt.% and Al2O3 wt.% at the core and low concentrations at the rim (Figs. 4b, 4e and 4h). Figures 4c, 4f and 4i show lower values for FeO wt.% and An% at rim and increase of concentration at the core, identifying positive correlations of those elements.
Figure 5 shows binary diagrams of An% versus FeO, TiO2, K2O and Al2O3 wt.%. The plagioclase
fractionation is considered normal, according to the An% with Al2O3 and FeO wt.% positive correlations (Figs. 5a and 5d). In relation to Na negative correlations, we highlight the low values TiO2 for the plagioclase sills collected in Rio Grande do Sul compared to those in other states (Fig. 5c).
Clinopyroxene The microanalyses of clinopyroxene in sills classifi ed the mineral into two chemical types: high-Ca (augite) and low-Ca (pigeonite), according to table 3. According to quadrilateral diagram from Morimoto (1988) and isotherms modifi ed from Lindsley (1983) to P = 1 kbar, the clinopyroxene core, intermediate and rim zones results were plotted (Fig. 6). Most clinopyroxene has pigeonite rims of lower temperatures (~700ºC to 950ºC), however, some clinopyroxene have augite rims, of temperature equivalent to those of pigeonite rims, showing that differences between the two chemical terms do not infl uence temperature in the several sills we studied. The core of the respective clinopyroxenes (augite and pigeonite) have the same behavior, different nuclei composition but similar temperatures (~1150ºC to 1100ºC), are very well represented by sills samples from Paraná state. No pigeonite nuclei were identifi ed in sills samples from São Paulo, only low temperature rims.
Figure 7 shows a positive correlation between Al2O3 wt.% and Wo%, TiO2 wt.% and Al2O3 wt.% and negative correlation between MgO wt.% and Fs% from clinopyroxene microanalyses. According to Wo% values, we can separate clinopyroxene into two groups (augite > 22 Wo% and pigeonite < 22 Wo%) (Figs. 7a, 7d and 7g). Values above 1.0 wt.% Al2O3
Figure 3 - Plagioclase composition ternary diagram (core to rim) Deer et al. (2003) from São Paulo (SP), Paraná (PR), Goiás (GO) and Rio Grande do Sul (RS). Aug = augite and pgt = pigeonite.

Revista Brasileira de Geociências, volume 41 (2), 2011 269
Leonardo Cardoso Renner et al.
Tabl
e 2
- Sel
ecte
d pl
agio
clas
e m
ajor
mic
roan
alys
is E
PMA
(wt.%
) in
core
, int
erm
edia
te a
nd ri
m zo
nes.
Stat
eRi
o G
rand
e do
Sul
São
Paul
o
Sam
ple
WW
223A
P622
0BTM
139
KN
141
Mea
nσ
Mea
nσ
Mea
nσ
Mea
nσ
Mea
nσ
Mea
nσ
Mea
nσ
Mea
nσ
Mea
nσ
Mea
nσ
Mea
nσ
Mea
nσ
Co
ren=
5In
term
n=5
Rim
n=1
Core
n=2
Inte
rmn=
3Ri
mn=
2Co
ren=
8In
term
n=11
Rim
n=7
Cor
en=
4In
term
n=8
Rim
n=2
SiO
251
.51
3.68
51.7
10.
1255
.44
49.6
21.
1449
.41.
4556
.42
7.57
53.8
51.
0154
.41
1.50
57.6
30.
1650
.56
3.11
51.3
83.
4259
.96
0.72
Al 2O
328
.66
2.20
28.2
80.
0126
.34
29.2
70.
2529
.31
0.42
25.0
43.
6227
.04
0.14
26.5
60.
3124
.91
0.25
28.3
31.
8527
.94
1.98
22.7
40.
40
FeO
0.
710.
150.
840.
160.
850.
750.
070.
80.
10.
690.
340.
690.
000.
650.
070.
560.
150.
740.
140.
750.
170.
420.
03
MgO
0.
110.
010.
120.
030.
040.
180.
080.
140.
050.
050.
050.
130.
020.
100.
030.
030.
000.
120.
030.
110.
050.
030.
03
CaO
12.9
72.
8612
.73
0.22
9.68
13.9
80.
7614
.13
1.04
8.38
5.57
11.0
20.
4310
.41
0.88
7.73
0.15
12.7
62.
7212
.00
2.91
5.12
0.57
Na 2O
4.
151.
554.
270.
166.
033.
610.
43.
580.
66.
322.
575.
260.
305.
540.
476.
820.
214.
321.
454.
571.
417.
770.
01
K2O
0.39
0.20
0.35
0.00
0.61
0.22
0.02
0.22
0.08
0.71
0.56
0.45
0.02
0.50
0.07
0.91
0.12
0.28
0.13
0.33
0.17
1.38
0.71
TiO
20.
050.
020.
050.
010.
060.
040.
020.
030.
010.
050.
020.
100.
010.
090.
020.
060.
000.
080.
020.
080.
010.
050.
00
H2O
1.41
1.64
0.94
2.3
2.36
2.31
1.43
1.71
1.31
2.78
2.84
2.51
Tota
l10
0.00
100.
0010
0.00
100.
0010
0.00
100.
0010
0.00
100.
0010
0.00
100.
0010
0.00
100.
00
Ab
(%)
35.9
037
.00
51.2
031
.40
31.0
055
.30
45.2
047
.70
58.3
037
.40
40.0
067
.50
An
(%)
61.9
061
.00
45.4
067
.30
67.7
040
.60
52.3
049
.50
36.5
061
.00
58.1
024
.60
Or (
%)
2.20
2.
00
3.40
1.
30
1.30
4.
10
2.50
2.
80
5.10
1.
60
1.90
7.
90
Stat
eSã
o Pa
ulo
Para
ná
Sam
ple
TM13
4TM
148
KN
161
KN
164
Mea
nσ
Mea
nσ
Mea
nσ
Mea
nσ
Mea
nσ
Mea
nσ
Mea
nσ
Mea
nσ
Mea
nσ
Mea
nσ
Mea
nσ
Mea
nσ
Co
ren=
7In
term
n=11
Rim
n=7
Core
n=13
Inte
rmn=
25Ri
mn=
14Co
ren=
4In
term
n=21
Rim
n=4
Cor
en=
9In
term
n=12
Rim
n=9
SiO
252
.86
1.14
53.3
91.
7658
.67
0.95
54.3
20.
4355
.47
0.61
60.3
90.
9552
.31
1.14
52.6
20.
1358
.84
0.72
56.1
55.
9955
.25
3.43
60.3
72.
29
Al 2O
328
.07
0.87
27.8
31.
1024
.76
0.81
27.5
20.
1126
.91
0.02
24.0
00.
1028
.13
0.90
27.8
10.
1624
.05
0.45
26.9
53.
5127
.33
2.03
24.5
00.
99
FeO
0.
790.
040.
710.
050.
640.
030.
680.
010.
620.
000.
540.
170.
460.
090.
540.
020.
540.
080.
590.
270.
650.
180.
520.
20
MgO
0.
130.
010.
110.
040.
050.
010.
080.
010.
070.
000.
040.
020.
090.
030.
090.
010.
010.
010.
060.
050.
060.
040.
020.
01
CaO
11.9
40.
8611
.53
1.41
7.11
0.99
10.8
00.
089.
880.
146.
120.
2912
.03
0.88
11.7
20.
156.
510.
619.
774.
6710
.39
2.77
6.55
1.71
Na 2O
4.
740.
394.
980.
777.
010.
655.
270.
025.
760.
107.
590.
174.
700.
544.
950.
087.
840.
195.
832.
595.
441.
537.
510.
77
σ =
stan
dart
devi
atio
n, In
term
= in
term
edia
ry a
nd n
= n
umbe
r of a
naly
ses.
To b
e co
ntin
ued

Revista Brasileira de Geociências, volume 41 (2), 2011270
A micro-analytical approach to partition coeffi cients in plagioclase and clinopyroxene of basaltic sills in Serra Geral Formation, Paraná Basin, Brazil
Tabl
e 2
cont
inua
tion
Stat
eSã
o Pa
ulo
Para
ná
Sam
ple
TM13
4TM
148
KN
161
KN
164
Mea
nσ
Mea
nσ
Mea
nσ
Mea
nσ
Mea
nσ
Mea
nσ
Mea
nσ
Mea
nσ
Mea
nσ
Mea
nσ
Mea
nσ
Mea
nσ
Co
ren=
7In
term
n=11
Rim
n=7
Core
n=13
Inte
rmn=
25Ri
mn=
14Co
ren=
4In
term
n=21
Rim
n=4
Cor
en=
9In
term
n=12
Rim
n=9
K2O
0.36
0.07
0.40
0.09
0.68
0.20
0.32
0.02
0.41
0.04
0.84
0.15
0.35
0.09
0.34
0.01
0.65
0.18
0.41
0.25
0.39
0.18
0.68
0.14
TiO
20.
100.
010.
090.
020.
050.
020.
070.
000.
050.
000.
040.
000.
050.
010.
070.
000.
030.
000.
050.
000.
070.
000.
050.
02
H2O
0.99
0.93
1.06
0.90
0.82
0.49
1.85
1.84
1.51
0.24
0.39
0.00
Tota
l10
0.00
100.
0010
0.05
100.
0010
0.00
100.
0710
0.00
100.
0010
0.00
100.
0910
0.03
100.
22
Ab
(%)
40.9
042
.90
61.6
046
.00
50.1
065
.90
40.6
042
.50
66.1
050
.70
47.6
064
.90
An
(%)
57.0
054
.80
34.5
052
.10
47.5
029
.30
57.4
055
.60
30.3
046
.90
50.2
031
.30
Or (
%)
2.00
2.
30
3.90
1.
80
2.30
4.
80
2.00
1.
90
3.60
2.
40
2.20
3.
90
Stat
ePa
raná
Goi
ás
Sam
ple
KN
169
KN
171
TM10
2TM
105
Mea
nσ
Mea
nσ
Mea
nσ
Mea
nσ
Mea
nσ
Mea
nσ
Mea
nσ
Mea
nσ
Mea
nσ
Mea
nσ
Mea
nσ
Mea
nσ
Co
ren=
5In
term
n=14
Rim
n=7
Core
n=11
Inte
rmn=
31Ri
mn=
10Co
ren=
4In
term
n=14
Rim
n=1
Cor
en=
5In
term
n=9
Rim
n=7
SiO
253
.02
0.18
53.1
40.
4059
.74
3.16
52.8
40.
9253
.59
0.11
58.3
21.
8051
.59
0.11
52.4
10.
4362
.19
53.9
80.
2253
.26
0.35
59.0
30.
96
Al 2O
328
.75
0.09
28.6
00.
2625
.10
1.75
28.2
80.
4327
.67
0.01
25.0
71.
0328
.34
0.11
27.8
30.
1422
.66
26.8
10.
3427
.26
0.27
24.0
40.
11
FeO
0.
730.
030.
720.
030.
520.
130.
730.
020.
750.
050.
540.
110.
550.
080.
620.
060.
350.
630.
000.
650.
010.
430.
10
MgO
0.
140.
000.
130.
010.
030.
020.
130.
010.
110.
020.
030.
010.
090.
010.
060.
000.
010.
090.
000.
060.
010.
020.
00
CaO
12.4
00.
0512
.31
0.32
7.52
2.31
12.0
70.
6211
.29
0.02
7.56
1.49
12.2
60.
0311
.69
0.20
4.36
10.5
10.
1210
.91
0.00
6.40
0.43
Na 2O
4.
480.
064.
460.
096.
921.
084.
560.
305.
030.
017.
060.
754.
610.
094.
960.
018.
845.
590.
015.
310.
057.
910.
19
K2O
0.27
0.00
0.27
0.02
0.69
0.23
0.26
0.04
0.32
0.00
0.54
0.06
0.32
0.02
0.36
0.01
0.98
0.43
0.00
0.38
0.03
0.63
0.04
TiO
20.
070.
000.
070.
000.
040.
020.
080.
010.
080.
000.
050.
000.
100.
010.
100.
010.
020.
100.
000.
090.
010.
040.
01
H2O
0.12
0.28
0.05
0.02
1.12
0.81
2.12
1.95
0.59
1.84
2.06
1.47
Tota
l10
0.00
100.
0110
0.14
100.
0010
0.00
100.
0010
0.00
100.
0010
0.00
100.
0010
0.00
100.
00
Ab
(%)
38.9
039
.00
60.0
040
.00
43.8
060
.90
39.8
042
.60
74.3
047
.90
45.8
066
.70
An
(%)
59.5
059
.50
36.0
058
.50
54.3
036
.00
58.4
055
.40
20.3
049
.70
52.0
029
.80
Or (
%)
1.50
1.
60
3.90
1.
50
1.80
3.
10
1.80
2.
00
5.40
2.
40
2.20
3.
50
σ =
stan
dart
devi
atio
n, In
term
= in
term
edia
ry a
nd n
= n
umbe
r of a
naly
ses.

Revista Brasileira de Geociências, volume 41 (2), 2011 271
Leonardo Cardoso Renner et al.
classify the core and intermediate portions of the mineral, either augite or pigeonite. Figure 7b shows the values below 1 for TiO and Al2O3 wt.% in rims of augite and pigeonite in Goiás and Rio Grande do Sul states. Negative correlation is identifi ed in diagrams of MgO wt.% versus Fs% in fi gures 7c, 7f and 7i. Figure 7c shows that higher MgO wt.% values are related to clinopyroxene nuclei and pigeonite nuclei to higher values. In fi gures 7c and 7f, there are two trends related to chemical compositions of core, intermediate and rim zones for augite and pigeonite. Figure 7i of São Paulo state does not represent two trends, but presents the highest Fs% values for augite and pigeonite.
The EPMA mean microanalyses of clinopyroxene crystals (Fig. 8) shows TiO2 and Al2O3 wt.% variations versus En, Fs and Wo% contents for samples from
Rio Grande do Sul, Paraná, São Paulo and Goiás. The highest concentration values for TiO2 and Al2O3 wt.% found in clinopyroxene are in São Paulo, followed by Goiás, Paraná and the lowest values are in Rio Grande do Sul. Positive correlations are found in Al2O3 wt.% versus En and Wo% diagram, fi gures 8b and 8f and TiO2 wt.% versus Wo%, fi gures 8a and 8b. Lowest TiO2 wt.% concentrations in clinopyroxene are evidence of low concentration of that oxide in other minerals as plagioclase and Ti-magnetite and ilmenite.
RESULTS - PARTITION COEFFICIENTS The partition coeffi cients of trace elements in plagioclase and clinopyroxene crystals in sills of Serra Geral Formation in Paraná Basin describe the mineral/melt preference. The total rock analyses made it possible to
Figure 4 - CaO wt.% versus SiO2 wt.%, TiO2 wt.% versus Al2O3 wt.% and FeO wt.% versus An% for plagioclase average microanalyses from EPMA in core, intermediate and rim zones. Aug = augite and pgt = pigeonite.

Revista Brasileira de Geociências, volume 41 (2), 2011272
A micro-analytical approach to partition coeffi cients in plagioclase and clinopyroxene of basaltic sills in Serra Geral Formation, Paraná Basin, Brazil
Figure 5 - Binary diagram show the distribution between FeO, K2O, TiO2 and Al2O3 wt.% and anorthite content in plagioclase average microanalyses from EPMA in sills of Serra Geral Formation, Paraná Basin. Black triangle: plagioclase from Goiás; gray triangle: São Paulo; gray lozenge: Paraná; white circle: Rio Grande do Sul.
Figure 6 - Pyroxene classifi cation quadrilateral diagram [Ca, Mg, Fe (Fe + Mn) in mol%] from Morimoto (1988). Isotherms modifi ed Lindsley (1983) to P = 1 kbar. Aug = augite and pgt = pigeonite.

Revista Brasileira de Geociências, volume 41 (2), 2011 273
Leonardo Cardoso Renner et al.
Table 3 - Representative major elements EPMA (wt.%) compositions of clinopyroxene in core, intermediate and rim zones.
State Rio Grande do Sul
Sample WW223A P6220B
Mean σ Mean σ Mean σ Mean σ Mean σ Mean σ Mean σ Mean σ Mean σ
Core Aug n=3 Core
Pgt n=2 Interm Aug n=1 Interm
Pgt n=4 Rim Pgt n=4 Core
Aug n=4 Interm Aug n=5 Rim
Aug n=4
SiO2 50.12 0.31 51.51 0.46 51.01 49.73 1.39 48.27 0.62 50.73 0.29 49.03 0.52 47.4 0.68
Al2O3 1.58 0.31 0.87 0.00 1.54 0.79 0.07 0.66 0.08 1.62 0.26 1.58 0.12 1.15 0.3
FeO 15.22 1.79 24.28 0.78 18.22 27.60 4.39 32.94 1.22 9.71 1.51 12.35 0.54 23.13 0.65
MnO 0.34 0.02 0.50 0.07 0.37 0.56 0.08 0.66 0.01 0.25 0.00 0.26 0.05 0.45 0.15
MgO 15.64 0.55 18.28 1.03 14.27 15.57 3.46 9.21 0.75 17.84 1.25 15.74 0.07 11.47 0.98
CaO 15.65 1.97 4.95 0.28 14.75 4.03 0.22 7.48 2.14 17.89 0.03 17.38 0.78 13.45 3.98
Na2O 0.14 0.04 0.05 0.02 0.12 0.04 0.02 0.07 0.04 0.18 0.04 0.55 0.47 0.18 0.02
TiO2 0.59 0.05 0.36 0.03 0.61 0.36 0.05 0.48 0.03 0.33 0.12 0.41 0.1 0.72 0.04
NiO 0.02 0.03 0.00 0.00 0.06 0.02 0.02 0.01 0.00 0.03 0.00 0.02 0.01 0.02 0.03
Cr2O3 0.03 0.01 0.01 0.01 0.03 0.01 0.01 0.00 0.00 0.05 0.00 0.05 0.01 0.01 0.01
H2O 0.65 0.00 0.00 0.46 0.43 1.37 1.73 1.98
Total 100.00 100.81 101.00 100.07 100.23 100.00 100.00 100.00
Wo (%) 31.58 9.95 30.03 8.45 16.08 35.43 35.38 28.13
En (%) 43.91 51.14 40.42 45.44 27.54 49.16 44.58 33.37
Fs (%) 24.51 38.90 29.55 46.11 56.38 15.40 20.04 38.50
State São Paulo
Sample TM139 KN141
Mean σ Mean σ Mean σ Mean σ Mean σ Mean σ Mean σ Mean σ Mean σ
Core Aug n=8 Interm
Aug n=9 Rim Aug n=1 Rim
Pgt n=3 Core Aug n=6 Interm
Aug n=9 Rim Aug n=1 Rim
Pgt n=1
SiO2 49.07 0.72 49.42 0.50 47.50 48.56 0.51 49.56 0.29 49.15 0.52 47.80 48.39
Al2O3 2.23 0.06 1.65 0.11 0.74 0.67 0.16 1.78 0.19 1.31 0.07 0.86 0.23
FeO 14.86 0.22 16.64 0.58 28.93 31.35 2.75 13.27 0.20 17.97 0.31 23.11 34.32
MnO 0.36 0.01 0.43 0.02 0.76 0.83 0.04 0.32 0.02 0.47 0.01 0.66 0.95
MgO 14.79 0.21 13.87 0.19 9.84 11.82 1.24 14.86 0.34 13.01 0.07 10.56 10.35
CaO 16.36 0.49 16.13 0.23 10.42 5.85 1.03 17.77 0.27 15.97 0.37 14.07 4.46
Na2O 0.23 0.03 0.22 0.01 0.13 0.08 0.01 0.26 0.03 0.21 0.00 0.12 0.07
TiO2 1.29 0.07 0.97 0.06 0.53 0.49 0.10 1.02 0.12 0.85 0.03 0.65 0.35
NiO 0.02 0.01 0.01 0.02 0.00 0.01 0.02 0.01 0.00 0.01 0.01 0.04 0.03
Cr2O3 0.01 0.00 0.01 0.01 0.00 0.00 0.01 0.00 0.00 0.01 0.00 0.01 0.00
H2O 0.82 0.70 1.12 0.43 1.14 1.04 2.10 0.84
Total 100.03 100.07 100.00 100.09 100.00 100.00 100.00 100.00
Wo (%) 33.51 33.08 22.03 12.34 36.22 32.95 29.73 9.61
En (%) 42.15 39.58 28.95 34.68 42.15 37.35 31.05 31.04
Fs (%) 24.34 27.34 49.02 52.98 21.63 29.71 39.22 59.35
σ = standart deviation, Interm = intermediary, Aug = augite and Pgt = pigeonite and n = number of analyses.To be continued

Revista Brasileira de Geociências, volume 41 (2), 2011274
A micro-analytical approach to partition coeffi cients in plagioclase and clinopyroxene of basaltic sills in Serra Geral Formation, Paraná Basin, Brazil
Table 3 continuation
State Paraná
Sample KN169 KN171
Mean σ Mean σ Mean σ Mean σ Mean σ Mean σ Mean σ Mean σ Mean σ
Core Aug n=14 Interm
Aug n=14 Rim Pgt n=10 Core
Aug n=10 Core Pgt n=3 Interm
Aug n=20 Interm Pgt n=2 Rim
Aug n=3 Rim Pgt n=4
SiO2 50.35 0.29 49.61 0.38 48.01 0.44 50.30 0.35 52.33 0.45 49.87 0.47 51.20 0.09 48.49 0.80 47.51 0.23
Al2O3 1.16 0.09 1.05 0.10 0.57 0.11 1.51 0.21 0.95 0.24 1.40 0.26 0.81 0.07 0.48 0.25 0.50 0.16
FeO 19.59 1.12 23.42 2.17 35.57 2.84 16.35 0.61 18.04 0.74 17.51 2.43 23.28 0.25 27.70 1.13 35.90 2.49
MnO 0.44 0.03 0.55 0.04 0.78 0.06 0.38 0.04 0.39 0.03 0.41 0.08 0.48 0.02 0.62 0.03 0.78 0.05
MgO 12.63 0.43 10.37 1.22 7.65 1.26 14.35 0.35 22.16 0.67 13.11 1.45 18.55 0.33 6.21 0.18 7.50 0.82
CaO 15.03 0.88 14.35 1.02 6.95 1.45 15.54 0.60 5.20 1.40 16.00 0.97 4.98 0.31 15.52 1.01 6.77 1.84
Na2O 0.16 0.03 0.16 0.04 0.07 0.03 0.20 0.04 0.05 0.04 0.19 0.04 0.06 0.04 0.15 0.06 0.08 0.03
TiO2 0.74 0.06 0.71 0.07 0.49 0.06 0.89 0.12 0.40 0.06 0.89 0.10 0.48 0.01 0.36 0.21 0.50 0.05
NiO 0.02 0.02 0.01 0.02 0.02 0.02 0.01 0.02 0.04 0.01 0.02 0.03 0.03 0.02 0.01 0.01 0.01 0.01
Cr2O3 0.01 0.01 0.00 0.00 0.01 0.01 0.01 0.01 0.05 0.01 0.01 0.01 0.01 0.01 0.00 0.01 0.00 0.00
H2O 0.05 0.02 0.05 0.46 0.47 0.60 0.12 0.43 0.45
Total 100.19 100.25 100.16 100.00 100.10 100.01 100.00 100.00 100.00
Wo (%) 31.16 30.21 15.12 32.00 10.31 33.17 10.09 33.54 14.77
En (%) 36.43 30.38 23.15 41.11 61.15 37.82 52.31 18.67 22.76
Fs (%) 32.42 39.41 61.73 26.90 28.54 29.01 37.60 47.79 62.47
State Goiás
Sample TM102 TM105
Mean σ Mean σ Mean σ Mean σ Mean σ Mean σ Mean σ Mean σ Mean σ
Core Aug n=8 Interm
Aug n=10 Rim Aug n=4 Rim
Pgt n=1 Core Aug n=7 Interm
Aug n=8 Rim Aug n=1 Rim
Pgt n=2
SiO2 49.71 0.55 49.64 0.28 49.82 0.34 50.32 49.98 0.15 49.78 0.13 48.35 49.28 0.69
Al2O3 2.26 0.24 2.04 0.32 1.23 0.53 0.58 1.42 0.02 1.22 0.04 0.42 0.66 0.23
FeO 10.34 0.47 11.32 0.86 16.09 3.42 23.46 14.62 0.12 16.62 0.57 22.50 26.95 4.65
MnO 0.25 0.03 0.27 0.04 0.37 0.05 0.55 0.39 0.02 0.43 0.01 0.55 0.71 0.13
MgO 15.81 0.40 15.34 0.36 12.30 2.70 20.17 14.17 0.22 13.15 0.31 8.31 14.09 2.52
CaO 18.95 0.47 18.71 0.34 17.64 1.21 3.13 17.51 0.23 16.93 0.25 18.11 6.78 1.36
Na2O 0.27 0.02 0.29 0.02 0.57 0.63 0.04 0.24 0.02 0.21 0.01 0.24 0.09 0.07
TiO2 1.10 0.12 1.13 0.09 0.67 0.34 0.44 0.87 0.01 0.78 0.01 0.38 0.44 0.09
NiO 0.04 0.03 0.02 0.03 0.04 0.03 0.05 0.01 0.01 0.02 0.01 0.00 0.02 0.02
Cr2O3 0.14 0.07 0.05 0.06 0.01 0.01 0.02 0.00 0.00 0.01 0.00 0.00 0.00 0.00
H2O 1.12 1.18 1.25 1.25 0.77 0.84 1.12 0.97
Total 100.00 100.00 100.00 100.00 100.00 100.00 100.00 100.00
Wo (%) 38.50 38.10 37.05 6.27 35.77 34.88 37.99 14.13
En (%) 44.70 43.47 35.95 56.20 40.28 37.70 24.26 40.86
Fs (%) 16.80 18.43 27.00 37.54 23.95 27.43 37.75 45.01
σ = standart deviation, Interm = intermediary, Aug = augite and Pgt = pigeonite and n = number of analyses.

Revista Brasileira de Geociências, volume 41 (2), 2011 275
Leonardo Cardoso Renner et al.
the values, thus obtaining KD not only in the grain as a whole but in several portions of the crystal, allowing the understanding of the grain genesis and trace elements interaction in the temperature and crystallization ranges in these minerals.
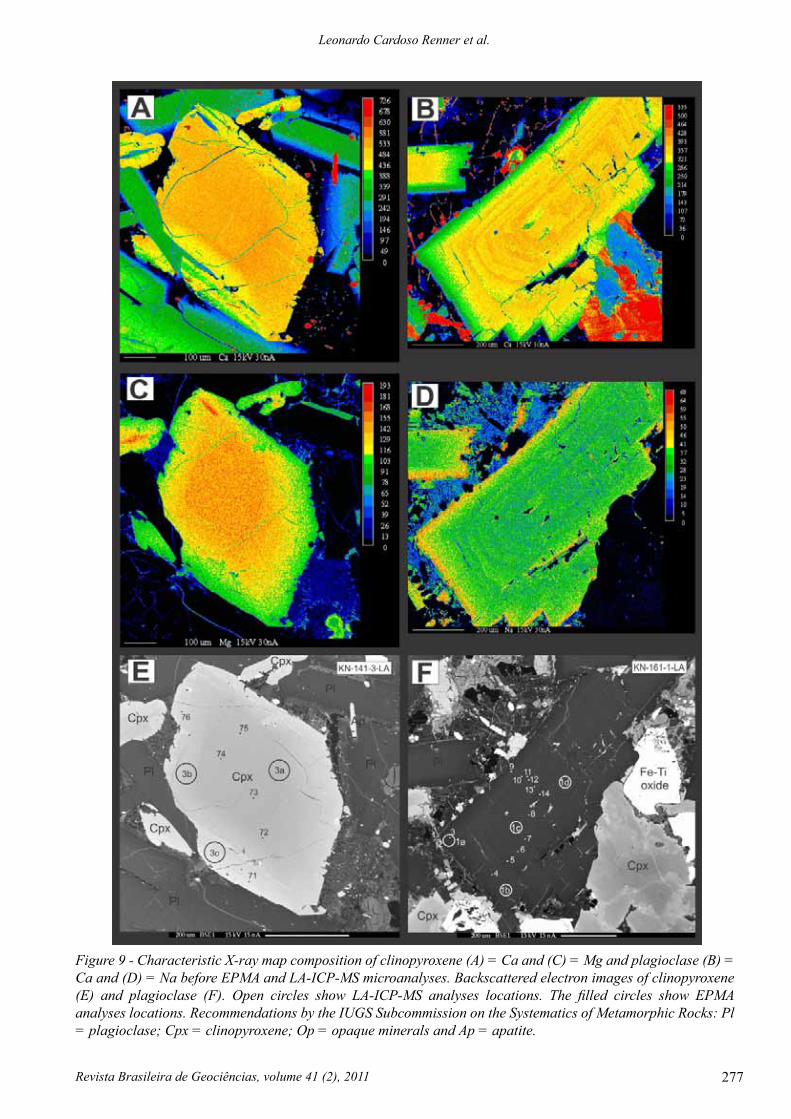
Characteristic X-ray maps were done with the help of EPMA which resulted in different maps: K, Na, Ca, Fe, Mg, Ti and Al. In the present study, we selected one clinopyroxene crystal (KN141 - Ca and Mg elements) and one plagioclase crystal (KN161 - Ca and Na) to illustrate these maps. The characteristic X-ray map and backscattering images showing the EPMA analyses and LA-ICP-MS for different trace elements are shown in fi gure 9.
quantify the elements concentration of the melt and the analyses results of LA-ICP-MS quantifi ed the values in ppm of the trace elements of core, intermediate and rim zones in those minerals. Table 4 shows data compilation of partition coeffi cients for elements in basaltic andesite and basalt which were studied by several authors in the 60 s and 90 s. It is worth mentioning that the KD determination in those decades was carried out by separating minerals of interest from the rocks for further analyses by means of AAS and XRF according to available technology in that time.
The coeffi cient of partition in plagioclase and clinopyroxene crystals in this study are based on the use of advanced spot techniques of analyses, avoiding inclusions, zones and fractures which may interfere in
Figure 7 - Al2O3 wt.% versus Wo%, TiO2 wt.% versus Al2O3 wt.% and MgO wt.% versus Fs% for clinopyroxene average microanalyses from EPMA in core, intermediate and rim zones from São Paulo (SP), Paraná (PR), Goiás (GO) and Rio Grande do Sul (RS). Aug = augite and pgt = pigeonite.

Revista Brasileira de Geociências, volume 41 (2), 2011276
A micro-analytical approach to partition coeffi cients in plagioclase and clinopyroxene of basaltic sills in Serra Geral Formation, Paraná Basin, Brazil
Plagioclase In the studied rocks, plagioclase displays zonation in most of the analyzed crystals, identifying core, intermediate and rim. Those zonations were previously identifi ed by microscope and backscattering images.
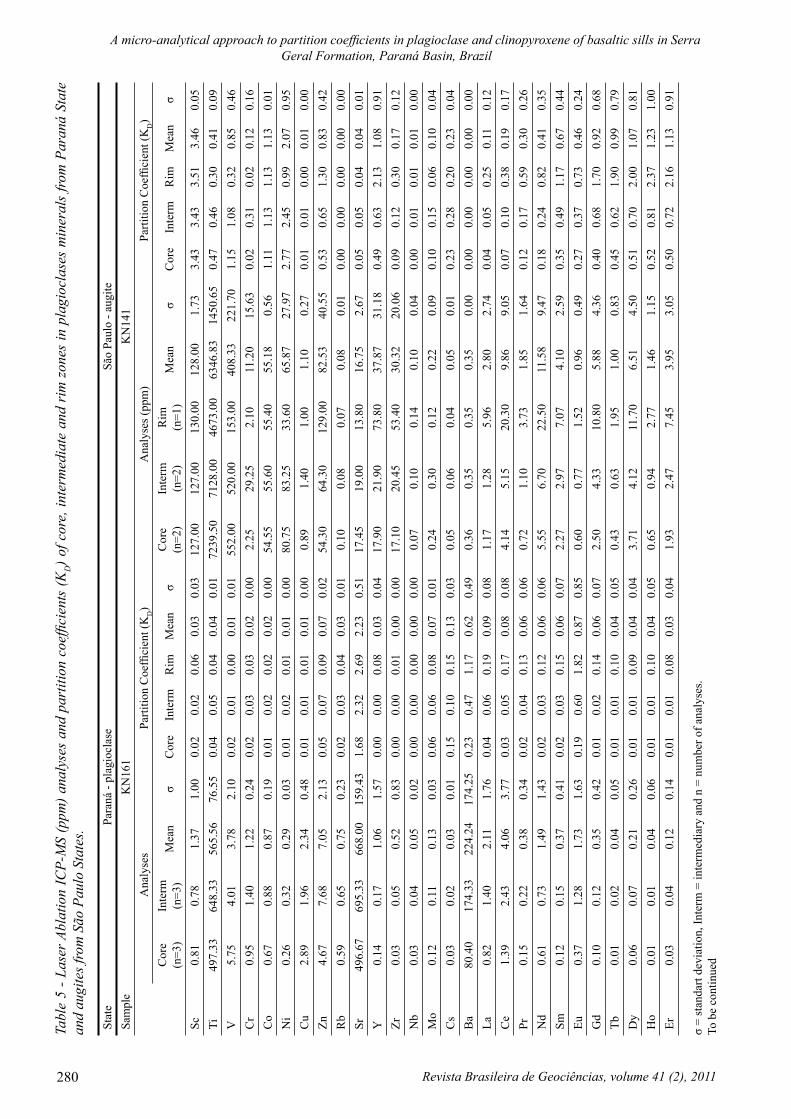
The LA-ICP-MS microanalyses in core, intermediate and rim zones in plagioclase crystals of Serra Geral Formation sills, Paraná Basin, were able
to identify variations in the partition coeffi cient shown in table 5. In this table, only the mean of two analyzed plagioclase crystals of KN161 sample from Paraná state and the mean of two augite crystals (KN141) from São Paulo state are discussed.
The most compatible element with plagioclase is Sr, followed by Eu and Pb (LILE) with compatible values at rim in some of the plagioclase.
Figure 8 - Clinopyroxene average values of TiO2, and Al2O3 wt.% versus En, Fs and Wo% content in sills of Serra Geral Formation, Paraná Basin. Black triangle: clinopyroxene of Goiás; gray triangle: São Paulo; gray lozenge: Paraná; white circle: Rio Grande do Sul.
Revista Brasileira de Geociências, volume 41 (2), 2011 277
Leonardo Cardoso Renner et al.
Figure 9 - Characteristic X-ray map composition of clinopyroxene (A) = Ca and (C) = Mg and plagioclase (B) = Ca and (D) = Na before EPMA and LA-ICP-MS microanalyses. Backscattered electron images of clinopyroxene (E) and plagioclase (F). Open circles show LA-ICP-MS analyses locations. The fi lled circles show EPMA analyses locations. Recommendations by the IUGS Subcommission on the Systematics of Metamorphic Rocks: Pl = plagioclase; Cpx = clinopyroxene; Op = opaque minerals and Ap = apatite.

Revista Brasileira de Geociências, volume 41 (2), 2011278
A micro-analytical approach to partition coeffi cients in plagioclase and clinopyroxene of basaltic sills in Serra Geral Formation, Paraná Basin, Brazil
Table 6 shows the plagioclase compatible elements in the different analyzed samples. The mean values for partition coeffi cients for plagioclase analyses are shown in table 7. Only two samples (KN164 and KN161) present negative anomalies of REE, different from the other samples which show low and positive REE concentrations.
The concentrations in variation in elements Sr, Ba, Eu and Pb from core to rim are common for all the plagioclases with a normal crystallization. This fact occurs because of the valence similarity and ionic radius between the Ca2+ (0.99 Å in eightfold coordination) and Na+ (0.95 Å in eightfold coordination) with this elements. Ca low concentrations at rim of plagioclase
Table 4 - Mineral/melt partition coeffi cients for basalt and basaltic andesite liquids compiled from 37 published experimental studies. Blank = not found.
Clinopyroxene Plagioclase Clinopyroxene Plagioclase
Basalt Basaltic andesite Basalt Basaltic
andesite Basalt Basaltic andesite Basalt Basaltic
andesite
Sc 1.42(1)-3.3(2) 2.2-3.5(3) 0.008(2)-0.1(4) Ce 0.017(26)-1.05(28)
0.09(29)-0.58(20) 0.016(17)-0.2(11) 0.06(8)-0.14(7)
Ti 0.37(1)-0.45(5) 0.19-0.34(3) 0.038(6) 0.04-0.057(7) Pr 0.04(30)-0.626(9) 0.635-1.012(20)
0.063(19)-0.17(11) 0.035-0.13(7)
V 0.74(6)-4.82(1) 0.5-7.2(8) 0.01(6) 0.022-0.032(7) Nd 0.06(30)-0.69(28) 0.5(8)-1.31(20)
0.014(17)-0.168(19)
0.026(7)-0.15(8)
Cr 2.94-26.91(9) 9.7(3)-70(8) 0.02(6)-0.6(4) 0.075(7) Sm 0.462(5) 0.50(36)-0.445(37)
0.067(36)-0.072(37) 0.0394(37)
Mn 0.55-1.31(12) 1.2-1.8(3) 0.04(13)-0.07(6) Eu 0.2(30)-0.87(18) 0.09(8)-1.2(20)
0.062(19)-1.526(18) 0.06(8)-0.79(7)
Co 0.68-1.22(12) 1.2(10)-2.4(3) 0.07-0.5(4) Gd 0.24-0.84(31) 0.778-1.24(20)
0.004(7)-0.066(11)
0.016(7)-0.08(8)
Ni 1.2-10(14) 4(10)-10(3) 0.04-0.5(4) Tb 0.28-1.124(9) 0.57(10)-1.33(20) 0.013(2)-0.11(4) 0.04-0.061(7)
Cu 0.071(2)-0.36(15)
0.05(10)-0.69(3)
0.004(2)-0.17(6) 0.07-0.38(3) Dy 0.256(32)-
1.18(28)0.764-1.09(20)
0.018(33)-0.314(19)
0.011(7)-0.06(8)
Zn 0.5(6) 0.24-0.31(10) 0.11(6)-0.18(13) Ho 0.3-1(30) 0.712-1.13(20)
0.011(2)-0.048(11)
Rb 0.011(11)-0.13(4) 0.01-0.04(8) 0.016(16)-0.3(4) 0.008(7)-
0.19(8) Er 0.259(32)-1.17(28)
0.615-0.922(20)
0.018(19)-0.041(11)
0.005(7)-0.06(27)
Sr 0.04(17)-0.44(18) 0.6-0.9(8) 1.55(17)-10(4) 1.3(8)-3.5(7) Tm 0.2(30)-1.047(9) 0.036(11)
Y 0.29-1.71(9) 0.66-1.12(20) 0.023-0.03(19) 0.01-0.038(7) Yb 0.178(23)-1.14(31)
0.09-1.03(20)
0.004(17)-0.04(34) 0.004(7)-0.3(8)
Zr 0.001(9)-0.7(21) 0.235-0.382(20) 0.01(22)-0.27(4) 0.0009(7) Lu 0.006(9)-1.12(28) 0.55-0.6(10) 0.007(19)-
0.037(33)0.031-
0.043(27)
Nb 0.004-0.065(21)
0.025-0.121(20) 0.01(11) 0.008-0.045(7) Hf 0.004(9)-0.48(4) 0.3(10)-
0.589(20) 0.01(11)-0.13(4) 0.02(10)
Mo 0.39(7) Ta 0.011-0.261(21) 0.013(36) 0.04-0.08(4) 0.027-0.11(7)
Cs 0.001(23)-0.13(4)
0.026-0.048(20) 0.13(4)-1(13) 0.022-0.067(7) Pb 0.005(24)-
0.014(5)0.102-
0.126(20) 0.36(11)-0.76(13) 0.18-1.07(7)
Ba 0.0001(24)-0.05(5)
0.002(25)-0.2(8) 0.183(19)-3.6(4) 0.03(8)-1.45(7) Th 0.0003(11)-
0.04(4)0.019-
0.038(20) 0.05-0.09(4) 0.01(10)0.19(7)
La 0.002(26)-0.21(9)
0.12(10)-0.4(20) 0.02(17)-0.3(11) 0.075(7)-
0.227(27) U 0.0003(23)-0.06(35)
0.02(20)-0.04(10) 0.06-0.1(4) 0.01(10)-0.34(7)
(1)=Jenner et al. 1993; (2)=Paster et al. 1974; (3)=Ewart et al. 1973; (4)=Villemant et al. 1981; (5)=Hauri et al. 1994; (6)=Bougault & Hekinian, 1974; (7)=Dunn & Sen, 1994; (8)=Reid, 1983; (9)=Skulski et al. 1994; (10)=Dostal et al. 1983; (11)=McKenzie & O´Nions, 1991; (12)=Dale & Henderson, 1972; (13)=Kravuchuk et al. 1981; (14)=Duke, 1976; (15)=Hart & Dunn, 1993; (16)=Matsui et al. 1977; (17)=McKay et al. 1994; (18)=Sun et al. 1974; (19)=Bindeman et al. 1998; (20)=Larsen, 1979; (21)=Forsythe et al. 1994; (22)=McCallum & Charette, 1978; (23)=Watson et al. 1987; (24)=Beattie, 1993; (25)=Hart & Brooks, 1974; (26)=Frey, 1969; (27)=Drake & Weill, 1975; (28)=Nagasawa, 1973; (29)=Gaetani & Grove, 1995; (30)=Irving & Frey, 1984; (31)=Hack et al. 1994; (32)=Sobolev et al. 1996; (33)=Schnetzler & Philpotts, 1970; (34)=Ringwood, 1970, (35)=Benjamin et al. 1978, (36)=Arth, 1976 and (37)=Fujimaki et al. 1984.

Revista Brasileira de Geociências, volume 41 (2), 2011 279
Leonardo Cardoso Renner et al.
minerals (Fig. 9B) would correlate to low KD for Sr and Eu, but in analyses of those rims we have found opposite, we found high Na concentrations (Fig. 9D) related to larger KD at rim.
Aiming to identify the zones to which the element KD is related, binary diagrams were used (Fig. 10) for showing the distribution in core, intermediate and rim for Ca and Na. The partition coeffi cients of Sr, Eu, Ba and Pb versus An% content in plagioclase crystals, and higher values of An are in the core of the crystal, the lowest values of An are related to the rim of the mineral. Figure 10a shows the KD Sr, consistent element in all samples with negative correlation in most of them, that is, the KD Sr increase from core to rim, except from TM105 sample, this suggests that for Sr the substitution element is related mostly by replacement of Na instead of Ca. The partition coeffi cient of Eu (Fig. 10b) shows that only half of the samples are compatible with this element in plagioclase, showing negative correlation with the An
content, and the higher values of KD Eu are related to the rim of this mineral, with affi nity for Na. This case resembles the diagram KD Ba versus An%, with higher values for the rim. Pb is compatible in only fi ve samples (core to rim), with negative to neutral correlations (Fig. 10d). Because the valence of Pb4+ (0.84 Å in sixfold coordination) is very different from the physical and chemical characteristics of Ca and Na, no satisfactory correlation of these elements was found in plagioclase, only with melt composition. Other variables, such as temperature, pressure, liquid composition, melt composition and fO2.can modify the partition coeffi cient in plagioclase and clinopyroxene.
Clinopyroxene Clinopyroxene has a larger number of elements compared with plagioclase in the same sample. This is because of the variety between the various stages of clinopyroxene and diverse elements of its chemical formula (Mg2Si2O6-CaMgSi2O6-CaFeSi2O6-Fe2Si2O6) in quadrilateral representation.
Figure 10 - Calculated partition coeffi cient (LA-ICP-MS) for a) Sr, b) Eu, c) Ba and d) Pb versus An% plagioclase microanalyses (EPMA). The dashed line delineates the fi eld among the compatible element zone and incompatible element zone.
Revista Brasileira de Geociências, volume 41 (2), 2011280
A micro-analytical approach to partition coeffi cients in plagioclase and clinopyroxene of basaltic sills in Serra Geral Formation, Paraná Basin, Brazil
Tabl
e 5
- Las
er A
blat
ion
ICP-
MS
(ppm
) ana
lyse
s an
d pa
rtiti
on c
oeffi
cien
ts (K
D) o
f cor
e, in
term
edia
te a
nd r
im z
ones
in p
lagi
ocla
ses
min
eral
s fro
m P
aran
á St
ate
and
augi
tes f
rom
São
Pau
lo S
tate
s.
Stat
ePa
raná
- pl
agio
clas
eSã
o Pa
ulo
- aug
iteSa
mpl
eK
N16
1K
N14
1
A
naly
ses
Parti
tion
Coe
ffi ci
ent (
KD)
Ana
lyse
s (pp
m)
Parti
tion
Coe
ffi ci
ent (
KD)
Cor
e (n
=3)
Inte
rm
(n=3
)M
ean
σC
ore
Inte
rmR
imM
ean
σC
ore
(n=2
)In
term
(n
=2)
Rim
(n
=1)
Mea
nσ
Cor
eIn
term
Rim
Mea
nσ
Sc0.
810.
781.
371.
000.
020.
020.
060.
030.
0312
7.00
127.
0013
0.00
128.
001.
733.
433.
433.
513.
460.
05Ti
497.
3364
8.33
565.
5676
.55
0.04
0.05
0.04
0.04
0.01
7239
.50
7128
.00
4673
.00
6346
.83
1450
.65
0.47
0.46
0.30
0.41
0.09
V5.
754.
013.
782.
100.
020.
010.
000.
010.
0155
2.00
520.
0015
3.00
408.
3322
1.70
1.15
1.08
0.32
0.85
0.46
Cr
0.95
1.40
1.22
0.24
0.02
0.03
0.03
0.02
0.00
2.25
29.2
52.
1011
.20
15.6
30.
020.
310.
020.
120.
16C
o0.
670.
880.
870.
190.
010.
020.
020.
020.
0054
.55
55.6
055
.40
55.1
80.
561.
111.
131.
131.
130.
01N
i0.
260.
320.
290.
030.
010.
020.
010.
010.
0080
.75
83.2
533
.60
65.8
727
.97
2.77
2.45
0.99
2.07
0.95
Cu
2.89
1.96
2.34
0.48
0.01
0.01
0.01
0.01
0.00
0.89
1.40
1.00
1.10
0.27
0.01
0.01
0.00
0.01
0.00
Zn4.
677.
687.
052.
130.
050.
070.
090.
070.
0254
.30
64.3
012
9.00
82.5
340
.55
0.53
0.65
1.30
0.83
0.42
Rb
0.59
0.65
0.75
0.23
0.02
0.03
0.04
0.03
0.01
0.10
0.08
0.07
0.08
0.01
0.00
0.00
0.00
0.00
0.00
Sr49
6.67
695.
3366
8.00
159.
431.
682.
322.
692.
230.
5117
.45
19.0
013
.80
16.7
52.
670.
050.
050.
040.
040.
01Y
0.14
0.17
1.06
1.57
0.00
0.00
0.08
0.03
0.04
17.9
021
.90
73.8
037
.87
31.1
80.
490.
632.
131.
080.
91Zr
0.03
0.05
0.52
0.83
0.00
0.00
0.01
0.00
0.00
17.1
020
.45
53.4
030
.32
20.0
60.
090.
120.
300.
170.
12N
b0.
030.
040.
050.
020.
000.
000.
000.
000.
000.
070.
100.
140.
100.
040.
000.
010.
010.
010.
00M
o0.
120.
110.
130.
030.
060.
060.
080.
070.
010.
240.
300.
120.
220.
090.
100.
150.
060.
100.
04C
s0.
030.
020.
030.
010.
150.
100.
150.
130.
030.
050.
060.
040.
050.
010.
230.
280.
200.
230.
04B
a80
.40
174.
3322
4.24
174.
250.
230.
471.
170.
620.
490.
360.
350.
350.
350.
000.
000.
000.
000.
000.
00La
0.82
1.40
2.11
1.76
0.04
0.06
0.19
0.09
0.08
1.17
1.28
5.96
2.80
2.74
0.04
0.05
0.25
0.11
0.12
Ce
1.39
2.43
4.06
3.77
0.03
0.05
0.17
0.08
0.08
4.14
5.15
20.3
09.
869.
050.
070.
100.
380.
190.
17Pr
0.15
0.22
0.38
0.34
0.02
0.04
0.13
0.06
0.06
0.72
1.10
3.73
1.85
1.64
0.12
0.17
0.59
0.30
0.26
Nd
0.61
0.73
1.49
1.43
0.02
0.03
0.12
0.06
0.06
5.55
6.70
22.5
011
.58
9.47
0.18
0.24
0.82
0.41
0.35
Sm0.
120.
150.
370.
410.
020.
030.
150.
060.
072.
272.
977.
074.
102.
590.
350.
491.
170.
670.
44Eu
0.37
1.28
1.73
1.63
0.19
0.60
1.82
0.87
0.85
0.60
0.77
1.52
0.96
0.49
0.27
0.37
0.73
0.46
0.24
Gd
0.10
0.12
0.35
0.42
0.01
0.02
0.14
0.06
0.07
2.50
4.33
10.8
05.
884.
360.
400.
681.
700.
920.
68Tb
0.01
0.02
0.04
0.05
0.01
0.01
0.10
0.04
0.05
0.43
0.63
1.95
1.00
0.83
0.45
0.62
1.90
0.99
0.79
Dy
0.06
0.07
0.21
0.26
0.01
0.01
0.09
0.04
0.04
3.71
4.12
11.7
06.
514.
500.
510.
702.
001.
070.
81H
o0.
010.
010.
040.
060.
010.
010.
100.
040.
050.
650.
942.
771.
461.
150.
520.
812.
371.
231.
00Er
0.03
0.04
0.12
0.14
0.01
0.01
0.08
0.03
0.04
1.93
2.47
7.45
3.95
3.05
0.50
0.72
2.16
1.13
0.91
σ =
stan
dart
devi
atio
n, In
term
= in
term
edia
ry a
nd n
= n
umbe
r of a
naly
ses.
To b
e co
ntin
ued
Revista Brasileira de Geociências, volume 41 (2), 2011 281
Leonardo Cardoso Renner et al.
The substitution of trace elements is mainly for Fe2+ (0.64 Å in sixfold coordination), Mg2+ (0.65 Å in sixfold coordination), Ca2+ (0.99 Å in eightfold coordination) and Al3+ (0.50 Å in six or fourfold coordination). Different concentrations of Ca and Mg in the crystal of clinopyroxene are shown in fi gures 9A and 9C where the core of the clinopyroxene has the highest concentrations of Mg and Ca with reduction to the rim. Figure 9E shows the difference in brightness, dark to the core and lighter for the rim due to the larger concentrations of Fe. In the same fi gure, the LA-ICP-MS and EPMA spots are also shown.
Table 8 shows the analyzed compatible elements in augite crystals.
A few crystals of clinopyroxene have rim of pigeonite and rare cases of core and intermediate zones, with values of CaO wt.% < 7. These areas of pigeonite were analyzed for trace elements, so it was possible to calculate the KD of these elements. However, the diffi culty in analyzing the rim of pigeonite is due to the diameter of the laser ablation spot (~50 μm). Figure 2A shows a very thin rim of pigeonite and fi gure 2B shows a thicker rim.
Observing tables 9 and 10 it is possible to identify which clinopyroxene samples have higher concentrations of HREE than LREE. Table 10 shows the compatible elements values for these pigeonite zones. However, the higher values of KD of REE are found in the analyzed augite and smaller values of KD for the pigeonite.
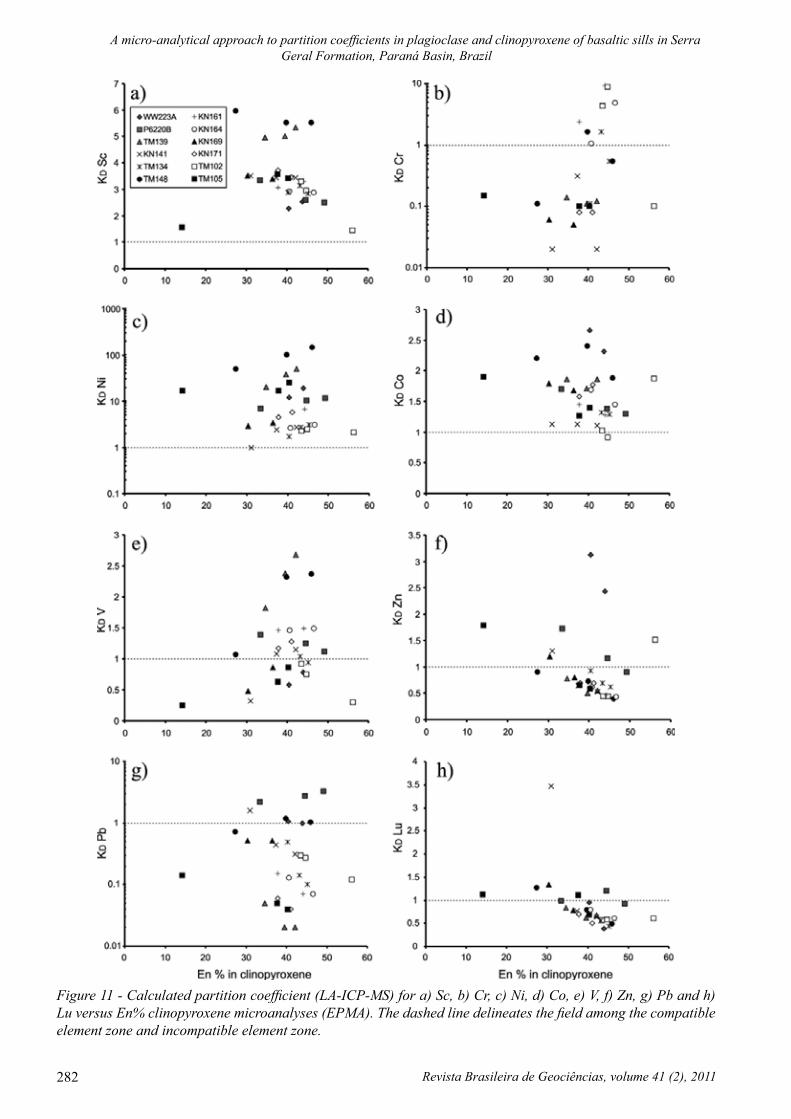
Figure 11 shows KD values of Sc, Cr, Ni, Co, V, Zn, Pb and Lu versus En% concentrations in clinopyroxene crystals. En% shows positive correlation with Ca and Al and negative correlation with Fe. Thus, it was identifi ed the probable replacement of these elements with the Mg, Ca and Al concentrations according to the crystal core, intermediate and rim. The partition coeffi cients have positive correlations with En concentrations in clinopyroxene: KD Ni and KD V (Figs. 11c and 11e). The negative correlations are: KD Sc, KD Cr, KD Co, KD Pb and KD Lu (Figs. 11a, 11b, 11d, 11g and 11h). The above values of KD > 1 for Sc, Ni and Co show that these elements are compatible with the substitutions studied in clinopyroxene with Mg and Fe. The values of KD Sc (Sc3+ 0.81 Å in sixfold coordination) suggest substitution for Fe, related to an increase in KD Sc to the rim mineral, except the TM139 and TM105 samples suggest that Mg substitution identifi ed by the increase in KD Sc values in the core (Fig. 11a). Distributions of partition coeffi cients are similar to fi gure 11d when compared to fi gure 11a. Figure 11e (KD V) has positive correlations with En% (except P6220B, TM102 and TM134 samples negative correlations). Given the physical and chemical properties of V5+ (0.52 Å in sixfold coordination), this element has a higher probability of substitution for Al3+ (0.50 Å in sixfold coordination) than Fe and Mg. The diagram in fi gure 11f shows increase in the KD Zn2+ (0.74 Å in sixfold coordination) from the core to the rim, due to probable Ta
ble
5 co
ntin
uatio
n
Stat
ePa
raná
- pl
agio
clas
eSã
o Pa
ulo
- aug
iteSa
mpl
eK
N16
1K
N14
1
A
naly
ses
Parti
tion
Coe
ffi ci
ent (
KD)
Ana
lyse
s (pp
m)
Parti
tion
Coe
ffi ci
ent (
KD)
Cor
e (n
=3)
Inte
rm
(n=3
)M
ean
σC
ore
Inte
rmR
imM
ean
σC
ore
(n=2
)In
term
(n
=2)
Rim
(n
=1)
Mea
nσ
Cor
eIn
term
Rim
Mea
nσ
Tm0.
010.
010.
010.
010.
020.
020.
050.
030.
020.
260.
301.
170.
570.
520.
460.
612.
401.
161.
08Y
b0.
050.
070.
120.
100.
020.
020.
070.
040.
031.
682.
436.
993.
702.
880.
550.
802.
291.
210.
94Lu
0.02
0.01
0.03
0.02
0.04
0.03
0.10
0.05
0.04
0.28
0.33
1.49
0.70
0.68
0.63
0.77
3.47
1.62
1.60
Hf
0.05
0.04
0.06
0.02
0.01
0.01
0.02
0.01
0.00
0.97
1.00
1.89
1.29
0.52
0.18
0.22
0.41
0.27
0.12
Ta0.
020.
010.
010.
000.
020.
010.
010.
020.
010.
030.
040.
020.
030.
010.
020.
030.
020.
030.
01Pb
2.14
1.45
1.77
0.35
0.14
0.11
0.13
0.13
0.02
1.19
1.31
4.82
2.44
2.06
0.31
0.44
1.61
0.78
0.72
Th0.
030.
010.
020.
010.
010.
010.
010.
010.
000.
030.
050.
160.
080.
070.
010.
020.
060.
030.
03U
0.02
0.02
0.01
0.00
0.04
0.03
0.02
0.03
0.01
0.02
0.03
0.03
0.03
0.01
0.04
0.04
0.05
0.04
0.01
σ =
stan
dart
devi
atio
n, In
term
= in
term
edia
ry a
nd n
= n
umbe
r of a
naly
ses.
Revista Brasileira de Geociências, volume 41 (2), 2011282
A micro-analytical approach to partition coeffi cients in plagioclase and clinopyroxene of basaltic sills in Serra Geral Formation, Paraná Basin, Brazil
Figure 11 - Calculated partition coeffi cient (LA-ICP-MS) for a) Sc, b) Cr, c) Ni, d) Co, e) V, f) Zn, g) Pb and h) Lu versus En% clinopyroxene microanalyses (EPMA). The dashed line delineates the fi eld among the compatible element zone and incompatible element zone.
Revista Brasileira de Geociências, volume 41 (2), 2011 283
Leonardo Cardoso Renner et al.
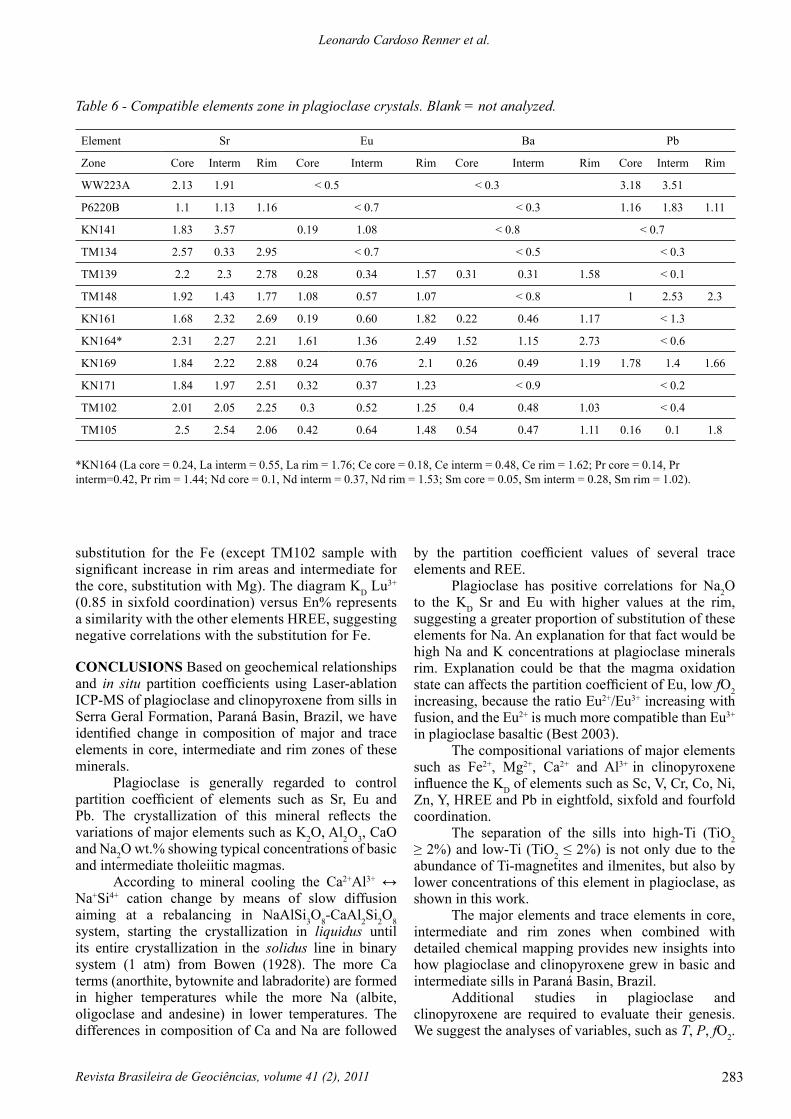
Table 6 - Compatible elements zone in plagioclase crystals. Blank = not analyzed.
Element Sr Eu Ba Pb
Zone Core Interm Rim Core Interm Rim Core Interm Rim Core Interm Rim
WW223A 2.13 1.91 < 0.5 < 0.3 3.18 3.51
P6220B 1.1 1.13 1.16 < 0.7 < 0.3 1.16 1.83 1.11
KN141 1.83 3.57 0.19 1.08 < 0.8 < 0.7
TM134 2.57 0.33 2.95 < 0.7 < 0.5 < 0.3
TM139 2.2 2.3 2.78 0.28 0.34 1.57 0.31 0.31 1.58 < 0.1
TM148 1.92 1.43 1.77 1.08 0.57 1.07 < 0.8 1 2.53 2.3
KN161 1.68 2.32 2.69 0.19 0.60 1.82 0.22 0.46 1.17 < 1.3
KN164* 2.31 2.27 2.21 1.61 1.36 2.49 1.52 1.15 2.73 < 0.6
KN169 1.84 2.22 2.88 0.24 0.76 2.1 0.26 0.49 1.19 1.78 1.4 1.66
KN171 1.84 1.97 2.51 0.32 0.37 1.23 < 0.9 < 0.2
TM102 2.01 2.05 2.25 0.3 0.52 1.25 0.4 0.48 1.03 < 0.4
TM105 2.5 2.54 2.06 0.42 0.64 1.48 0.54 0.47 1.11 0.16 0.1 1.8
*KN164 (La core = 0.24, La interm = 0.55, La rim = 1.76; Ce core = 0.18, Ce interm = 0.48, Ce rim = 1.62; Pr core = 0.14, Pr interm=0.42, Pr rim = 1.44; Nd core = 0.1, Nd interm = 0.37, Nd rim = 1.53; Sm core = 0.05, Sm interm = 0.28, Sm rim = 1.02).
substitution for the Fe (except TM102 sample with signifi cant increase in rim areas and intermediate for the core, substitution with Mg). The diagram KD Lu3+ (0.85 in sixfold coordination) versus En% represents a similarity with the other elements HREE, suggesting negative correlations with the substitution for Fe.
CONCLUSIONS Based on geochemical relationships and in situ partition coeffi cients using Laser-ablation ICP-MS of plagioclase and clinopyroxene from sills in Serra Geral Formation, Paraná Basin, Brazil, we have identifi ed change in composition of major and trace elements in core, intermediate and rim zones of these minerals.
Plagioclase is generally regarded to control partition coeffi cient of elements such as Sr, Eu and Pb. The crystallization of this mineral refl ects the variations of major elements such as K2O, Al2O3, CaO and Na2O wt.% showing typical concentrations of basic and intermediate tholeiitic magmas.
According to mineral cooling the Ca2+Al3+ ↔ Na+Si4+ cation change by means of slow diffusion aiming at a rebalancing in NaAlSi3O8-CaAl2Si2O8 system, starting the crystallization in liquidus until its entire crystallization in the solidus line in binary system (1 atm) from Bowen (1928). The more Ca terms (anorthite, bytownite and labradorite) are formed in higher temperatures while the more Na (albite, oligoclase and andesine) in lower temperatures. The differences in composition of Ca and Na are followed
by the partition coeffi cient values of several trace elements and REE.
Plagioclase has positive correlations for Na2O to the KD Sr and Eu with higher values at the rim, suggesting a greater proportion of substitution of these elements for Na. An explanation for that fact would be high Na and K concentrations at plagioclase minerals rim. Explanation could be that the magma oxidation state can affects the partition coeffi cient of Eu, low fO2 increasing, because the ratio Eu2+/Eu3+ increasing with fusion, and the Eu2+ is much more compatible than Eu3+ in plagioclase basaltic (Best 2003).
The compositional variations of major elements such as Fe2+, Mg2+, Ca2+ and Al3+ in clinopyroxene infl uence the KD of elements such as Sc, V, Cr, Co, Ni, Zn, Y, HREE and Pb in eightfold, sixfold and fourfold coordination.
The separation of the sills into high-Ti (TiO2 ≥ 2%) and low-Ti (TiO2 ≤ 2%) is not only due to the abundance of Ti-magnetites and ilmenites, but also by lower concentrations of this element in plagioclase, as shown in this work.
The major elements and trace elements in core, intermediate and rim zones when combined with detailed chemical mapping provides new insights into how plagioclase and clinopyroxene grew in basic and intermediate sills in Paraná Basin, Brazil.
Additional studies in plagioclase and clinopyroxene are required to evaluate their genesis. We suggest the analyses of variables, such as T, P, fO2.

Revista Brasileira de Geociências, volume 41 (2), 2011284
A micro-analytical approach to partition coeffi cients in plagioclase and clinopyroxene of basaltic sills in Serra Geral Formation, Paraná Basin, Brazil
Table 7 - Average partition coeffi cients from plagioclase sills in Serra Geral Formation, Paraná Basin, Brazil. Blank = not analyzed.
Plagioclase
State Rio Grande do Sul São Paulo Paraná Goiás
Sample WW223A P6220B TM139 KN141 TM134 TM148 KN161 KN164 KN169 KN171 TM102 TM105
Type Basaltic andesite Basalt
Sc 0.02 0.02 0.07 0.03 0.01 0.03 0.03 0.02 0.02 0.02 0.02 0.02
Ti 0.04 0.04 0.04 0.05 0.02 0.03 0.04 0.05 0.04 0.04 0.04 0.03
V 0.01 0.02 0.01 0.01 0.01 0.01 0.01 0.02 0.01 0.01 0.01 0.01
Cr 0.06 0.02 0.04 0.06 0.02 0.01 0.03 0.03 0.01 0.05
Co 0.04 0.05 0.04 0.02 0.02 0.02 0.02 0.04 0.02 0.02 0.01 0.04
Ni 0.06 0.09 0.28 0.01 0.02 0.37 0.01 0.02 0.01 0.01 0.01 0.40
Cu 0.07 0.01 0.01 0.01 0.04 0.12 0.01 0.02 0.01 0.01 0.02 0.01
Zn 0.18 0.19 0.11 0.07 0.06 0.09 0.07 0.09 0.07 0.07 0.07 0.10
Rb 0.15 0.01 0.06 0.02 0.04 0.02 0.03 0.42 0.02 0.02 0.03 0.05
Sr 2.02 1.13 2.43 2.70 1.95 1.71 2.23 2.26 2.32 2.10 2.11 2.37
Y 0.02 0.01 0.07 0.01 0.01 0.00 0.03 0.21 0.01 0.00 0.01 0.01
Zr 0.03 0.00 0.02 0.00 0.01 0.00 0.00 0.07 0.00 0.00 0.00 0.00
Nb 0.05 0.00 0.01 0.00 0.01 0.00 0.00 0.03 0.00 0.00 0.00 0.00
Mo 0.07 0.15 0.06 0.07 0.04 0.06 0.07 0.09 0.05 0.06 0.05 0.06
Cs 0.15 0.02 0.03 0.14 0.05 0.04 0.13 0.27 0.03 0.07 0.12 0.09
Ba 0.32 0.21 0.73 0.51 0.36 0.59 0.62 1.80 0.65 0.45 0.64 0.71
La 0.11 0.06 0.10 0.08 0.06 0.07 0.09 0.85 0.07 0.05 0.10 0.07
Ce 0.11 0.05 0.09 0.06 0.05 0.05 0.08 0.76 0.06 0.04 0.08 0.06
Pr 0.08 0.03 0.08 0.05 0.04 0.03 0.06 0.67 0.04 0.03 0.06 0.04
Nd 0.06 0.03 0.07 0.04 0.03 0.03 0.06 0.67 0.03 0.03 0.05 0.04
Sm 0.05 0.02 0.07 0.03 0.02 0.02 0.06 0.45 0.02 0.02 0.03 0.02
Eu 0.51 0.43 0.73 0.64 0.46 0.90 0.87 1.82 1.03 0.64 0.69 0.85
Gd 0.03 0.03 0.07 0.03 0.02 0.01 0.06 0.36 0.01 0.01 0.02 0.01
Tb 0.02 0.02 0.06 0.02 0.01 0.01 0.04 0.27 0.01 0.01 0.01 0.01
Dy 0.02 0.01 0.07 0.01 0.01 0.01 0.04 0.28 0.01 0.01 0.01 0.01
Ho 0.02 0.02 0.07 0.02 0.01 0.01 0.04 0.24 0.01 0.01 0.02 0.01
Er 0.02 0.01 0.07 0.02 0.01 0.01 0.03 0.20 0.01 0.01 0.02 0.01
Tm 0.03 0.04 0.08 0.04 0.01 0.02 0.03 0.16 0.02 0.01 0.04 0.02
Yb 0.02 0.02 0.07 0.04 0.02 0.01 0.04 0.13 0.01 0.01 0.03 0.02
Lu 0.03 0.04 0.09 0.03 0.02 0.02 0.05 0.13 0.02 0.02 0.04 0.02
Hf 0.02 0.01 0.02 0.01 0.01 0.01 0.01 0.08 0.01 0.01 0.01 0.01
Ta 0.05 0.03 0.10 0.02 0.01 0.01 0.02 0.07 0.01 0.01 0.02 0.01
Pb 3.34 1.36 0.12 0.53 0.15 1.94 0.13 0.47 1.61 0.14 0.23 0.69
Th 0.03 0.00 0.02 0.01 0.02 0.00 0.01 0.14 0.01 0.01 0.01 0.00
U 0.13 0.01 0.02 0.04 0.03 0.02 0.03 0.14 0.03 0.02 0.04 0.02

Revista Brasileira de Geociências, volume 41 (2), 2011 285
Leonardo Cardoso Renner et al.
Table 8 - Average partition coeffi cients from clinopyroxenes sills in Serra Geral Formation, Paraná Basin, Brazil. Blank = not analyzed.
Pyroxene
State Rio Grande do Sul São Paulo Paraná Goiás
Sample WW223A P6220B TM139 KN141 TM134 TM148 KN161 KN164 KN169 KN171 TM102 TM105
Type Basaltic andesite Basalt
Sc 2.52 2.82 4.97 3.46 2.95 5.67 3.18 2.89 3.45 3.60 3.17 3.50
Ti 0.26 0.39 0.50 0.41 0.29 0.28 0.41 0.49 0.39 0.41 0.43 0.24
V 0.78 1.26 2.29 0.85 0.95 1.92 1.45 1.47 0.67 1.23 0.84 0.75
Cr 0.12 0.12 0.76 8.56 5.81 3.00 0.05 0.08 4.51 0.10
Co 2.32 1.46 1.81 1.13 1.34 2.17 1.37 1.57 1.73 1.67 0.97 1.33
Ni 19.18 9.67 35.73 2.07 2.51 98.45 5.67 2.86 3.13 5.10 2.19 20.83
Cu 0.04 0.10 0.01 0.01 0.01 0.06 0.01 0.00 0.00 0.01 0.01 0.00
Zn 2.43 1.26 0.61 0.83 0.75 0.68 0.59 0.53 1.00 0.69 0.75 0.62
Rb 0.01 0.02 0.00 0.00 0.00 0.00 0.02 0.01 0.00 0.00 0.17 0.00
Sr 0.03 0.07 0.05 0.04 0.05 0.03 0.04 0.06 0.04 0.05 0.07 0.06
Y 0.35 0.77 0.57 1.08 0.51 0.54 0.53 0.58 0.87 0.56 0.60 0.73
Zr 0.04 0.15 0.12 0.17 0.09 0.07 0.11 0.11 0.13 0.09 0.13 0.11
Nb 0.01 0.10 0.00 0.01 0.00 0.00 0.02 0.03 0.00 0.00 0.00 0.00
Mo 0.24 0.26 0.10 0.10 0.09 0.15 0.11 0.09 0.12 0.13 0.09 0.09
Cs 0.03 0.09 0.06 0.23 0.10 0.08 0.22 0.11 0.06 0.16 0.17 0.09
Ba 0.00 0.02 0.00 0.00 0.00 0.00 0.01 0.02 0.00 0.00 0.11 0.00
La 0.02 0.09 0.04 0.11 0.04 0.03 0.08 0.06 0.06 0.04 0.09 0.06
Ce 0.04 0.15 0.08 0.19 0.08 0.05 0.11 0.10 0.10 0.07 0.14 0.11
Pr 0.07 0.19 0.13 0.30 0.13 0.08 0.16 0.17 0.16 0.13 0.19 0.19
Nd 0.08 0.24 0.19 0.41 0.19 0.11 0.22 0.21 0.28 0.19 0.26 0.28
Sm 0.11 0.44 0.35 0.67 0.32 0.26 0.35 0.40 0.47 0.31 0.43 0.45
Eu 0.11 0.32 0.31 0.46 0.31 0.21 0.31 0.30 0.31 0.28 0.41 0.35
Gd 0.28 0.60 0.48 0.92 0.43 0.36 0.51 0.51 0.63 0.45 0.50 0.60
Tb 0.20 0.59 0.49 0.99 0.43 0.41 0.53 0.49 0.64 0.45 0.50 0.61
Dy 0.36 0.71 0.60 1.07 0.54 0.52 0.61 0.58 0.84 0.60 0.61 0.77
Ho 0.34 0.83 0.67 1.23 0.58 0.68 0.63 0.68 0.90 0.62 0.67 0.81
Er 0.38 0.89 0.61 1.13 0.53 0.69 0.62 0.59 0.84 0.57 0.55 0.74
Tm 0.28 0.91 0.57 1.16 0.51 0.68 0.65 0.56 0.88 0.57 0.60 0.74
Yb 0.48 1.05 0.62 1.21 0.58 0.66 0.62 0.63 0.93 0.60 0.61 0.79
Lu 0.38 1.04 0.71 1.62 0.57 0.84 0.62 0.70 1.06 0.60 0.64 0.90
Hf 0.12 0.19 0.21 0.27 0.18 0.13 0.21 0.18 0.21 0.16 0.20 0.18
Ta 0.04 0.08 0.01 0.03 0.02 0.01 0.04 0.04 0.02 0.03 0.02 0.02
Pb 0.99 2.76 0.03 0.78 0.25 0.99 0.11 0.10 0.51 0.05 0.36 0.04
Th 0.01 0.03 0.01 0.03 0.01 0.01 0.04 0.03 0.01 0.02 0.02 0.01
U 0.01 0.19 0.02 0.04 0.03 0.03 0.07 0.04 0.05 0.04 0.05 0.03

Revista Brasileira de Geociências, volume 41 (2), 2011286
A micro-analytical approach to partition coeffi cients in plagioclase and clinopyroxene of basaltic sills in Serra Geral Formation, Paraná Basin, Brazil
Table 9 - Compatible elements zone in augite crystals. Blank = not analyzed.
Element Sc Co Ni Zn
Zone Core Interm Rim Core Interm Rim Core Interm Rim Core Interm Rim
WW223A 2.52 2.32 19.18 2.43
P6220B 2.51 2.61 3.34 1.3 1.38 1.7 11.56 10.44 7 0.9 1.16 1.73
TM134 2.83 3.13 2.89 1.29 1.32 1.39 3.11 2.71 1.7 < 0.9
TM139 5.33 5 4.59 1.86 1.71 1.86 49.4 37.45 20.33 < 0.7
TM148 5.52 5.52 5.96 1.88 2.41 2.2 145.5 100.05 49.8 < 0.9
KN161 3.3 3.06 1.28 1.45 6.66 4.68 < 0.7
KN164 2.87 2.92 1.45 1.69 3.07 2.64 < 0.6
KN169* 3.39 3.51 1.68 1.79 3.34 2.91 0.8 1.2
KN171 3.47 3.73 1.77 1.58 5.68 4.52 5.1 < 0.7
TM102 2.95 3.31 3.24 0.92 1.03 0.94 2.51 2.28 1.78 0.45 0.45 1.34
TM105 3.41 3.58 1.4 1.27 25 16.67 < 0.6
Element V Cr Pb Tm
Zone Core Interm Rim Core Interm Rim Core Interm Rim Core Interm Rim
WW223A < 0.8 0.99 < 0.3
P6220B 1.12 1.25 1.39 3.3 2.77 2.2 0.74 0.96 1.04
TM134 0.94 1.04 0.86 0.55 1.64 0.11 < 0.5 < 0.6
TM139 2.68 2.38 1.82 < 0.1 < 0.03 < 0.6
TM148 2.37 2.32 1.07 23.39 2.12 0.17 1.05 1.19 0.73 < 0.9
KN161 1.56 1.33 9.26 1.45 < 0.1 < 0.7
KN164 1.49 1.46 4.92 1.07 < 0.1 < 0.6
KN169* < 0.8 < 0.06 < 0.5 0.65 1.1
KN171 1.28 1.17 < 0.09 < 0.06 < 0.6
TM102 < 0.9 8.83 4.32 0.39 < 0.5 < 0.8
TM105 < 0.8 < 0.1 < 0.05 < 0.9
Element Lu Yb Ho Er
Zone Core Interm Rim Core Interm Rim Core Interm Rim Core Interm Rim
WW223A < 0.4 < 0.5 < 0.3 < 0.4
P6220B 0.93 1.2 0.99 0.98 1.18 0.98 < 1 0.76 0.87 1.05
TM134 < 0.7 < 0.7 < 0.7 < 0.7
TM139 < 0.8 < 0.7 < 0.7 < 0.7
TM148 0.49 0.76 1.27 < 0.9 0.39 0.54 1.1 0.43 0.57 1.07
KN161 < 0.7 < 0.7 < 0.7 < 0.7
KN164 < 0.8 < 0.6 < 0.7 < 0.7
KN169* 0.78 1.34 0.72 1.14 0.71 1.1 0.69 1
KN171 < 0.7 < 0.6 < 0.7 < 0.6
TM102 < 0.8 < 0.7 < 0.8 < 0.6
TM105 0.69 1.11 < 0.9 < 0.9 < 0.9
*KN169 (Y core = 0.65, Y interm = 1.10, Y rim = 0,87; Dy core = 0.62, Dy interm = 1.07, Dy rim = 0.84).
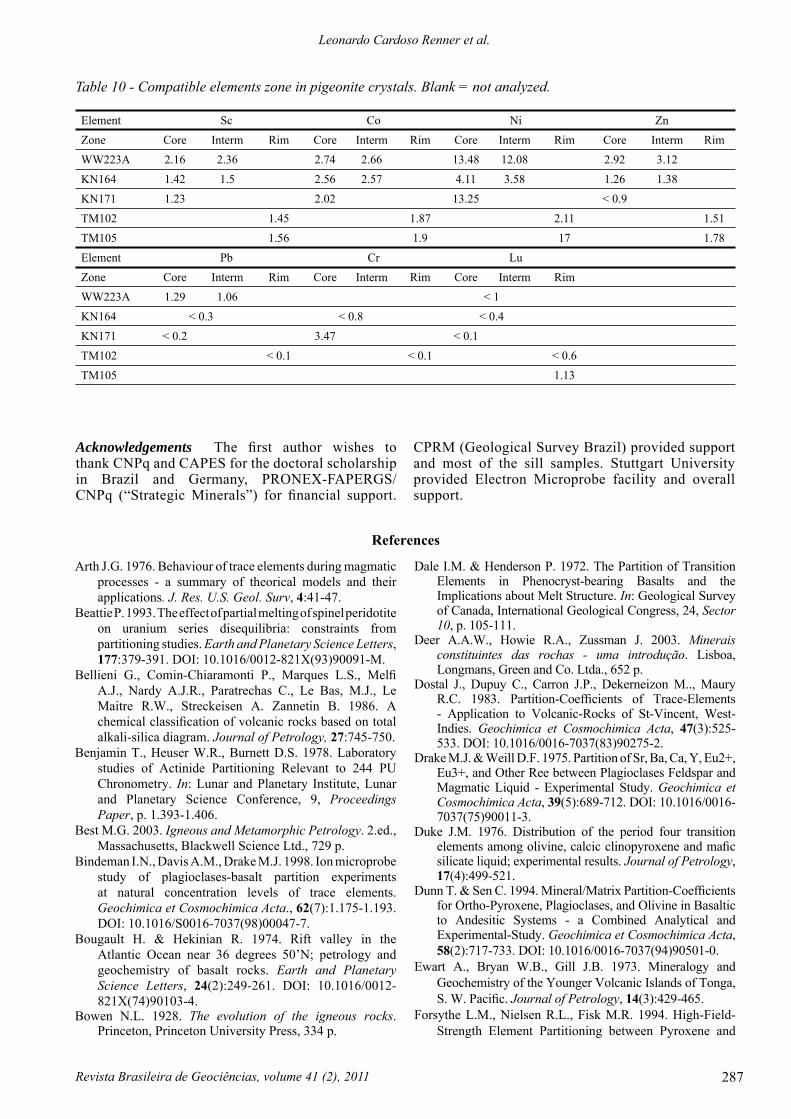
Revista Brasileira de Geociências, volume 41 (2), 2011 287
Leonardo Cardoso Renner et al.
Table 10 - Compatible elements zone in pigeonite crystals. Blank = not analyzed.
Element Sc Co Ni ZnZone Core Interm Rim Core Interm Rim Core Interm Rim Core Interm RimWW223A 2.16 2.36 2.74 2.66 13.48 12.08 2.92 3.12KN164 1.42 1.5 2.56 2.57 4.11 3.58 1.26 1.38KN171 1.23 2.02 13.25 < 0.9TM102 1.45 1.87 2.11 1.51TM105 1.56 1.9 17 1.78Element Pb Cr LuZone Core Interm Rim Core Interm Rim Core Interm RimWW223A 1.29 1.06 < 1KN164 < 0.3 < 0.8 < 0.4KN171 < 0.2 3.47 < 0.1TM102 < 0.1 < 0.1 < 0.6TM105 1.13
References
Arth J.G. 1976. Behaviour of trace elements during magmatic processes - a summary of theorical models and their applications. J. Res. U.S. Geol. Surv, 4:41-47.
Beattie P. 1993. The effect of partial melting of spinel peridotite on uranium series disequilibria: constraints from partitioning studies. Earth and Planetary Science Letters, 177:379-391. DOI: 10.1016/0012-821X(93)90091-M.
Bellieni G., Comin-Chiaramonti P., Marques L.S., Melfi A.J., Nardy A.J.R., Paratrechas C., Le Bas, M.J., Le Maitre R.W., Streckeisen A. Zannetin B. 1986. A chemical classifi cation of volcanic rocks based on total alkali-silica diagram. Journal of Petrology, 27:745-750.
Benjamin T., Heuser W.R., Burnett D.S. 1978. Laboratory studies of Actinide Partitioning Relevant to 244 PU Chronometry. In: Lunar and Planetary Institute, Lunar and Planetary Science Conference, 9, Proceedings Paper, p. 1.393-1.406.
Best M.G. 2003. Igneous and Metamorphic Petrology. 2.ed., Massachusetts, Blackwell Science Ltd., 729 p.
Bindeman I.N., Davis A.M., Drake M.J. 1998. Ion microprobe study of plagioclases-basalt partition experiments at natural concentration levels of trace elements. Geochimica et Cosmochimica Acta., 62(7):1.175-1.193. DOI: 10.1016/S0016-7037(98)00047-7.
Bougault H. & Hekinian R. 1974. Rift valley in the Atlantic Ocean near 36 degrees 50’N; petrology and geochemistry of basalt rocks. Earth and Planetary Science Letters, 24(2):249-261. DOI: 10.1016/0012-821X(74)90103-4.
Bowen N.L. 1928. The evolution of the igneous rocks. Princeton, Princeton University Press, 334 p.
Dale I.M. & Henderson P. 1972. The Partition of Transition Elements in Phenocryst-bearing Basalts and the Implications about Melt Structure. In: Geological Survey of Canada, International Geological Congress, 24, Sector 10, p. 105-111.
Deer A.A.W., Howie R.A., Zussman J. 2003. Minerais constituintes das rochas - uma introdução. Lisboa, Longmans, Green and Co. Ltda., 652 p.
Dostal J., Dupuy C., Carron J.P., Dekerneizon M.., Maury R.C. 1983. Partition-Coeffi cients of Trace-Elements - Application to Volcanic-Rocks of St-Vincent, West-Indies. Geochimica et Cosmochimica Acta, 47(3):525-533. DOI: 10.1016/0016-7037(83)90275-2.
Drake M.J. & Weill D.F. 1975. Partition of Sr, Ba, Ca, Y, Eu2+, Eu3+, and Other Ree between Plagioclases Feldspar and Magmatic Liquid - Experimental Study. Geochimica et Cosmochimica Acta, 39(5):689-712. DOI: 10.1016/0016-7037(75)90011-3.
Duke J.M. 1976. Distribution of the period four transition elements among olivine, calcic clinopyroxene and mafi c silicate liquid; experimental results. Journal of Petrology, 17(4):499-521.
Dunn T. & Sen C. 1994. Mineral/Matrix Partition-Coeffi cients for Ortho-Pyroxene, Plagioclases, and Olivine in Basaltic to Andesitic Systems - a Combined Analytical and Experimental-Study. Geochimica et Cosmochimica Acta, 58(2):717-733. DOI: 10.1016/0016-7037(94)90501-0.
Ewart A., Bryan W.B., Gill J.B. 1973. Mineralogy and Geochemistry of the Younger Volcanic Islands of Tonga, S. W. Pacifi c. Journal of Petrology, 14(3):429-465.
Forsythe L.M., Nielsen R.L., Fisk M.R. 1994. High-Field-Strength Element Partitioning between Pyroxene and
Acknowledgements The fi rst author wishes to thank CNPq and CAPES for the doctoral scholarship in Brazil and Germany, PRONEX-FAPERGS/CNPq (“Strategic Minerals”) for fi nancial support.
CPRM (Geological Survey Brazil) provided support and most of the sill samples. Stuttgart University provided Electron Microprobe facility and overall support.

Revista Brasileira de Geociências, volume 41 (2), 2011288
A micro-analytical approach to partition coeffi cients in plagioclase and clinopyroxene of basaltic sills in Serra Geral Formation, Paraná Basin, Brazil
Basaltic to Dacitic Magmas. Chemical Geology, 117(1-4):107-125. DOI: 10.1016/0009-2541(94)90124-4.
Frey F.A. 1969. Rare earth abundances in a high-temperature peridotite intrusion. Geochimica et Cosmochimica Acta, 33(11):1.429-1.447. DOI: 10.1016/0016-7037(69)90183-5.
Fujimaki H., Tatsumoto M., Aoki K. 1984. Partition coeffi cients of Hf, Zr, and REE between phenocrysts and groundmasses. In: Lunar and Planetary Institute, Lunar and Planetary Science Conference, 14, Proceedings Paper, p. B662-B672.
Gaetani G.A. & Grove T.L. 1995. Partitioning of Rare-Earth Elements between Clinopyroxene and Silicate Melt - Crystal-Chemical Controls. Geochimica et Cosmochimica Acta, 59(10):1.951-1.962. DOI: 10.1016/00167-0379(50)01190-.
Hack P.J, Nielsen R.L., Johnston A.D. 1994. Experimentally determined rare-Earth element and Y partitioning behavior between clinopyroxene and basaltic liquids at pressures up to 20 kbar. Chemical Geology, 117:89-105. DOI: 10.1016/0009-2541(94)90123-6.
Hart S.R. & Brooks C. 1974. Clinopyroxene-matrix partitioning of K, Rb, Cs, Sr and Ba. Geochimica et Cosmochimica Acta, 38:1.799-1.806. DOI: 10.1016/0016-7037(74)90163-X.
Hart S.R. & Dunn T. 1993. Experimental cpx/melt partitioning of 24 trace elements. Contributions to Mineralogy and Petrology, 113:1-8.
Hauri E.H., Wagner T.P., Grove T.L. 1994. Experimental and natural partitioning of Th, U, Pb and other trace elements between garnet, clinopyroxene and basaltic melts. Chemical Geology, 117:149-166. DOI: 10.1016/0009-2541(94)90126-0.
Irving A.J. & Frey F.A. 1984. Trace-Element Abundances in Megacrysts and Their Host Basalts - Constraints on Partition-Coeffi cients and Megacryst Genesis. Geochimica et Cosmochimica Acta, 48(6):1.201-1.221. DOI: 10.1016/0016-7037(84)90056-5.
Irvine T.N. & Baragar W.R.A. 1971. A guide to the chemical classifi cation of the common volcanic rocks. Canadian Journal of Earth Sciences, 8:523-548.
Jenner G.A., Foley S.F., Jackson S.E., Green T.H., Fryer B.J., Longerich H.P. 1993. Determination of partition coeffi cients for trace elements in high pressure-temperature experimental run products by laser ablation microprobe-inductively coupled plasma-mass spectrometry (LAM-ICP-MS). Geochimica et Cosmochimica Acta, 57(23-24):5.099-5.103.
Kravuchuk I.K., Chernysheva I., Urosov S. 1981. Element distribution between plagioclases and groundmass as an indicator for crystallization conditions of the basalts in the southern vent of Tolbachik. Geochemistry International, 17:18-24.
Larsen L.M. 1979. Distribution of Ree and Other Trace-Elements between Phenocrysts and Peralkaline Undersaturated Magmas, Exemplifi ed by Rocks from the Gardar Igneous Province, South Greenland. Lithos, 12(4):303-315. DOI: 10.1016/0024-4937(79)90022-7.
Lindsley D. 1983. Pyroxene thermometry. American Mineralogist, 68:477-493.
Machado F.B. 2003. Geologia e possíveis zonas de efusão do magmatismo ácido cretácico da Bacia do Paraná. Monografi a (TCC), Instituto de Geociências e Ciências Exatas, Universidade Estadual Paulista, Rio Claro, 124 p.
Matsui Y., Onuma N., Nagasawa H., Higuchi H., Banno S. 1977. Crystal structure control in trace element partition between crystal and magma. Tectonics, 100:315-324.
McCallum I.S. & Charette M.P. 1978. Zr and Nb partition coeffi cients: implications for the genesis of mare basalts, kreep, and sea fl oor basalts. Geochimica et Cosmochimica Acta, 42:859-869. DOI: 10.1016/0016-7037(78)90098-4.
McKay G., Le L., Wagstaff J., Crozaz G. 1994. Experimental partitioning of rare Earth elements and strontium: constraints on petrogenesis and redox conditions during crystallization of Antarctic angrite Lewis Cliff 86010. Geochimica et Cosmochimica Acta, 58:2.911-2.919. DOI: 10.1016/0016-7037(94)90124-4.
McKenzie D. & O’Nions R.K. 1991. Partial melt distributions from inversion of rare Earth element concentrations. Journal of Petrology, 32:1.021-1.091.
Melfi A.J., Piccirillo E.M., Nardy A.J.R. 1988. Geological and magmatic aspects of the Paraná Basin - an introduction. In: Piccirillo E.M. & Melfi A.J. (eds.) The Mesozoic fl ood volcanism of the Paraná Basin: petrogenetic and geophysical aspects. São Paulo, Instituto Astronômico e Geofísico, p. 1-14.
Morimoto N. 1988. Nomenclature of Pyroxene. Min. Mag., 52:535-50.
Nagasawa H. 1973. Rare-Earth distribution in alkali rocks from Oki-Dogo Island, Japan. Contributions to Mineralogy and Petrology, 39:301-308.
Nardy A.J.R., Oliveira M.A.F., De Betancourt R.H.S., Verdugo D.R.H., Machado F.B. 2002. Geologia e estratigrafi a da Formação Serra Geral. Rev. Geociências, 21:15-32.
Paster T.P., Schauwecker D.S., Haskin L.A. 1974. The behavior of some trace elements during solidifi cation of the Skaergaard layered series. Geochimica et Cosmochimica Acta, 38(10):1.549-1.577. DOI: 10.1016/0016-7037(74)90174-4.
Pearce N.J.G., Perkins W.T., Westgate J.A., Gorton M.P., Jackson S.E., Neal C.R., Chenery S.P. 1997. A compilation of new and published major and trace element data for NIST SRM 610 and NIST SRM 612 glass reference materials. Geostandards Newsletter, 21(1):115-144.
Reid F. 1983. Origin of the Rhyolitic Rocks of the Taupo Volcanic Zone, New-Zealand. Journal of Volcanology and Geothermal Research, 15(4):315-338.
Ringwood A.E. 1970. Petrogenesis of Apollo 11 basalts and implications for lunar origin. Journal of Geophysical Research, 75(32):6.453-6.479.
Schnetzler C.C. & Philpotts J.A. 1970. Partition coeffi cients of rare-earth elements between igneous matrix material and rock-forming mineral phenocrysts; II. Geochimica et Cosmochimica Acta, 34(3):331-340. DOI: 10.1016/0016-7037(70)90110-9.
Skulski T., Minarik W., Watson E.B. 1994. High-Pressure Experimental Trace-Element Partitioning
Revista Brasileira de Geociências, volume 41 (2), 2011 289
Leonardo Cardoso Renner et al.
between Clinopyroxene and Basaltic Melts. Chemical Geology, 117(1-4):127-147. DOI: 10.1016/0009-2541(94)90125-2.
Sobolev A.V., Migdisov A.A., Portnyagin M.V. 1996. Incompatible element partitioning between clinopyroxene and basalt liquid revealed by the study of melt inclusions in minerals from Troodos lavas, Cyprus. Petrology, 4(3):307-317.
Sun C.O., Williams R.J., Sun S.S. 1974. Distribution coeffi cients of Eu and Sr for plagioclases-liquid and clinopyroxene-liquid equilibria in oceanic ridge basalt; an experimental study. Geochimica et Cosmochimica Acta, 38(9):1.415-1.433. DOI: 10.1016/0016-7037(74)90096-9.
Villemant B., Jaffrezic H., Joron J.L., Treuil M. 1981. Distribution Coeffi cients of Major and Trace-Elements
- Fractional Crystallization in the Alkali Basalt Series of Chaine-Des-Puys (Massif Central, France). Geochimica et Cosmochimica Acta, 45(11):1.997-2.016. DOI: 10.1016/0016-7037(81)90055-7.
Watson E.B., Othman D.B., Luck J.M., Hofmann A.W. 1987. Partitioning of U, Pb, Cs, Yb, Hf, Re and Os between Chromian Diopsidic Pyroxene and Haplobasaltic Liquid. Chemical Geology, 62(3-4):191-208. DOI: 10.1016/0009-2541(87)90085-4.
Zanettin B. 1984. Proposed new chemical classifi cation of volcanic rocks. Episodes, 7:19-20.
Manuscrito ID 16503Submetido em 31 de dezembro de 2009
Aceito em 04 de outubro de 2011