A Methodology for Quantifying the Atmospheric Corrosion...
21
George A. King, 1 and Peter Norberg 2 A Methodology for Quantifying the Atmospheric Corrosion Performance of Fabricated Metal Products in Marine Environments Reference: King, G. A., and Norberg, P., “A Methodology for Quantifying the Atmospheric Corrosion Performance of Fabricated Metal Products in Marine Environments,” Marine Corrosion in Tropical Environments, ASTM STP 1399, S. W. Dean, G. Hernandez–Duque Delgadillo and J. B. Bushman, Eds., American Society for Testing and Materials, West Conshohocken, PA, 2000. Abstract: In Australia a long-term project is studying the marine atmospheric corrosion performance of several metals and alloys, and a range of generic classes of coatings and finishes (metallic and organic) on steel and aluminum. Specimens have been exposed for over nine years at three marine sites, both in the open and under a specially designed glass shelter which has greatly accelerated deterioration. The sheet product test pieces include a range of features designed to simulate the types of distress introduced during manufacture and building, and at which corrosion defects initially manifest. A methodology is described for the development of quantitative performance indices for these formed specimens. The general philosophy involves using the collected data to determine appropriate weighting to different types of defects on features, or to the relative contribution of different features to overall defect indices and in turn their relative contribution to a total performance index. A rigorous mathematical procedure was followed to calculate defect indices and total performance indices for all products. Some results for the two-year specimens are discussed. Keywords: atmospheric corrosion, marine environment, prepainted coated product, coil coating, durability assessment, performance indices, semi-sheltered exposure Nomenclature Types of corrosion defect on coated metal products: WCP White Corrosion Products RR Red Rusting BL Blistering UC Undercutting Features in formed specimens – also used for the ratings at those features in equations with subscripts min and max representing the minimum and maximum values: FS Flat Surface t Flat bend in product through 180 degrees 3t Bend in product using mandrel of 3× thickness 5t Bend in product using mandrel of 5× thickness 3mm Conical bend of 3 mm diameter
Transcript of A Methodology for Quantifying the Atmospheric Corrosion...
George A. King,1 and Peter Norberg2 A Methodology for Quantifying the Atmospheric Corrosion Performance of Fabricated Metal Products in Marine Environments Reference: King, G. A., and Norberg, P., “A Methodology for Quantifying the Atmospheric Corrosion Performance of Fabricated Metal Products in Marine Environments,” Marine Corrosion in Tropical Environments, ASTM STP 1399, S. W. Dean, G. Hernandez–Duque Delgadillo and J. B. Bushman, Eds., American Society for Testing and Materials, West Conshohocken, PA, 2000. Abstract: In Australia a long-term project is studying the marine atmospheric corrosion performance of several metals and alloys, and a range of generic classes of coatings and finishes (metallic and organic) on steel and aluminum. Specimens have been exposed for over nine years at three marine sites, both in the open and under a specially designed glass shelter which has greatly accelerated deterioration. The sheet product test pieces include a range of features designed to simulate the types of distress introduced during manufacture and building, and at which corrosion defects initially manifest. A methodology is described for the development of quantitative performance indices for these formed specimens. The general philosophy involves using the collected data to determine appropriate weighting to different types of defects on features, or to the relative contribution of different features to overall defect indices and in turn their relative contribution to a total performance index. A rigorous mathematical procedure was followed to calculate defect indices and total performance indices for all products. Some results for the two-year specimens are discussed. Keywords: atmospheric corrosion, marine environment, prepainted coated product, coil coating, durability assessment, performance indices, semi-sheltered exposure Nomenclature
Types of corrosion defect on coated metal products: WCP White Corrosion Products RR Red Rusting BL Blistering UC Undercutting
Features in formed specimens – also used for the ratings at those features in equations with subscripts min and max representing the minimum and maximum values: FS Flat Surface t Flat bend in product through 180 degrees 3t Bend in product using mandrel of 3× thickness 5t Bend in product using mandrel of 5× thickness 3mm Conical bend of 3 mm diameter

mes (to British Standard 3900: Part E4 Cupping Test)
r plate adjacent to main panel
s for features of specimens, viz. a measure of the defect on that
/RR duct and Red Rusting ion Product
R Corrosion Product and Red Rusting ring
IBL
otal performance index:
T x
OT PI Total Performance Index
ntroduction
the
l n
e
. The
)
sheet products from the USA, and
re a
20mm Conical bend of 20 mm diameter ED Drawn Erichsen DoSC Scribes TCE Top Cut Edge of specimen BCE Bottom Cut Edge of specimen VCE Vertical Cut Edge of coveCH Circular Hole
Defect indicespecimen feature: FSIWCP Flat Surface Index for White Corrosion ProBIWCP Bends Index for White CorrosBI R Bends Index for Red Rusting R
CEIWCP/R Cut Edge/Scribe Index for White FSIBL Flat Surface Index for BlisteB Bends Index for Blistering
Overall defect indices and product tUCITOT Total Undercutting Index WCPITO Total White Corrosion Product Index RRI T Total Red Rusting IndeTO
BLIT Total Blistering Index T I Prefinished sheet metal products in roll formed profiles are very widely used inbuilding and construction industries throughout the world. The majority share of the market is occupied by steel, coated with zinc, 5% aluminum-zinc (Al-Zn), or 55% Al-Zn, either bare or with additional coil painted finishes; however, prepainted aluminum is also extensively used. In 1997 BHP produced 475 000 tonnes of 55% Al-Zn coated steefor the Australian domestic market, with nearly 60% coil painted [1]. Most Australiaconstruction is close to the coast, and the marine environment represents by far thprincipal corrosion hazard to all metal products. The need for information on the comparative performance of these generic classes of materials and finishes in part led tothe initiation of a long-term exposure program in 1991 with international fundingoriginal joint sponsors of the project were the International Lead Zinc Research Organisation Inc. (ILZRO), BHP Research (Coated Products Division – Research & Technology) and Comalco Aluminium Ltd. ILZRO provided assistance in sourcing coated sheet products from the USA, Japan and Germany, and supplies of zinc (USAand 5% Al-Zn (Japan) for corrosion rate measurements. BHP provided coated sheet products from Australia and New Zealand, and supplies of 55% Al-Zn for corrosion ratemeasurements. Comalco provided coated aluminuman extrusion in a range of finishes from Australia. The rationale behind the program, including materials and product selection, the specimen design, and the characteristics of the three exposure sites which also featunovel semi-sheltered exposure system, has been described in detail previously [2].
1Princi rch Scientist, CSIRO BCE, POpal Resea Box 56, Highett, Victoria 3190, Australia. Institute vironment, PO Box 88, SE-801 02 Gävle, 2Royal of Technology, Centre for Built EnSweden.

re
tmo Table 1.
ced
f a etho
nted
e n
es a flat panel with optional shaping (3t and 5t bends) and cribi bends of
ands
[3]. By far the most comprehensive attempt to date was a major study carried out about 20
Twenty commercial sheet products (of four generic types – aluminum, stainless steel with organic topcoat, metallic-coated steel with organic topcoat, and metallic-only-coated steel) were exposed (with subsequent appraisal to the present methodology) in a program designed to run for 10 years. Only the two-year specimens had been recoveredat the time of this evaluation. To give an indication of the very great range in exposuconditions from which the data for this study has been obtained, the levels of chloride deposition (according to ISO 9225 Corrosion of Metals and Alloys – Corrosivity of A spheres – Measurement of Pollution) and zinc corrosion rates are given inThe figures represent a range in severity of conditions by up to a factor of about 17. The sheltering system has been found to meet its designed purpose as an accelerated test, and has induced extreme deterioration of most metals and coatings compared to those in open exposure, at the severe and moderate marine sites. The testpieces include a range of features designed to simulate the types of distress introduinto sheet products during manufacture and building, and at which corrosion defects initially manifest. This paper describes in detail the progressive development om dology for quantifying the atmospheric corrosion performance of the specimens, taking account of the features in the specimens and the different defect types. The vast majority of studies describing the exposure and appraisal of coated sheet metal products have used simple specimens, generally with a flat surface only and possible scribing. The issue of incorporating a range of features into test specimens and evaluating the corrosion performance at these, has not been addressed adequately bystandards organizations worldwide. The ASTM Test Method for Evaluation of Paior Coated Specimens Subjected to Corrosive Environments (D 1654) describes thscribing of specimens in detail, but leaves the issue of assessment at deformatiofeatures and cut edges to be agreed upon between the producer and user. The US National Coil Coaters Association Technical Bulletin No. III-9, Guidelines for Conducting Exterior Exposure Tests, incorporates a reverse drawn dome, scribe and 180 bend. The Australian/New Zealand Standard on Performance Requirements of Prefinished/Prepainted Sheet Metal Products for Interior/Exterior Building Applications (AS/NZS 2728:1997) describs ng. However, no requirements for the durability of the organic film at theshaped panels are specified. Nonetheless, attempts have been made in a few studies of the durability performance of coil-coated materials to account for the influence of various features and defects, and calculate performance indices in an objective way. Work in The Netherlused panels to the ECCA (European Coil Coaters Association) design and converted all estimates of defects to a percentage of the total area or edge length of the panel
years ago by Johnson and Marsh of the British Steel Corporation [4]. They
Table 1 – Chloride Deposition Levels orrosion Rates fo ure Sites
One-year Zinc Corrosion Rate (
and Zinc C r Expos
Chloride osition(mg .d)
Dep/m2 m/y)
Severe marine – Open red – Shelte
99 70
6.2 15.2
Moderate marine/ru – Open ral – Sheltered 26
33 1.9 3.9
Mild marine/urban – Open – Sheltered
6 5
1.0 0.9

emphasized two points: “firstly that conventional testing took no account of design features, and published methods for assessing defects from weathering of coatings (ISO and ASTM) are based on the assumption that defects occur uniformly across a surface.” They devised formed panel specimens with variable radius bends, cut edges, overlaps, scribing, an Erichsen Dome and fasteners, and also produced “box-type” specimens using these panels which enabled the study of sheltering and orientation. Corrosion products, blistering and flaking were assessed according to the ISO standards, but appar-ently undercutting from scribes and cut edges was not. Numerical values were assigned to the severity and extent of defects, and these were multiplied by weighting factors for both design feature and defect type. The weighted values were summed to produce a performance index. A deficiency in this procedure though, and one acknowledged by the authors, is that the weighting factors were chosen subjectively. One aim of the current methodology was to attempt to overcome this aspect of determining an objective quantitative measure of performance. The new approach uses the actual outcome of the defect assessments for the various features, as the basis for determining their relative severity in an objective way. This procedure is assumed to be justified by the fact that the present study comprises a very wide range of products, conditions and defect ratings. Development of a New Methodology for Quantifying Atmospheric Corrosion Performance of Coated Products
The procedure followed involves four stages of calculations: 1. Allocation of numerical ratings to defects on all features of specimens, and generation
of a database. 2. Determination of the relative contributions of various individual features within
feature types (bends, cut edges) for each of the defect indices. 3. Determination of the relative contributions of the feature type indices to overall defect
indices for a product. 4. Determination of the relative contributions of the total defect indices to a total
performance index for a product by generic type. Defects and Features of “Formed” Specimens Used for Assessment
Full details of the formed (bent) specimens have been published previously [2]. A schematic drawing of the specimen showing its features is reproduced here in Figure 1. The product codes from Table 2 of that paper are used here for sake of brevity. The metallic/organic-coated products (I1, I4–I9, B5–B8) were assessed with respect to four types of defect: White Corrosion Products (WCP), Red Rusting (RR), Blistering (BL) and Undercutting (UC). The metallic-only-coated products (I2, I3, B1) were assessed for White Corrosion Products and Red Rusting only. Product B4, fluorocarbon-coated 304 grade stainless steel, was not assessed for White Corrosion Products, and the aluminum products C1–C5 were not assessed for Red Rusting. The numbers of the different types of specimen and the defect assessments performed on them are summarized in Table 2. Two independent (i.e two observers) assessments were made for appropriate defect/ feature combinations for all specimens and the average calculated and used in the mathematical treatment. Assessments of the defect types were made on the specimen

features as indicated in Table 3. For the Scribes (SC) and the Erichsen Domes (ED),
the worst rating applicable was chosen as representative of the feature. – Features of “Formed” Specimens Assessed for Different Defect Types
Figure 1 – Schematic of “Formed” Specimen
Table 2 – Numers of Specime Generic Types and e n n
G
ns of DifferentD fect Assessme ts Performed o
eneric Type
Them
Defect Type Metallic-coated
Steel + Organic Topcoat
Metallic-only Coated Steel
Stainless Steel + Organic Topcoat
Stainless Steel + Organic Topcoat
ments for Defe ype
Total Assess-
ct TWCP 66 18 30 114 RR 66 18 BL 66 6 30 102 UC 66
6 90
6 30 102
Table 3

ts Blistering Undercutting White Corrosion Produc Red Rusting Flat Surface FS FS Bends – zero t bend t – 3 t bend 3t 3t – 5 t bend 5t 5t – 3 mm diameter conical bend 3mm 3mm – 20 mm diameter conical bend 20mm 20mm Erichsen Domes ED ED Scribes SC SC Top Cut Edge TCE TCE Bottom Cut Edge BCE BCE Vertical Cut Edge of cover plate VCE VCE adjacent to main panel Circular Hole CH Criteria for Allocation of Numerical Ratings to Defects
A number of systems exist for rating defects on painted metal products. One is the ISO Paints and Varnishes – Evaluation of Degradation of Paint Coatings – Designation of Intensity, Quantity and Size of Common Types of Defect – Part 1: General Principles and Rating Schemes (ISO 4628/1), Part 2: Designation of Degree of Blistering (ISO 4628/2) and Part 3: Designation of Degree of Rusting (ISO 4628/3). ISO 4628/1 “establishes a general system for designating the intensity, quantity, and size of common
e
or
.
rough the coating and apparent 0.05%,
types of defects in paint coatings…” It adopts a uniform convention for “designating thintensity and quantity of defects by means of ratings on a numerical scale from 0 to 5, 0 denoting no defects and 5 denoting defects so severe that further discrimination has no practical meaning.” The ratings from 1 to 4 “are so defined that they give an optimal discrimination over the whole range of the scale.” Three tables give rating schemes fintensity of uniform deterioration, quantity of scattered defects and size of defects. The numerical ratings developed for this study have adhered to the 5-point ISO principles. Asa general rule, the means of the two assessments referred to above with a decimal of 0.5were rounded up to the next integer. White Corrosion Products – There being no existing international standard for assessment of the extent of White Corrosion Products, an “in-house” rating system used by BHP Coated Products (Port Kembla, Australia) was adopted. This is in exact accord with Table 1 of ISO 4628/1. The rating number is followed by the description of the extent of the defect: 0 zero, 1 very slight, 2 slight, 3 moderate, 4 considerable, 5 severe Red Rusting – ISO 4628/3 has pictorial standards for designating the degree of rusting of paint coatings (combination of rust broken thunder-rust). The area rusted in percent for each rating is as follows: 0 = 0%, 1 = 2 = 0.5%, 3 = 1%, 4 = 8%, 5 = 40–50%. The ASTM Test Method for Evaluating Degree of Rusting on Painted Steel Surfaces (D610–95) has an 11-point scale for degree of rusting which moves in the opposite direction to ISO 4628/3 and allows for greater discrimination also. ISO 4628/3 presumably is defining the percent area rusted as being “up to” that figure, e.g., rating 1 is for no rust up to 0.05% rusted area. Rating 5 would then be from 8% to 40–50%. This does not really enable distinction between say 10% and 50% rust. A slightly modified scale is developed here based principally on ISO 4628/3 but taking account of D610. The term “trace” in an assessment is designated a

t provided a of
ree of
n e.
.5 er
ethod
pths (minimum and maximum) in millimeters by two
ndercutting rating followed by depth (mm), 0 = 0,
cts
appropriate weighting to different types of defects on features,
percent area of 0.05, and is given a rating of 1. Each independent assessmensubjective percentage area affected by red rusting (0–100%). In general, the averagethese figures was calculated and converted to a 5-point rating as follows: Red Rusting index followed by percentage area of rusting on specimens 0 = 0%, 1 = >0 0.05%, 2 = >0.05 1%, 3 = >1 8%, 4 = >8 40%, 5 = >40%. Blistering – Blistering was assessed according to the Australian Standard AS 1580.481.1.9–1991 Paints and Related Materials – Methods of Test. Method 481.1.9: Coatings – Exposed to Weathering – Degree of Blistering. The pictorial standards for blister size and density are the same as for ASTM Test Method for Evaluating DegBlistering of Paints (D714–87), but in the Australian Standard the numerical rating has been changed to a 5-point scale in accordance with ISO 4628/2. Blistering is appraised iterms of density and size aSb, where a is the index for density and b is the index for sizA single numerical index is required to enable mathematical calculations (statistical analysis etc.) of the data. This was achieved as follows. The averages of the independent ratings for density and size were evaluated separately and rounded to give a representative rating. These numbers were multiplied together, the square root was taken, and the resulting number was rounded to the nearest integer. Example as follows: rating by operator A is 3S4, by operator B is 4S3. This gives an average rating of 3.5S3which is rounded to 4S4. The average indices for size and density are multiplied togethto give 16, the square root is 4; so the blistering index for that feature is 4. Undercutting – ISO 4628 does not specify a rating scale for Undercutting. However, AS 1580.481.3–1992 Paints and Related Materials – Methods of Test: M481.3: Coatings – Exposed to Weathering – Degree of Corrosion of Coated Metal Substrates, has a rating scale for assessment of representative mean creepage of underfilm corrosion from a scribed line and panel edge. This scale is in accord with the ISO principle and has been adopted here for assessment of undercutting. This wasassessed as an actual range of deindependent operators. The arithmetic averages of the two minima and maxima were determined and then converted to ratings (min. and max.) again on the 5-point scale fromthe Australian Standard as follows: U1 = >0 1, 2 = >1 3, 3 = >3 7, 4 = >7 13, 5 = >13. Database of Numerical Ratings – Based on the above criteria, all specimens recovered after exposure for 2 years 29 days were assessed and the average numerical ratings for each defect on the chosen features were calculated for each of the product/exposure condition combinations (20 products 3 sites open/sheltered = 120). The results were entered into an extensive spreadsheet. Table 4 shows part of this spreadsheet, the raw data for six of these combinations, as an example. Three produwith similar paint topcoats (polyester or silicon-modified polyester (SMP)) are chosen (I1, B5, C4 – see Ref. 2). They had all been exposed at a severe marine site for 2 years in the open and under the special shelter (1, 2, O and S respectively as the last three characters in the Specimen ID).
Criteria for Determining the Relative Contribution of Each Individual Feature (Within Feature Type) to the Defect Indices
The philosophy on which the development of performance indices is based depends on assigning an

or“accord d
r a z n adopte eterm ppropriate coefficients for each feature on e a s verity. A e fea s mo ely to a defe nd itse fi e ording l e e f ted in t a e of all rati nly wh ow l
here) which has itself accordingly been used to derive weighting coefficients. The mean values of the defect ratings for each of the “featu ” of the f med specimens are given in Table 5. These mean values have been calculated from all available data for the 120 product/exposure condition combinations. ost features were obtained from about 53% of specimen orrosi Products, 13% for Red Rusting, 49% for Blistering and 69% for Undercutting.
the relative contribution of different features to an overall defect index. The severity” of features is reflected in the defect ratings, which have themselves
ingly been used to derive weighting coefficients. A procedure of inverting anno m li ing has bee d to d ine ath b si of their se sever ture i re lik show ct a co f ci nt should acc ly be sma ler. The s verity of f atures is re lec the da ab s (spreadsheet) of the ngs (o a part of ich is sh n in Tab e 4
res or
Non-zero ratings on all or ms for White C on

Tab ns (This th in
the Open and Sheltered for a Period of Two Years at a Severe Marine Site)
Specimen ID I1 I112S B5120 B512S 20
le 4 – Numerical Ratings for Defects on Selected Features of Formed SpecimeExample is for Three Products with a Polyester or SMP Topcoat Exposed Bo
120 C41 C412S Base Metal St teel Steel Steel Al Al eel S Alloy Coating 5% Al-Zn 5% A 55% Al-Z 55% Al-Zn – – l-Zn n Organic Coating 20
SM20 mSMP
20 m Polyeste
20 m Polyester
20 m Polyester
20 m Polyester
m P
r
Flat Surface 2 3 0 0 0 0 t bend 5 5 2 5 3t bend 2 5 1 2 1 3 5t bend 1 5 1 2 0 0 Conical 3 mm 1 4 1 2 0 0 Conical 20 mm 2 4 1 2 0 2 Erichsen Domes 3 5 1 3 0 0 Scribes 3 5 1 4 0 3 Top Cut Edge 3 5 2 4 3 3 Bottom Cut Edge 3 5 3 4 3 3
Whi
te C
orro
sion
Pro
duct
s W
CP
Cover plate/main panel, Vertical Cut Edge
3 5 2 4 2 3
Flat Surface 0 0 0 0 t bend 0 5 0 0 3t bend 0 0 0 0 5t bend 0 3 0 0 Conical 3 mm 0 0 0 0 Conical 20 mm 0 0 0 0 Erichsen Domes 0 3 0 0 Scribes 0 5 0 0 Top Cut Edge 0 5 0 0 Bottom Cut Edge 0 5 1 3
Red
Rus
ting
0
RR
Cover plate/main panel,Vertical Cut Edge
5 0 2
Flat Surface 1S1 2S4 1S2 0 0 1S1 3t bend 5S1 4S4 0 4S2 1S1 4S3 5t bend 4S1 3S3 0 4S2 0 0 Conical 3 mm 2S1 4S3 0 3S2 0 0 Conical 20 mm 3S1 4S4 0 3S2 0 1S2 R
atin
g R
Erichsen Domes 5S1 3S4 2S2 4S2 0 0 Flat Surface 1 3 1 0 0 1 3t bend 2 4 0 3 1 3 5t bend 2 3 0 3 0 0 Conical 3 mm 1 3 0 2 0 0 Conical 20 mm 2 4 0 2 0 1
Bli
ster
ing
BL
dex
I In
Erichsen Domes 2 3 2 3 0 0 Top Cut Edge 0 2 0 1 0 0 Bottom Cut Edge 0 3 0 2 0 0 Cover plVertical Cu
ate/main pt Edge
3 anel, 0 0 3 0 0
Circular Hole 2 0 1 0 3 0 Min
imum
Scribes 2 1 0 0 0 0 Top Cut Edge 3 3 1 2 2 1 Bottom Cut Edge 4 4 1 2 3 1 Cover plate/main panel,
ge 5 5 1
Vertical Cut Ed2 3 1
Circular Hole 2 3 3 1 3 1
Def
ect T
ypes
Und
ercu
ttin
g U
C
3 2
Ma
Scribes
xim
um
1 3 2 1

Defect Type
Table 5 – Mean Values of Defect Ratings for Features of Formed Specimens(for all Available Data for 120 Product/Exposure Condition Combinations)
Feature WCP RR BL Min. UC Max. UC
Flat Surface 0.84 0.18 0.55 t bend 1.72 0.53
0.08 0.76 i
3t bend 1.27 0.20 1.06 5t bend 0.89 0.14 0.86 Conical 3 mm bend 0.89 Con cal 20 mm bend 0.83 0.10 0.75 Erichsen Domes 1.04 0.26 0.97 Scribes 1.88 0.70 0.30 1.16 Top Cut Edge 2.17 1.18 0.28 1.2 Bottom Cut Edge 2.43 1.53 0.47 1.62 Vertical Cut Edge 2.18 1.40 0.32 1.34 Circular Hole 0.32 1.32
White Corrosion Product/Red Rusting – For White Corrosion Products and Red Rusting the features were considered in three groups: the Flat Surface, the deformed areas (viz. Bends and Erichsen Domes), and the Cut Edges and Scribes (edges of coatings exposed). For each group it was considered that the Feature Index should hpotential maximum value of 100. This criterion determines the value that the sum of the coefficients must have. (a)
ave a
Flat Surface Index – For the Flat Surface the maximum value of a rating is 5, there is only one coefficient, and the relationship to develop the Index for White Corrosion Product and Red Rusting is: FSIWCP/RR = 20 * Flat Surface Rating (FS) (1) (b) Bends Index – For the deformed areas the coefficients for White Corrosion
the Erichsen Domere derived by normalizing the mean values of the ratings to the most severe feature (t
chieved by multiplying by 2 and en rounding. The procedure is shown in Table 6.
for Deformed Areas
e lu Ratin
Va in
ltipl d
Product to describe the relative importance of each of the bends and es wbend) as follows. The mean value of the WCP rating for the t, 3t, 5t, 3mm and 20mm bends and for the Erichsen Domes is divided into 1.72 (the value for the t bend itself). The sum of the coefficients must add up to 20. This is ath
Table 6 – Normalizing Rating Values to Determine WCP Feature Coefficients
Featur Mean VaWCP
e of g
Divide Mean WCP Rating
lue of to 1.72
Mu y by 2 Roun
t bend 2 2 1.72 1 3 t bend 1.27 1.35 2.7 3
0.89 1.92 3.84 4 d 0.89 1.94 3.87 4 nd 0.83 2.06 4.12 4
1.04 1.66 3.32 3
5 t bend Conical 3 mm benConical 20 mm beErichsen Domes

therefore shown below with th parame that ra ., t is t R t) + (3 * 3t) + t) + (4 * 3mm) + ( mm) + (3 * ED) (2) with imum individual rating at each of the features of 5, the Bends Index lso value of 100. Note that the coefficient on the most severe feature he t bend) has the lowest value.
t
mall data set (about 12 specimens) it was decided to adopt the same coefficients as for e White Corrosion Product. Whi
roviding an additional reason for adopting the same set of coefficients. The relationship
The relationship to develop the Bends Index for White Corrosion Product is e abbreviated ters standing for ting, i.e
ating:
BI = (2 WCP * (4 * 5 4 * 20
a potential max has a maximuma
(t For Red Rusting the mean values of the ratings for each of the features yielded a different set of coefficients (for the bend features) to those obtained for the White Corrosion Product. The actual normalized coefficients were as follows: t = 1, 3t = 3, 5= 4, 3mm = 7, 20mm = 5, ED = 2. However, as these values were derived from a very sth te Corrosion Product is a “precursor” to Red Rusting, pto develop the Bends Index for Red Rusting (BIRR) is therefore the same as Equation 2. (c) Cut Edge/Scribe Index – A similar procedure was followed normalisingmean values of the ratings t
the o the highest value, and the results are given in Table 7.
The mean values for WCP were derived from 114 specimens and the mean ssments. As with th
ends Index, a uniform set of coefficients was desirable to cover both White Corrosion
e 1.20, Bottom Cut Edge 1.00,
Blistering – The same procedure as for White Corrosion Product/Red Rusting is llowed. The mean values of the ratings at each of the features of the formed specimens
nd the
Table 7 – Normalizi termine WCP ts o s
Value CP
Rating
ivide Mea alue f WCP in
Value Rating
Divide Mean alue of RR to
1.53
values for RR were derived from 90 specimens, a total of 204 asse e BProduct and Red Rusting. The coefficients for WCP were multiplied by 114 and added tothe coefficients for RR multiplied by 90. The totals were divided by 204 to yield a set of coefficients as follows: Scribes 1.69, Top Cut EdgVertical Cut Edge 1.10. These were rounded to values of 2, 1, 1 and 1 respectively. The relationship to develop the Cut Edge/Scribe Index for both White Corrosion Product and Red Rusting (again with a potential maximum value of 100) is shown in Equation 3.
CEIWCP/RR = 4 (2 * SC + TCE + BCE + VCE) (3) foa normalized coefficients are shown in Table 8.
ng Rating Values to De /RR Feature Coefficienat C ating Edge
Feature Mean of W
D n Vo to 2.43
Mean of RR V in
Scribes 1.88 1.29 .70 2.19 0Top Cut Edge 2.17 1.12 18 1.30
1.00 .53 1.00 ge 1.11 .40 1.10
1.Bottom Cut Edge
ut Ed2.43 1
Vertical C 2.18 1

Table 8 – Normalizing Rating Values to Determine Feature Coefficients for Blistering
Feature Mean Rating Divide into 1.06 Round Flat Surface 0.55 3t bend 1.06 1 1 5t bend 0.86 1.23 1 con 3mm bend 0.76 1.38 1 con 20mm bend 0.75 1.42 1 Erichsen Domes 0.97 1.09 1
(a) Flat Surface Index – For the Flat Surface the maximum value of the rating is again 5, there is again only one coefficient, and the relationship to develop the Flat Surface Index for Blistering is the same as for White Corrosion Products/Red Rusting: FSIBL = 20 * FS (4)
(b) Bends Index – The coefficients for the bends and Erichsen Domes are all unity
(5)
d
ne step. As each individual feature can have a aximum rating of 5, the relationship again yields a potential maximum value of 100:
UCI = (4 * TCE ) + (2 * BCE ) + (3 * VCE ) + (3 * CH ) + (3 * SC ) 6)
and the relationship to develop the Bends Index for Blistering again with a potential maximum value of 100 is: BIBL = 4 * (3t + 5t + 3mm + 20mm + ED) Undercutting – Again the same procedure as for the previous defects is followed.The mean values of the ratings at each of the features (with a highest rating of 1.62) anthe normalized coefficients are given in Table 9. The sum of all of the rounded coefficients is 20. These values have been used to develop the Total Undercutting Index in om
TOT min min min min min
+ TCEmax + BCEmax + VCEmax + CHmax + SCmax (

Mi um utt
Table 9 – Normalizing Rating Values to Determine Feature Coefficients for Undercutting
nimum Undercutting Maxim Underc ing Featun
ing into
A 0.65 Rou
Mean Ratin
Divide into 1.62
A 65 and Round
re MeaRat
Divide A1.62 and nd g A
0.
Top Cut Edge 0.28 5.69 4 1.20 1.35 1 BoEdg
ttom Cut 0.47e
4 2 1.62 1.00 3.4 1
Vertical Cut Edge
3 1.34 1.20 1 0.32 5.00
Circula .00 3 1.32 1.22 r Hole 0.32 5 1 Scribes 0.30 3 1.16 1.40 1 5.32
Determining Relative Contributions of Feature Ty ndices verall efect Indices for a Product W on Prod Over pecim , the m WCP ces foFlat Surfaces, Bends and Cut Edges are respectively 16.8, 20.4 and 42.1. The overall WCP Index is to have a potential maxi value 0. A dence CP greatest on the Cut Edges and least on the Flat Surface (the severe ture), verall relationship to account for the relative contributions of the features should reflect
tion is followed as before by dividing each of the mean indices into e highest value to yield coefficients of Flat Surfaces 2.50, Bends 2.06, Cut Edges 1.
(7)
rmalization is followed as before to yield coefficients for Flat Surfaces .20, Bends 5.92, Cut Edges 1. These coefficients are converted to decimal fractions aintaininlationship to determine the relative contributions of the Flat Surfaces, Bends and Cut
non-zero readings. Normalization is followed as before
pe I to O D
hite Corrosi uct – 114 s ens ean indi r the
mum of 10 s inci of W is least fea the
othis and emphasize the occurrence of the WCP defect on the Flat Surface. The same process of normalizathThese coefficients are converted to decimal fractions, maintaining relativity such that their sum equals 1, by multiplying by 0.18 [1/(2.50 + 2.06 + 1.00)]. The overall relationship to determine the relative contributions of the Flat Surfaces, Bends and Cut Edges to the Total White Corrosion Product Index is: WCPITOT = 0.45 FSIWCP + 0.37 BIWCP + 0.18 CEIWCP
Red Rusting – Over 90 specimens, the mean RR indices for the Flat Surfaces, Bends and Cut Edges are respectively 3.6, 3.7 and 22.0. However, it should be noted theFlat Surface Index is based on only 7 non-zero readings, the Bends index on only 17 non-zero readings and the Cut Edge Index on 55 non-zero readings; these are much smaller samples than for the WCP (equivalent numbers Flat Surfaces 45, Bends 79, Cut Edges 114). No6m g relativity by multiplying by 0.0762 [1/(6.20 + 5.92 + 1.00)]. The overall reEdges to the Total Red Rusting Index is: RRITOT = 0.47 FSIRR + 0.45 BIRR + 0.08 CEIRR (8) Blistering – Over 102 specimens, the mean BL indices for the Flat Surfaces and the Bends are respectively 11.0 and 17.6. The Flat Surface Index is based on 32 non-zero readings, the Bends Index on 49

Contre spreadsroduct, Red Rusting and Blistering. Table 10
to yield coefficients of 1.60 and 1 which are converted to decimal fractions maintaining relativity such that their sum equals 1 by multiplying by 0.3846 [1/(1.60 + 1)]. The overall relationship to determine the relative contributions of the Flat Surface and Bends to the Total Blistering Index is: BLITOT = 0.62 FSIBL + 0.38 BIBL (9) ibution of Features to Total Defect Indices – Using the above relationships,
heet package was used to calculate ndith the Total I ces for White Corrosion gives the component and total indices for P
the same 6 product/exposure condition combinations as in Table 4.
Table 10 – Calculated Indices for All Defect Types on Individual Features, and Total Defect Indices (Example for 6 Product/Exposure Condition Combinations)
Specimen ID I112O I112S B512O B512S C412O C412S WCP FS-Index 40.0 60.0 0 0 0 0
W 17.0 CP B-Index 41.0 92.0 22.0 49.0 3.0
WCP CE-Index 60.0 100 36.0 80.0 32.0 60.0
Whi WCP Total Index 44.0 79.0 14.6 32.5 6.9 17.1
te C
orro
siP
rodu
ct
on
RR FS-Index 0 0 0 0
RR B-Index 0 31.0 0 0
RR CE-Index 0 100 4.0 20.0
Red
Rus
ting
RR Total Index 0 22.0 0.3 1.6
BL FS-Index 20.0 60.0 20.0 0 0 20.0
BL B-Index 36.0 68.0 8.0 52.0 4.0 16.0
Blis
teri
ng
BL Total Index 26.1 63.0 15.4 19.8 1.5 18.5
UC Total Index 12.0 53.0 13.0 47.0 5.0 6.0
etermination of Relative Contributions of Total Defect Indices to the D Product Total Performanc Total Performance Index Based on the Data Itself –development l Perf axim ld be the same for all generic typ ach al fraction c u th tia of l Performan is 10 (a) s en
e Index
The premise underlying the of the Tota ormance Index is that the potential m
es of product. In eum value shou
case, the sum of the derived decimumoefficients
ce Indexmust be againpecim
nity and 0. s
e poten l maxim value the Tota
Aluminum – There ar e t fe it n Products, Blistering and Undercutting. From d e ov ectto dices o er 30 spe imens ollows: WCP 10. ITOT UCI 4. e sa ced nor tion is ollowed dividing each of the indices inthe highest value (10.9) to yield coefficients of 1.00, 1.70 and 2.68, which are normaized to decimal fractions 0.19, 0.31, 0.50 (adding up to 1) by multiplying by 0.1859
e threhe
ypes of deat th
ct: Wh e Corrosioe p t abase, mean rall res ive
tal in v c are as f ITOT = 9, BL = 6.4, TOT =1. Th me pro ure of maliza f to
l-

[Index ba n the data is
lumi TO 31 B T + 0.50 UCITO )
(b) Stainless steel + organic topcoat
1/(1.00 + 1.70 + 2.68)]. The overall relationship for the Total Performance sed o :
TPI (a
num) = 0.19 WCPI T + 0. LITO T (10
– There are three types of defect: Red Rusting, liste
f
B ring and Undercutting. From the database, the mean overall respective total indices (6 specimens) are as follows: RRITOT = 2.0, BLITOT = 0, UCITOT = 0.2. The procedure onormalisation fails in this case as coefficients of 1, and 10 would be obtained. No blistering occurred on the specimens, and one specimen had an undercutting rating of 1 on one feature. The total index for red rust at the stage as exampled in Table 10 was usedor the total performance index. f
(c) Metallic-coated steel + organic topcoat – There are four types of defect: White Corrosion Products, Red Rusting, Blistering and Undercutting. From the database, the mean overall respective total indices over 66 specimens are as follows: WCPITOT = 22.5RRITOT = 4.8, BLITOT = 18.0, UCITOT = 16.0. The procedure of normalization yields equivalent coefficients of 1.00, 4.68, 1.25 and 1.41 which are normalized to decimal fractions 0.12, 0.56, 0.15 and 0.17 by multiplying by 0.12 [1/(1.00 + 4.68 + 1.25 + 1.41)]. The overall relationship for the Total Performance Index based on the data is:
TPI (metallic/org-coated steel) = 0.12 WCPITOT + 0.56RRITOT + 0.15 BLITOT + 0.17 UCITOT (11)
(d)
,
Metallic-only-coated steel – There are two types of defect: White Corrosion Products and Red Rusting. From the database, the mean overall respective total indices ver 18 specimens are as follows: WCPIo TOT TOT
normalization yields coefficients of 1.00 and 4.62 which are = 47.5, RRI = 10.3. The procedure of
normalized to decimal
)
6
fractions 0.18, 0.82 by multiplying by 0.178 [1/(1.00 + 4.62)]. The relationship for the Total Performance Index based on the data is:
TPI (metallic-only-coated steel) = 0.18 WCPITOT + 0.82 RRITOT (12
Total Performance Index Based on the Judgments of Industry Representatives – Eleven industry representatives were asked to assign coefficients (between 0 and 1) to describe the relative importance of the four types of defect on each of the four generic types of product. It was stated that no assignment was to be made for Red Rusting on aluminum, White Corrosion Product on stainless steel, or Blistering and Undercutting on metallic-only-coated steel, and also that the sum of the coefficients must be unity. The averages of the values together with the coefficients derived from the data are given in Table 11. The equations based on the 12 sets of coefficients were used to calculate 12 sets of Total Performance Indices using the spreadsheet.
Results and Discussion
Space precludes a detailed presentation and analysis of the results from this project. Table 12 presents as an example the Total Performance Indices for the sameproduct/exposure condition combinations as previously (see Table 4).
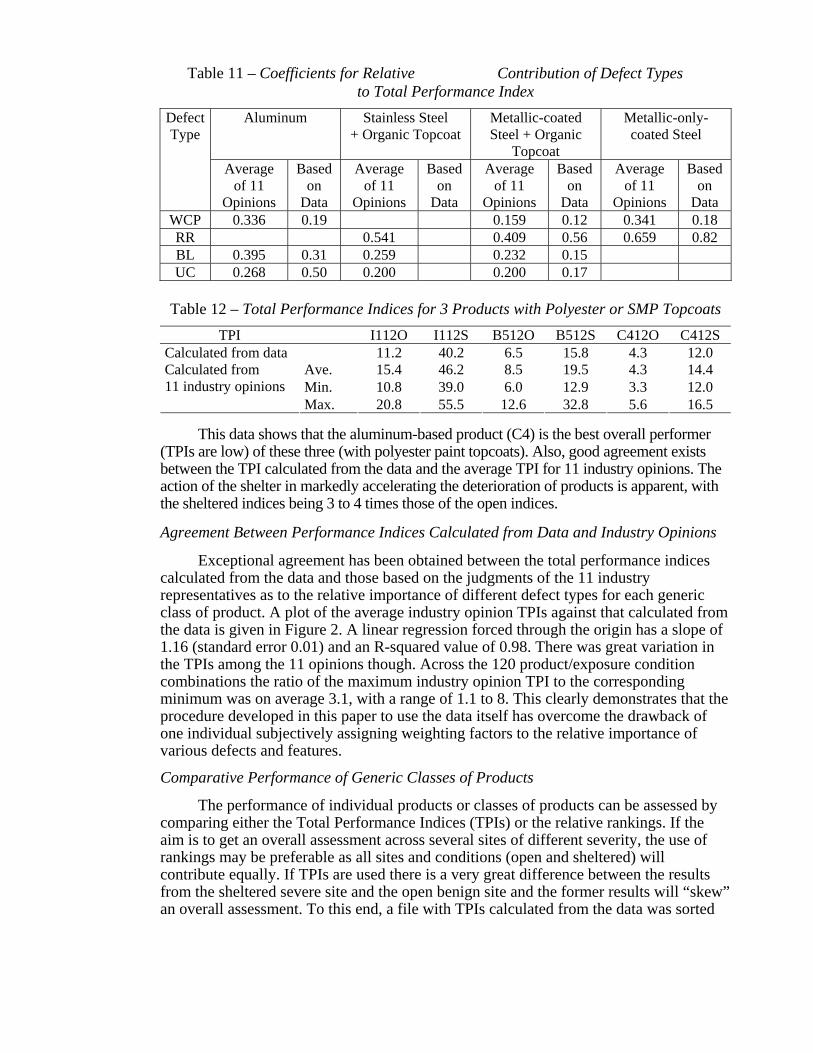
Table 11 – Coefficients for Relative Contribution of Defect Types
Metallic-only-coated Steel
to Total Performance Index
Aluminum Stainless Steel + Organic Topcoat
Metallic-coated Steel + Organic
Topcoat
Defect Type
Average of 11
Opinions
Based on
Data
Average of 11
Opinions
Based on
Data
Average of 11
Opinions
Based on
Data
Average of 11
Opinions
Based on
Data WCP 0.336 0.19 0.159 0.12 0.341 0.18 RR 0.541 0.409 0.56 0.659 0.82 BL 0.395 0.31 0.259 0.232 0.15 UC 0.268 0.50 0.200 0.200 0.17
Table 12 – Total Performance Indices for 3 Products with Polyester or SMP Topcoats
TPI I112O I112S B512O B512S C412O C412S Calculated from data 11.2 40.2 6.5 15.8 4.3 12.0
Ave. 15.4 46.2 8.5 19.5 4.3 14.4 Min. 10.8 39.0 6.0 12.9 3.3 12.0
Calculated from 11 industry opinions
Max. 20.8 55.5 12.6 32.8 5.6 16.5
This data shows that the aluminum-based product (C4) is the best overall performer (TPIs are low) of these three (with polyester paint topcoats). Also, good agreemen ists between the TPI calculated from the data and the average TPI for 11 industry opinions. The action of the shelter in markedly accelerating the deterioration of products is apparent, with the sheltered indices being 3 to 4 times those of the open indices.
Agreement Between Performance Indices Calc
nce indices calculated fromrepresclass of product. A plot of the average indus t that calculated from the data is given in Figure 2. A linear regressi igin has a slope of 1.16 (standard error 0.01) and an R-squared vathe TPIs amcomm nstrates that the procedure developed in this paper to use thone individual subjectively a portance of various defects and features.
Comparative Performance of
comaimrankings mcontribute equally. If TPIs are used there is
w”
t ex
ulated from Data and Industry Opinions
Exceptional agreement has been obtained between the total performa the data and those based on the judgments of the 11 industry
entatives as to the relative importance of different defect types for each generic try opinion TPIs agains
on forced through the orlue of 0.98. There was great variation in
ong the 11 opinions though. Across the 120 product/exposure condition binations the ratio of the maximum industry opinion TPI to the corresponding
inimum was on average 3.1, with a range of 1.1 to 8. This clearly demoe data itself has overcome the drawback of
ssigning weighting factors to the relative im
Generic Classes of Products
The performance of individual products or classes of products can be assessed by paring either the Total Performance Indices (TPIs) or the relative rankings. If the is to get an overall assessment across several sites of different severity, the use of
ay be preferable as all sites and conditions (open and sheltered) will a very great difference between the results
from the sheltered severe site and the open benign site and the former results will “skean overall assessment. To this end, a file with TPIs calculated from the data was sorted

(from20 was added in each case. These rankingsseparately fsummed rankings sheltered versus open is givethe best perf
low to high) for each of the sites/conditions in turn. A ranking from 1 to were summed for each of the products,
or open and sheltered exposures (3 cases, i.e. 3 sites for each). A plot of the n in Figure 3; again low values represent
PVF(I6), and alumpolyester (CConsidering open exposure only, unpainted 55Zn (B1 and B5 respectively), and polyeste erperformproducts. grouped into generic classes. Again the alum
ormers. At the bottom left of the plot PVF2 painted 304 stainless steel (B4), 2 painted (with 25 m primer) 55% Al-Zn (B7), PVF laminated galvanized steel
inum painted with PVF2 (C1), polyester (C4) and urethane X link 3) are performing best considering both open and sheltered exposures.
% Al-Zn and polyester painted 55% Al-r painted 5% Al-Zn (I1), are also bett
ers. See Table 2 of Ref. 2 for full identification and specification details of all
The TPIs from the data itself for the severe marine site are shown in Figure 4 stainless steel product and those based on
inum are performing very well considering both open and sheltered exposures.

100
80
60
40
20
00 2
Ave
rage
TP
I fro
m 1
1 in
dust
ry o
pini
ons
10040 80600
TPI from data
ig Performance age of 11 Industry Opinions Versus that Calculated from the Data
(Two-year Data)
F ure 2 – Total Indices from Aver
o n h of 20 e e e rs
mparative Ra kings for Eacd at Thr e Sit s for Two Yea
Figure 3 – Sum of CProducts Expos

Figure 4 – Total Performance Indices for All Products at S n e (N s a
evere Mari e Sit avy Ba e) Based on D ta Only

Action of the Sheltering System in Accelerating Deterioration For the example given above, the action of the shelters in markedly accelerating the deterioration of products was apparent. Across all of the 20 products the ratios of the sheltered to open TPIs (from the data) were as follows (average followed by min. and max. in parentheses): severe marine site 4.0 (1.0, 20.2), moderate marine/rural site 7.2 (0.6, 21.9), mild marine/urban site 6.0 (1.2, 17.2). These figures represent very significant increases in the rates of deterioration compared to products in open exposure. Future papers will discuss the relationships that exist between sheltered and open exposures in terms of defect types as well as total performance, and compare the results from different exposure periods to determine how well sheltered short-term exposures predict the performance for longer term open exposures. Measurements of air temperature and relative humidity, and also estimates of time of wetness according to ISO 9223 Corrosion of Metals and Alloys – Corrosivity of Atmospheres – Classification, have shown that at the severe marine sites no significant differences exist between the conditions prevailing in the open and those under the specially designed shelter [5]. In contrast, direct measurements of time of wetness and surface temperature using the Scandinavian WETCORR technique [6] have revealed that the actual time of wetness is much longer under the shelter. This is consistent with the observed differences in corrosion rates between the open and sheltered exposures. The mechanism is not yet fully understood but definitely involves the fact that deposited sea salt accumulates with time and never gets an opportunity to be washed off during rain periods [5]. Conclusions A methodology for determining objective quantitative indices to describe the atmospheric corrosion performance of coated metal sheet products has been developed. Analysis of the indices in conjunction with those produced by using subjective opinions from industry representatives, has demonstrated that the new technique can accurately describe and quantify performance. A means is available for a more rigorous and numerical analysis of corrosion performance in an area hitherto often descriptive. A novel semi-sheltered exposure system has been shown to induce highly accelerated deterioration of sheet products, with factors on average from four to seven times comparing indices for sheltered and open exposures. Acknowledgments BHP Research (Coated Products Division) and the International Lead Zinc Research Organisation Inc. (ILZRO) for ongoing financial support and Comalco Aluminium Ltd for prior support of the project. RAN HMAS Cerberus and Mornington Peninsula and District Water Boards for their cooperation in establishing exposure racks within their grounds. David O’Brien, Natalie Sherman and Pon Kao of CSIRO for technical assistance. Mary Cope of CSIRO for the word processing of this document, Cathy Bowditch of CSIRO for editorial and Marie Scott of CSIRO for the figures.
References [1] Willis, D. J., “Performance of 55% Al-Zn Coated Steel Sheets Used for Residential
Houses in Australia,” Proc. 4th Int. Conf. on Zinc and Zinc Alloy Coated Steel Sheet (GALVATECH ’98), The Iron and Steel Inst. of Japan, Chiba, Japan, 1998.
[2] King, G. A., and O’Brien, D. J., “The Influence of Marine Environments on Metals and Fabricated Coated Metal Products, Freely Exposed and Partially Sheltered,” Atmospheric Corrosion, ASTM STP 1239, W. W. Kirk and H. H. Lawson, Eds., American Society for Testing and Materials, West Conshohocken, PA, 1995, pp. 167–192.
[3] Tiemens, J. J., and Hoeflaak, M., “The Performance Level of Some Commercial Coil-Coated Materials,” Construction and Building Materials, Vol. 8, No. 4, pp. 243–259, 1994.
[4] Johnson, K., and Marsh, E., “A Study of Relationships Between Design of Precoated Steel Cladding and its Environmental Behaviour in Service,” Report EUR10715EN, Commission of the European Communities, 1987.
[5] Norberg, P., King, G., and O’Brien, D., “Corrosivity Studies and Microclimate Measurements in Marine Environments,” Proc. 35th Conf. of the Australasian Corrosion Association (Corrosion & Prevention 95), Perth, Australia, 12–16 November 1995, Paper 36.
[6] Norberg, P., Proc. 6th Int. Conf. on Durability of Building Materials and Components, Omiya, 26–29 October 1993, pp. 637–646.