A Method for Systematically Observing and Recording ...dschwein/SMR.pdf · A BRIEF HISTORY OF...
48
SOCIOLOGICAL METHODS & RESEARCH Schweingruber, McPhail / RECORDING COLLECTIVE ACTION The authors provide a set of criteria and procedures for systematically observing and re- cording collective action across temporary gatherings such as political demonstrations. Their method uses trained observers, distributed across a gathering, who complete a code sheet during time interval samples. The code sheet allows observers to record the extent of participation in 40 or more elementary forms of collective action by members of six actor categories. These elementary forms were inductively generated from extensive prior observations of temporary gatherings. The data collected provide a rich record of collective action across space and time. The method can be used to investigate a number of problems facing students of collective action and social movements. A Method for Systematically Observing and Recording Collective Action DAVID SCHWEINGRUBER CLARK MCPHAIL University of Illinois at Urbana–Champaign T his article describes a method for systematically observing and recording collective action within temporary gather- ings. Our method uses trained observers, distributed across a gather- ing, who complete a code sheet during time interval samples. The data collected provide a rich record of collective action across space and time. This method has been used to collect data at three Washington, D.C., demonstrations. Revisions made after the first demonstration, the 1995 March for Life, resulted in the system reported here and were used at the 1995 National Organization for Women’s Rally for Women’s Lives and the 1997 Promise Keepers’“Stand in the Gap” AUTHORS’ NOTE: This research was supported in part by National Science Founda- tion grants to coprincipal investigators Clark McPhail (NSF #SBR 93-2074) and John McCarthy (NSF #SBR 93-2088), Pennsylvania State University. This article has bene- fited from comments by Nancy Berns, Ralph Turner, participants at the 1995 meetings of the American Sociological Association (where an earlier version of this article was pre- sented), and three anonymous reviewers. Direct correspondence to David Schweingruber, Department of Sociology, 326 Lincoln Hall, University of Illinois at Urbana–Cham- paign, Urbana, IL 61801; e-mail: [email protected]. SOCIOLOGICAL METHODS & RESEARCH, Vol. 27 No. 4, May 1999 451-498 © 1999 Sage Publications, Inc. 451
Transcript of A Method for Systematically Observing and Recording ...dschwein/SMR.pdf · A BRIEF HISTORY OF...

SOCIOLOGICAL METHODS & RESEARCHSchweingruber, McPhail / RECORDING COLLECTIVE ACTION
The authors provide a set of criteria and procedures for systematically observing and re-cording collective action across temporary gatherings such as political demonstrations.Their method uses trained observers, distributed across a gathering, who complete acode sheet during time interval samples. The code sheet allows observers to record theextent of participation in 40 or more elementary forms of collective action by members ofsix actor categories. These elementary forms were inductively generated from extensiveprior observations of temporary gatherings. The data collected provide a rich record ofcollective action across space and time. The method can be used to investigate a numberof problems facing students of collective action and social movements.
A Method for Systematically Observing
and Recording Collective Action
DAVID SCHWEINGRUBERCLARK MCPHAIL
University of Illinois at Urbana–Champaign
T his article describes a method for systematically observingand recording collective action within temporary gather-
ings. Our method uses trained observers, distributed across a gather-ing, who complete a code sheet during time interval samples. The datacollected provide a rich record of collective action across space andtime. This method has been used to collect data at three Washington,D.C., demonstrations. Revisions made after the first demonstration,the 1995 March for Life, resulted in the system reported here and wereused at the 1995 National Organization for Women’s Rally forWomen’s Lives and the 1997 Promise Keepers’ “Stand in the Gap”
AUTHORS’ NOTE:This research was supported in part by National Science Founda-tion grants to coprincipal investigators Clark McPhail (NSF #SBR 93-2074) and JohnMcCarthy (NSF #SBR 93-2088), Pennsylvania State University. This article has bene-fited from comments by Nancy Berns, Ralph Turner, participants at the 1995 meetings ofthe American Sociological Association (where an earlier version of this article was pre-sented), and three anonymous reviewers. Direct correspondence to David Schweingruber,Department of Sociology, 326 Lincoln Hall, University of Illinois at Urbana–Cham-paign, Urbana, IL 61801; e-mail: [email protected].
SOCIOLOGICAL METHODS & RESEARCH, Vol. 27 No. 4, May 1999 451-498© 1999 Sage Publications, Inc.
451
Sacred Assembly. This article presents data from the March for Lifebut describes the refined method used at the other two demonstrations.First, we give a brief history of collective action research and presentfive problems faced by scholars of collective action and social move-ments. Second, we outline our method and how it is implemented.Finally, we revisit the five problems, providing preliminary data to ad-dress three of them and describing how we intend to address the re-maining two problems using our method.
A BRIEF HISTORY OF COLLECTIVE BEHAVIORAND COLLECTIVE ACTION RESEARCH
FROM IVORY TOWER TOFIELD RESEARCH ON “THE CROWD”
To appreciate the current problems scholars of collective action arefacing, it is necessary to provide a brief history of collective actionresearch. Despite more than a decade of pleas for empirical researchon collective behavior and the crowd (e.g., Strauss 1947; Blumer1957; Turner 1958; Bolton 1962), it was not until the early 1970s thatsociologists began leaving their armchairs and venturing into the fieldto observe and record what people were doing in demonstrations andriots (e.g., Quarantelli and Hundley 1969; Heirich 1971; Berk 1972;Fisher 1972; McPhail 1972).1 This yielded several reports of on-siteobservations and limited methodological strategies for generatingeven more observations. Developing these strategies was easier saidthan done.
Blumer (1957:135) attributed our ignorance of what occurs incrowds to the absence of “a well thought out analytic scheme whichwould provide fruitful hypotheses and lead to more incisive observa-tions.” Regrettably, at the crux of this admirable admonition is a para-dox. Incisive observations presuppose a set of conceptual criteriaspecifying the phenomena to be observed; fruitful hypotheses presup-pose reasoned statements of a relationship between those phenomenaand their sources and/or consequences, which are amenable to empiri-cal scrutiny. But the fruitful hypotheses and conceptual criteria of awell-thought-out analytic scheme must build on at least minimal
452 SOCIOLOGICAL METHODS & RESEARCH

observations of the phenomena to which that scheme is addressed.Hence, Blumer’s paradox!
In the face of this methodological paradox, most sociologists com-mitted to empirical research on collective behavior reverted to doingwhat they then did best. Sometimes they ventured into the field tointerview crowd or demonstration participants (e.g., Lin 1975;Seidler, Meyer, and MacGillivray 1977; Aveni 1977), or theyattempted to reconstruct what happened after the fact by questionnaire(e.g., MacCannell 1973; McPhail and Miller 1973). Some combinedinterviews with observations to create richly detailed descriptions ofgatherings (e.g., Heirich 1971; Berk 1972, 1974; Lofland and Fink1982; Wright 1978; Lofland 1985). Others developed criteria and pro-cedures for the systematic coding of collective action events in news-paper and other document archives (e.g., Shorter and Tilly 1974; Tilly,Tilly, and Tilly 1975; Tilly 1978, 1979, 1995).2 But little immediateprogress was made toward the resolution of Blumer’s (1957) meth-odological paradox, at least at the microlevel of analysis of what tran-spires within crowds.
A MACROSOLUTION AND ITS MICROPROBLEMS
Many political sociologists and political scientists were critical ofBlumer’s (1957) theoretical analysis of the crowd and collectivebehavior on the grounds that it discredited those purposive individualswho were acting collectively to bring about (or resist) social, political,and economic change in the societies in which they lived. These mac-rosociologists and political scientists not only opted for alternativemodels of rational individual actors engaged in collective actions, butthey also sought to place those actions within larger social, political,and economic frameworks and to do so across larger expanses ofspace and time. In fact,collective action, the term we use here, hasevolved as the concept of choice over what had become, for thesescholars, the pejorative concept of collective behavior. They drewupon a variety of longitudinal data sets generated by governmentaland private agencies for measures of social, political, and economicobstacles to and opportunities for collective action. But no such datasets existed from which to construct measures of the frequency, size,form, and consequences of collective action. These had to be created,
Schweingruber, McPhail / RECORDING COLLECTIVE ACTION 453

and ingenious efforts were undertaken to do so from daily newspapersthat were national in scope and continuous across large periods of time(Gurr 1968; Shorter and Tilly 1974; Tilly et al. 1975; McAdam 1982;Tarrow 1989; Olzak 1992).
What is common to all these efforts is both the high quality of theirscholarship and their use of newspaper archives as sources of continu-ous records of collective action from which empirical data sets can beconstructed on the frequency, size, form, and consequences of collec-tive action. It is difficult to exaggerate the significance of this eventanalysis of collective action. Over the past three decades, it hasbecome a growth industry among sociologists and political scientistsin the United States (Jenkins and Perrow 1977; Olzak 1992; Everett1992; McCarthy, McPhail, and Smith 1996) and in Europe (Tilly et al.1975; della Porta and Tarrow 1986; Tarrow 1989; Kriesi et al. 1995;Rucht 1990; Koopmans 1993).
The care that has been exercised in evaluating the newspaperarchives and constructing the collective action data sets leaves littledoubt that national papers carry valid if superficial accounts of protestevents. But there have been continuing and lingering doubts about theextent to which those accounts are representative of the population ofprotest events to which social science investigators want to generalizewith the results of their statistical analyses of those data sets. Untilrecently, there was no readily obvious means of establishing an inde-pendent measure of the population of protest events in a specifiedpolitical jurisdiction against which to compare the sample of protestevents reported in the print and electronic media samples of suchevents.
McCarthy et al. (1996) generated a near-exhaustive measure of thepopulation of protest events by compiling demonstration permitsissued by the three police agencies in Washington, D.C., for 1982 and1991. They compared the characteristics of protest events described inthe population of demonstration permits (and applications) in policeagency records against the characteristics of those events reported inthe print media (Washington PostandNew York Times) and in the elec-tronic media (national nightly news telecasts of ABC, CBS, andNBC). This research established three important facts for the issuesaddressed in this article. First, the mass media report less than 10 per-cent of the approximately 2,000 demonstrations that occur in
454 SOCIOLOGICAL METHODS & RESEARCH

Washington, D.C., each year. Second, most demonstrations that occurin Washington involve fewer than 25 participants. Third, there is apositive relationship between the size of the demonstration and thelikelihood that it will be reported in the mass media. Space and timeconsiderations do not permit a further discussion of all the issues thatare involved. Suffice it to say that the mass media report only the tip ofthe iceberg of protest events. These facts raise significant researchproblems. But before addressing them, we turn to another solution tothe problem of studying collective action.
DEVELOPMENT OF A MICROSOLUTION:SOME ELEMENTARY FORMS OF COLLECTIVE ACTION
For one sociologist (McPhail 1969), a critical conceptual break-through came from reading Turner’s (1964) seminal discussion of“the illusion of unanimity” within the crowd and his suggestion thatcrowds are better characterized by what he called “differential expres-sion.” For McPhail, this offered one way of addressing Blumer’s(1957) methodological paradox, and he launched an investigation ofthe different forms that collective behavior might take within largegatherings and the extent of participation in those forms ranging fromtwo persons to the entire gathering. The primary obstacle was identi-fying what “collective” phenomena to look for and how to recognizeand record those phenomena when they occurred. There was no “wellthought out analytic scheme” to provide conceptual guidance or adetailed methodological recipe. McPhail’s (1972) fallback strategywas to deploy multiple observers with pen and paper to record any andall instances of elementary social behavior in demonstrations andother gatherings. They were trained and directed to record descrip-tions of all instances of two or more persons acting with or in relationto one another. Later, these observers improved their observations bymaking videotape and photographic records.
This early fieldwork had two objectives. First, McPhail and his col-leagues (McPhail and Pickens 1975) attempted to generate an exhaus-tive list of elementary forms of social behavior observed in hundredsof political, sport, and religious gatherings, as well as commonplaceor prosaic gatherings. This procedure generated extensive empiricalrecords (Pickens 1975; Wohlstein 1977a, 1977b; Wohlstein and
Schweingruber, McPhail / RECORDING COLLECTIVE ACTION 455

McPhail 1979) from which a taxonomy of elementary forms of socialor collective acts was subsequently created (McPhail 1991).
Second, McPhail and his colleagues were simultaneously attempt-ing to create criteria for identifying social or collective actions. To cre-ate a logical and empirically grounded taxonomy of types of collectiveactions, they needed a set of criteria that would delimit what was andwhat was not included. Contemporary definitions of collective behav-ior were problematic because they emphasized what collective behav-ior was not, referred to what allegedly caused or did not cause collec-tive behavior, or were limited to extraordinary events (McPhail 1991).More helpful was Wallace’s (1969:5) judgment that the common de-nominator of virtually all definitions of “the social” was “interorgan-ism behavior relations . . . the regular accompaniment of one organ-ism’s behavior by at least one other organism’s behavior.” WhatMcPhail and his colleagues were repeatedly observing and recordingwere elementary forms of social behavior. What was required was thespecification of behaviors and dimensions in terms of which behav-iors of two or more persons could be judged to regularly accompanyone another. This resulted in the following working definition of col-lective action:
Two or more persons engaged in one or more actions (e.g., locomotion,orientation, vocalization, verbalization, gesticulation, and/or manipu-lation), judged common or concerted on one or more dimension (e.g.,direction, velocity, tempo, or substantive content) (see McPhail1991:159).
These actions are termed herecollective actions-in-commonwhentwo or more persons are performing the same actions at more or lessthe same time; they are termed herecollective actions-in-concertwhen two or more persons are performing different actions that fit to-gether to yield a sequence of concerted actions (e.g., the division of la-bor in conversations, two-party chants, or complex cards stunts).McPhail’s (1991) observations indicate that while conversations (a se-quence of concerted actions) are one of the most frequent forms of act-ing together in all types of gatherings, actions-in-common are other-wise more prevalent.
456 SOCIOLOGICAL METHODS & RESEARCH

McPhail (1991) listed 40 frequently observed forms of collectiveaction-in-common (see Figure 1). He grouped these into seven catego-ries: orientation (facing), vocalization (mouth sounds other thanwords), verbalization (making words with the mouth), vertical loco-motion (movement of the body over the same point on the ground),horizontal locomotion (movement of the body from one point on theground to another), gesticulation (movement and configuration of fin-gers, hands, and arms in a manner to make a significant symbol), andmanipulation (using hands to applaud or to strike, carry, throw, pull,etc.).
Although this list of elementary forms may not be exhaustive, it isempirically grounded. McPhail (1991) argued that these variousforms of people acting together alternate with the actions those peopletake alone. Taken together, the aggregation of all those individual andcollective actions constitute what has traditionally been called “thecrowd” but which McPhail calls a temporary gathering. The conceptof the crowd implies a uniformity of action and a homogeneity ofactors that are empirically false. In view of the problems with this anti-quated concept, we will use the termtemporary gathering.3 In turn,two or more gatherings (e.g., a rally followed by a march) make upwhat is called an event; the aggregation of two or more events (e.g.,daily rallies followed by marches to picket line sites) make up a cam-paign. This cumulative sliding scale of micro- to macrounits of analy-sis corresponds to the intersects of micro- to macrointervals and seg-ments of space and time and is summarized in Figure 2. Although asimilar nesting of micro- within macrocollective phenomena is evi-dent in the work of Lofland (1985) and Olzak (1992), there has beenlittle empirical work that has spanned this scale. Tilly’s project (1978,1979, 1986, 1994, 1995; Tilly et al. 1975) is an exception. By focusingon the “action verbs” in archived newspaper reports and other chroni-cles of contentious gatherings, Tilly (1995) identified variations inverbs describing actions by or within contentious gatherings in GreatBritain between 1758 and 1834. Tilly also nests individual and collec-tive actions within what he calls performances (and we call gatheringsand events), which in turn are nested in campaigns, phenomena thatare mobilized by social movement organizations and organizers.4
Schweingruber, McPhail / RECORDING COLLECTIVE ACTION 457

FIVE PROBLEMS TO BE SOLVED
While both the macro- and microapproaches to studying collectiveaction have made valuable contributions to our knowledge, both raiseadditional problems that can only be investigated by a method forwhich there are no precedents. In this section, we pose five such prob-lems in the form of questions that our method can address. Later, weprovide data that address three of the problems and show that ourmethod provides the means for addressing the other two.
Problem 1: Of all the actions in which two persons in temporarygatherings could engage, inwhich ones do they engage,with what fre-quency, and to what extent?A major problem with any inductivelygenerated empirical taxonomy, such as McPhail’s (1991), is the un-
458 SOCIOLOGICAL METHODS & RESEARCH
Collective orientation Collective vocalization Collective verbalization1. Clustering 1. Ooh-, ahh-, ohhing 1. Chanting2. Arcing, ringing 2. Yeaing 2. Singing3. Gazing, facing 3. Booing 3. Praying4. Vigiling 4. Whistling 4. Reciting
5. Hissing 5. Pledging6. Laughing7. Wailing
Collective gesticulation (nonverbal systems)1. Roman salute (arm extended forward, palm down, fingers together)2. Solidarity salute (closed fist raised above shoulder level)3. Digitus obscenus(fist raised, middle finger extended)4. #1 (fist raised shoulder level or above, index finger extended)5. Peace (fist raised, index finger and middle finger separated and extended)6. Praise or victory (both arms fully extended overhead)
Collective vertical Collective horizontal Collectivelocomotion locomotion manipulation
1. Sitting 1. Pedestrian clustering 1. Applauding2. Standing 2. Queuing 2. Synchroclapping3. Jumping 3. Surging 3. Finger snapping4. Bowing 4. Marching 4. Grasping, lifting, waving object5. Kneeling 5. Jogging 5. Grasping, lifting, throwing object6. Kowtowing 6. Running 6. Grasping, lifting, pushing object
Figure 1: Some Elementary Forms of Collective Action-in-CommonSOURCE: Adapted from McPhail (1991).

known limitations of the empirical base from which that taxonomywas created. A lone observer, or even a small number of observersworking with the same criteria, can only record what occurs in smallgatherings or in limited sections of large gatherings. Investigations ofdemonstrations using space and time sampling are necessary to deter-mine which of McPhail’s forms are prevalent, which are not, and whatadditional forms should be added to the list of most frequently occur-ring forms. Later, we present data addressing this question.
Problem 2: How do collective actions vary by space and timewithin demonstrations?Although Turner’s (1964) discussion of “theillusion of unanimity” is more than three decades old, there has beenno attempt to systematically assess the extent of variation within gath-erings. The attention of most protest scholars has been limited to a few
Schweingruber, McPhail / RECORDING COLLECTIVE ACTION 459
Figure 2: Units of Analysis by Spatial and Temporal Levels of AnalysisSOURCE: Adapted from McPhail (1991).

variables—demonstrations’ frequency, size, and form (e.g., rally,march, vigil, intervention, or obstruction); number of arrests; andpresence or absence of violence. Researchers who have employed themicroapproach have focused on more types of collective action andhave addressed the issue of variation within demonstrations (McPhail1991). However, to systematically address this question requires thecollection of data with multiple observers using space and time sam-pling. Later, we present data addressing this question.
Problem 3: To what extent do the large protest events reported inthe mass media differ from the smaller protest events, which are morecommon but less likely to be reported?Since the reports found in themass media are the ones that collective action scholars have most fre-quently analyzed, their analyses have been biased toward large dem-onstrations. Whatever bias may exist does not invalidate these schol-ars’ reports, but learning the nature of the bias will make them moreuseful for understanding protest events. And since small protestevents go virtually uncovered by the media (and are therefore ex-cluded from most scholarly analyses), another method is required notjust to compare them to bigger ones but to conduct any systematic in-vestigation of them.
Problem 4: What types of description bias color the media reportsof demonstrations that are covered?McCarthy et al.’s (1996) investi-gation of selection bias addresses the issue of which demonstrationsare covered by the mass media. McCarthy et al. (1998) address thequestion of how newspaper and television accounts of the same dem-onstrations have differed. But there have been no systematic empiricalanalyses of the extent to which the descriptions of protesters and pro-test actions in the print and electronic media correspond to systematicobservations of protesters’actions recorded by social scientists acrossthe space-time duration of the protest event. Any investigation of thisquestion will require a method for identifying and recording demon-stration activities so they can be compared to media accounts. Later,we present preliminary data addressing this question.
Problem 5: How can television news reports of demonstrations bemade a fruitful avenue for research on demonstrations, as newspaper
460 SOCIOLOGICAL METHODS & RESEARCH

reports have been for the past three decades?The transcripts of televi-sion reports can be mined for some of the same information that hasbeen obtained from newspaper stories (McCarthy et al. 1998). How-ever, this method neglects the valuable information in the stories’vis-ual images. A method is needed to record this information.
A method for addressing all five of these problems must have thefollowing features: (1) it must use space and time sampling to collectrepresentative data throughout a demonstration, (2) it must be flexibleenough to study demonstrations of various sizes and types (e.g., politi-cal, religious, sports, prosaic), and (3) it must be adaptable for codingdemonstrations on television news reports. The method we presenthere has these features and is designed to address the five problems.
A REVISED TAXONOMY OF ELEMENTARY FORMS
The central feature of this method is the identification of the extentand variation of collective action. In developing the taxonomy for thismethod, we attempted to follow two principles. First, the system mustinclude a wide variety of collective actions, both the frequent and theinfrequent, and must be flexible enough to be used for different typesof gatherings and research questions. Second, the system must be easyto use. This requires a taxonomy simple and clear enough that observ-ers with a minimum amount of training will be able to identify andcode the elementary forms in a few minutes. It also requires that thetaxonomy can be represented on code sheets that can be easily trans-ported and used in the field.
McPhail’s (1991) initial taxonomy of elementary forms was reor-ganized around four regions of the body. This organization can besummarized by answers to four questions: Which direction are peoplefacing? What noises are people making with their mouths? What arepeople doing with their arms, hands, and fingers? What are the posi-tions and movements of people’s torsos and legs in relationship to theground? These four dimensions—called facing, voicing, manipulat-ing, and locomotion/body position—subsume the seven categoriesoffered by McPhail. In turn, the variations on each of these fourdimensions yield a number of elementary forms of collective action.Our current taxonomy lists 40 of these elementary forms along with
Schweingruber, McPhail / RECORDING COLLECTIVE ACTION 461

10 “other” selections that encompass all additional variations of thefour dimensions.
Actions on each of the four dimensions are more or less mutuallyexclusive. Normally, a person can face but one direction, can make butone noise with his or her mouth, and is in but one body position at anyone point in time. However, since people have two sets ofarms/hands/fingers, their manipulation actions are not always mutu-ally exclusive.
Elementary forms that share important features are groupedtogether into mutually exclusive categories. Figure 3 presents the fourdimensions, the two levels of categorization, and the elementaryforms that belong to the dimensions and categories.
Facingis subdivided into two frequently observed types of collec-tive facing. Facing in the same (i.e., parallel) direction includes facingpeople who walk together in the same direction and those facing thesame direction because they are looking at (monitoring) the same tar-get. Facing in converging directions includes people in conversationclusters, arcs, and rings.
Voicing includes vocalizing (e.g., cheering, booing, laughing,whistling) and verbalizing (e.g., talking, singing, chanting). Talkingcan be further divided on the basis of substantive content (praying,conversing, etc.).
Manipulatingmay involve objects (e.g., carrying, striking, throw-ing), another person (e.g., embracing, restraining, striking), one’s ownbody (e.g., clapping, snapping), or gesturing (making symbols; e.g.,#1, peace, clenched fist). Carrying objects and passing objects are fur-ther divided based on the type of objects being manipulated. Forinstance, two of the objects most commonly carried in a demonstra-tion—placards and audiovisual equipment—have their own category.5
Locomotion/body positionis divided into three categories: horizon-tal locomotion, vertical locomotion, and vertical position. People maymove their bodies horizontally so that the point on the ground overwhich they are positioned changes (e.g., walking, marching, and run-ning). People may move their bodies vertically from one position toanother over the same point on the ground—for example, standing(up), sitting (down), and lying (down). Vertical body positions are sta-tionary positions that result from types of vertical motion. Theseinclude upright, seated, and prone. Although the vertical motion and
462 SOCIOLOGICAL METHODS & RESEARCH

vertical position categories seem similar (standing vs. upright), theydescribe very different types of collective action. An example of col-lective upright would be a collection of people who are all “standing
Schweingruber, McPhail / RECORDING COLLECTIVE ACTION 463
Figure 3: The Organization of the 50 Elementary Forms Used in the Coding Scheme

around,” while an example of collective standing would be a collec-tion of people who are seated and then move together into a standingposition. The English wordstandingobscures the difference betweenthe two.
The four dimensions were selected because of the general mean-ingfulness attached to these body regions for understanding humanattention, communication, and action. Nonetheless, these dimensions,the categories, and the specific elementary forms may require modifi-cation and adaptation to the particular type of gathering under investi-gation (e.g., religious or sport), its cultural setting, and the researchquestion.6 In the next section, we address how we chose elementaryforms for observing political demonstrations in Washington, D.C.Then we suggest other variations to demonstrate the flexibility of thescheme.
CHOOSING LIKELY FORMS FORA POLITICAL DEMONSTRATION
In each of the above categories and subcategories of elementarycollective action, we could list dozens or even hundreds of examplesthat have been observed in many gatherings. Our code sheet containsonly 40 elementary forms (plus 10 residual “other” categories). Thenumber of forms on the sheet was limited by the principle that thescheme must be easy to use and transportable. Limiting the number offorms, however, required selecting those that would most likely beobserved at a political demonstration. If less frequent types of actionoccur, observers code these in 1 of 10 “other” selections. These otherselections fill gaps in the scheme, and since coders provide details ofthese other forms, they assist us in revising the scheme for futureresearch.
For the vocalizing subcategory, for instance, we initially listed 12examples that we frequently observed in gatherings: cheering, booing,oohing, ohhing, ahhing, hissing, crying, laughing, whistling, shriek-ing, wailing, and playing (wind) instruments. Five of the categorieswere then collapsed into two: oohing/ohhing/ahhing and shrieking/wailing, resulting in nine categories. Of these nine, three are listed onthe code sheet—cheering, booing, and oohing/ohhing/ ahhing. The
464 SOCIOLOGICAL METHODS & RESEARCH

remaining six and any other instances of vocalizing are coded as“other.”
One significant decision was to collapse all of the vertical positionand vertical motion subcategories so that the listed forms are standing/upright, sitting/seated, kneeling/knelt, and lying/prone. Wheneverelementary forms are collapsed, information is lost. Here we lose thedistinction between people who are all in an upright position and peo-ple who move together from a seated position to an upright position.For some investigations (e.g., of religious services), this distinctionmight be important. Other forms in this category include bowing/bowed, kowtowing/kowtowed, jumping, and falling.
The four-level organizational scheme found in Figure 3 was col-lapsed into two columns on the code sheets (see Figure 4). Instructionsfor identifying each form are found in theCollective Action Observa-tion Primer (McPhail, Schweingruber, and Berns 1997), the hand-book issued to observers.7 For instance,
Chantingis verbalizing the same words in unison, usually repeatedly, andoften in rhythm.
Striking thingsis hitting something forcefully, either with the hands orwith something held with the hands, such as a stick or bat. Striking maybreak something (such as striking a car window) or make a noise (suchas striking a drum). If the striking damages or destroys property, it isalso coded as violence against property.
Kneeling/kneltdescribes actors who are moving from another body posi-tion (typically sitting or standing) to a knelt position or those in theknelt position (i.e., with the weight of the body rested on the knees andthe front of the lower leg and foot).
Again, we emphasize that our list of elementary forms may not beexhaustive. However, we have observed repeatedly these forms of twoor more people acting together in hundreds of substantively differentgatherings. There are undoubtedly additional forms of collective ac-tion that the reader can imagine and that we have ourselves observedin prosaic, religious, and sport gatherings. This list was tailored toidentify the most frequently observed and likely observable forms ofcollective action in political demonstration gatherings such as thoseunder investigation.
Schweingruber, McPhail / RECORDING COLLECTIVE ACTION 465

466 SOCIOLOGICAL METHODS & RESEARCH
Figure 4: The Code Sheet

FLEXIBILITY OF THE SCHEME
The taxonomy of elementary forms is designed to be flexible. Anyof the dimensions, categories, and forms can be expanded, combinedwith others, consigned to “other” status, or eliminated. There are threereasons for this flexibility. First, the list of forms presented here ismeant to be provisional. One of the rationales for this project is todiscover which forms of collective action are prevalent and which arenot.
Second, the list will require slight modification depending on thetype of gathering and may require greater modification depending onthe culture in which the gathering occurs. But there must be a startingplace, and the list we present here was designed for political gather-ings in the United States. An investigation of religious, sports, or pro-saic gatherings might require a slightly different list.
Third, the list of forms can be modified depending on the researchquestion. The list we present here is designed to investigate the pres-ence and distribution of common forms. But an investigation of a par-ticular form would require a different list of forms. For instance, ifgestures are being investigated, the gesture form can be expanded tolist specific gestures (e.g., raised fist, raised index finger, raised mid-dle finger, raised index and little finger). If locomotion is being inves-tigated, Morris (1985) lists 36 types of “gait”—horizontal motion byfoot—that could be added to the taxonomy (e.g., strolling, swagger-ing, and promenading). If vehicular motion were a concern, separatecategories could be created for bicycles, skateboards, roller skates,roller blades, cars, trucks, and so on.
The same system used to code elementary forms can also be used tocode other types of collective action of interest to the investigator. Weinclude three of these on our code sheets: violence against property,violence against persons, and clothing-in-common. Although vio-lence is infrequent in temporary gatherings (Eisinger 1973; Tilly et al.1975; Edgerton 1979; Smith 1983), it is important to record instanceswhen it occurs since we are interested in comparing our results tomedia reports of political demonstrations. Violence is not an elemen-tary form since it comprises a large range of behaviors (e.g., striking,kicking, throwing objects). However, it can be coded in the same man-ner as are the elementary forms. Clothing-in-common is coded when
Schweingruber, McPhail / RECORDING COLLECTIVE ACTION 467

people wear head coverings or upper-body clothing that match. This iscommon in political demonstrations, but the prevalence of clothing-in-common may vary by type of gathering. We have included it here toacknowledge this issue.
THE CODE SHEET
The central element of the code sheet is a 6× 54 matrix of cells thatallows the observer to record the frequency of participation in elemen-tary forms. The sheet also includes sections for recording theobserver’s identity, the time and location of the sample, the density ofthe observer’s area and how many people are in it, and a confidencescale. We will take up each element on the code sheet in the order thatthe observers complete them.
OBSERVER’S IDENTITY; TIMEAND ALLOCATION OF THE SAMPLE
Four cells at the top of the sheet (see Figure 5) allow the coder toindicate (1) his or her identity with initials and ID number; (2) the cod-er’s location in the gathering, using a coordinate system; and (3) thetime of the sample. The location and time cells allow the data to bepositioned in space and time.
NUMBER OF PEOPLE IN THE GATHERING
A key and two scales on the right-hand side of the sheet (see Figure 6)are used to code the estimated total number of people in a coder’s areaof responsibility and the density of the people in the area. The numberof actors key provides a series of categories for estimating the numberof actors, each preceded by an alphabetic designation. The observermakes no entry in this key; rather, the letters there are used to makeentries in several other locations on the code sheet. Using the ranges inthe key, coders circle 1 of 10 capital letters (A throughJ) to indicate theestimated number of people in their area of responsibility (hereafter,area). The letterA refers to one person, while the letterJ refers to morethan 1,000 people in the area.
468 SOCIOLOGICAL METHODS & RESEARCH

The four density categories designate variations of densities fromthe perspective of someone attempting to walk from one side of thearea to the other. Coders circle one of four descriptions, which are ex-plained in the primer:
Free passagemeans you could freely walk through the area without hav-ing to significantly alter the direction or velocity of your movement.
Must slow/turnmeans you could walk through the area by slowing downor turning your path of movement to circumvent the people in the area.
“Excuse me”means you could walk through the area only by asking oneor more actors in your path, “Excuse me, could I get through here?”
Difficult movementmeans it would be very difficult to move through thearea.
CATEGORIES OF ACTORS
The main matrix on the code sheet has six columns, which corre-spond to five categories of people who are often present at demonstra-tions (MacCannell 1973) and an “other” column. Like the elementaryforms, the particular actor categories were selected because of thetype of gathering being coded. For other types of gatherings in other
Schweingruber, McPhail / RECORDING COLLECTIVE ACTION 469
Figure 5: Code Sheet Cells for Coder Identity and Location and Time of Sample

places, different categories would be appropriate. TheCollective Ac-tion Observation Primer(McPhail et al. 1997) contains instructionsfor deciding the actor category to which people belong. Coders are in-structed to consider such factors as actions, words, clothing, relation-ships, locations,andartifacts.Thesixactorcategoriesare the following:
Demonstrators are at the gathering to support the purpose of the demon-stration.
Onlookers/passersbyare at the gathering site for purposes unrelated to thedemonstration.
470 SOCIOLOGICAL METHODS & RESEARCH
Figure 6: Code Sheet Cells for Number and Density of People in Gathering

Policeare any law enforcement officials at the gathering.Media are reporters, photographers, and video camera operators from
newspapers or broadcast news agencies.Counterdemonstratorsare at the gathering to demonstrate opposition to
the purpose of the demonstration.Others include vendors, pickpockets, sociologists, and people demon-
strating for purposes unrelated to the demonstration.
Beneath each of the actor category column headings is a cell inwhich the observer is asked to estimate the number of actors in eachcategory who are present in the observer’s area of responsibility andwho are visible to the observer (see Figure 7). Once again, the capitalletters (A throughJ) from the number of actors key are used for thispurpose. If no one from a category is in the area, the appropriate cell isleft blank.
Many people in the area may not be visible to the observer becausethey are behind other people. The observer has no way of judging towhich actor category they belong or in what elementary forms they areparticipating. The judgments about participation in elementary formsare based only on those actors who are visible to the observer. We donot consider this a major problem because any one observer’s record
Schweingruber, McPhail / RECORDING COLLECTIVE ACTION 471
Figure 7: Code Sheet Cells for Number of Actors Visible in Six Categories

of collective action represents only a sample of the collective action inan area of the gathering, not all the collective action that occurs.
CODING ELEMENTARY FORMS
The remaining 53 rows on the central matrix are used to code pro-portions of actors in each category who are participating in one ormore of the elementary forms of collective action (or the violence orclothing categories) (see Figure 8). Each cell corresponds to a cate-gory of actors and an elementary form. For each cell, the coder esti-mates the proportion of the visible actors in a category participating inthat particular elementary form. The lowercase letters (a through g),from the proportion of actors key, are used to indicate seven ranges ofproportions. Anaentered in the box indicates that although the actionis observed, only one person is acting, so no collective action is pres-ent. The lettersb throughg indicate increasingly higher levels of col-lective action, withg indicating 100 percent participation.
Although making these calculations for 318 cells in a few secondsappears both complicated and demanding, most of the cells are leftempty (due to the absence of most of the actions at any particular sam-pling interval). The coder need only read down the list of actions andrecord those that are present. The ranges of proportions are alsodesigned to make estimations easy by having intuitive estimates in thecenter of the ranges. For instance,c (≥ 20 percent and < 40 percent)would be marked if the coder thought “around a quarter” or “around athird” of the people were acting, whiled (≥ 40 percent and < 60 per-cent) would be marked if the coder thought that “about half ” or “justover” or “just under” half the people were engaged in a collectiveaction.
CONFIDENCE RATING
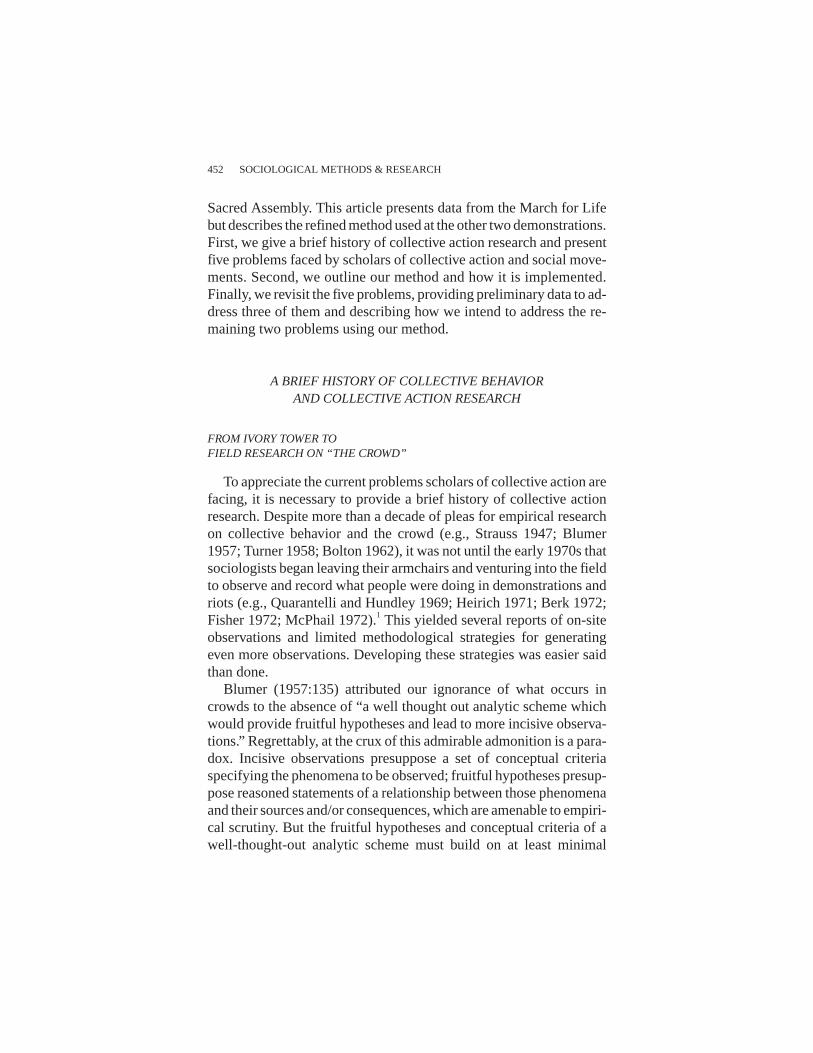
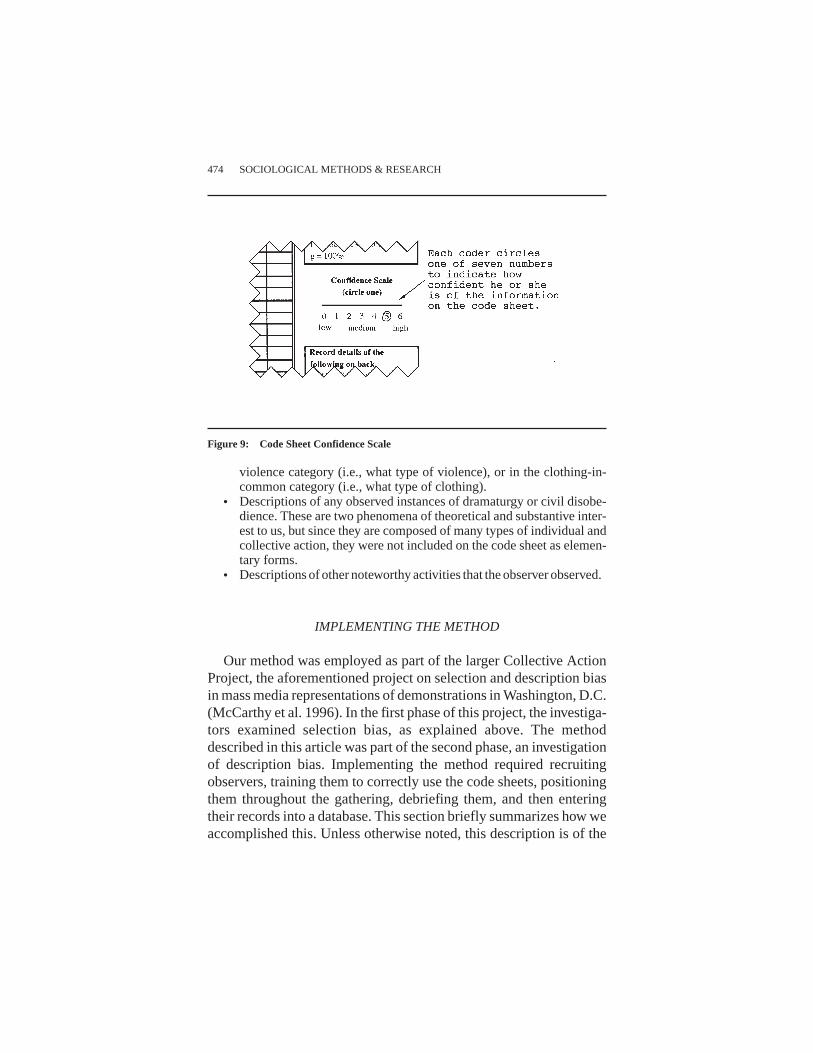
After completing the code sheet for each sampling interval, eachcoder indicates how confident he or she is of the information enteredon that particular sheet by circling a number on the confidence scale(see Figure 9).
472 SOCIOLOGICAL METHODS & RESEARCH

OTHER INFORMATION TO BE RECORDED
Our coders were also directed to record some information on themargins or backs of the code sheets. This is a way to get clarificationabout some of the items coded and to collect information that does notfit into the current scheme. Prior to the initial observation and codinginterval, we require observers to draw a map of their area on the backof the first sheet, including compass directions, prominent features,and their position in the area. They also record weather conditions andnote on later sheets any weather changes. A box on the code sheet listsother types of information coders are to record on the margins or backsof the sheets. These include the following:
• Descriptions of all actions that have been coded in any “other” cate-gory, in the vehicular motion category (i.e., what type of vehicle), in a
Schweingruber, McPhail / RECORDING COLLECTIVE ACTION 473
Figure 8: Code Sheet Cells for Coding Elementary Forms
violence category (i.e., what type of violence), or in the clothing-in-common category (i.e., what type of clothing).
• Descriptions of any observed instances of dramaturgy or civil disobe-dience. These are two phenomena of theoretical and substantive inter-est to us, but since they are composed of many types of individual andcollective action, they were not included on the code sheet as elemen-tary forms.
• Descriptions of other noteworthy activities that the observer observed.
IMPLEMENTING THE METHOD
Our method was employed as part of the larger Collective ActionProject, the aforementioned project on selection and description biasin mass media representations of demonstrations in Washington, D.C.(McCarthy et al. 1996). In the first phase of this project, the investiga-tors examined selection bias, as explained above. The methoddescribed in this article was part of the second phase, an investigationof description bias. Implementing the method required recruitingobservers, training them to correctly use the code sheets, positioningthem throughout the gathering, debriefing them, and then enteringtheir records into a database. This section briefly summarizes how weaccomplished this. Unless otherwise noted, this description is of the
474 SOCIOLOGICAL METHODS & RESEARCH
Figure 9: Code Sheet Confidence Scale

process used at the 1995 March for Life,8 which was held on theEllipse. A similar process was used prior to the 1995 National Organi-zation for Women rally and the 1997 Promise Keepers assembly, bothof which were held on the National Mall.
TRAINING THE OBSERVERS
Most of our observers were undergraduates from Washington-areauniversities who were recommended to us by colleagues. (The othercoders included one of the authors, a professor, and several graduatestudents involved with the project.) The undergraduate observerswere paid for their time involved in group training, observing, anddebriefing. They were also paid for studying theCollective ActionObservation Primer(McPhail et al. 1997) and whatever practice theydid on their own. The observers were furnished with the primer tostudy several days before their first training session. They wereinstructed to study the primer, become familiar with it before theirgroup training began, and prepare questions to ask during the training.The group training took place during a daylong session two daysbefore the demonstration. The sessions consisted of (1) a brief lectureon temporary gatherings, the history of observing them, and the pur-pose of the project; (2) a brief history of the March for Life; (3) anillustrated overview of the elementary forms and coding procedures;(4) practice using the coding forms; and (5) practice estimating thenumber of actors and density of gatherings. The history of the Marchfor Life, the overview of forms and coding procedures, and the prac-tice coding forms all made extensive use of 35 mm color slides. All ofthe forms were illustrated with slides while they were being explained.The observers practiced using the criteria and procedures in the primerby coding slides of demonstrations. After each slide was coded, theauthors and trainees discussed the results. The training for estimatingthe number of actors and the density included the use of slides but alsoincluded taking the trainees outside and arranging some of them invarious formations for the other trainees to observe. The trainees wereencouraged to study their codebook and practice coding the daybetween the group training and the demonstration.
Schweingruber, McPhail / RECORDING COLLECTIVE ACTION 475

PREPARING FOR SPACE SAMPLING
Essential to the method is the distribution of observers throughoutthe demonstration venue such that each observer is responsible for aclearly delineated area. Prior to each training session, we visited thedemonstration venue and divided it into a matrix. For the boundariesof the matrix cells, we used sidewalks, trees, lampposts, stages, audiospeakers, buildings, and sightlines connecting these various markers.The entire demonstration venue was then mapped, including markersand sightlines, so that each observer had a map of the complete venue,with his or her specific observation area indicated. Depending on thesize of the demonstration venue, the number of observers, and thenumber of cells or areas in the matrix, observers might be placed inevery area or a subset of them.
Figure 10 is the map of the 1995 March for Life rally site at theEllipse. The boxes indicate the speakers’ platform, the media stand,and audio speakers. The boundaries of the area are sightlines drawnbetween the main stage, the media platform, and six large loudspeak-ers. Boundaries for the demonstrations held on the National Mall wereeasier to set since we relied on the matrix of sidewalks and lamppoststhat border the entire National Mall. But the March for Life requiredmapping the rally site, sections along the parade route, and the proces-sion destination area near the Supreme Court, where a counterdemon-stration was held.
COORDINATING THE OBSERVERSAT THE DEMONSTRATION
Upon arriving at the demonstration venue, the observers synchro-nized their watches to ensure that all would observe and record duringthe same time periods. They were each given a spiral-bound 8.5× 11-inch pad of code sheets and a map indicating their area of responsibil-ity. Because we anticipated people questioning the observers abouttheir identity, the code sheet books had the project name on their brightgreen plastic covers, each observer wore a project name tag, and eachobserver carried business cards of the project’s principal investigators.Observers were told they could answer questions about their coding aslong as it did not interfere with their duties. However, they were
476 SOCIOLOGICAL METHODS & RESEARCH

encouraged not to be drawn into discussions with demonstrators aboutdemonstration-related issues.
Each observer was led to his or her area by one of the authors, whoindicated the boundaries of the area. The observers were instructed towalk around these boundaries and study the area. Observers weredirected to stand at a spot where they could observe the faces of mostof the people in the area. At the March for Life rally site, where we putmultiple observers into some of the sections, we instructed the observ-ers to stand apart from each other.
OBSERVING THE DEMONSTRATION
Beginning at 11 a.m. (a half hour before the official start of theMarch for Life rally), each observer was instructed to fill out a codesheet to indicate what was taking place in his or her area during a1-minute sample. The observers were told to scan their area for
Schweingruber, McPhail / RECORDING COLLECTIVE ACTION 477
Figure 10: A Map of the March for Life Rally Site on the Ellipse

approximately 30 seconds of the 1-minute sampling period and tothen begin filling out their code sheets. They could look up from thesheets to observe the area again, but they were not to code any new col-lective actions that took place after the 1-minute sampling period wasover. At the March for Life rally, observers repeated the coding every15 minutes. The interval between samples was decreased to 10 min-utes for the Rally for Women’s Lives. The March for Life observersmoved, at specified times, from the rally to their second position,either along the parade route or at the Supreme Court.
After the demonstration ended, the authors met with the observersfor a debriefing. The observers filled out surveys and engaged in agroup discussion about the observation criteria and procedures, par-ticular problems they encountered, and suggestions they had forimproving the training, criteria, and procedures for subsequent dem-onstrations. The information they provided was used to improve themethod for the next round of observation training and data collection.
PREVALENCE AND VARIATION OF COLLECTIVE ACTION
Above we listed five problems faced by scholars of collectiveaction. In the remainder of this article, we will consider how themethod can address these problems. In this section, we will addresstwo of the problems with data from the March for Life. These areProblem 1 (of all the actions in which two persons in temporary gath-erings could engage, in which ones do they engage, with what fre-quency, and to what extent?) and Problem 2 (how do collective actionsvary by space and time within demonstrations?). We will also explainhow the method will be used to address Problem 3 (to what extent dothe large protest events reported in the mass media differ from thesmaller protest events, which occur more often but are less likely to bereported?).
The code sheet we used for the March for Life was slightly differentfrom the current version (see Figure 4). We note two important differ-ences. First, the code sheet had five fewer elementary forms. Second,at the March for Life, observers recorded the proportion of actorsengaging in collective action on a 6-point scale, wherea = one to sixactors (with the exact number specified),b = at least seven actors but
478 SOCIOLOGICAL METHODS & RESEARCH

less than 25 percent of the total visible,c = 25 to 49 percent,d = 50 to74 percent,e= 75 to 99 percent, andf = 100 percent. We subsequentlyrescored alla responses with two or more actors into one of the pro-portional categories. In the tables and discussion that follow, theseproportions have been translated into a 5-point scale (cf. Tables 2-5),where 0 = no one oronly one person acting (thus, no collective action),1 = two or more persons acting but less than 25 percent, 2 = 25 to 49percent, 3 = 50 to 74percent, 4 = 75 to 99percent, and 5 = 100 percentparticipation.
Although we had multiple observers in some observation areas, thedata and analysis discussed here are based on just one coder per obser-vation area.9 The rally site contained 15 observation areas that coveredthe entire rally site. The march had 6 observation areas along the route,3 each on the north and south sides of the street. March observers wereresponsible for the one half the street through which the demonstratorsprocessed as well as the adjoining sidewalk. The area in front of theSupreme Court was divided into 9 areas. Across these 30 areas, thenumber of sampled observer records per area ranged from 6 to 12, witha mean of 7.7. The total number of sampled observer records was 232.Of these 232 observations, demonstrators were visible in 219 (94.4percent) of them. Our discussion here focuses on these demonstrators.10
FREQUENCY OF ELEMENTARY FORMS (PROBLEM 1)
In this section, we discuss the frequency of the elementary forms ofcollective action performed by demonstrators during the 1995 Marchfor Life. Our data provide two units of analysis for investigating this.First, we can examine the percentage of observation records in whichan observer reported the presence of an elementary form of collectiveaction performed by demonstrators. Second, we can look at the aver-age proportion of demonstrators who were performing each of theactions.
Table 1 shows the percentage of observer records in which an ele-mentary form is reported. The first three columns show this percent-age for each of the three demonstration gatherings—the rally at theEllipse, the march along Constitution Avenue, and the march destina-tion site at the Supreme Court. The fourth column is the mean of thefirst three columns. These numbers represent the odds of observing a
Schweingruber, McPhail / RECORDING COLLECTIVE ACTION 479

480 SOCIOLOGICAL METHODS & RESEARCH
TABLE 1: Observed Frequency of Collective Actions: Percentage of Observer Recordson Which Each Elementary Form Appears
Collective Actions Rally March Destination Mean
FacingSame—f monitoring 86.4 34.6 49.1 56.7Queuing 5.0 0.0 0.0 1.7Same—f inclusive locomotion 7.9 80.8 34.0 40.9Disparate pedestrian clusters 40.0 30.8 58.5 43.1Stationary clusters 61.4 23.1 73.6 52.7Arcs 9.3 0.0 17.0 8.8Rings 7.9 0.0 18.9 8.9Other facing 1.4 3.9 0.0 1.8
VoicingCheering 30.7 3.9 11.3 15.3Booing 0.7 0.0 0.0 0.2Ooh/ohh/ahhing 2.1 0.0 0.0 0.7Other vocalizing 4.3 3.9 1.9 3.3Chanting 2.1 34.6 34.0 23.6Singing 5.7 15.4 9.4 10.2Shouting 0.7 0.0 13.2 4.6Praying 0.0 3.9 24.5 9.5Pledging/reciting 0.0 0.0 11.3 3.8Conversing 61.4 65.4 56.6 61.1Speech making 0.0 0.0 0.0 0.0
ManipulatingGesturing 2.1 0.0 1.9 1.3Placarding/bannering 97.9 84.6 75.5 86.0Other carrying/lifting objects 12.1 7.7 5.7 8.5Leafleting 12.1 11.5 5.7 9.8Exchanging 2.9 0.0 0.0 1.0Other passing objects 0.0 0.0 0.0 0.0Striking objects 0.0 3.9 5.7 3.2Throwing objects 0.0 0.0 0.0 0.0Other manipulating objects 2.9 7.7 1.9 4.1Embracing/clasping person 7.1 15.4 13.2 11.9Restraining person 0.0 0.0 0.0 0.0Carrying/dragging person 12.1 7.7 1.9 7.2Striking person 0.0 0.0 0.0 0.0Other manipulating person 0.0 0.0 0.0 0.0Clapping 22.9 0.0 1.9 8.3Snapping 0.0 0.0 0.0 0.0Other manipulating self 0.0 0.0 0.0 0.0
Locomotion/body positionStanding/upright 94.3 61.5 86.8 80.9Sitting/seated 27.1 30.8 26.4 28.1Kneeling/knelt 1.4 0.0 5.7 2.4Lying/prone 1.4 0.0 0.0 0.5

particular type of collective action during a random minute in the gath-ering. We call this measure the observed frequency of a collectiveaction.
Table 2 is the average proportion of demonstrators visible to the ob-server participating in each form of collective action during the obser-vation periods. These numbers are on a scale from 0 (no collective ac-tion) to 5 (unanimous collective action). The denominator used tocalculate each of these proportions is the number of observer recordsreporting the presence of the particular type of collective action.Therefore, the actual range of these proportions is from 1 to 5. Sincethe coders estimated ranges of proportions instead of exact propor-tions, there is no way of translating the numbers into exact percent-ages. We call this measure the participation proportion of a collectiveaction.
Table 1 demonstrates that there was wide variation in the observedfrequency of elementary forms of collective action during the 1995March for Life. This discussion will focus on the most prevalentforms, but we begin by noting that none of our observers reported anycollective incidence of 6 of the possible 36 elementary forms of col-lective action or of 3 of the 9 “other” categories.11Another 6 forms and3 “other” categories were reported in fewer than 2 percent of observ-ers’ records. Of the remaining 27 forms, only 13 were reported onmore than 10 percent of the observers’records. These 13 are discussedin detail below.
Schweingruber, McPhail / RECORDING COLLECTIVE ACTION 481
TABLE 1 Continued
Collective Actions Rally March Destination Mean
Locomotion/body positionOther vertical 0.7 0.0 0.0 0.2Walking 66.4 96.2 83.0 81.9Marching 0.0 0.0 11.3 3.8Jogging/running 0.0 0.0 0.0 0.0Other horizontal 1.4 3.9 0.0 1.8
Clothing in common 11.4 7.7 11.3 10.1
Number of observer records 140 26 53

482 SOCIOLOGICAL METHODS & RESEARCH
TABLE 2: Average Proportion of Demonstrators Participating in Collective Actions
Collective Actions Rally March Destination Mean
FacingSame—f monitoring 3.62 1.56 2.23 2.47Queuing 1.00 — — 1.00Same—f inclusive locomotion 3.73 4.19 3.61 3.84Disparate pedestrian clusters 1.43 1.50 1.71 1.55Stationary clusters 1.62 1.33 1.95 1.63Arcs 1.38 — 1.11 1.25Rings 1.00 — 1.10 1.05Other facing 2.00 1.00 — 1.50
VoicingCheering 2.30 1.00 1.33 1.54Booing 1.00 — — 1.00Ooh/ohh/ahhing 1.00 — — 1.00Other vocalizing 1.17 1.00 1.00 1.06Chanting 2.00 1.78 2.06 1.95Singing 2.25 1.75 1.20 1.73Shouting 1.00 — 1.71 2.36Praying — 3.00 1.33 2.17Pledging/reciting — — 1.50 1.50Conversing 2.22 1.82 2.17 2.07Speech making — — — —
ManipulatingGesturing 1.00 — 1.00 1.00Placarding/bannering 2.57 2.91 2.08 2.52Other carrying/lifting objects 1.12 1.00 1.00 1.04Leafleting 1.06 1.00 1.00 1.02Exchanging 1.00 — — 1.00Other passing objects — — — —Striking objects — 1.00 1.00 1.00Throwing objects — — — —Other manipulating objects 1.00 1.00 1.00 1.00Embracing/clasping person 1.00 1.50 1.14 1.21Restraining person — — — —Carrying/dragging person 1.00 1.00 1.00 1.00Striking person — — — —Other manipulating person — — — —Clapping 2.19 — 1.00 1.06Snapping — — — —Other manipulating self — — — —
Body position/locomotionStanding/upright 3.98 2.56 3.15 3.23Sitting/seated 1.13 1.00 1.29 1.14Kneel/knelt 1.00 — 1.67 1.34Lying/prone 1.50 — — 1.50

The second measure, participation proportion, clearly supportsTurner’s (1964) claim that unanimity is an illusion. Only nine of theforms have an average participation proportion over 2.00, which indi-cates that at least 25 percent of people in the observer’s area wereengaging in the activity. These were inclusive collective locomotion(3.84), standing (3.23), walking (2.88), placarding/bannering (2.52),monitoring (2.47), shouting (2.36), marching (2.33), praying (2.17),and conversation (2.07).
The most frequent collective action reported overall was placarding/bannering. While this peaked during the rally (reported in 97.9 percentof records), it diminished only slightly during the march and at thedestination of that march. When placarding did occur, it had the fourthhighest participation proportion (2.52) of any collective action. Par-ticipation in this form was promoted by the organized distribution ofcommercially printed placards.12 It is a testament to this organizingtactic that this form was observed on more records than standing orwalking.
The second and third most frequent forms of collective action werewalking (81.9 percent) and standing (80.9 percent). Standing (3.23)and walking (2.88) also have the second and third highest participa-tion proportions. Not surprisingly, standing was more common at therally and walking at the march, while the forms had similar frequencylevels at the destination. Standing had the highest participation pro-portion (3.98) at the rally, and walking was the highest (4.24) at the
Schweingruber, McPhail / RECORDING COLLECTIVE ACTION 483
TABLE 2 Continued
Collective Actions Rally March Destination Mean
Body position/locomotionOther vertical locomotion 1.00 — — 1.00Walking 1.67 4.24 2.73 2.88Marching — — 2.33 2.33Jogging/running — — — —Other horizontal locomotion 1.00 1.00 — 1.00
Clothing in common 1.00 1.00 1.00 1.00
NOTE: 1 =≥ two actors but < 25 percent; 2 = 25 to 49percent; 3 = 50 to 74percent; 4 = 75 to 99percent; 5 = 100 percent.

march. These findings are among the most obvious but are importantnonetheless since they represent any demonstration organizer’s twolargest achievements. An organizer’s task is to bring people togetherto perform sequences of collective action, and among the most dra-matic of these sequences are the assembling of people’s standing bod-ies at rallies and the organization of people walking together duringprocessions or marches. The display of large numbers in collectiveaction is one of the most dramatic ways of providing evidence to out-siders and decision makers alike of the strength and solidarity of theorganizers’ and participants’ common cause.
Related to these two impressive sequences of collective action arethe fifth and eighth most frequently observed forms: facing in thesame direction as a function of monitoring (56.7 percent) and facing inthe same direction as a function of inclusive collective locomotion(40.9 percent). Monitoring reached its peak (86.4 percent) at the rallywhen demonstrators were standing and facing in the direction of theplatform from which they were addressed by a series of rally speak-ers.13 This dropped dramatically during the march, where some dem-onstrators stood along the route faced in the direction of the proces-sion in the street. Monitoring then increased slightly at the destinationsite. Overall, monitoring had the fifth highest participation proportion(2.47). Inclusive collective locomotion was not frequently observedduring the rally; however, it increased dramatically at the march,during which a majority of demonstrators were participating.14 In fact,the only two forms to reach a participation proportion over 4.0 at onesite were inclusive locomotion (4.19) and walking (4.24) at the march.Inclusive collective locomotion also had the highest overall participa-tion proportion (3.84).15 Inclusive locomotion remained compara-tively frequent at the destination (34.0 percent) because many of thedemonstrators continued their march into and through the destinationarea before dispersing.
The fourth most frequent form of collective action reported by ourobservers was collective or interactive voicing in the form of conver-sations (61.1 percent), which remained at roughly the same level dur-ing each of the demonstration gatherings. We know from otherresearch (McPhail 1994) that pedestrian and standing clusters typi-cally involve from two to five or six persons. Thus, note here that the
484 SOCIOLOGICAL METHODS & RESEARCH

sixth and seventh most frequent forms of collective action overallreported by our observers involved stationary clusters (52.7 percent)and pedestrian clusters (43.1 percent). Other research on sport(McPhail and Miller 1973; Aveni 1977) and religious (Clelland et al.1974) gatherings suggests that these are companion clusters of two tofive members who assemble together, remain together throughout theduration of the gathering, and then disperse together. They alternatebetween participating in more inclusive forms of collective action(e.g., monitoring, chanting, cheering, singing, praying, clapping), act-ing alone, and interacting with their companions (e.g., engaging inconversation). These companion clusters are the most common and, inour judgment, the smallest but most fundamental units of socialorganization in all temporary gatherings. While our observers reportthat clusters were very much in evidence during the rally as well as atthe destination site, they diminished in visibility during the marchitself when a large proportion of the demonstrators were proceedingshoulder to shoulder; clusters, if observed and reported during thisphase of the protest event, were likely to have been among the demon-strators standing along the march route.
Under the heading of voicing, note that chanting, the 10th most fre-quently observed category (23.6 percent), is virtually absent duringthe rally but is reported on more than a third of the records at the marchand destination. Conversely, under the heading of manipulation, clap-ping (8.3 percent overall) is common during the rally (22.9 percent)but dropped at the march and destination. Four other categories had amean frequency of more than 10 percent. Sitting (28.1 percent), the9th most frequent collective action, remains near the same levelthroughout the demonstration. Cheering (15.3 percent overall) washighest at the rally (30.7 percent), where demonstrators cheeredspeakers’ comments. Embracing/clasping (11.9 percent), whichincludes hugging and holding hands, was reported at all three gather-ings, while singing (10.2 percent) was most frequent during themarch.
Several other manipulation categories also warrant comment.Carrying/dragging a person (7.2 percent) is reported with comparablefrequencies at the rally and march sites and typically indicated adultslifting and carrying infants and children. Carrying/lifting other objects(8.5 percent) refers to any inanimate object other than a placard or
Schweingruber, McPhail / RECORDING COLLECTIVE ACTION 485

banner. The most frequently carried object reported by our observerswas some piece of audiovisual equipment (e.g., camera, video cam-era, microphone). Leafleting (9.8 percent) was frequently reported atthe rally site and along the route of the march.
VARIATION IN GATHERINGS (PROBLEM 2)
Although Turner’s (1964) discussion of “the illusion of unanimity”is more than three decades old, there has been no attempt to systemati-cally assess the extent of variation within gatherings. The data col-lected at the March for Life provided a opportunity to do this. We offerhere a preliminary discussion of one type of variation. Tables 3, 4, and5 each illustrate variation of one type of collective action across spaceand time at the rally. Each table shows a modified version of participa-tion proportion. The denominator in these proportions is the totalnumber of observer records that indicate the presence of demonstra-tors. Therefore, the range is from 0 (no collective action) to 5 (unani-mous participation) instead of from 1 to 5. These proportions repre-sent collective action performed by demonstrators during the first twohours of the March for Life rally. Each table demonstrates a pattern ofvariation of one elementary form over space and time. The collectiveaction is shown by depth in the gathering (i.e., front, middle, and backof the gathering as a function of distance from the stage), centrality(i.e., center, margins, and fringes of the gathering as a function of lat-eral position in the gathering),16 and lapsed time across the duration ofthe gathering. The time variable is broken into four half-hour seg-ments, each consisting of two samples 15 minutes apart. The 36 num-bers in each table are averages of coders’ judgments of the proportionof actors participating in the elementary form.
Table 3 examines facing in the same direction as a function ofmonitoring. It describes people whose lines of sight are approximatelyparallel.17 Throughout the gathering, the incidence of this formincreased from the first half hour (mean = 1.27) to the second half hour(3.37), when the rally program began, with a slight increase to thethird and fourth half hours (3.87). The proportion of people with samefacing was much higher in the front and middle of the gathering (mean =3.38) than at the back (2.53). Centrality in the gathering had no signifi-cant effect on this elementary form.
486 SOCIOLOGICAL METHODS & RESEARCH

Participation in conversations (see Table 4) presents a much differ-ent pattern, although again depth and time yield significant statisticaleffects, while centrality does not. Conversations were most prevalentin the first half hour (2.47), which corresponds to the final moments ofthe assembling phase prior to the start of the rally. Conversationsdropped sharply during the second half hour (1.53) and continueddeclining through the third (0.97) and fourth (0.83) half-hour periods.However, conversations were more prevalent in the back (2.17) andmiddle (1.60) of the gathering than in the front (0.57). And while thegathering as a whole saw a drop in conversations each half hour, thecenter back saw a rise during the second hour.
Placarding/bannering (see Table 5) has a different pattern of collec-tive action. This elementary form was quite common throughout thegathering, with little variation by time or depth. However, the center ofthe gathering had a higher participation proportion (3.46) than themargins (2.21) or fringes (2.31).
Schweingruber, McPhail / RECORDING COLLECTIVE ACTION 487
TABLE 3: Facing Same Direction as a Function of Monitoring by Location and Time
Centrality
Deptha Center Margins Fringes Timea
Front 1.50 2.75 0.00 First half hour4.00 4.50 3.75 Second half hour4.00 4.00 4.00 Third half hour4.00 4.00 4.00 Fourth half hour
Middle 1.00 2.00 2.00 First half hour2.00 4.25 2.75 Second half hour4.00 4.50 4.00 Third half hour4.00 4.75 4.00 Fourth half hour
Back 0.50 0.75 0.50 First half hour2.50 2.75 3.00 Second half hour3.50 2.75 4.00 Third half hour3.00 2.75 4.00 Fourth half hour
Overall mean = 3.09Depth means: front = 3.38; middle = 3.38; back = 2.53Centrality means: center = 2.83; margins = 3.31; fringes = 3.00Time means: first half hour = 1.27; second half hour = 3.37; third half hour = 3.87;
fourth half hour = 3.87
NOTE: 0 = none or one actor; 1 =≥ two actors but < 25 percent; 2 = 25 to 49percent; 3 = 50 to 74percent; 4 = 75 to 99percent; 5 = 100 percent.a. Independent variable is significant at the .001 level.

These tables demonstrate one type of variation—the variation ofcollective action across space and time. However, our data also allowinvestigation of the variation of collective action by actor category,variation of collective action by density, variation of types of actorsacross space and time, and variation of some forms (e.g., types of voic-ing) across other forms (e.g., types of facing). These analyses will bepresented in subsequent reports.
LARGE VERSUS SMALL GATHERINGS (PROBLEM 3)
A remaining problem with media bias is that demonstrations mostoften reported in the media are atypically large. Our method will allowus to investigate systematically the differences between large andsmall demonstrations. It will be much simpler to investigate smallerdemonstrations than large ones since fewer coders will be needed.However, the data will be in the same format and can easily be com-pared to that from large demonstrations.
488 SOCIOLOGICAL METHODS & RESEARCH
TABLE 4: Conversation by Location and Time
Centrality
Deptha Center Margins Fringes Timea
Front 4.00 0.50 3.00 First half hour0.50 0.00 0.00 Second half hour0.00 0.00 0.00 Third half hour0.00 0.00 0.00 Fourth half hour
Middle 3.00 2.50 2.75 First half hour4.00 1.25 2.50 Second half hour1.00 0.50 1.25 Third half hour1.50 0.00 0.50 Fourth half hour
Back 2.50 2.75 2.25 First half hour0.50 3.50 1.75 Second half hour1.00 2.75 1.75 Third half hour2.50 2.00 1.75 Fourth half hour
Overall mean = 1.45Depth means: front = 0.57; middle = 1.60; back = 2.17Centrality means: center = 1.71; margins = 1.31; fringes = 1.46Time means: first half hour = 2.47; second half hour = 1.53; third half hour = 0.97;
fourth half hour = 0.83
NOTE: 0 = none or one actor; 1 =≥ two actors but < 25 percent; 2 = 25 to 49percent; 3 = 50 to 74percent; 4 = 75 to 99percent; 5 = 100 percent.a. Independent variable is significant at the .001 level.

MEDIA RECORDS OF COLLECTIVE ACTION
So far, this article has reported on the use of our method to codedemonstrations on-site. However, it is also readily adaptable for cod-ing video records of demonstrations. In this section, we present somepreliminary data from coded video records that address Problem 4,regarding description bias in media reports of demonstrations. Thenwe discuss how this method can be used to address Problem 5 (howcan television news reports of demonstrations be made a fruitful ave-nue for research on demonstrations?).
DESCRIPTION BIAS IN MEDIA REPORTS (PROBLEM 4)
After gathering data on-site at the 1995 March for Life, we used ourmethod to code all network news stories about abortion-related dem-onstrations during the weekend of the demonstration. All three net-works ran March for Life stories on January 23, 1995, the day the
Schweingruber, McPhail / RECORDING COLLECTIVE ACTION 489
TABLE 5: Placarding/Bannering by Location and Time
Centralitya
Depth Center Not-So-Center Fringes Time
Front 2.50 2.00 2.50 First half hour3.50 1.75 2.50 Second half hour3.50 1.75 2.50 Third half hour2.50 2.00 2.00 Fourth half hour
Middle 3.50 2.25 3.25 First half hour3.50 2.25 3.00 Second half hour3.50 1.75 2.75 Third half hour4.00 2.00 1.25 Fourth half hour
Back 3.00 1.75 2.25 First half hour4.00 3.00 2.50 Second half hour4.00 3.00 1.25 Third half hour4.00 3.00 2.00 Fourth half hour
Overall mean = 2.50Depth means: front = 2.30; middle = 2.58; back = 2.62Centrality means: center = 3.46; margins = 2.21; fringes = 2.31Time means: first half hour = 2.47; second half hour = 2.73; third half hour = 2.47;
fourth half hour = 2.33
NOTE: 0 = none or one actor; 1 =≥ two actors but < 25 percent; 2 = 25 to 49percent; 3 = 50 to 74percent; 4 = 75 to 99percent; 5 = 100 percent.a. Independent variable is significant at the .001 level.

march was held. In addition, CBS and NBC ran stories on January 22,the actual anniversary of theRoe v. Wadedecision. Rather than timesample, we coded all collective action visible during the reports. Weused one code sheet per shot. Then we compared what was shown onthe television news to what our observers saw on-site. We also exam-ined the audio tracks of these stories.
Here we report three key findings. First, a small proportion of thecoverage was devoted to showing or describing collective action in theMarch for Life protest event. These stories combined consisted of 57shots and totaled just over 5 minutes. However, only 34 seconds (9shots) concerned the March for Life.18 Second, those elementaryforms that were visible or described on the television news were alsorecorded by our observers on-site. Third, those forms that we foundmost prevalent at the demonstration were reported by the media.19
From the 4 shots in CBS’s story, three elementary forms are visible,but they are the three forms—inclusive locomotion, walking, andplacard/bannering—that were engaged in by the highest proportionsof demonstrators during the march. The NBC shots show the samethree forms, but others—gesturing and carrying other things (crucifixand bouquet)—are also visible. ABC’s shot shows the same threemajor forms as well as chanting. All of these forms were coded by ourobservers on-site.
In addition to our investigation of network news, we examined cov-erage of the March for Life by C-SPAN, which devoted far more timeto the event than any of the networks. While the networks’ visualswere entirely of the march portion of the demonstration, C-SPAN, apublic affairs channel, focused on the speeches in its 1-hour, 22-minute-long coverage of the rally. For a majority of the coverage, theonly individuals visible were on the stage. But the audience was visi-ble for approximately 11.5 minutes, much more time than on all of thenetworks combined. As with network news coverage, those elemen-tary forms that were visible were coded by our observers, and thoseforms that we found most prevalent at the demonstration—in thiscase, the rally—were shown on C-SPAN. In addition to the obviouscollective facing actions (same facing as a function of monitoring,clusters) and collective body position actions (standing, walking),demonstrators can be seen carrying placards, banners, and crosses andcan be heard cheering, chanting, and clapping.
490 SOCIOLOGICAL METHODS & RESEARCH

Further comparisons between television news reports and on-siterecords are needed before we can make any general statements aboutdescription bias, but our method provides a way of making these com-parisons in a straightforward way.
DEMONSTRATION DATA FROMTELEVISION NEWS REPORTS (PROBLEM 5)
The final problem we address in this article is how to make televi-sion news reports of demonstrations a fruitful avenue for research ondemonstrations, as newspaper reports have been. Our preliminaryinvestigation of the 1995 March for Life suggests that data collectedfrom television news reports can provide some useful information,even if it is nowhere near as comprehensive as that collected on-site.We are currently using our method to code Washington, D.C., demon-strations from 1973, 1982, and 1991 using records of nightly networknews telecasts from the Vanderbilt Television News Archives. Thisuse of our method is clearly not a substitute for on-site observationsince television news accounts of demonstrations, like the newspaperaccounts used so widely by scholars, are colored by both selection anddescription bias. However, if we can establish the nature of thisbias—as we are attempting to—these accounts can become as valu-able in the future as newspaper accounts have proven to be in the past.Coding video records is cheaper and quicker than coding on-site.Moreover, a wide range of demonstrations are available for analysisfrom several archives for examination and analysis by students of col-lective action. These data can be used to make comparisons acrosstime and different types of demonstrations.
We note in passing another possible use we can make of videorecords with our method. Instead of human observers making recordson-site, an array of video cameras could be stationed throughout ademonstration gathering. Each camera would provide a continuousrecord of one location in the gathering. Each record could then becoded to create a set of data that would be far more detailed than the setthat we have analyzed here and the sets we could produce from televi-sion news records. These data would also be free of the descriptionbias inherent in network news reports.
Schweingruber, McPhail / RECORDING COLLECTIVE ACTION 491

SUMMARY AND CONCLUSION
Over the past three decades, students of collective action havemoved from ivory tower speculation on “the crowd” to extensiveresearch on collective action in political demonstrations and othertemporary gatherings. We have identified two major approaches tothis research. The microapproach has consisted of extensive fieldworkto identify the types of collective action that people perform in gather-ings. The macroapproach, most frequently known as protest eventanalysis, has consisted of archival research of newspaper reports andother chronicles of collective action by observers who are presumed tohave witnessed the phenomena they reported. Both these approacheshave resulted in important contributions to our understanding of col-lective action. However, we have argued in this article that a newmethod is required to address five problems raised by these twoapproaches, and we have given a detailed description of this method.We have presented data gathered with this method at the 1995 Marchfor Life that address three of the problems we raised and haveexplained how our method can be used to address the other two.
First, we provided data to show which types of collective actionwere most frequent in a large gathering. Our method allowed a sys-tematic recording of the forms of collective action found in the gather-ing and enabled a thorough description of the variation in the observedfrequency of these forms and the proportion of the individuals in thegathering participating in these forms.
Second, we presented data that provide substantial empirical evi-dence for what Turner (1964) referred to as “the illusion of unanimity”in collective action across space and time. Because the data were gath-ered by multiple observers at uniform times, they can be used to showhow the proportion of people participating in each form of collectiveaction varies in the gathering by space and time. We demonstrated thiswith three common forms of collective action.
Third, we explained our plans to use this method to investigatesmall gatherings and make comparisons between these small gather-ings and the large ones we have already investigated. Since the taxon-omy from which our method was devised was developed from observ-ing and recording hundreds of smaller political demonstrationgatherings, we believe that using the method to study these gatherings
492 SOCIOLOGICAL METHODS & RESEARCH

and making comparisons with larger gatherings will be straightfor-ward. These comparisons are important because while small gather-ings are more frequent, large ones are more likely to be reported in themedia accounts that are used in protest event analysis.
Fourth, we have made a comparison between what our observersrecorded at a large gathering and what television news accountsreported. We found that the television news accounts are superficial intheir portrayal of collective action in comparison to data collected byour observers on-site. However, those elementary forms that werevisible or described on the television news were also recorded by ourobservers on-site, and those forms that we found most prevalent at thedemonstration were reported in the television news accounts. Furthercomparisons of the type we have presented here will make possible asystematic analysis of description bias in media accounts.
Fifth, we briefly explained the next step of this project, using ourmethod to code television news accounts of demonstrations from1973, 1982, and 1991. This will allow the study of many more demon-strations than can be observed on-site. This use of our method cannotprovide data as rich as that presented here, but it does provide a way tomake television news reports a valuable source of information aboutdemonstrations.
There are additional issues in the study of collective action andsocial movements for which our method may have significant impli-cations. Sociologists and political scientists often have been guilty ofadopting or developing explanations for collective action and collec-tive action events based on commonsense knowledge of the phenom-ena to be explained instead of first developing firsthand familiaritywith those phenomena. This is not to suggest that all students of col-lective action or protest events should be working at a microlevel ofanalysis and limiting their research to the method of direct observa-tion and recording that we have described here. It is to suggest thattheir explanations of protest waves, campaigns, and events must bebuilt on empirical findings of gatherings and the individual and col-lective behavior sequences of which they consist. We see our empiri-cal contribution at the microlevel of analysis as a potential contribu-tion to those working at more macrolevels. Finally, we hope thismethod can provide the observations necessary for the development ofa well-thought-out multilevel analytical scheme such as Blumer
Schweingruber, McPhail / RECORDING COLLECTIVE ACTION 493

(1957) claimed was required for even more incisive observations. Per-haps the method we have offered here is one step toward the resolutionof Blumer’s paradox.
NOTES
1. The exception to this generalization was Lang and Lang’s (1953) pathbreaking compari-son of on-site observers’ records of crowd reactions to General Douglas MacArthur’s paradethrough the streets of Chicago with simultaneous records by observers viewing live televisioncoverage of crowd reactions to that parade.
2. Unlike this study’s concerns with variations in collective actions within gatherings, Tilly’sproject of some three decades has been concerned with “a series of collective actions; a set of so-cial structures within which the actions take place; [and] a political process linking the one to theother” (Tilly et al. 1975:313). Tilly and his colleagues have examined strikes in France (Shorterand Tilly 1974); collective action in France, Italy, and Germany (Tilly et al. 1975); and conten-tious gatherings in Great Britain (Tilly 1978, 1995) and in colonial America (Tilly 1979). In eachsegment of the project, quantitative records have been generated by systematic coding of govern-ment archival records of social, economic, and demographic structures and of newspaper archivesand other chronicles for descriptions of types of gatherings, issues, acting units, and categories ofactions by those units. Tilly’s efforts to become familiar with the phenomena to be explained arewithout precedent or parallel among past or present students of campaigns, waves, and cycles ofcollective action.
3. The concept of the crowd implies a uniformity of action and a homogeneity of actors thatare empirically false. In view of the problems with this antiquated concept, we will use the termtemporary gatheringhere to refer to a collection of two or more people in a common place inspace and time. Gatherings are opportunities for two or more people to act collectively; they donot guarantee it (McPhail 1991:153).
4. Tilly (1994:7) defines a social movement as “a sustained challenge to powerholders inthe name of a population living under jurisdiction of those powerholders by means of repeatedpublic displays of that population’s numbers, commitment, unity, and worthiness.”
5. Thecarrying audiovisual equipmentform was added to the code sheet after the Marchfor Life because it was the most common “other” object being carried.
6. The action verbs identified by Tilly (1995) in his study of contentious gatherings inGreat Britain between 1758 and 1834 include actions we would code as voicing (cheer, commu-nicate, decry, deliberate, negotiate, request, resolve, support), manipulating (attack, fight, peti-tion, resist), locomotion/body position (move), and facing (chair). Tilly’s concerns are changesin the frequency with which various action verbs appear in chronicles of “early roughstreet poli-tics” prevalent in the middle of the eighteenth century and those that characterized the orderlypublic meetings and electoral assemblies that prevailed near the end of the first third of the nine-teenth century. He reports that the verbchair is associated with meetings and electoral assem-blies from which we infer that some person is in charge (is chairing the gathering) and/or is posi-tioned in a location (occupies the chair) to which the majority of the gathering is facing or towhom they are giving attention. Consistent with other trends in the changing form of contentiousgatherings between 1758 and 1834, a chair was absent and meetings were infrequent between1758 and 1811. Deliberately called meetings were prevalent between 1828 and 1834, as was achair.
494 SOCIOLOGICAL METHODS & RESEARCH

7. In the third edition of theCollective Action Observation Primer(McPhail et al. 1997),used for the Promise Keepers assembly, the text describing all of the elementary forms (voicingforms excepted) was accompanied by photographs of an exemplary illustration of the form.
8. The annual March for Life began in 1974, one year following the Supreme Court’sRoe v.Wadedecision, which legalized abortion. This rally and march has occurred each year since itsinception and thus constitutes the longest running periodic demonstration event in Washington,D.C., history.
9. We do not have available true intercoder reliability correlations because the coders ob-serving the same area did not stand in the same place. We asked them to position themselves inopposite sides of their area. The data presented in this section are from the primary coder (the onewith the lowest coder ID number). There were 13 pairs of coders who were in the same area atone of the three sites. The correlations between these matched-up coders varied by elementaryform. For the most prevalent forms, correlations include inclusive collective locomotion (0.74),onlooking (0.57), stationary clusters (0.50), and conversing (0.33). The relatively low correla-tions for some forms suggest that there were large variations within sampling areas. During thePromise Keepers assembly, we had pairs of coders observe and code standing next to one anotherto generate true intercoder reliability ratings.
10. Other actors visible were police (visible during 55 observations, or 23.7 percent of allobservations), media (46, or 19.8 percent), onlookers/passersby (27, or 11.6 percent), and counter-demonstrators (8, or 3.4 percent).
11. The observers reported no instance of collective speech making, throwing objects, strik-ing persons, restraining persons, snapping (fingers), or jogging/running, nor did they reportother manipulating persons, other passing objects, or other manipulating self. They also reportedno instances of individual or collective violence against persons or property.
12. These placards expressed statements of opposition to abortion or images of aborted fe-tuses. Others were handmade and expressed a variety of anti-abortion and pro-life sentiments.Banners identified their bearers as members of delegations from pro-life chapters, parochialschools, and churches in various eastern U.S. cities.
13. These included event organizers, some clergy, and many newly elected Republican con-gressional representatives who vowed to vote pro-life throughout their tenure in Congress.
14. The few occasions of inclusive locomotion reported at the rally site were in all likelihooddelegations of demonstrators moving together from the large buses in which they arrived into therally venue itself or moving together at the end of the rally to take positions within the line ofmarch to the Supreme Court.
15. This is due largely to the definition ofinclusive collective locomotion, which requiredmore than half of the demonstrators in the area to be moving the same direction. Less inclusivelocomotion was coded as disparate pedestrian clusters.
16. The front corresponds to the area labeledA in Figure 10, the middle corresponds toB,and the back corresponds toC. The center corresponds to 3, the margins correspond to 2 and 4,and the fringes correspond to 1 and 5.
17. Actually, when the gathering is viewed from aerial photographs, the participants’ linesof orientation are not parallel but slightly convergent, thus forming an arc. But the observers usedthe onlooking code because, from their perspective, the lines of sight appeared parallel.
18. Seven smaller abortion-related demonstrations merited more combined coverage (1:30,24 shots) than the March for Life. These included a pro-life vigil that hoped to confront PresidentClinton in front of a church he often attended and two demonstrations by the American Coalitionof Life Activists, a group linked by ABC to the idea that “killing of abortion doctors [was] justifi-able homicide.”
Schweingruber, McPhail / RECORDING COLLECTIVE ACTION 495

19. Each of these three findings also held for our examination of newspaper coverage of theMarch for Life.
REFERENCES
Aveni, Adrian. 1977. “The Not So Lonely Crowd: Friendship Groups in Collective Behavior.”Sociometry40:96-99.
Berk, Richard. 1972. “The Controversy Surrounding Analysis of Collective Violence: SomeMethodological Notes.” Pp. 112-118 inCollective Violence, edited by J. Short and M. Wolf-gang. Chicago: Aldine.
. 1974. “A Gaming Approach to Crowd Behavior.”American Sociological Review39:355-373.
Blumer, Herbert. 1957. “Collective Behavior.” Pp. 127-158 inReview of Sociology: Analysis of aDecade, edited by J. Gittler. New York: John Wiley.
Bolton, Charles D. 1962. “For the Strengthening of Collective Behavior Research.”AmericanSociological Review27:903-905.
Clelland, Donald, Thomas Hood, C. M. Lipsey, and Ronald Wimberly. 1974. “In the Companyof the Converted: Characteristics of a Billy Graham Crusade Audience.”Sociological Analy-sis86:984-1014.
della Porta, Donatella and Sidney Tarrow. 1986. “Unwanted Children: Political Violence and theCycle of Protest in Italy: 1966-1973.”European Journal of Political Research14:607-632.
Edgerton, Robert B. 1979.Alone Together: Social Order on an Urban Beach. Berkeley: Univer-sity of California Press.
Eisinger, Peter. 1973. “The Conditions of Protest Behavior in American Cities.”American Po-litical Science Review67:11-28.
Everett, Kevin. 1992. “Professionalization and Protest: Changes in the Social Movement Sector,1961-1983.”Social Forces70:957-976.
Fisher, Charles D. 1972. “Observing a Crowd: The Structure and Description of Protest Demon-strations.” Pp. 187-211 inResearch on Deviance, edited by Jack Douglas. New York: Ran-dom House.
Gurr, Ted R. 1968. “A Causal Model of Civil Strife: A Comparative Analysis Using New Indi-ces.”American Political Science Review62:1104-1124.
Heirich, Max. 1971.The Spiral of Conflict: Berkeley, 1964. New York: Columbia UniversityPress.
Jenkins, Craig and Charles Perrow. 1977. “Insurgency of the Powerless: Farm Worker Move-ments (1946-1972).”American Sociological Review42:249-268.
Koopmans, Ruud. 1993. “Dynamics of Protest Waves: Germany, 1965 to 1989.”American So-ciological Review58:637-658.
Kriesi, Hanspieter, Ruud Koopmans, Jan Willem Dyvendak, and Marco G. Guigni. 1995.NewSocial Movements in Western Europe. Minneapolis: University of Minnesota Press.
Lang, Kurt and Gladys Engel Lang. 1953. “The Unique Perspective of Television and Its Effect:A Pilot Study.”American Sociological Review18:3-12.
Lin, Nan. 1975. “The McIntire March: A Study of Recruitment and Commitment.”Public Opin-ion Quarterly38:562-573.
Lofland, John. 1985.Protest: Studies of Collective Behavior and Social Movements. NewBrunswick, NJ: Transaction.
496 SOCIOLOGICAL METHODS & RESEARCH
Lofland, John and John Fink. 1982.Symbolic Sit-Ins: Protest Occupations at the CaliforniaCapitol. New York: University Press of America.
MacCannell, Dean. 1973.Nonviolent Action as Theater. Nonviolent Action Research ProjectMonograph Series No. 10. Haverford, PA: Haverford College for the Century of NonviolentConflict Resolution.
McAdam, Doug. 1982.Political Process and the Development of Black Insurgency. Chicago:University of Chicago Press.
McCarthy, John, Clark McPhail, and Jackie Smith. 1996. “Images of Protest: Dimensions of Se-lection Bias in Media Coverage of Washington Demonstrations, 1982 and 1991.”AmericanSociological Review61:478-499.
McCarthy, John, Clark McPhail, Jackie Smith, and Louis Crishock. 1998. “Electronic and PrintMedia Representations of Washington, D.C. Demonstrations, 1982 and 1991: A Demogra-phy of Description Bias.” Pp. 113-130 inActs of Dissent: New Developments in the Study ofProtest, edited by D. Rucht, R. Koopmans, and F. Neidhardt. Berlin: Sigma.
McPhail, Clark. 1969. “Training for Collective Behavior Sequence Recording.” NIMH Grant#16696-01, Bethesda, MD.
. 1972. “Theoretical and Methodological Strategies for the Study of Individual and Col-lective Behavior Sequences.” Paper presented at the annual meeting of the American Socio-logical Association, August, New Orleans, LA.
. 1991.The Myth of the Madding Crowd. New York: Aldine.. 1994. “ From Clusters to Arcs and Rings: Elementary Forms of Sociation in Temporary
Gatherings.” Pp. 35-57 inThe Community of the Streets, edited by S. Cahill and L. Lofland.Greenwich, CT: JAI.
McPhail, Clark and David Miller. 1973. “The Assembling Process: A Theoretical and EmpiricalExamination.”American Sociological Review38:721-735.
McPhail, Clark and Robert Pickens. 1975. “The Explananda of Collective Behavior.” Paper pre-sented at the annual meeting of the American Sociological Association, August, Denver, CO.
McPhail, Clark, David Schweingruber, and Nancy Berns. 1997.Collective Action ObservationPrimer. Urbana: University of Illinois at Urbana–Champaign.
Morris, Desmond. 1985.Body Watching. London: Equinox.Olzak, Susan. 1992.The Dynamics of Ethnic Competition and Conflict. Stanford, CA: Stanford
University Press.Pickens, Robert G. 1975. “The Explananda of Collective Behavior.” Ph.D. dissertation, Depart-
ment of Sociology, University of Illinois at Urbana–Champaign.Quarantelli, E. and J. Hundley. 1969. “A Test of Some Propositions About Crowd Formation and
Behavior.” Pp. 538-554 inReadings in Collective Behavior, edited by Robert Evans. Chi-cago: Rand-McNally.
Rucht, Dieter. 1990. “Campaigns, Skirmishes and Battles: Anti-Nuclear Movements in theUSA, France and West Germany.”Industrial Crisis Quarterly4:193-222.
Seidler, John, Katherine Meyer, and Lois MacGillivray. 1977. “Collecting Data on Crowds andRallies: A New Method of Stationary Sampling.”Social Forces55:507-518.
Shorter, Edward and Charles Tilly. 1974.Strikes in France, 1830-1968. Cambridge, UK: Cam-bridge University Press.
Smith, Michael. 1983.Violence and Sport. Toronto: Butterworth.Strauss, Anselm. 1947. “Research in Collective Behavior: Neglect and Need.”American Socio-
logical Review12:352-354.Tarrow, Sidney. 1989.Democracy and Disorder: Protest and Politics in Italy, 1965-1975. New
York: Oxford University Press.Tilly, Charles. 1978.From Mobilization to Revolution. Reading, MA: Addison-Wesley.
Schweingruber, McPhail / RECORDING COLLECTIVE ACTION 497

. 1979. “Repertoires of Contention in America and Britain: 1750-1820.” Pp. 126-55 inThe Dynamics of Social Movements, edited by M. Zald and J. McCarthy. Cambridge, MA:Winthrop.
. 1986.The Contentious French. Cambridge, MA: Belknap.. 1994. “Social Movements as Historically Specific Clusters of Performances.”Berkeley
Journal of Sociology38:1-30.. 1995.Popular Contention in Great Britain, 1758-1834. Cambridge, MA: Harvard Uni-
versity Press.Tilly, Charles, Louise Tilly, and Richard Tilly. 1975.The Rebellious Century: 1830-1930. Cam-
bridge, MA: Harvard University Press.Turner, Ralph H. 1958. “Needed Research in Collective Behavior.”Sociology and Social Re-
search42:461-465.. 1964. “Collective Behavior.” Pp. 382-425 inHandbook of Modern Sociology, edited by
R.E.L. Faris. Chicago: Rand-McNally.Wallace, Walter. 1969.Sociological Theory. Chicago: Aldine.Wohlstein, Ronald T. 1977a. “The Theoretical and Methodological Specification and Descrip-
tion of Collective Locomotion.” Ph.D. dissertation, Department of Sociology, University ofIllinois at Urbana–Champaign.
. 1977b. “Filming Collective Behavior and the Problem of Foreshortened Perspective: ACorrective Method.”Studies in Visual Communication4:81-85.
Wohlstein, Ronald T. and Clark McPhail. 1979. “Judging the Presence and Extent of CollectiveBehavior From Film Records.”Social Psychology Quarterly42:76-81.
Wright, Sam. 1978.Crowds and Riots: A Study in Social Organization. Beverly Hills, CA: Sage.
David Schweingruber is a Ph.D. candidate in sociology at the University of Illinois atUrbana–Champaign. His research on Washington, D.C., First Amendment gatheringsincludes systematic observations of contemporary demonstrations, archival research onhistorical demonstrations, and analysis of demonstration media coverage. His chapteron the development of the U.S. public order management system (coauthored with ClarkMcPhail and John McCarthy) recently appeared inPolicing Protest(1998, edited by Do-natella della Porta and Herbert Reiter). He is currently completing a dissertation on thetraining and organization of door-to-door salespersons.
Clark McPhail is a professor of sociology at the University of Illinois, Urbana–Champaignand is the author ofThe Myth of the Madding Crowd(1991, Aldine) and numerous arti-cles on collective action. His current projects include completingActing Together, a se-quel toMyth; extending the observation and recording method for coding videotape rec-ords of police-protester collective action and interaction in London, where he will be aFulbright senior research fellow for 1998-1999; and, with John McCarthy, developing asurvey of U.S. police agencies’ protest policing frequency, training, and organization.
498 SOCIOLOGICAL METHODS & RESEARCH


![Griechische Münzen / [F. Imhoof-Blumer]](https://static.fdocuments.in/doc/165x107/577cc6811a28aba7119e6d45/griechische-muenzen-f-imhoof-blumer.jpg)