A Method for Recognizing Postures and Gestures Using Foot ...€¦ · from three pressure sensors...
11
Journal of Information Processing Vol.27 348–358 (Apr. 2019) [DOI: 10.2197/ipsjjip.27.348] Regular Paper A Method for Recognizing Postures and Gestures Using Foot Pressure Sensors A yumi Ohnishi 1,a) Tsutomu Terada 1,2,b) Masahiko Tsukamoto 1,c) Received: August 27, 2018, Accepted: January 15, 2019 Abstract: In this paper, we propose a method for recognizing postures and gestures by using foot pressure sensors, and we investigate optimal positions for pressure sensors on soles from the viewpoint of motion recognition accuracy. In experiments, the recognition accuracies of 22 kinds of daily postures and gestures were evaluated from foot-pressure sensor values. Furthermore, the optimum measurement points for high recognition accuracy were examined by eval- uating combinations of two foot pressure measurement areas on a round-robin basis. As a result, when selecting the optimum two points for each user, the recognition accuracy was about 94.5% on average. The recognition accuracy of the averaged combinations of the best two combinations for all subjects was classified with an accuracy of about 91.9% on average. As a result of an evaluation to raise versatility, the average recognition accuracy in a three-point evaluation was 98.4%, which was almost the same with the recognition accuracy when using all 105 points. In anticipation of the applicability of this research result, two types of pressure sensing shoes were developed. Keywords: foot pressure, posture recognition, gesture recognition, insole, shoes device 1. Introduction Due to the miniaturization of sensors, it has become possible to acquire various contexts by wearing sensors. Commercial life log systems also have begun to appear, and context-aware ser- vices with wearable sensors are being introduced to support our daily lives. In the near future, more and more context-aware ser- vices will be generalized due to further improvements to the per- formance and miniaturization of sensors. By attaching many sensors to the body, it is possible to acquire a lot of human motion data. However, since mounting multiple devices requires labor or cost, it is desirable that wearable devices are integrated into what people routinely use in life. Therefore, we focused on shoes because they are used on a daily basis, and they can be used to sense the feet, thus making it possible to col- lect a lot of information on the human body. If actions were estimated from sensors built into shoes, it would be possible to sense human behaviors naturally when they are moving. This would be applicable in a lot of situations, not only in daily situations but also in sports or entertainment. Also, such shoe-type systems would become natural to use for users who are unfamiliar with charging or attaching/detaching devices, so they could be applied to systems used for the elderly and oth- ers. In existing research, there are many examples of using shoes for sensing; however, the states of body parts other than the feet were not recognizable, such as postures. In addition, the optimal 1 Graduate School of Engineering, Kobe University, Kobe, Hyogo 657– 8501, Japan 2 PREST, JST, Kawaguchi, Saitama 332–0012, Japan a) [email protected] b) [email protected] c) [email protected] sensor arrangement for estimating states was not studied in detail. By investigating which parts of the sole of the foot are effective for recognizing posture and motion, it would be possible to study how to efficiently place sensors to achieve a high recognition ac- curacy and a low power consumption; therefore, it is meaningful to examine the optimum measurement position. In this research, we propose a method for recognizing body postures and motions from foot pressure information by using foot pressure distribution sensors mounted on shoes. Consider- ing power consumption, it is desirable to estimate postures and motions with a small number of sensors. Therefore, the optimum number of sensors and sensor positions that can recognize every- day postures and motions with high accuracy were investigated. The structure of this paper is described below. In Section 2, re- lated research is introduced. In Section 3, we discuss two evalua- tion experiments and explain sensing shoes developed to measure foot pressure, and we describe future directions of this research in Section 4. Finally, we summarize the paper in Section 5. 2. Related Research 2.1 Foot Pressure Analysis The measurement and analysis of pressure values applied to the soles of the feet have been studied. Zhou et al. tried to iden- tify individuals from the way they walked by using a carpet-type pressure sensor sheet and identified them with an accuracy of 76.9% [1]. Sousa et al. tracked and identified people by using pressure sensor sheets and wearable accelerometers [2]. These studies focused on individual differences in walking or foot pres- sure changes, identified individuals from foot pressure analysis, and did not recognize posture or motion from foot pressure. How- ever, since pressure sensor sheets stay in one location, it is diffi- cult to record daily behaviors outside the home. c 2019 Information Processing Society of Japan 348
Transcript of A Method for Recognizing Postures and Gestures Using Foot ...€¦ · from three pressure sensors...

Journal of Information Processing Vol.27 348–358 (Apr. 2019)
[DOI: 10.2197/ipsjjip.27.348]
Regular Paper
A Method for Recognizing Postures and GesturesUsing Foot Pressure Sensors
Ayumi Ohnishi1,a) Tsutomu Terada1,2,b) Masahiko Tsukamoto1,c)
Received: August 27, 2018, Accepted: January 15, 2019
Abstract: In this paper, we propose a method for recognizing postures and gestures by using foot pressure sensors,and we investigate optimal positions for pressure sensors on soles from the viewpoint of motion recognition accuracy.In experiments, the recognition accuracies of 22 kinds of daily postures and gestures were evaluated from foot-pressuresensor values. Furthermore, the optimum measurement points for high recognition accuracy were examined by eval-uating combinations of two foot pressure measurement areas on a round-robin basis. As a result, when selecting theoptimum two points for each user, the recognition accuracy was about 94.5% on average. The recognition accuracy ofthe averaged combinations of the best two combinations for all subjects was classified with an accuracy of about 91.9%on average. As a result of an evaluation to raise versatility, the average recognition accuracy in a three-point evaluationwas 98.4%, which was almost the same with the recognition accuracy when using all 105 points. In anticipation of theapplicability of this research result, two types of pressure sensing shoes were developed.
Keywords: foot pressure, posture recognition, gesture recognition, insole, shoes device
1. Introduction
Due to the miniaturization of sensors, it has become possibleto acquire various contexts by wearing sensors. Commercial lifelog systems also have begun to appear, and context-aware ser-vices with wearable sensors are being introduced to support ourdaily lives. In the near future, more and more context-aware ser-vices will be generalized due to further improvements to the per-formance and miniaturization of sensors.
By attaching many sensors to the body, it is possible to acquirea lot of human motion data. However, since mounting multipledevices requires labor or cost, it is desirable that wearable devicesare integrated into what people routinely use in life. Therefore,we focused on shoes because they are used on a daily basis, andthey can be used to sense the feet, thus making it possible to col-lect a lot of information on the human body.
If actions were estimated from sensors built into shoes, itwould be possible to sense human behaviors naturally when theyare moving. This would be applicable in a lot of situations, notonly in daily situations but also in sports or entertainment. Also,such shoe-type systems would become natural to use for userswho are unfamiliar with charging or attaching/detaching devices,so they could be applied to systems used for the elderly and oth-ers.
In existing research, there are many examples of using shoesfor sensing; however, the states of body parts other than the feetwere not recognizable, such as postures. In addition, the optimal
1 Graduate School of Engineering, Kobe University, Kobe, Hyogo 657–8501, Japan
2 PREST, JST, Kawaguchi, Saitama 332–0012, Japana) [email protected]) [email protected]) [email protected]
sensor arrangement for estimating states was not studied in detail.By investigating which parts of the sole of the foot are effectivefor recognizing posture and motion, it would be possible to studyhow to efficiently place sensors to achieve a high recognition ac-curacy and a low power consumption; therefore, it is meaningfulto examine the optimum measurement position.
In this research, we propose a method for recognizing bodypostures and motions from foot pressure information by usingfoot pressure distribution sensors mounted on shoes. Consider-ing power consumption, it is desirable to estimate postures andmotions with a small number of sensors. Therefore, the optimumnumber of sensors and sensor positions that can recognize every-day postures and motions with high accuracy were investigated.
The structure of this paper is described below. In Section 2, re-lated research is introduced. In Section 3, we discuss two evalua-tion experiments and explain sensing shoes developed to measurefoot pressure, and we describe future directions of this researchin Section 4. Finally, we summarize the paper in Section 5.
2. Related Research
2.1 Foot Pressure AnalysisThe measurement and analysis of pressure values applied to
the soles of the feet have been studied. Zhou et al. tried to iden-tify individuals from the way they walked by using a carpet-typepressure sensor sheet and identified them with an accuracy of76.9% [1]. Sousa et al. tracked and identified people by usingpressure sensor sheets and wearable accelerometers [2]. Thesestudies focused on individual differences in walking or foot pres-sure changes, identified individuals from foot pressure analysis,and did not recognize posture or motion from foot pressure. How-ever, since pressure sensor sheets stay in one location, it is diffi-cult to record daily behaviors outside the home.
c© 2019 Information Processing Society of Japan 348

Journal of Information Processing Vol.27 348–358 (Apr. 2019)
In this research, shoes that are routinely worn on a daily basis,independent of location, and that recognize motions and posturesby using low-cost pressure sensors were focused on.
2.2 Research on Recognizing Daily BehaviorsStarner et al. recognized users’ daily behaviors by using a cam-
era [3]. Many pieces of research have been conducted to recog-nize a user’s actions by using cameras; however, the method ofstudy depended on the place. It has become possible to recognizedaily behaviors without depending on the place by using wearablesensors to recognize such behaviors.
As a daily context aware system that uses a wearable sensor,Tsubaki et al. recognized eleven kinds of motions or posturesfrom body circumference changes by using a stretch sensor [4].However, the sensor must be brought into close contact with mul-tiple parts, such as the arms, legs, and belly of the body. Accelera-tion sensors have often been used for gesture recognition. Muraoet al. evaluated 27 kinds of gestures by using 9 types of accelera-tion sensors and angular velocity sensors arranged on a board andevaluated the recognition accuracy when changing the positionand number of sensors [5]. Watanabe et al. used small ultrasonicspeakers on the arms and microphones on the chest to recognizegestures by using the change in ultrasonic volume and frequencychange caused by the Doppler effect [6]. Microsoft’s Kinect [7]could recognize a user’s postures and gestures with infrared raysand depth sensors. Although the researchers in these studies ac-quired postures and motions that could be judged from their ap-pearance, they had difficulty acquiring contexts that did not havelarge movements, for example, continually placing a load on onefoot or making movements with the center of gravity of the body.If we could recognize everyday contexts with shoes, it would beconvenient for users because shoes are relatively easy to maintain,and people usually wear shoes.
2.3 Research on Measuring Foot Pressure with a WearableSystem
There is a huge body of existing work on different approachesand the application of shoe pressure sensors [8]. When analyz-ing walking by using a pressure sensor sheet, it is unnecessaryto consider the arrangement of sensors. However, to measure thepressure of the soles by using a wearable device, we need to selectpositions for sensors where we can acquire the desired data witha high accuracy in consideration of power consumption and prac-ticality. We will explain the research on using wearable systemssuch as shoes or socks with a focus on the sensor layout. Fukaboriet al. developed a sock-type device called “Sockswitch” and builtan interface by using user-defined minute ankle gestures [9]. Withthis device, 8 points on one foot (a total of 16 pressure sensors)were arranged at the center of the toes of the foot in order toperform a gesture. Hayama et al. measured the feet pressure byusing an insole-type pressure sensor with 11 pressure sensors onone foot and compared pressure sensor values with measured val-ues acquired on a force plate to estimate the trajectory of the footpressure [10]. In this study, the sensor placement was decided onthe basis of the characteristics of the foot sole load for each sub-ject. Zhou et al. estimated the direction of a ball from a pressure
sensor sheet attached at three places that were hit when the ballwas kicked by a football shoe [11]. Talavera et al. developed awireless insole with a 14-point pressure sensor in a project called“WIISEL” in Europe [12]. In this project, walking data of peoplewere obtained in large-scale demonstration experiments, and afall risk analysis was performed mainly for elderly people. Sincethis insole had non-contact charging and used BLE communica-tion, there were no connectors or cables; moreover, it was de-signed to have a low power consumption. However, sensor place-ment was not described in detail. These 14 sensor positions weredecided uniquely by the authors, and no clear reasons why these14 points were set were indicated. Gonzalez et al. measured footpressure and performed gait analysis [13], but his research fo-cused only on walking behaviors in daily movement. Moufawadet al. classified sitting, standing and walking, using IMU sensorsand foot pressure measurement insole, but other actions in dailylife were not discussed [14]. Sazonov et al. estimated 14 types ofdaily postures or movements, such as standing, walking, running,cycling, etc., from the foot pressure values placed at 5 points onthe insole [15]. Hegde et al. recognized 14 types of daily motionsfrom three pressure sensors (FSR 402) in the insole and an ac-celeration angular velocity sensor attached to the wrist; however,they used a wrist sensor [16]. Although these studies recognizedsimilar motions, the number or arrangement of sensors were notdiscussed in detail, and sensors were laid out independently.
In this research, a large number of pressure sensors were spreadover the entire sole. In consideration of daily contexts, effectivepoints for measurement were studied.
3. Evaluation
3.1 System ConfigurationIn this paper, first, we evaluate the accuracy of recognizing pos-
tures and gestures by using shoes with many (130 points) pressuresensors to clarify if the foot pressures explain whole body pos-tures and gestures. Second, we investigated the optimal sensingposition to realize highly accurate estimation of daily posturesand motions with the minimum number of sensors.
In this section, we describe the evaluation environment used toevaluate the accuracy of recognizing postures and motions fromfoot pressure. Figure 1 shows the system configuration. To ob-tain foot pressure data, medilogic’s system for measuring the dis-tribution of foot pressure [17] was used. The system acquiresabout 130 points of pressure values on one foot, for a total ofabout 260 pressure values, and transmits the data to a PC via Wi-Fi. The sampling rate was set to 100 Hz. Also, video data wasacquired by using video cameras to confirm subjects’ real mo-tions. All subjects who participated wore running shoes, JOG100 2 by ASICS, while foot pressure was measured in the exper-iment described in the next section.
3.2 Experimental MethodIn the evaluation experiments, foot pressure data were acquired
when the 22 postures and gestures in Fig. 2 were performed. First,to ascertain whether or not the context of these postures and ges-tures could be estimated from foot pressure, the recognition accu-racy for each context was calculated from foot pressure data when
c© 2019 Information Processing Society of Japan 349

Journal of Information Processing Vol.27 348–358 (Apr. 2019)
Fig. 2 22 kinds of postures and gestures.
Table 1 Subject information.
Subjects 1 2 3 4 5 6 7 8 9 10Height [cm] 182 157 168 171 170 159 171 154 170 165
BMI 17.8 19.1 18.6 21.9 19.0 21.1 25.3 19.8 19.7 18.0Shoe Size [cm] 28 23.5 26 27 26 24 27 23.5 26 25Male/Female M F M M M F M F M F
Characteristic of legs *1 Straight O-leg O-leg Straight Straight Unknown Straight Straight Straight Straight
Fig. 1 System configuration.
each motion was taken. In addition, to estimate daily postures andgestures from foot pressure with a high accuracy and with theminimum sensor configuration, the optimal measurement pointsused to select two points to combine into the best combinationwere evaluated on a round-robin basis. Using the system de-scribed in Section 3.1, foot pressure data were acquired underthe assumption of 22 kinds of daily motions, shown in Fig. 2.Ten subjects, 6 men and 4 females, participated. They were intheir twenties. Table 1 shows the subjects’ heights, foot sizes,and gender. Also, because there was a possibility that the shapeof the legs was related to the pressure of the feet, the subjectswere asked to indicate their leg shape characteristic from amongfive choices, O-leg, X-leg, neither, unknown, and others. Table 1shows the subjects’ answers.
In the experiment, foot pressure data of about 30 seconds were
*1 Characteristic of legs means the response of the subjects from amongfive choices: O-leg, X-leg, straight, unknown, others.
collected after each posture or motion stabilized, and one set, 22kinds of motions per one subject, was acquired. Regarding howwe decide the 22 kinds of contexts, Bao et al. [18] summarized thecontexts recognized in several pieces of conventional research.The contexts were ambulation, posture, typing, talking, bicycling,stairs up & down, shaking hands, writing on board, and armmovement. Furthermore, this paper [18] evaluated 20 kinds ofcontexts, that is, walking, sitting & relaxing, standing still, watch-ing TV, running, stretching, scrubbing, folding laundry, brush-ing teeth, riding elevator, walking while carrying items, work-ing on computer, eating or drinking, reading, bicycling, strength-training, vacuuming, lying down & relaxing, climbing stairs, andriding escalator [18]. For our research, we chose actions that canbe done when wearing shoes from among these. Regarding pos-tures, we assumed that complicated movements of the arms thatare made without trunk twisting or movement were not suitablyrecognizable from shoes, so we added every posture that includedtrunk movement that we could think of. For our experiences toreview the conventional papers, there are two types of way to de-cide the target contexts for activity recognition. One is that thepaper had clear target application(s) and clearly the target con-texts are defined to achieve the requirements on the application.The other is that there was no clear application and the target con-texts were selected including various daily/basic activities not tolimit the target applications. Our purpose of this research is to es-tablish a general-purpose activity recognition using foot pressuresensors, so our approach is similar to that of the latter one. In con-ventional papers in the latter case, there was no clear rule/policyof selecting contexts clearly. Therefore, we also selected contextscarefully considering the target contexts in existing works, and itwas not a problem as context recognition research.
On the basis of the above, to facilitate comparison with priorresearch by making our research similar to conventional studies
c© 2019 Information Processing Society of Japan 350

Journal of Information Processing Vol.27 348–358 (Apr. 2019)
on recognizing daily motions [4], [6], [18], we adopted as manycontexts from the previous pieces of research as possible.
3.3 Evaluation Method3.3.1 Data Processing before Analysis
Medilogic’s insole for measuring the distribution of foot pres-sure consists of 130 points for one foot with a foot size of 25 cmor larger and 107 points with a shoe size of smaller than 25 cm.For this research, we assumed a shoe-type system that uses com-mercially available sensors such as FSR 402 [19]. Each measure-ment point of medilogic’s insole sensor used in this experimentis smaller than those of FSR 402. Therefore, as shown in Fig. 3,we used the average value of pressure values for every four adja-cent pressure sensors as one area for evaluation. In the case of asubject using 25 cm or larger, there were 105 areas per foot for atotal of 210 sensors, and in the case of smaller than 25 cm, therewere 84 areas per foot for a total of 168 areas for the subsequentevaluation. The area numbers used are shown in Fig. 4.3.3.2 Evaluation 1: Recognition Accuracy When All Mea-
surement Areas Were Used as FeaturesAs described in Section 3.2, by using all values obtained for
each shoe size, the recognition accuracy was evaluated for 22kinds of contexts. Four recognition algorithms were used: C4.5,random forest, naive Bayes, and support vector machine (SVM).These data were evaluated by 3-hold cross validation using the
Fig. 3 Areas calculated from foot pressure sensors.
Fig. 4 Calculated area Nos. for evaluating.
data mining tool Weka [20].A total of 630/504 features were used in Evaluation 1, which
were both feet for each of 105/84 areas of instantaneous values,the average values of the past ten samples (0.1 second), and thevariance values of the past ten samples (0.1 second) in each oftwo areas. The average value and variance value were calculatedby setting the window size to 10 samples (0.1 second) and slidingthe window every sample.
For n samples (x1, x2, . . . , xn), their average value is X, and thevariance value (sample variance) used for the feature quantity canbe obtained by using the following equation.
s2 =1n
n∑
i=0
(xi − X)2 (1)
Classifiers were constructed for each subject and evaluated byusing a unique model for each subject.3.3.3 Evaluation 2: Recognition Accuracy When Combina-
tions of Two Areas Were Used as FeaturesA combination of two recognition areas for which the recogni-
tion accuracy was high was selected on a round-robin basis withthe average recognition accuracy. Subjects with shoe sizes of25 cm or larger wore shoes with 105 separated areas per foot,and subjects of smaller than 25 cm wore them with 84 separatedareas per foot. When choosing 2 points from 105 areas, there are5,460 combinations; similarly, there were 3,486 patterns in thecase of 84 areas. For both of these combinations, the recognitionaccuracy was evaluated with the following procedure. Two areaswere selected, and the out-of-bag (OOB) error rate was calculatedby using random forest. The same features as Evaluation 1 wereused. This procedure was performed for all combinations, andthe recognition accuracy was evaluated by comparing the aver-age OOB error rate of the 22 contexts.
Shoes were personalized for each person. The optimum twopoints were tested by using a model that was unique to each per-son to determine the ranking of the combination of two pointssuited to the individual. Comparing the difference in recognitionrate of the selected two points with the rate of all of the points,we increased the number to 2 and 3 while calculating recognitionaccuracies. Therefore, in Evaluation 1 and Evaluation 2, classi-fiers were constructed for each subject and evaluated by using thesubjects’ own models. Assuming that shoes with sensors will besold on the market, it will be practical for the best two points tobe fixed. To evaluate the fixed points, we also conducted two testsusing each subjects’ models and the models of others.
Table 2 Recognition rate using all areas of soles.
Recognition Rates [%] (All Areas)Subject C4.5 Random Forest Naive Bayes SVM
1 99.4 99.9 88.9 99.82 98.4 99.3 81.5 99.33 99.3 99.9 85.5 99.84 99.4 99.9 82.0 99.55 99.4 99.9 87.7 99.96 98.7 99.6 83.1 99.67 99.0 99.9 86.6 98.18 98.2 99.5 81.8 98.59 98.8 99.8 81.1 99.210 98.3 99.5 77.6 99.2
Ave. 98.9 99.7 83.6 99.3
c© 2019 Information Processing Society of Japan 351

Journal of Information Processing Vol.27 348–358 (Apr. 2019)
Fig. 5 Best two areas for each subject.
Table 3 Ranking of pressure area combinations.
Area combination (Area No.)Ranking Subject 1 Subject 2 Subject 3 Subject 4 Subject 5 Subject 6 Subject 7 Subject 8 Subject 9 Subject 10
1 24 97 20 58 28 96 13 71 31 97 20 84 33 73 13 72 14 64 2 642 23 97 20 57 29 97 14 71 32 101 13 61 21 66 13 66 14 65 1 643 23 96 13 58 21 97 12 71 32 102 20 83 20 66 12 70 13 64 14 144 24 98 13 57 29 96 12 73 32 97 12 61 32 66 12 72 13 65 2 575 24 96 13 56 21 90 12 72 31 98 13 67 21 72 12 69 13 58 22 64
3.4 Result3.4.1 Result of Evaluation 1
Table 2 shows the motion recognition accuracy for each sub-ject with the feature quantities of all areas. The recognition ac-curacy for random forest was 99.7%, which was the maximumamong the four classifiers. From this result, when all of the footsole sensors were used, the subjects’ motions could be recognizedat nearly 100%.3.4.2 Result of Evaluation 2
The combinations of the two points with the highest averagerecognition accuracy for each subject are shown in Fig. 5. In ad-dition, the combinations with high average recognition accuracyfor each subject in Table 3 are ranked up to the fifth ranking. Fur-thermore, Table 4 summarizes the minimum error rate, maximumerror rate, etc. for the best two points of each subject. In additionto that, the context ranking is also shown in Table 4, arranged inorder of increasing recognition accuracy of the contexts for eachsubject when using the best two points. As shown in Fig. 5, foreach subject, the combination of the best two points with the av-erage recognition accuracy of 22 contexts was the first point, thatis, the near thenar (thumb ball of foot), which is located near thethumb ball, and the second point, the outside of the middle foot orthe heel. One of the two best points was near the thenar for nineout of ten subjects. In comparison, the combinations of two pointswith the lowest average recognition accuracy were two areas ad-jacent to the arch for eight subjects. The remaining two persons
(Subjects 1 and 3) had poor recognition accuracies for two adja-cent points on the outer edge of the heel and on the outer edge ofthe toes, respectively. There was no relationship between the bestcombination and the information on the O-leg and the X-leg inTable 1. Since the motions that could be recognized well for eachof the two points were slightly different, it would be best to finelyadjust the optimum arrangement of the two points depending onthe target motions.
Next, for a practical application, to create a shoe-type device,the places in which the sensors should actually be arranged wereinvestigated. In other words, two common points for which allparticipants’ contexts can be recognized with high accuracy wereconsidered. From Table 4, when we selected the optimum twopoints for each user, the average recognition accuracy was 94.5%.This result is thought to be in a sufficiently useful range for dailylife. However, the results show that the recognition accuracies ofgesture contexts were not high. We consider that these low recog-nition rates are related to fixing the window sizes of the averagevalue and variance value to be as short as 0.1 seconds. This couldpossibly be improved by adjusting the window size.
In Fig. 6, the coordinates of seven people with sizes of 25 cmor larger and three people with 25 cm or smaller were comparedin terms of ratio. The best two points of all subjects were plot-ted in two-dimensional coordinates with the point of origin on theright foot heel. As shown in Fig. 7, the combination of these twopoints was divided into two patterns without duplication by using
c© 2019 Information Processing Society of Japan 352

Journal of Information Processing Vol.27 348–358 (Apr. 2019)
Table 4 Summary of best combinations of sensor areas.
Best area Nos. Summary of recognition rate [%] Context number for recognition rate rank (1: High – 22: Low)Subject ID Area 1 Area 2 Min. Mean Max. 1 2 3 4 5 6 7 8 9 10 11 12 13 14 15 16 17 18 19 20 21 22
1 24 97 61.1 95.7 100.0 1 2 4 5 6 7 8 9 10 11 13 14 15 18 22 3 12 20 21 19 16 172 20 58 44.8 93.7 100.0 1 5 6 7 8 9 10 11 12 13 14 4 3 15 2 21 18 16 19 22 17 203 28 96 54.3 94.7 100.0 1 4 5 6 8 9 11 15 22 18 3 7 10 13 14 2 12 21 20 19 17 164 13 71 70.1 94.6 100.0 1 4 8 13 14 15 6 10 5 9 7 11 3 18 12 2 22 20 21 16 17 195 31 97 52.6 94.0 100.0 1 4 5 6 7 8 9 10 11 12 13 14 15 18 22 2 3 21 19 17 16 206 20 84 78.8 97.3 100.0 1 2 4 5 6 7 8 9 10 11 12 14 22 13 18 3 15 21 16 20 19 177 33 73 45.3 92.9 100.0 1 3 4 5 6 9 10 11 14 15 7 2 22 12 8 13 18 21 19 16 17 208 13 72 62.5 94.9 100.0 4 5 7 8 9 10 11 12 13 14 18 2 1 15 6 3 21 22 20 19 16 179 14 64 58.8 93.8 100.0 1 9 11 14 7 10 18 2 12 6 8 15 22 3 5 13 4 21 20 19 16 1710 2 64 59.9 93.5 100.0 1 4 5 6 7 8 9 15 22 10 13 18 14 11 3 2 12 20 21 19 16 17
Ave. - - 58.8 94.5 100.0 - - - - - - - - - - - - - - - - - - - - - -
Fig. 6 Plotting best two points on 2D coordinates.
Fig. 7 Patterns of best two points classified by k-means.
the k-means method. Therefore, it can be thought that there wereroughly two best combinations, shown in Fig. 8 (a), for the sub-jects. That is, one of the two optimum points was commonly thenear thenar for the subjects; however, individual differences forthe other one point appeared, and two major patterns [Fig. 8 (a)]were observed. Therefore, by taking three points of data and cov-ering these two combinations, it will be possible to cope withindividual differences. Furthermore, looking at the two points ofFig. 6, the two points on the anterior half of the sole and aroundthe heel posterior of the arch were commonly selected as the bestcombination for all subjects. Therefore, the mean value of thecoordinates of the anterior and posterior areas of the feet was cal-culated, and the average coordinates of the best combination forthe 10 subjects were calculated. The average of the best points is
Fig. 8 Summary of best combinations of areas.
shown in Fig. 8 (b). The coordinates in Fig. 8 (b) were area Nos.23 and 85 of Fig. 4 for subjects with sizes over 25 cm and areaNos. 20 and 68 of Fig. 4 for those smaller than 25 cm.
The recognition accuracy of these points is shown in Table 5,and the accuracy was about 91.9% on average. For all subjects,the average recognition accuracy when choosing the optimumtwo points for each subject was 94.5% from Table 4, and bothaccuracies were almost the same.
However, since it is doubtful whether the areas should be sim-ply averaged regarding the decision of the two points, we com-pared the recognition accuracy when using the patterns of thecombination of the two best points in Fig. 8 (a) (Class 1, Class 2)to the recognition accuracy when using the average best combi-nation point in Fig. 8 (b). Table 6 shows the result. From thisresult, the recognition accuracy of the average best combinationwas high and confirmed to be almost the same as the two patterns.
Therefore, as a conclusion to the two-point evaluation, whenrecognizing daily motions as done in this research, the arrange-ment of Fig. 8 (b) was the combination of the best two points thatcan be used for recognition with high accuracy while coveringindividual differences. However, because we did not evaluateputting the shoes on and taking them off in this experiment, weneed to investigate this as future work.3.4.3 Evaluation on Versatility
Up to this chapter, we have investigated the optimal combina-tion of the two points. Two different optimal combinations fortwo sensors were mainly observed, and nearby the thenars werecommon to the two patterns. When adapting to commercially
c© 2019 Information Processing Society of Japan 353
Journal of Information Processing Vol.27 348–358 (Apr. 2019)
Table 5 Recognition rate of average of best combination areas.
Context Recognition rate [%]No. Subject 1 Subject 2 Subject 3 Subject 4 Subject 5 Subject 6 Subject 7 Subject 8 Subject 9 Subject 10 Ave.1 100.0 100.0 100.0 100.0 100.0 100.0 100.0 99.8 100.0 100.0 100.02 99.8 100.0 100.0 100.0 98.8 100.0 99.7 100.0 99.5 100.0 99.83 99.9 99.9 100.0 99.6 99.7 99.0 100.0 100.0 98.3 99.9 99.64 100.0 99.9 100.0 100.0 99.9 100.0 100.0 100.0 67.3 99.4 96.65 99.9 100.0 99.9 99.9 100.0 98.4 100.0 100.0 99.8 100.0 99.86 100.0 100.0 100.0 100.0 100.0 100.0 100.0 100.0 100.0 100.0 100.07 100.0 100.0 100.0 100.0 100.0 99.9 100.0 100.0 100.0 100.0 100.08 100.0 100.0 100.0 100.0 100.0 100.0 100.0 100.0 100.0 100.0 100.09 100.0 100.0 100.0 99.9 100.0 100.0 100.0 100.0 100.0 100.0 100.010 100.0 100.0 100.0 100.0 100.0 100.0 100.0 100.0 100.0 99.1 99.911 100.0 97.8 100.0 100.0 100.0 100.0 100.0 100.0 100.0 87.9 98.612 100.0 99.5 79.1 100.0 99.9 100.0 97.0 100.0 85.7 96.4 95.813 100.0 100.0 99.7 100.0 100.0 100.0 68.9 100.0 82.9 100.0 95.214 100.0 100.0 100.0 100.0 100.0 99.9 100.0 100.0 100.0 100.0 100.015 100.0 100.0 100.0 100.0 99.9 99.9 100.0 100.0 99.8 100.0 100.016 82.0 58.0 50.7 61.0 55.3 77.1 63.0 63.5 51.5 43.3 60.517 61.4 61.8 52.9 67.9 56.8 67.9 56.9 64.4 57.0 51.4 59.818 94.8 75.4 97.1 76.2 82.0 100.0 99.5 100.0 79.6 71.8 87.619 79.5 78.7 77.8 56.5 77.7 86.1 70.7 72.3 78.1 50.9 72.820 92.3 49.8 87.9 83.3 49.0 79.8 31.3 82.0 69.8 60.9 68.621 80.7 98.7 81.5 40.7 98.6 98.5 96.4 96.8 96.1 92.8 88.122 100.0 100.0 100.0 99.9 100.0 100.0 100.0 96.7 99.7 99.9 99.6
Ave. 95.0 91.8 92.1 90.2 91.7 95.8 90.2 94.3 89.3 88.8 91.9
Table 6 Comparison of recognition rates of two points.
Sub. No. 1 2 3 4 5 6 7 8 9 10Class No. 1 2 1 2 1 1 2 1 2 2 Ave.Class 1 95.1 91.2 92.6 91.3 92.5 95.7 89.4 93.8 90.8 88.7 92.1Class 2 91.8 93.6 89.3 92.2 86.9 96 87.8 94 91.9 91.7 91.5
Ave. of all best areas 95.0 91.8 92.1 90.2 91.7 95.8 90.2 94.3 89.3 88.8 91.9
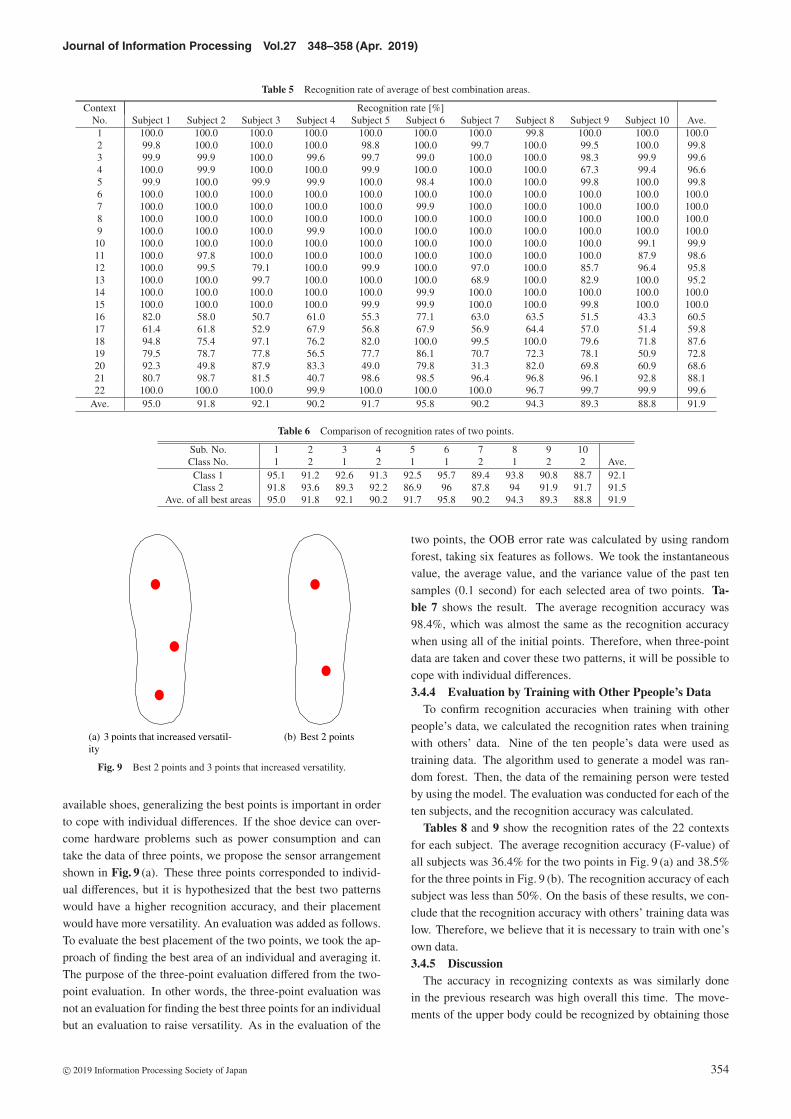
Fig. 9 Best 2 points and 3 points that increased versatility.
available shoes, generalizing the best points is important in orderto cope with individual differences. If the shoe device can over-come hardware problems such as power consumption and cantake the data of three points, we propose the sensor arrangementshown in Fig. 9 (a). These three points corresponded to individ-ual differences, but it is hypothesized that the best two patternswould have a higher recognition accuracy, and their placementwould have more versatility. An evaluation was added as follows.To evaluate the best placement of the two points, we took the ap-proach of finding the best area of an individual and averaging it.The purpose of the three-point evaluation differed from the two-point evaluation. In other words, the three-point evaluation wasnot an evaluation for finding the best three points for an individualbut an evaluation to raise versatility. As in the evaluation of the
two points, the OOB error rate was calculated by using randomforest, taking six features as follows. We took the instantaneousvalue, the average value, and the variance value of the past tensamples (0.1 second) for each selected area of two points. Ta-ble 7 shows the result. The average recognition accuracy was98.4%, which was almost the same as the recognition accuracywhen using all of the initial points. Therefore, when three-pointdata are taken and cover these two patterns, it will be possible tocope with individual differences.3.4.4 Evaluation by Training with Other Ppeople’s Data
To confirm recognition accuracies when training with otherpeople’s data, we calculated the recognition rates when trainingwith others’ data. Nine of the ten people’s data were used astraining data. The algorithm used to generate a model was ran-dom forest. Then, the data of the remaining person were testedby using the model. The evaluation was conducted for each of theten subjects, and the recognition accuracy was calculated.
Tables 8 and 9 show the recognition rates of the 22 contextsfor each subject. The average recognition accuracy (F-value) ofall subjects was 36.4% for the two points in Fig. 9 (a) and 38.5%for the three points in Fig. 9 (b). The recognition accuracy of eachsubject was less than 50%. On the basis of these results, we con-clude that the recognition accuracy with others’ training data waslow. Therefore, we believe that it is necessary to train with one’sown data.3.4.5 Discussion
The accuracy in recognizing contexts as was similarly donein the previous research was high overall this time. The move-ments of the upper body could be recognized by obtaining those
c© 2019 Information Processing Society of Japan 354

Journal of Information Processing Vol.27 348–358 (Apr. 2019)
Table 7 Recognition rate of a combination of 3 areas with high versatility.
Context Recognition rate [%]No. Subject 1 Subject 2 Subject 3 Subject 4 Subject 5 Subject 6 Subject 7 Subject 8 Subject 9 Subject 10 Ave.1 100.0 100.0 100.0 100.0 100.0 100.0 100.0 100.0 100.0 100.0 100.02 100.0 100.0 100.0 100.0 100.0 100.0 100.0 100.0 100.0 100.0 100.03 100.0 100.0 100.0 100.0 100.0 100.0 100.0 100.0 100.0 100.0 100.04 100.0 100.0 100.0 100.0 100.0 100.0 100.0 100.0 100.0 100.0 100.05 100.0 100.0 100.0 99.9 100.0 100.0 100.0 100.0 99.9 100.0 100.06 100.0 100.0 100.0 100.0 100.0 100.0 100.0 100.0 100.0 100.0 100.07 100.0 100.0 100.0 100.0 100.0 100.0 100.0 100.0 100.0 100.0 100.08 100.0 100.0 100.0 100.0 100.0 100.0 100.0 100.0 100.0 100.0 100.09 100.0 100.0 100.0 100.0 100.0 100.0 100.0 100.0 100.0 100.0 100.010 100.0 99.9 100.0 100.0 100.0 100.0 100.0 100.0 100.0 100.0 100.011 100.0 100.0 100.0 100.0 100.0 100.0 100.0 100.0 100.0 99.7 100.012 100.0 100.0 85.9 100.0 100.0 100.0 95.4 100.0 100.0 99.4 98.113 100.0 100.0 99.2 100.0 100.0 100.0 98.9 100.0 100.0 100.0 99.814 100.0 100.0 100.0 100.0 100.0 100.0 100.0 100.0 100.0 100.0 100.015 100.0 100.0 100.0 100.0 100.0 100.0 100.0 100.0 100.0 100.0 100.016 97.9 95.5 94.0 97.0 97.1 89.3 91.3 90.7 93.2 82.1 92.817 96.4 96.6 92.4 96.7 95.8 89.2 90.6 86.2 89.9 88.1 92.218 100.0 97.5 100.0 97.6 100.0 100.0 100.0 100.0 93.6 93.8 98.219 98.9 97.5 98.3 98.6 98.2 97.9 98.2 97.0 97.0 89.0 97.120 98.9 85.3 97.6 97.1 99.2 80.1 78.6 91.1 95.7 90.7 91.421 99.7 99.5 99.9 81.2 99.9 99.9 99.0 100.0 99.4 99.3 97.822 99.9 87.1 100.0 99.8 100.0 100.0 100.0 98.7 99.8 100.0 98.5
Ave. 99.6 98.1 98.5 98.5 99.6 98.0 97.8 98.4 98.6 97.4 98.4
Table 8 Evaluation result of 2 fixed areas using a model of others.
Context Recognition rate [%]No. Subject 1 Subject 2 Subject 3 Subject 4 Subject 5 Subject 6 Subject 7 Subject 8 Subject 9 Subject 10 Ave.1 0.8 2.1 0.5 0.2 0.2 77.6 26.5 0.5 10.2 0.5 11.92 65.0 88.7 70.1 67.8 35.4 76.1 65.9 81.8 91.7 74.6 71.73 69.4 87.4 50.8 48.5 19.8 75.2 60.0 93.8 59.8 85.0 65.04 0.4 92.6 35.0 20.8 0.0 62.2 11.1 53.8 97.3 0.2 37.35 93.1 21.1 9.4 55.9 0.0 0.1 2.2 85.3 1.8 0.0 26.96 0.0 0.0 5.0 0.0 14.9 0.0 29.7 0.0 27.9 0.0 7.77 96.9 17.7 36.4 0.0 0.2 4.6 34.2 0.1 9.5 0.8 20.08 0.0 0.0 0.0 0.0 0.0 0.0 0.0 10.1 0.0 0.0 1.09 0.0 0.0 0.0 0.0 96.9 88.1 0.0 0.0 0.0 98.3 28.3
10 4.7 29.2 1.6 14.5 0.0 78.8 54.0 56.6 56.5 62.0 35.811 0.0 0.0 0.0 0.0 9.0 7.9 0.0 0.0 0.0 8.4 2.512 97.9 68.0 97.2 90.8 66.3 68.2 60.9 82.9 87.4 54.3 77.413 0.0 17.9 0.0 0.0 37.5 35.8 0.0 0.0 0.0 1.2 9.214 56.4 86.3 0.0 0.0 44.9 51.4 0.5 0.1 7.9 9.8 25.715 0.0 84.3 0.0 0.0 97.4 96.8 22.4 68.7 37.6 0.0 40.716 30.5 40.3 49.6 41.5 36.1 30.9 33.2 28.5 39.9 24.1 35.517 27.2 47.1 42.9 30.9 31.9 43.7 36.5 27.1 25.2 27.0 34.018 34.4 55.4 44.4 60.2 50.1 35.6 53.3 36.6 57.7 29.5 45.719 46.1 58.8 42.9 39.0 30.0 41.7 21.3 60.7 42.0 38.2 42.120 25.1 54.2 23.7 9.5 10.5 31.8 46.8 23.4 44.0 39.5 30.921 56.7 78.5 52.3 85.5 57.6 84.2 75.0 85.0 79.7 82.1 73.722 86.2 72.2 78.3 87.9 11.7 89.1 87.4 88.4 94.0 87.1 78.2
Ave. 36.0 45.5 29.1 29.7 29.6 49.1 32.8 40.2 39.5 32.8 36.4
affecting the balance of the lower body. Also, because it was as-sumed that shoes are being worn in this research, depending onthe cultural sphere, other approaches would be more versatile ifthe target contexts are inside the house. Also, the recognition ac-curacy would be higher than that of other research [18] if easilyrecognizable contexts such as simple walking and running wereused. However, since Ref. [18] used a semi-naturalistic environ-ment, it would be difficult to compare this point in terms of recog-nition accuracy. Compared with other approaches, we considerthat the content of this research would be particularly suitablefor recognizing static postural changes due to left and right bal-ance difference and changes in the trunk center of gravity, whichhas not been done before with other approaches. When trying torecognize all 22 contexts, the recognition accuracy was low forwalking, walking around inside (left), and walking around inside
(right). The recognition accuracy is greatly influenced by the se-lection of contexts, so there are actions that are worth evaluatingwith some sort of selection, for example, we added escalators,elevators, opening and closing the door, cleaning, and walkingaround inside (left and right).
As a wearable device that records daily activities, the Fore-Athlete 935 smartwatch [21] can recognize the number of steps,activity level, sleep state, heart rate, and GPS and analyze runningby using an acceleration device attached to the waist that workswith the watch. Sony’s Lifelog [22] can log walking/running, bi-cycles, cars, sleeping hours, and mobile operating time. Whilethese obtain physiological information such as a sleeping stateand the heart rate, we cannot obtain static postural changes withthe load balanced on the left or right as in this research.
As for the wearing costs, most of wearable devices including
c© 2019 Information Processing Society of Japan 355

Journal of Information Processing Vol.27 348–358 (Apr. 2019)
Table 9 Evaluation result of 3 fixed areas using a model of others.
Context Recognition rate [%]No. Subject 1 Subject 2 Subject 3 Subject 4 Subject 5 Subject 6 Subject 7 Subject 8 Subject 9 Subject 10 Ave.1 0.5 0.2 0.5 0.3 0.2 0.4 1.8 0.4 0.4 0.5 0.52 73.9 97.9 88.9 93.4 81.3 98.0 62.5 92.4 54.6 97.1 84.03 81.9 0.0 52.3 93.9 33.4 77.3 88.7 92.0 74.4 92.7 68.74 0.3 29.1 94.0 3.7 0.2 98.4 0.0 5.2 1.2 0.2 23.25 66.6 16.8 0.7 16.9 0.1 5.3 0.0 0.0 68.2 57.4 23.26 0.0 22.4 4.0 0.0 13.8 3.0 16.6 0.0 1.5 1.0 6.27 0.0 0.0 0.0 0.0 0.1 0.0 9.4 0.0 5.5 27.5 4.28 92.1 0.1 88.6 0.0 72.2 99.9 0.0 0.0 0.0 0.9 35.49 99.8 0.0 21.1 51.7 99.9 99.1 0.0 0.0 0.0 78.1 45.0
10 23.7 16.2 82.0 0.0 95.8 78.4 32.9 80.0 71.2 74.1 55.411 6.7 0.0 1.0 8.2 0.0 8.4 0.0 0.0 0.0 5.6 3.012 92.0 70.8 80.9 97.3 59.4 50.2 62.2 88.4 97.5 61.4 76.013 0.0 23.3 99.9 0.0 17.7 16.3 0.0 9.8 0.0 31.2 19.814 5.1 37.5 0.0 0.0 0.2 1.6 0.0 0.0 18.6 0.1 6.315 0.0 60.4 61.3 0.0 77.0 0.1 0.6 86.4 38.2 37.0 36.116 63.2 51.3 70.4 49.7 47.2 47.8 34.3 9.3 43.2 29.8 44.617 53.8 51.3 53.0 43.2 20.6 34.2 30.7 32.8 30.3 40.9 39.118 34.0 36.1 34.5 74.4 63.4 56.0 64.6 19.7 69.7 46.9 49.919 40.2 64.9 35.6 45.0 44.0 41.1 20.5 22.0 33.6 37.6 38.420 44.3 39.8 34.1 6.4 7.9 26.1 40.2 32.9 60.1 51.1 34.321 59.1 76.5 57.1 88.6 50.9 83.1 76.5 80.1 85.5 84.8 74.222 93.9 71.5 76.8 86.6 10.9 93.9 96.5 83.9 96.0 93.0 80.3
Ave. 42.3 34.8 47.1 34.5 36.2 46.3 29.0 33.4 38.6 43.1 38.5
smart watches and an activity tracker, the devices are “additional”devices. It means that users do not wear devices depending onhis/her mind. On the other hand, everyone wears shoes outdoorsand it means that all data outdoors can be collected if all shoeshave the function we proposed. Conversely, especially in Japan,since shoes are removed indoors, our system cannot collect anydata indoors without using slipper-shaped devices.
In this research, the subjects in the experiment were men andwomen who were healthy, had a general body shape, and werein their twenties. The results of this experiment are effective forboth males and females within the range of those with an averagebody shape and high ability to walk. If the subjects had balancethat was greatly degraded due to aging, injury, etc., it is possiblethat the results of this experiment, which involved items relatedto left and right bias, may have been totally different. Regard-ing the difference depending on the type of shoes, this evaluationadopted sports shoes that are also often used for everyday uses,and only one type of shoe was used with the model. In conven-tional research, many shoe-type systems adopt sneakers such assports shoes. However, if the hardness of the sole is different, theway of applying the landing pressure changes, so it is consideredthat the results of this research may differ from the best arrange-ment when putting pressure sensors on business shoes etc.
4. Example Application
Applying the results of this research, our research group devel-oped the two shoe-type devices shown in Figs. 10 and 11. Thefirst device developed is shown in Fig. 10. Pressure sensors wereplaced at four points on one foot, and the pressure sensor val-ues at the four points were transmitted to a mobile phone or lap-top PC over a BLE connection. The device has a piezoelectricpower generation module, so it is battery-free. To select thesefour points, we chose a total of three points near the thumb ball,the anterior external side, and near the heel. For convenience ofwiring, the points of the anterior external side were slightly dif-
Fig. 10 Developed battery-free shoe device.
ferent from the best points sought for in Section 3. In addition,the maximum number of points without a battery was four. Thelast one point was placed on the toes because it was more able toacquire additional foot information. In future work, we will im-prove the sensor arrangement of the prototype shoes to be closerto the result of this research. In addition, we are planning to de-velop a software that selects motions from the 22 postures andmotions acquired from the evaluation experiments in this paperand that recognizes and records motions.
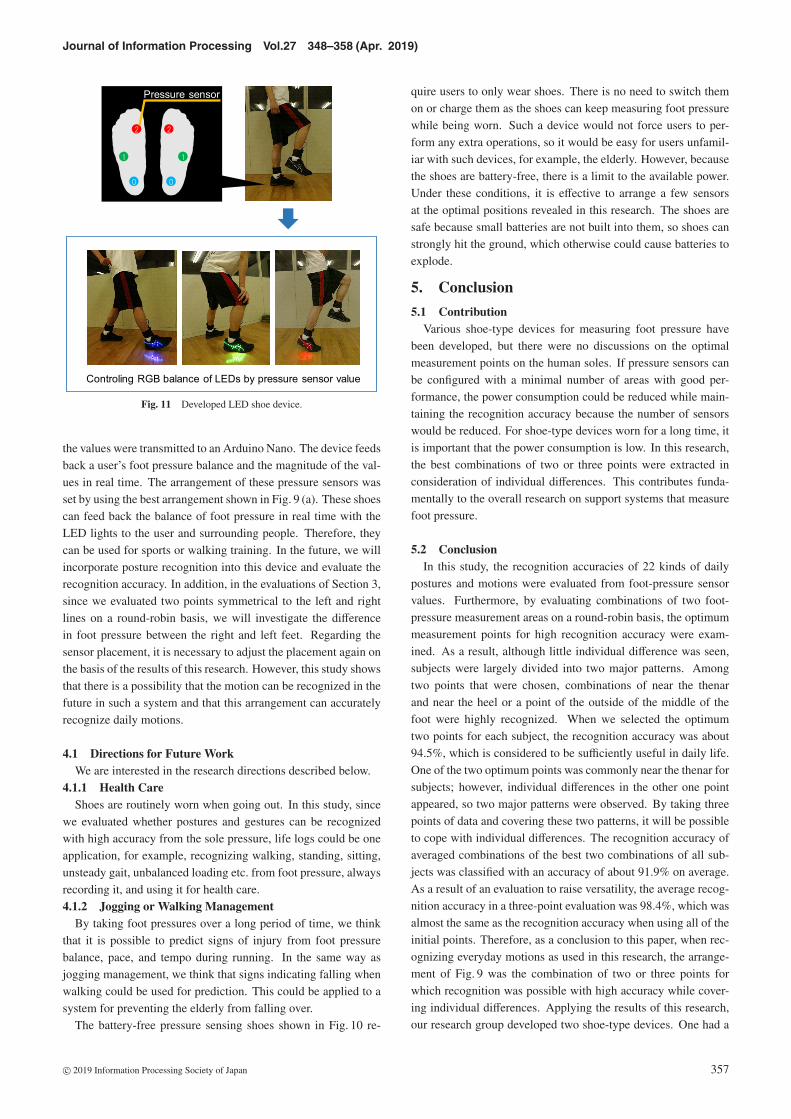
The other device we developed is shown in Fig. 11. Apply-ing the foot pressure analysis of the proposed method, we imple-mented this shoe-type device, which controls the RGB balance ofLEDs according to foot pressure values in real time. The pressuresensors, FSR-402 [19], were arranged at three points on one foot,as shown in Fig. 8. The RGB values of the attached LEDs werecontrolled by using 256 levels from pressure sensor values, and
c© 2019 Information Processing Society of Japan 356
Journal of Information Processing Vol.27 348–358 (Apr. 2019)
Fig. 11 Developed LED shoe device.
the values were transmitted to an Arduino Nano. The device feedsback a user’s foot pressure balance and the magnitude of the val-ues in real time. The arrangement of these pressure sensors wasset by using the best arrangement shown in Fig. 9 (a). These shoescan feed back the balance of foot pressure in real time with theLED lights to the user and surrounding people. Therefore, theycan be used for sports or walking training. In the future, we willincorporate posture recognition into this device and evaluate therecognition accuracy. In addition, in the evaluations of Section 3,since we evaluated two points symmetrical to the left and rightlines on a round-robin basis, we will investigate the differencein foot pressure between the right and left feet. Regarding thesensor placement, it is necessary to adjust the placement again onthe basis of the results of this research. However, this study showsthat there is a possibility that the motion can be recognized in thefuture in such a system and that this arrangement can accuratelyrecognize daily motions.
4.1 Directions for Future WorkWe are interested in the research directions described below.
4.1.1 Health CareShoes are routinely worn when going out. In this study, since
we evaluated whether postures and gestures can be recognizedwith high accuracy from the sole pressure, life logs could be oneapplication, for example, recognizing walking, standing, sitting,unsteady gait, unbalanced loading etc. from foot pressure, alwaysrecording it, and using it for health care.4.1.2 Jogging or Walking Management
By taking foot pressures over a long period of time, we thinkthat it is possible to predict signs of injury from foot pressurebalance, pace, and tempo during running. In the same way asjogging management, we think that signs indicating falling whenwalking could be used for prediction. This could be applied to asystem for preventing the elderly from falling over.
The battery-free pressure sensing shoes shown in Fig. 10 re-
quire users to only wear shoes. There is no need to switch themon or charge them as the shoes can keep measuring foot pressurewhile being worn. Such a device would not force users to per-form any extra operations, so it would be easy for users unfamil-iar with such devices, for example, the elderly. However, becausethe shoes are battery-free, there is a limit to the available power.Under these conditions, it is effective to arrange a few sensorsat the optimal positions revealed in this research. The shoes aresafe because small batteries are not built into them, so shoes canstrongly hit the ground, which otherwise could cause batteries toexplode.
5. Conclusion
5.1 ContributionVarious shoe-type devices for measuring foot pressure have
been developed, but there were no discussions on the optimalmeasurement points on the human soles. If pressure sensors canbe configured with a minimal number of areas with good per-formance, the power consumption could be reduced while main-taining the recognition accuracy because the number of sensorswould be reduced. For shoe-type devices worn for a long time, itis important that the power consumption is low. In this research,the best combinations of two or three points were extracted inconsideration of individual differences. This contributes funda-mentally to the overall research on support systems that measurefoot pressure.
5.2 ConclusionIn this study, the recognition accuracies of 22 kinds of daily
postures and motions were evaluated from foot-pressure sensorvalues. Furthermore, by evaluating combinations of two foot-pressure measurement areas on a round-robin basis, the optimummeasurement points for high recognition accuracy were exam-ined. As a result, although little individual difference was seen,subjects were largely divided into two major patterns. Amongtwo points that were chosen, combinations of near the thenarand near the heel or a point of the outside of the middle of thefoot were highly recognized. When we selected the optimumtwo points for each subject, the recognition accuracy was about94.5%, which is considered to be sufficiently useful in daily life.One of the two optimum points was commonly near the thenar forsubjects; however, individual differences in the other one pointappeared, so two major patterns were observed. By taking threepoints of data and covering these two patterns, it will be possibleto cope with individual differences. The recognition accuracy ofaveraged combinations of the best two combinations of all sub-jects was classified with an accuracy of about 91.9% on average.As a result of an evaluation to raise versatility, the average recog-nition accuracy in a three-point evaluation was 98.4%, which wasalmost the same as the recognition accuracy when using all of theinitial points. Therefore, as a conclusion to this paper, when rec-ognizing everyday motions as used in this research, the arrange-ment of Fig. 9 was the combination of two or three points forwhich recognition was possible with high accuracy while cover-ing individual differences. Applying the results of this research,our research group developed two shoe-type devices. One had a
c© 2019 Information Processing Society of Japan 357

Journal of Information Processing Vol.27 348–358 (Apr. 2019)
piezoelectric power generation module; thus, it was battery-free.The other controls the RGB balance of LEDs by using foot pres-sure values in real time. In future work, we plan to develop asoftware that selects motions from the 22 postures and gesturesacquired from the evaluation experiments in this paper and thatrecognizes and records motions.
Acknowledgments This research was supported in part bythe Japan Science and Technology Agency, A-STEP.
References
[1] Zhou, B., Singh, M., Doda, S., Yildirim, M., Cheng, J. and Lukowicz,P.: The Carpet Knows: Identifying People in a Smart Environmentfrom a Single Step, Proc. 1st International Workshop on PervasiveSmart Living Spaces 2017 (PerLS2017), pp.527–532 (Mar. 2017).
[2] Sousa, M., Techmer, A., Steinhage, A., Lauterbach, C. and Lukowicz,P.: Human Tracking and Identification Using a Sensitive Floor andWearable Accelerometers, Proc. 2013 IEEE International Conferenceon Pervasive Computing and Communications (PerCom), pp.166–171(Mar. 2013).
[3] Starner, T., Auxier, J., Ashbrook, D. and Gandy, M.: The GesturePendant: A Self-illuminating, Wearable, Infrared Computer VisionSystem for Home Automation Control and Medical Monitoring, Proc.4th International Symposium on Wearable Computers (ISWC2000),pp.87–94 (Oct. 2000).
[4] Tsubaki, K., Terada, T. and Tsukamoto, M.: An Activity Recogni-tion Method by Measuring Circumference of Body Parts, Proc. 7thAugmented Human International Conference (AH2016), pp.13:1–13:7(Feb. 2016).
[5] Murao, K., Terada, T., Yano, A. and Matsukura, R.; Evaluating Sen-sor Placement and Gesture Selection for Mobile Devices, Journal ofHuman Interface Society, Vol.15, No.3, pp.281–292 (Aug. 2013).
[6] Watanabe, H., Terada, T. and Tsukamoto, M.: Ultrasound-basedMovement Sensing, Gesture-, and Context-recognition, Proc. 17th In-ternational Symposium on Wearable Computers (ISWC2013), pp.57–64 (Sep. 2013).
[7] Microsoft: Kinect for Windows, available from 〈https://developer.microsoft.com/ja-jp/windows/kinect〉 (accessed 2017-10-20).
[8] Eskofier, B.M., Lee, S.I., Baron, M., Simon, A., Martindale, C.F.,Gaßner, H. and Klucken, J.: An Overview of Smart Shoes in the In-ternet of Health Things: Gait and Mobility Assessment in Health Pro-motion and Disease Monitoring, Journal of Applied Sciences, Vol.7,No.10, 986 (Sep. 2017).
[9] Fukahori, K., Sakamoto, D. and Igarashi, T.: Exploring Subtle FootPlantar-based Gestures with Sock-placed Pressure Sensors, Proc. 33rdAnnual ACM Conference on Human Factors in Computing Systems(CHI ’15), pp.3019–3028 (2015).
[10] Hayama, K. and Fukuda, H.: Estimation of Center of Pressure Trajec-tory Using an Insole-type Force Sensor, Trans. Japanese Society forMedical and Biological Engineering, Vol.54, No.1, pp.15–21 (2016).
[11] Zhou, B., Wirth, M., Martindale, C., Koerger, H., Zwick, C., Cruz, H.,Eskofier, B. and Lukowicz, P.: Smart Soccer Shoe: Monitoring Foot-ball Interaction with Shoe Integrated Textile Pressure Sensor Matrix,Proc. 2016 ACM International Symposium on Wearable Computers(ISWC2016), pp.64–71 (Sep. 2016).
[12] Talavera, G., Garcia, J., Rosevall, J., Rusu, C., Carenas, C., Breuil,F., Reixach, E., Arndt, H., Burkard, S., Harte, R., Glynn, L. andCarrabina, J.: Fully-wireless Sensor Insole as Non-invasive Tool forCollecting Gait Data and Analyzing Fall Risk, Proc. Ambient Intelli-gence for Health (AmIHealth2015), pp.64–71 (Sep. 2016).
[13] Gonzalez, I., Fontecha, J., Hervas, R. and Bravo, J.: An AmbulatorySystem for Gait Monitoring Based on Wireless Sensorized Insoles,Journal of Sensors, Vol.15, pp.16589–16613 (2015).
[14] Moufawad El Achkar, C., Lenoble-Hoskovec, C., Paraschiv-Ionescu,A., Major, K., Bula, C. and Aminian, K.: Physical Behavior in OlderPersons during Daily Life: Insights from Instrumented Shoes, Journalof Sensors, Vol.16, No.8, pp.1225–1243 (Aug. 2016).
[15] Sazonov, E., Hegde, N., Browning, R.C., Melanson, E.L. andSazonova, N.A.: Posture and Activity Recognition and Energy Ex-penditure Estimation in a Wearable Platform, IEEE J. Biomedical andHealth Informatics, Vol.19, No.4, pp.1339–1346 (July 2015).
[16] Hegde, N., Bries, M., Swibas, T., Melanson, E. and Sazonov, E.: Auto-matic Recognition of Activities of Daily Living Utilizing Insole Basedand Wrist Worn Wearable Sensors, IEEE J. Biomedical and Health In-formatics, Vol.22, No.4, pp.979–988 (July 2018).
[17] medilogic: medilogic Foot Pressure Measurement System, avail-able from 〈http://medilogic.com/en/medilogic-wlan-insole/〉 (accessed2017-12-20).
[18] Bao, L. and Intille, S.: Activity Recognition from User-annotated Ac-celeration Data, International Conference on Pervasive Computing,pp.1–17 (2004).
[19] Interlink Electronics: FSR 402, available from 〈http://www.interlinkelectronics.com/FSR/402.php〉 (accessed 2017-12-20).
[20] Weka: available from 〈http://www.cs.waikato.ac.nz/ml/weka/〉(accessed 2017-12-20).
[21] Garmin Ltd.: ForeAthlete 935, available from 〈https://www.garmin.co.jp/products/intosports/foreathlete-935-black/〉 (accessed 2018-11-20).
[22] Sony Mobile Communications Inc.: Lifelog, available from〈https://www.sonymobile.co.jp/myxperia/app/lifelog/〉(accessed 2018-11-20).
Ayumi Ohnishi received B.Eng. degreefrom Kobe University in 2014 and M.Env.degree from The University of Tokyo in2016. She is currently an Ph.D. studentat Graduate School of Engineering, KobeUniversity. Her research interest is wear-able computing and ubiquitous comput-ing. She is a student member of the IPSJ.
Tsutomu Terada is a Professor at Grad-uate School of Engineering, Kobe Uni-versity. He received B.Eng., M.Eng. andPh.D. degrees from Osaka University in1997, 1999, and 2003, respectively. Dr.Terada is currently working on wearablecomputing, ubiquitous computing, enter-tainment computing technologies. He is a
member of ACM and IEEE.
Masahiko Tsukamoto is a Professor atGraduate School of Engineering, KobeUniversity. He received B.Eng., M.Eng.and Ph.D. degrees from Kyoto Universityin 1987, 1989, and 1994, respectively. Heis currently investigating wearable com-puting and ubiquitous computing. He is amember of eight learned societies, includ-
ing ACM and IEEE.
c© 2019 Information Processing Society of Japan 358