A Meta-Stable Liquid Precursor Phase of Calcium Carbonate ... · NMR pulse sequence used to acquire...
10
CREATED USING THE RSC REPORT TEMPLATE (VER. 3.1) - SEE WWW.RSC.ORG/ELECTRONICFILES FOR DETAILS [journal], [year], [vol], 00–00 | 1 This journal is © The Royal Society of Chemistry [year] A Meta-Stable Liquid Precursor Phase of Calcium Carbonate and its Interactions with Polyaspartate Mark A. Bewernitz, 1 Denis Gebauer, 2 Joanna Long, 3 Helmut Cölfen, 4 and Laurie B. Gower 5,* 5 DOI: 10.1039/b000000x [DO NOT ALTER/DELETE THIS TEXT] 1. Department of Biomedical Engineering, University of Florida, Gainesville, FL, USA 2. Department of Chemistry, Physical Chemistry, University of Konstanz, Universitätsstrasse 10, Box 714, D-78457 Konstanz, Germany; Fax: 49 7531 883139; 10 Tel: 49 7531 882169; E-mail: [email protected] z 3. Department of Biochemistry and Molecular Biology, University of Florida, Gainesville, FL, USA 4. University of Konstanz, Department of Chemistry, Physical Chemistry,Universitätsstrasse 10, D-78457 Konstanz, Germany. Fax: 49 7531 883139; 15 Tel: 49 7531 884063; E-mail: [email protected] 5. Department of Materials Science and Engineering, University of Florida, Gainesville, FL, 32611-6400 USA; Tel: 1-846-3336; E-mail: [email protected] Supplement: 20 Fig. S.1. NMR pulse sequence used to acquire the 13 C diffusion data. It is a modified version of stegs1s, which is Bruker’s sequence. We used 16 equidistant varying z-gradient (Gz) strengths (2% - 95%) to generate the data. The relevant variables used for our acquisition are: Dwell time: 100 μs Gz (100%) = 50 g/cm 25 Recovery time (Tr) = 25 s Diffusion time (∆) = 1.6 s Gradient time (δ) = 1 ms Z-spoil = -17.13% Z-spoil gradient time (d31) = 1.1 ms 30 Acquisition time (AQ) = 4.9 s Electronic Supplementary Material (ESI) for Faraday Discussions This journal is © The Royal Society of Chemistry 2012
-
Upload
hoangquynh -
Category
Documents
-
view
218 -
download
0
Transcript of A Meta-Stable Liquid Precursor Phase of Calcium Carbonate ... · NMR pulse sequence used to acquire...

CREATED USING THE RSC REPORT TEMPLATE (VER. 3.1) - SEE WWW.RSC.ORG/ELECTRONICFILES FOR DETAILS
[journal], [year], [vol], 00–00 | 1
This journal is © The Royal Society of Chemistry [year]
A Meta-Stable Liquid Precursor Phase of
Calcium Carbonate and its Interactions with
Polyaspartate
Mark A. Bewernitz,1 Denis Gebauer,
2 Joanna Long,
3 Helmut
Cölfen,4 and Laurie B. Gower
5,* 5
DOI: 10.1039/b000000x [DO NOT ALTER/DELETE THIS TEXT]
1. Department of Biomedical Engineering, University of Florida, Gainesville, FL, USA
2. Department of Chemistry, Physical Chemistry, University of Konstanz,
Universitätsstrasse 10, Box 714, D-78457 Konstanz, Germany; Fax: 49 7531 883139; 10
Tel: 49 7531 882169; E-mail: [email protected]
3. Department of Biochemistry and Molecular Biology, University of Florida, Gainesville,
FL, USA
4. University of Konstanz, Department of Chemistry, Physical
Chemistry,Universitätsstrasse 10, D-78457 Konstanz, Germany. Fax: 49 7531 883139; 15
Tel: 49 7531 884063; E-mail: [email protected]
5. Department of Materials Science and Engineering, University of Florida, Gainesville,
FL, 32611-6400 USA; Tel: 1-846-3336; E-mail: [email protected]
Supplement:
20
Fig. S.1. NMR pulse sequence used to acquire the 13C diffusion data. It is a modified version of stegs1s, which is Bruker’s sequence. We used 16 equidistant varying z-gradient (Gz) strengths (2%
- 95%) to generate the data. The relevant variables used for our acquisition are:
Dwell time: 100 μs
Gz (100%) = 50 g/cm 25
Recovery time (Tr) = 25 s
Diffusion time (∆) = 1.6 s
Gradient time (δ) = 1 ms
Z-spoil = -17.13%
Z-spoil gradient time (d31) = 1.1 ms 30
Acquisition time (AQ) = 4.9 s
Electronic Supplementary Material (ESI) for Faraday DiscussionsThis journal is © The Royal Society of Chemistry 2012

CREATED USING THE RSC REPORT TEMPLATE (VER. 3.1) - SEE WWW.RSC.ORG/ELECTRONICFILES FOR DETAILS
2 | [journal], [year], [vol], 00–00
This journal is © The Royal Society of Chemistry [year]
Fig. S.2. A comparison between the same titrations conducted with injection nozzle (micropipette tip) in the solution (as conducted in this paper) vs. with the nozzle just above the solution. We still
see the same qualitative character to both curves. The nozzle-out method (blue, diamonds) kinetically binds more Ca2+ under the less ideal mixing conditions than the nozzle-in method (red, 5
squares). Even with the presence of some kinetic binding effects, the qualitative character of the curve is maintained, including a close agreement of bound Ca2+ at which the phase transition
occurs, and at which solid nucleation occurs. Since the nozzle is out of the solution and the qualitative character of the profile is maintained, the behavior of the profile is not due to
nucleation at the nozzle tip and therefore can be discussed in a qualitative fashion. 10
15
20
Electronic Supplementary Material (ESI) for Faraday DiscussionsThis journal is © The Royal Society of Chemistry 2012

CREATED USING THE RSC REPORT TEMPLATE (VER. 3.1) - SEE WWW.RSC.ORG/ELECTRONICFILES FOR DETAILS
[journal], [year], [vol], 00–00 | 3
This journal is © The Royal Society of Chemistry [year]
First Emergent Phase Experiment, 6mM CaCl2 into 20 mM bicarbonate buffer, 10th injection.wmv
Second Emergent Phase Experiment, 6mM CaCl2 into 20 mM bicarbonate buffer, 10th injection.wmv Fig. S.3. Raw Nanoparticle Tracking Analysis (NTA) video data collected of the suspected
metastable emergent phase at the 10th injection of 6 mM CaCl2 into 20 mM bicarbonate buffer, pH 5
8.5 for two separate experiments. The phase is plainly visible but very sparse on the order of hundreds of picomolar in droplet counts. The images shown in in Figure 5 of the main paper were
taken from the second emergent phase experiment. To view, click on the description.
10
15
20
Electronic Supplementary Material (ESI) for Faraday DiscussionsThis journal is © The Royal Society of Chemistry 2012

CREATED USING THE RSC REPORT TEMPLATE (VER. 3.1) - SEE WWW.RSC.ORG/ELECTRONICFILES FOR DETAILS
4 | [journal], [year], [vol], 00–00
This journal is © The Royal Society of Chemistry [year]
Fig. S.4. An example of our modeling technique. Raw data of an attenuating signal was collected (upper left). Gaussian distributions were used to model the bulging asymmetry observed in the
NMR spectra due to the fact that there is exchange between the carbonate and bicarbonate 5
species in solution (bottom left). The overlapping Gaussian model was then subtracted from the raw data to yield a residual (right). The residual suggests that some of the signal at the “foot” of the raw data peaks were not modeled. This is consistent with the raw data peaks having some
Lorenzian character that a Gaussian would clip at the edges. The edge data is not as important as the overlap and exchange between the two phases present and therefore was not modeled. Once 10
overlapping Gaussian distributions are modeled representing each of the phases, they can be used to solve for the T2 relaxation of each phase. A similar technique was used to deconvolute the
Pulse-Field Gradient Stimulated Echo (PFG-STE) data and determine its attenuation for a diffusion measurement of the two phases.
15
20
25
Electronic Supplementary Material (ESI) for Faraday DiscussionsThis journal is © The Royal Society of Chemistry 2012

CREATED USING THE RSC REPORT TEMPLATE (VER. 3.1) - SEE WWW.RSC.ORG/ELECTRONICFILES FOR DETAILS
[journal], [year], [vol], 00–00 | 5
This journal is © The Royal Society of Chemistry [year]
Fig. S.5. The τ-induced attenuation of the 13C peak during the Carr- Purcell Meiboom-Gill (CPMG) T2 relaxation experiment of the bicarbonate peak of the 20 mM, pH 8.5, bicarbonate control solution
titrated with injections of nanopure water. Using the attenuation of the intensity of this one-phase system and the known values of the increasing τ used in the looped pulse sequence, the T2 5
relaxation of the 13C (carbonates/bicarbonates) in this phase can be determined by using equation 1 (shown in the main paper).
10
15
20
25
Electronic Supplementary Material (ESI) for Faraday DiscussionsThis journal is © The Royal Society of Chemistry 2012

CREATED USING THE RSC REPORT TEMPLATE (VER. 3.1) - SEE WWW.RSC.ORG/ELECTRONICFILES FOR DETAILS
6 | [journal], [year], [vol], 00–00
This journal is © The Royal Society of Chemistry [year]
Fig. S.6. The real data and the modeling of the 13C diffusion during the 17th injection without
polyaspartic acid additive. Only slices 3, 6, 9, 12, and 15 are shown for clarity. Left) The raw data of the 3rd slice of the widened 13C NMR peak after the first-order phase transition modeled with three Gaussian peaks. A single large peak (center model) with similar width as the buffer and 7th 5
injection system is not sufficient to model the morphology of the spectral peak. Additional peaks (upfield, downfield) were modeled to account for the morphology. Upper right) The real
attenuation data for the system during a diffusion NMR experiment. Bottom right) the sum of the Gaussian modeling of the attenuation using the 3 Gaussian peaks. Due to the asymmetric
attenuation, and the inability to model the system with a singular Gaussian distribution, there is 10
justification for use of the additional Gaussian peaks and additional information about the properties of the upfield widening (bicarbonate direction) can be obtained. In the case of the submitted publication, we found that the upfield widening diffused slower than the other two
Gaussian models, suggesting the presence of a distinct phase.
15
20
Electronic Supplementary Material (ESI) for Faraday DiscussionsThis journal is © The Royal Society of Chemistry 2012

CREATED USING THE RSC REPORT TEMPLATE (VER. 3.1) - SEE WWW.RSC.ORG/ELECTRONICFILES FOR DETAILS
[journal], [year], [vol], 00–00 | 7
This journal is © The Royal Society of Chemistry [year]
Fig. S.7. The τ-induced attenuation of the 13C peak during the Carr- Purcell Meiboom-Gill (CPMG) T2 relaxation experiment of the bicarbonate peak of the 20 g/ml , M.W. 14,000 g/mol Pasp control
solution titrated with 30.15 mM bicarbonate buffer, pH 8.5. Using the attenuation of the intensity of this one-phase system and the known values of τ used in the looped pulse sequence, the T2 5
relaxation can of the 13C (carbonates/bicarbonates) in this phase can be determined by using equation 1 (shown in the main paper).
10
15
20
25
Electronic Supplementary Material (ESI) for Faraday DiscussionsThis journal is © The Royal Society of Chemistry 2012

CREATED USING THE RSC REPORT TEMPLATE (VER. 3.1) - SEE WWW.RSC.ORG/ELECTRONICFILES FOR DETAILS
8 | [journal], [year], [vol], 00–00
This journal is © The Royal Society of Chemistry [year]
Fig. S.8. The gradient-induced attenuation during the Pulse-Field Gradient Stimulated-Echo (PFG-STE) T2 relaxation experiment of the bicarbonate peak of the 20 g/ml polyaspartic acid sodium
salt (M.W. 14,000 g/mol) control solution titrated with 300 mM bicarbonate buffer, pH 8.5, yielding a final concentration of 18 g/ml pasp and 30.15 mM bicarbonate. Using the attenuation 5
of the intensity of this one-phase system and the known increases in gradient strength for each experimental slice, the self-diffusion of the 13C (and therefore the carbonates/bicarbonates) in this
phase can be determined by using equation 2 (shown in the main paper).
10
15
20
25
Electronic Supplementary Material (ESI) for Faraday DiscussionsThis journal is © The Royal Society of Chemistry 2012

CREATED USING THE RSC REPORT TEMPLATE (VER. 3.1) - SEE WWW.RSC.ORG/ELECTRONICFILES FOR DETAILS
[journal], [year], [vol], 00–00 | 9
This journal is © The Royal Society of Chemistry [year]
Fig. S.9. The τ-induced attenuation of the 13C peak during the Carr- Purcell Meiboom-Gill (CPMG) T2
relaxation experiment of the bicarbonate peak of the 10 mM CaCl2, 20 μg/ml polyaspartic acid sodium salt (M.W. 14000 g/mol) solution titrated with 17 injections of 300 mM bicarbonate buffer, pH 8.5. The final concentration of the resulting solution is 9 mM CaCl2, 18 g/ml pasp, 30.15 mM 5
bicarbonate buffer, pH 8.5. An additional phase emerges (PILP phase). Using the observed attenuation of the intensities of both phases due to known increases in τ used in the looped pulse
sequence, the T2 relaxation of the 13C (carbonates/bicarbonates) in both distinct phases can be determined by using equation 1 (shown in the main paper).
10
15
20
25
Electronic Supplementary Material (ESI) for Faraday DiscussionsThis journal is © The Royal Society of Chemistry 2012
CREATED USING THE RSC REPORT TEMPLATE (VER. 3.1) - SEE WWW.RSC.ORG/ELECTRONICFILES FOR DETAILS
10 | [journal], [year], [vol], 00–00
This journal is © The Royal Society of Chemistry [year]
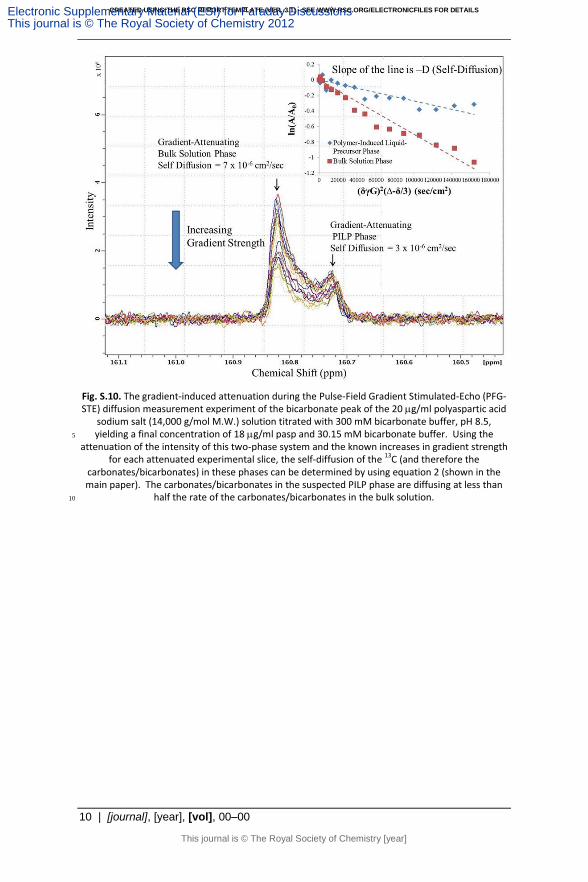
Fig. S.10. The gradient-induced attenuation during the Pulse-Field Gradient Stimulated-Echo (PFG-STE) diffusion measurement experiment of the bicarbonate peak of the 20 g/ml polyaspartic acid
sodium salt (14,000 g/mol M.W.) solution titrated with 300 mM bicarbonate buffer, pH 8.5, yielding a final concentration of 18 g/ml pasp and 30.15 mM bicarbonate buffer. Using the 5
attenuation of the intensity of this two-phase system and the known increases in gradient strength for each attenuated experimental slice, the self-diffusion of the 13C (and therefore the
carbonates/bicarbonates) in these phases can be determined by using equation 2 (shown in the main paper). The carbonates/bicarbonates in the suspected PILP phase are diffusing at less than
half the rate of the carbonates/bicarbonates in the bulk solution. 10
Electronic Supplementary Material (ESI) for Faraday DiscussionsThis journal is © The Royal Society of Chemistry 2012