A mergermArket report on globAl m&A Activity Monthly M&A ...
37
MONTHLY M&A INSIDER A MERGERMARKET REPORT ON GLOBAL M&A ACTIVITY NOVEMBER 2011
Transcript of A mergermArket report on globAl m&A Activity Monthly M&A ...

Monthly M&A InsIderA mergermArket report on globAl m&A Activity
november 2011

Monthly M&A InsIdermergermarket
GlobAl overvIew 01
AmericAs: lAtin AmericA 06
north AmericA 11
AsiA-pAcific 16
europe 21
middle eAst & AfricA 27
About MerrIll corporAtIon 32
80 strandlondon, Wc2r 0rlunited kingdom
t: +44 (0)20 7059 6100f: +44 (0)20 7059 [email protected]
11 West 19th street 2nd fl.new york, ny 10011usA
t: +1 212 686-5606f: +1 212 [email protected]
suite 2401-3grand millennium plaza181 Queen’s road, centralhong kong
t: +852 2158 9700f: +852 2158 [email protected]
www.mergermarket.comPart of the mergermarket group
CONTENTS

Monthly M&A Insider
globAl overvieW
01
The bar has been raised for M&A rationale in Britain after G4S was forced to retreat from a US$8.2bn bid for ISS due to disapproval from investors. What was momentarily a welcome sign of optimism for Europe now serves as a bitter lesson concerning market sentiment. In defence of G4S, gauging the opinions of institutional investors poses dealmakers with a double edged challenge: shareholders are unwilling to be made privy to inside information because this would cause them to have to relinquish their trading privileges under the law, and in times of uncertainty their demand for flexibility goes up.
Another major deal to grind to a halt was the US$7.1bn sale of BP’s majority stake in Argentine oil giant Pan American Energy to Bridas, which is jointly owned by Chinese CNOOC and the Bulgheroni family in Argentina. This deal, which failed to gain regulatory approval in China and Argentina, serves as an unfortunate blight on what was otherwise a knockout month for the Energy, Mining & Utilities sectors, which posted a record US$63bn announced deals, constituting 40% of the global total. If successful, the US$38bn tie-up between Kinder Morgan and El Paso will create America’s largest energy infrastructure owner, and the need to pay down El Paso’s bulging debt by selling off its upstream arm adds another transaction to the pipeline. The US$4.5bn purchase of Brigham by Statoil, and the US$2.8bn acquisition of Daylight Energy demonstrate continued foreign interest in
US and Canadian oil and gas assets. The Brigham deal gives Norwegian Statoil access to US shale reserves, an answer to diminishing margins on its European assets. Sinopec’s investment in Daylight Energy is a good example of continued expansion by Chinese oil firms overseas: the three largest Chinese producers have spent more than US$14bn on acquisitions this year.
Positive news also came from the TMT space where four large-cap deals were announced in October with a combined value of US$10.4bn. EMI, the indebted music group repossessed by Citigroup from Guy Hands’ Terra Firma earlier this year now looks like it could fetch a total of up to US$3.9bn. The tussle to gain control of EMI’s music recording division could have a transformational effect on the balance of power in the music industry. Meanwhile, Sony’s US$1.5bn acquisition of the half of Sony Ericsson that it does not already own is the latest outbound Japanese deal. Under the terms of agreement Sony will gain access to patents crucial for the development of their Smartphone business.
It is a small consolation for the overall gloomy outlook that depressed European stock markets have weakened prey for private equity buyers. With some analysts suggesting valuations are as much as 30% below what they ought to be, the last quarter of 2011 could be a period when some brave investors build the foundations for profits in the medium term.
GlOBAl OvErvIEW
head of research: Elias latsis
editor: Felicity James
For advertising opportunities contact:
erik wickman
tel: + (1) 212 6863329 [email protected]
Global overview: robert Imonikhe
latin America: Jennifer ruiz and Urna Chakraborty
north America: Jason Cozza
Asia-pacific: rus Beasley
europe: Samuel Tedjasukmana and Damien Julliard
Middle east & Africa: Yannis Papacostas and Marie-laure Keyrouz
GlobAl overvIew
THIS HAS BEEN A DISAPPOINTING MONTH FOr DEAl MAKErS; THE US$134.4BN WOrTH OF ANNOUNCED DEAlS IS MOrE THAN A qUArTEr lESS THAN IN OCTOBEr OF lAST YEAr AND JUST 7% HIGHEr THAN FOr THE SAME PErIOD IN 2009. IT SEEMS THAT vOlATIlE MArKETS AND THE ECONOMIC MESS IN THE EUrOzONE HAvE TAKEN THEIr TOll ON M&A AMBITIONS. TO MAKE MATTErS WOrSE, A NUMBEr OF HIGH PrOFIlE DEAlS HAvE COllAPSED WHICH IS lIKElY TO DAMAGE CONFIDENCE GOING FOrWArD. lAST YEAr, THE NUMBEr OF DEAlS rOSE BY MOrE THAN A FIFTH BETWEEN OCTOBEr AND DECEMBEr, BUT WITH CrEDIT MArKETS rEElING AND A DrOP-OFF IN BUSINESS CONFIDENCE, FEW ExPECT TO SEE A rEPEAT OF THIS TrEND IN THE MONTHS TO COME.

Monthly M&A Insider 02
globAl overvieW
TrEND GrAPHS
GlobAl M&A quArterly trend
0
200
400
600
800
1,000
1,200
1,400
Q411*
Q311
Q211
Q111
Q410
Q310
Q210
Q110
Q409
Q309
Q209
Q109
Q408
Q308
Q208
Q108
Q407
Q307
Q207
Q107
Q406
Q306
Q206
Q106
Q405
Q305
Q205
Q105
Valu
e (U
S$bn
)
Total value Mid-market value
Num
ber of deals
0
500
1,000
1,500
2,000
2,500
3,000
3,500
4,000
4,500
Total volume Mid-market volume
0
50
100
150
200
250
300
350
400
Q411*
Q311
Q211
Q111
Q410
Q310
Q210
Q110
Q409
Q309
Q209
Q109
Q408
Q308
Q208
Q108
Q407
Q307
Q207
Q107
Q406
Q306
Q206
Q106
Q405
Q305
Q205
Q105
Valu
e (U
S$bn
)
Buyout value Exit value
Num
ber of deals
Buyout volume Exit volume
0
100
200
300
400
500
600
700
800
900
GlobAl M&A AnnuAl trend GlobAl M&A AnnuAl prIvAte equIty trend
0
500
1,000
1,500
2,000
2,500
3,000
3,500
4,000
YTD 2011*201020092008200720062005
Valu
e (U
S$bn
)
Total value Mid-market value
Num
ber of deals
0
2,000
4,000
6,000
8,000
10,000
12,000
14,000
16,000
18,000
Total volume Mid-market volume
0
100
200
300
400
500
600
700
800
900
YTD 2011*201020092008200720062005
Valu
e (U
S$bn
)
Buyout value Exit value
Num
ber of deals
Buyout volume Exit volume
0
500
1,000
1,500
2,000
2,500
3,000
3,500
GlobAl M&A quArterly prIvAte equIty trend

Monthly M&A Insider 03
globAl overvieW
TrEND GrAPHS
GlobAl M&A sector breAkdown ytd 2011
GlobAl GeoGrAphIc breAkdown ytd 2011
vAlUE
vAlUE
vOlUME
vOlUME
24.8% 4.1%
0.2%
2.2%3.5%2.0%
0.3%
9.2%
1.2%
12.4%
16.8%
15.2%
8.0%
Industrials & Chemicals
TMT
Consumer
Business Services
Energy, Mining & Utilities
Financial Services
Pharma, Medical & Biotech
Construction
Leisure
Transportation
Real Estate
Agriculture
Defence
1.6% 5.3%
44.4%
31.7%
17.0% Asia-Pacific
Europe
North America
Middle East & Africa
Latin America
3.0%3.5%
1.1%1.5%
9.2%
8.7%
0.3%
12.7%13.3%
15.0%
20.0%3.5%
3.5%
Industrials & Chemicals
TMT
Consumer
Business Services
Energy, Mining & Utilities
Financial Services
Pharma, Medical & Biotech
Construction
Leisure
Transportation
Real Estate
Agriculture
Defence
4.8%2.4%
32.2%
41.3%
19.3% Asia-Pacific
Europe
North America
Middle East & Africa
Latin America

Monthly M&A Insider 04
globAl overvieW
TrEND GrAPHS
GlobAl M&A deAl sIze breAkdown
vAlUE vOlUME
0
10
20
30
40
50
60
70
80
90
100
YTD 2011*201020092008200720062005
38.8%
15.5%
22.1%
8.5%
15.1%
42.3%
16.8%
20.8%
7.5%
12.6%
39.8%
16.9%
22.1%
7.9%
12.5%
42.0%
15.3%
19.3%
8.9%
14.5%
40.6%
16.5%
20.5%
7.9%
14.5%
27.2%
21.0%
27.8%
9.3%
14.7%
34.4%
18.2%
24.9%
9.5%
13.1%
<US$250m or undisclosed value
US$251m-US$500m
US$501m-US$2,000m
US$2,001m-US$5,000m
>US$5,001m
Per
cent
age
80
82
84
86
88
90
92
94
96
98
100
YTD 2011*201020092008200720062005
<US$250m or undisclosed value
US$251m-US$500m
US$501m-US$2,000m
US$2,001m-US$5,000m
>US$5,001m
1.0%
4.5%
4.7%
89.2%
1.2%
5.0%
4.7%
88.3%
0.7%
1.3%
5.5%
5.1%
87.4%
0.6%
0.9%
3.9%
4.6%
90.1%
0.5%
1.0%
3.8%
3.9%
90.9%
89.1%
4.5%
4.8%
1.2%
0.4%
1.1%
5.0%
5.1%
88.2%
0.7% 0.6%
Per
cent
age
0.7%

You can be ready for due diligence in a matter of hours with Merrill DataSite. In today’s dynamic market,
you need to be poised and ready to take advantage of fast-moving opportunities. That’s why so many dealmakers
rely on Merrill DataSite to give them an edge. We make it easy to transform a paper data room of thousands – or
millions – of pages into a secure, virtual data room that is accessible around the clock to prospective buyers via
the Internet worldwide.
Best of all, you don’t have to be an expert to get started. Merrill DataSite’s expert project managers are available
24-7 to help you. We’ve helped clients launch thousands of projects for deals
of all sizes – valuable experience that we’ll put to work for you.
At Merrill DataSite, we believe in sharing ideas and best practices that assist
companies in expanding and capturing new opportunities. To download our
FREE industry survey reports please visit the Merrill DataSite Knowledge
Center at www.datasite.com.
datasite.com
M E R R I L L D A T A S I T E
We thought of that.
“We have one week to make
40,000 pagesof informationavailable for due diligence.Where do we start?”

LATIN AM
ERICA
LATIN AMERICAA MERgERMARkET M&A REpoRT oN
Monthly M&A Insider 06
The Telecommunications sector has led in terms of value with US$26.1bn worth of deals in 2011YTD, tallying 11 deals in october. The sector comprises 26.8% of Latin American M&A by value and 2.4% by volume but is surprisingly absent from october’s list of top deals.
This month’s top deal, Bank of Nova Scotia’s US$1bn acquisition of a majority stake in Colombia-based Banco Colpatria Red Multibanca Colpatria SA expands the Canada-based banks presence in South America. In the year to date, Brazil and Chile are the two leading countries by value with US$67.4bn or 69.1% of total market share and US$ 7.9bn or 8.1% respectively.
Deal value down, deal count up
overall, M&A in october this year decreased in value by 81.6% compared to M&A performance last year (US$11.4bn in 2010). Deal volume also decreased by 20.6% from last year (34 deals in 2010). This has led to lower year-to-date aggregate value in 2011 (US$97.6bn), a decrease of 26% from last year’s US$132bn.
Exit deal made top 5 YTD in Latin AmericaDespite less private equity activity in october, the month saw a successful exit for Vision Capital. Having made its investment one year earlier, the firm sold Brazil-based Terphane Holdings, a manufacturer and supplier of polyester films to Tredegar, the US-based company that produces and supplies aperture and elastic materials, for a consideration of US$188m. This transaction is the fourth largest exit in Latin America in 2011 so far. The largest exit of the year remains Intercontinental Exchange’s acquisition of Cetip for US$512m.
LATIN AMERICAN M&A IN oCToBER of 2011 SAw Low VoLUME AND Low VALUE wITH 27 DEALS CoLLECTIVELY VALUED AT oNLY US$2.1BN. So fAR THIS YEAR, THE CoNSUMER SECToR HAS DoMINATED IN TERMS of VoLUME wITH 86 DEALS, TRAILED CLoSELY BY INDUSTRIALS & CHEMICALS wHERE 81 DEALS wERE RECoRDED, THREE of wHICH wERE A pART of oCToBER’S Top DEALS.
07
LATIN AM
ERICA
Monthly M&A Insider
Top 10 LATIN AMERICAN ANNouNCED DEALs of ThE MoNTh (oCT-11)Announced Bidder company Target company Target
dominant sector
seller company Exit multiples (x) Bid premia1-day before
Deal value
(us$m)Revenue EBITDA p/E
20-oct-11 The Bank of Nova Scotia Banco Colpatria Red Multibanca Colpatria SA (51.00% stake)
financial Services
n/a n/a - 1,011
20-oct-11 grupo financiero Banorte SA de CV
Afore XXI SA de CV (50.00% stake)
financial Services
prudential financial Inc n/a n/a - 200
19-oct-11 Iochpe-Maxion SA grupo galaz SA de CV Industrials & Chemicals
- 195
17-oct-11 Tredegar film products Corporation
Terphane Holdings LLC Industrials & Chemicals
Vision Capital partners VII Lp
1.2 - 188
3-oct-11 BRf Brasil foods SA Avex SA (Undisclosed stake), flora Danica SA (undisclosed stake), and flora San Luis SA (undisclosed stake)
Consumer Avex SA and gB Dan SA - 150
24-oct-11 flora produtos De Higiene E Limpeza SA
Hypermarcas SA (Domicile products line)
Consumer Hypermarcas SA - 79
5-oct-11 Arca Continental SAB de CV
petstar SA De CV Industrials & Chemicals
promotora Ambiental SAB de CV
- 60
7-oct-11 galeno Argentina SA Consolidar Aseguradora de Riesgos del Trabajo SA
financial Services
Banco Bilbao Vizcaya Argentaria SA
n/a n/a - 59
24-oct-11 Camera Agroalimentos SA Vanguarda Agro SA (two plants)
Agriculture Vanguarda Agro SA - 33
31-oct-11 Sao Martinho SA Santa Cruz SA - Acucar e Alcool (32.18% stake)
Agriculture - 32
Based on announced deals, including lapsed and withdrawn bids Based on dominant geography of target company being Latin AmericaData correct as of 07-Nov-11
Source: mergermarket
Top DEALS

LATIN AM
ERICA
Monthly M&A Insider
TREND gRApHS
LATIN AMERICAN M&A quARTERLY TREND
0
10
20
30
40
50
60
70
Q411*
Q311
Q211
Q111
Q410
Q310
Q210
Q110
Q409
Q309
Q209
Q109
Q408
Q308
Q208
Q108
Q407
Q307
Q207
Q107
Q406
Q306
Q206
Q106
Q405
Q305
Q205
Q105
Total value Mid-market value
Num
ber of dealsValu
e (U
S$bn
)
0
20
40
60
80
100
120
140
160
180
Total volume Mid-market volume
0
500
1,000
1,500
2,000
2,500
3,000
3,500
4,000
4,500
Q411*
Q311
Q211
Q111
Q410
Q310
Q210
Q110
Q409
Q309
Q209
Q109
Q408
Q308
Q208
Q108
Q407
Q307
Q207
Q107
Q406
Q306
Q206
Q106
Q405
Q305
Q205
Q105
Valu
e (U
S$m
)
Buyout value Exit value
Num
ber of deals
Buyout volume Exit volume
0
2
4
6
8
10
12
14
16
18
LATIN AMERICAN M&A ANNuAL TREND LATIN AMERICAN M&A ANNuAL pRIvATE EquITY TREND
0
20
40
60
80
100
120
140
160
180
YTD 2011*201020092008200720062005
Total value Mid-market value
Num
ber of dealsValu
e (U
S$bn
)
0
100
200
300
400
500
600
Total volume Mid-market volume
0
1000
2000
3000
4000
5000
6000
7000
8000
YTD 2011*201020092008200720062005
Valu
e (U
S$m
)
Buyout value Exit value
Num
ber of deals
Buyout volume Exit volume
0
5
10
15
20
25
30
35
40
45
50
LATIN AMERICAN M&A quARTERLY pRIvATE EquITY TREND
08

LATIN AM
ERICA
Monthly M&A Insider
TREND gRApHS
LATIN AMERICAN M&A gEogRAphIC BREAkDowN YTD 2011
VALUE VoLUME
69.1%
8.1%
5.8%0.1%
0.2%0.2%
0.5%0.02%
0.2%
2.4% 1.5% 4.6%
7.2% Brazil
Chile
Colombia
Dominican Republic
Ecuador
El Salvador
Guatemala
Honduras
Mexico
Panama
Peru
Uruguay
Argentina
0.9%
0.6%
8.4%
7.4%
0.4%
0.6%0.4%
0.2%
1.1%
0.4% 9.7%0.2%
53.9%
6.3%
0.6%
8.7%
Brazil
Chile
Colombia
Costa Rica
Dominican Republic
Ecuador
El Salvador
Guatemala
Honduras
Mexico
Panama
Peru
Uruguay
Venezuela
Argentina
Bolivia
LATIN AMERICAN M&A sECToR BREAkDowN YTD 2011
VALUE VoLUME
26.8%
13.5%
23.3%
0.04%
0.1%
0.2%
3.5%1.4% 11.0%
0.7%
11.0%
0.4%
0.6%
2.0%
5.6%
Consumer
Industrials & Chemicals
Energy, Mining & Utilities
Business Services
Financial Services
Pharma, Medical & Biotech
Agriculture
Technology
Transportation
Construction
Telecommunicatons
Media
Leisure
Real Estate
Defence
18.6%
17.5%5.6%
5.0%
3.9%
3.9%
3.0%
1.9%
2.2%2.4%
1.9% 0.6%
8.2%
13.8%11.4%
Consumer
Industrials & Chemicals
Energy, Mining & Utilities
Business Services
Financial Services
Pharma, Medical & Biotech
Agriculture
Technology
Transportation
Construction
Telecommunicatons
Media
Leisure
Real Estate
Defence
09

10
LATIN AM
ERICA
Monthly M&A Insider
LATIN AMERICAN M&A DEAL sIzE BREAkDowN
VALUE VoLUME
0
10
20
30
40
50
60
70
80
90
100
YTD 2011*201020092008200720062005
<US$250m or undisclosed value
US$251m-US$500m
US$501m-US$2,000m
US$2,001m-US$5,000m
>US$5,001m
17.6%
7.1%
26.9%
21.0%
27.3%
46.9%
8.3%
21.8%
10.3%
12.7%
16.2%
10.8%
31.4%
16.2%
25.4%
30.5%
20.3%
24.5%
10.0%
14.7%
9.2%
29.3%
36.7%
10.1%
14.8%9.5%
6.9%
24.9%
19.2%
39.5%
26.6%
16.8%
31.2%
11.5%
13.9%
Per
cent
age
20
30
40
50
60
70
80
90
100
201020092008200720062005
0.3%
4.4%
7.1%
87.8%
1.0%
5.4%
7.4%
85.1%
0.2%
5.3%
6.4%
87.4%
0.6%
4.7%
5.3%
88.2%
0.3%
6.9%
5.4%
85.6%82.2%
6.3%
8.2%
1.2%0.3% 1.0% 0.7% 1.2% 1.8% 2.0%
6.9%
6.5%
84.9%
0.6%
Per
cent
age
1.1%
<US$250m or undisclosed value
US$251m-US$500m
US$501m-US$2,000m
US$2,001m-US$5,000m
>US$5,001m
YTD 2011*
TREND gRApHS

NORTH
AMERICA
A mergermArket m&A report on
11Monthly M&A Insider
nortH AmerICA
EnErgy dEAls doMInAtE nortH AMErICAn top dEAls for tHE MontH of oCtobEr
For tHe montH oF oCtober, tHe ConsolIdAted energy, mInIng & UtIlItIes seCtor domInAted tHe top deAls In nortH AmerICA. AnnoUnCed on 16 oCtober, kInder morgAn’s bId For el pAso CorporAtIon HAd A totAl deAl vAlUe oF Us$37bn - tHe lArgest deAl In tHe seCtor tHIs yeAr And tHe seCond lArgest overAll In nortH AmerICA And globAlly. tHe trAnsACtIon Is expeCted to reCeIve An extended revIew by tHe FederAl trAde CommIssIon. FtC ConCerns CoUld be resolved tHroUgH dIsposAl oF CertAIn Assets, sAy soUrCes FAmIlIAr wItH tHe trAnsACtIon.
statoil’s acquisition of brigham exploration was the second largest deal of the month with a total deal value of Us$4.5bn, followed by Cigna’s acquisition of Healthspring for Us$3.7bn in the pharma, medical & Utilities sector.
overall M&A transaction values for 2011 indicate economic health may be improvingoverall m&A activity by aggregate deal value has already surpassed overall year-end deal value from last year. In 2010, aggregate deal value reached Us$797.9bn with 4,069 announced deals. 2011 has surpassed this value with an aggregate 3,094 deals worth Us$823.4bn – representing a 3% increase by deal value.
similarly, private equity buyouts are almost ahead of 2010, which saw 748 deals valued at Us$105bn. In the year to date, 2011 has seen 550 buyout transactions worth Us$103.9bn.
ytd north America sector breakdown In the year to date in 2011, energy, mining & Utilities are dominating the deal value sector breakdown with 31% of the market. Industrial & Chemicals represented the second largest sector with 15% of the market share, followed by pharma, medical & biotech with 13% of the market.
by volume, Industrials & Chemicals is the most active sector, representing 17% of north America deals. tmt came next with 15%, followed by business services and pharma, medical & biotech representing 13% and 12%, respectively.

12
NORTH
AMERICA
Monthly M&A Insider
top deAls & expeCted deAls
top 10 nortH AMErICAn AnnounCEd dEAls of tHE MontH (oCt-11) Announced bidder company target company target dominant
sectorseller company Exit multiples (x) bid premia
1-day before
deal value(us$m)revenue EbItdA p/E
16-oct-11 kinder morgan Inc el paso Corporation energy, mining & Utilities
8.1 11.4 25.2 32.3% 37,439
17-oct-11 statoil AsA brigham exploration Company
energy, mining & Utilities
26.7 72.7 96.1 20.2% 4,520
24-oct-11 Cigna Corporation Healthspring Inc pharma, medical & biotech
1.2 10.5 16.2 37.0% 3,734
03-oct-11 Carlyle group and Hellman & Friedman llC
pharmaceutical product development Inc
pharma, medical & biotech
2.3 13.6 31.1 29.6% 3,416
10-oct-11 superior energy services Inc Complete production services Inc
energy, mining & Utilities
2.0 8.3 30.6 62.3% 3,101
17-oct-11 Amerigas partners lp titan energy partners lp and Heritage operating lp
energy, mining & Utilities
energy transfer partners lp
- 2,871
10-oct-11 China petroleum & Chemical Corporation
daylight energy ltd energy, mining & Utilities
5.1 8.1 41.9 121.6% 2,760
11-oct-11 Ares management llC and Canada pension plan Investment board
99 Cents only stores Consumer 1.1 10.6 21.0 7.4% 1,531
19-oct-11 permira genesys telecommunications laboratories Inc
technology Alcatel-lucent 3.0 - 1,500
12-oct-11 pratt & whitney International Aero engines Ag (undisclosed stake)
Industrials & Chemicals
rolls-royce plc - 1,500
based on announced deals, including lapsed and withdrawn bids based on dominant geography of target company being north America (Us + Canada) data correct as of 07-nov-11
source: mergermarket

13
NORTH
AMERICA
Monthly M&A Insider
situation target company sector potential bidder company
financial advisor to bidder (b); target (t); seller (s)
seller company
Market cap/ est.
value (us$m)
Comments
expected deal Interdigital telecommunications google Inc; Apple Inc; Intel Corporation; ericsson Ab; research in motion limited; microsoft Corporation; sony Corporation
barclays (t), evercore partners (t)
2,362 Interdigital Inc, the listed Us based company engaged in the design and development of digital wireless technology solutions, announced on 19-Jul-2011 that its board of directors has initiated a process to explore and evaluate potential strategic alternatives for the company, including a possible sale. Interested parties are said to have included google, Apple, Intel, ericsson, research in motion, microsoft, and sony.
expected deal Jakks pacific Inc Consumer oaktree Capital rothschild (t) 492 on 13-sep-2011, Jakks pacific Inc, the listed Us-based manufacturer of toy products, received a public unsolicited offer from oaktree Capital to buy the target at Us$20 per share. the bidder already owns a 4.99% stake in Jakks. this offer was unanimously rejected by the target's board of directors on 05-oct-2011
expected deal semgroup Corporation
energy, mining & Utilities
plains All American pipeline
1,190 on 24-oct-2011, plains All American pipeline, l.p. made an offer of Us$24 per share for semgroup Corporation, the listed Us based provider of transportation and storage services to the oil and gas sector. plains stated that the offer represented a 16% premium over semgroup's 10-day average closing price through 05-oct-2011. nonetheless, semgroup has rejected the offer as being too low and claimed that the offer actually represented a mere 2% premium over the previous trading day's close.
expected deal AmAg pharmaceuticals Inc
pharma, medical & biotech
msmb Capital mA 286 on 03-Aug-2011, AmAg pharmaceuticals, the listed Us based biopharmaceutical company, received an unsolicited proposal from msmb Capital management to acquire the company at Us$18 per share in cash. AmAg board of directors has unanimously opposed the proposal and urged stockholders to take no action on the offer. one of the reasons why the board of directors might not support the acquisition is that msmb is proposing to remove six of the seven current members of AmAg's board and to replace them with its own nominees.
expected deals based on confirmed announcements by companies involved
pIpElInE of nortH AMErICAn ExpECtEd dEAls
top deAls & expeCted deAls

14
NORTH
AMERICA
Monthly M&A Insider
trend grApHs
nortH AMErICAn M&A quArtErly trEnd
0
100
200
300
400
500
600
Q411*
Q3 11
Q211
Q111
Q410
Q310
Q210
Q110
Q409
Q309
Q209
Q109
Q408
Q308
Q208
Q108
Q407
Q307
Q207
Q107
Q406
Q306
Q206
Q106
Q405
Q305
Q205
Q105
Valu
e (U
S$bn
)
Total value Mid-market value
Num
ber of deals
0
200
400
600
800
1,000
1,200
1,400
1,600
Total volume Mid-market volume
0
50
100
150
200
250
Q411*
Q 11
Q211
Q111
Q410
Q310
Q210
Q110
Q409
Q309
Q209
Q109
Q408
Q308
Q208
Q108
Q407
Q307
Q207
Q107
Q406
Q306
Q206
Q106
Q405
Q305
Q205
Q105
Valu
e (U
S$bn
)
Buyout value Exit value
Num
ber of deals
Buyout volume Exit volume
0
50
100
150
200
250
300
350
nortH AMErICAn M&A AnnuAl trEnd nortH AMErICAn M&A AnnuAl prIvAtE EquIty trEnd
0
200
400
600
800
1,000
1,200
1,400
1,600
YTD 2011*201020092008200720062005
Total value Mid-market value
Num
ber of dealsValu
e (U
S$bn
)
0
1,000
2,000
3,000
4,000
5,000
6,000
Total volume Mid-market volume
0
50
100
150
200
250
300
350
400
450
500
YTD 2011*201020092008200720062005
Valu
e (U
S$bn
)
Buyout value Exit value
Num
ber of deals
Buyout volume Exit volume
0
200
400
600
800
1,000
1,200
nortH AMErICAn M&A quArtErly prIvAtE EquIty trEnd

15
NORTH
AMERICA
Monthly M&A Insider
trend grApHs
nortH AMErICAn M&A sECtor brEAkdown ytd 2011
vAlUe volUme
16.0%
1.0%
2.0%
9.0%3.0%
30.0%
5.0%
13.0%
9.0%
7.0%1.0%4.0%
0.4% 0.1%
Industrials & Chemicals
Technology
Business Services
Pharma, Medical & Biotech
Financial Services
Energy, Mining & Utilities
Consumer
Media
Leisure
Construction
Transportation
Telecommunications
Real Estate
Defence
Agriculture
17.0%
15.0%
13.0%
2.0%2.0%
12.0%
10.0%
3.0%3.0%
9.0%
10.0%
0.1%
1.0%0.4%0.5%
Industrials & Chemicals
Technology
Business Services
Pharma, Medical & Biotech
Financial Services
Energy, Mining & Utilities
Consumer
Media
Leisure
Construction
Transportation
Telecommunications
Real Estate
Defence
Agriculture
nortH AMErICAn M&A dEAl sIzE brEAkdown
vAlUe volUme
0
10
20
30
40
50
60
70
80
90
100
YTD 2011*201020092008200720062005
<US$250m or undisclosed value
US$251m-US$500m
US$501m-US$2,000m
US$2,001m-US$5,000m
>US$5,001m
46.5%
15.8%
18.1%
7.0%
12.6%
52.1%
14.9%
17.1%
6.3%
9.6%
42.9%
19.0%
21.8%
6.6%
9.6%
49.3%
13.8%
17.5%
7.2%
12.2%
58.8%
13.3%
13.2%
5.4%
9.2% 12.5%
9.6%
27.8%
18.0%
32.1%
44.0%
20.0%
18.2%
8.0%
9.8%
Per
cent
age
75
80
85
90
95
100
YTD 2011*201020092008200720062005
0.9%1.3%
4.5%
4.8%
88.5%
1.1%
1.5%
5.4%
5.3%
86.8%
1.1%
1.8%
6.3%
5.3%
85.6%
0.9%
3.7%
4.1%
90.6%
1.0%
3.5%
3.8%
91.0%
87.4%
5.2%
5.7%
1.1%0.9%
1.6%
5.3%
5.9%
86.3%
0.7% 0.7% 0.6%
<US$250m or undisclosed value
US$251m-US$500m
US$501m-US$2,000m
US$2,001m-US$5,000m
>US$5,001m
Per
cent
age

ASIA-PAcIfIc
A mergermArket m&A report on
Monthly M&A Insider 16
ASIA-pAcIfIc
No rest for the Leisure sector many of october’s top deals were domestic, but there were some significant cross-border transactions as well. the two largest deals of the month by value both involved Japanese companies in the Leisure sector. the first saw Heiwa, the Japan-listed casino gaming device manufacturer, purchase pgm Holdings, the Japan-listed golf club operator for US$2.2bn. According to Heiwa, the deal is an effort to transform the company into a full-scale leisure business. In the second, Bain capital, the US-based private equity firm acquired Skylard, the Japan-based restaurant chain operator, from nomura principal finance and npf-Harmony for a total consideration of US$1.7bn. Largely attributable to these two deals, the Leisure sector represented over one third of Asia-pacific deal value, making it the hottest in the region for the month of october.
A solid month in North AsiaIn terms of geography, north Asian countries including china, Japan and South korea showed the strongest m&A activity in the region during october. Japan saw the greatest transaction value over the month, with the bulk largely attributable to the aforementioned Heiwa and Bain acquisitions. But china hosted the largest number of deals, with 19 transactions worth US$1.9bn taking place over the month. most often, bidders for chinese assets targeted energy, consumer, construction and Industrials & chemicals sectors. close behind china in terms of volume was South korea, which saw 18 deals worth US$1.2bn. In a noteworthy transaction worth US$378m, Interpark, a South korea-based online retailer, agreed to acquire imarketkorea, a South korea-based provider of strategic, outsourcing and consulting procurement services. the deal is expected to close in December 2011.
Asian bidders set to do some buying globallygoing forward, Asian bidders could ramp up outbound deal making as opportunities arise in the struggling global economy. for example, korea national oil (knoc), which has invested approximately US$10bn acquiring overseas energy assets since 2009, is eyeing oil assets in kazakhstan in efforts to produce 300,000 barrels a day next year from its oil fields throughout the world. furthermore in the retail sector, Japanese clothing company, fast retailing, could buy a rival its size or bigger in the US or europe. reports indicate the company believes the strength of the Yen and anemic stock markets make it a good time to buy. In the private equity space, proprietary mergermarket intelligence indicates that a Hong kong-based commodities trader and investment firm, is seeking to raise US$100m for a new private equity fund that will invest in junior explorers in Africa, focused on all types of metal and mineral resources. As Asia-pacific rises in relative strength, bidders from the region will continue to take advantage of m&A opportunities abroad.
WHILe tHe ASIA-pAcIfIc regIon WItneSSeD A fLUrrY of LArger DeALS In Q3 2011, Q4 BegAn WItH A SLoW StArt. octoBer DeAL fLoW cAme Up SHort of SeptemBer ActIvItY, WItneSSIng JUSt 100 DeALS vALUeD At A totAL of US$11.4Bn, A 69% DecLIne In vALUe AnD A 29% DecLIne In voLUme, AmIDSt contInUeD gLoBAL mArket tUrBULence. HoWever, gLoBAL mArket concernS ASIDe, ASIA-pAcIfIc DID See Some IntereStIng ActIvItY tHroUgHoUt octoBer.

17Monthly M&A Insider
ASIA-PAcIfIc
top DeALS
Top 10 AsIA-pAcIfIc ANNouNced deALs of The MoNTh (ocT-11)Announced Bidder company Target company Target dominant
sectorseller company exit multiples (x) Bid premia
1-day beforedeal value
(us$m)Revenue eBITdA p/e
26-oct-11 Heiwa corporation pgm Holdings k k Leisure 2.1 15.0 4.0 28.6% 2,190
21-oct-11 Bain capital LLc Skylark co Ltd (77.76% stake) Leisure nomura principal finance co Ltd; and npf Harmony
0.5 - 1,677
11-oct-11 eurasian natural resources corporation plc
Shubarkol komir JSc (75.00% stake)
energy, mining & Utilities
eurasian Industrial company JSc
10.0 - 650
17-oct-11 Super retail group Limited
rebel Sport Limited consumer Archer capital pty Limited
1.0 7.9 - 631
5-oct-11 Aeon co Ltd marunaka co Ltd (94.96% stake)
consumer nakayama family 0.2 1324.1 - 474
24-oct-11 Jizhong energy group co Ltd
north china pharmaceutical company Limited (25.39% stake)
pharma, medical & Biotech
1.6 21.5 71.1 - 468
31-oct-11 Interpark corporation imarketkorea co Ltd (48.7% stake)
Business Services
Samsung group 0.5 20.6 24.1 24.7% 378
14-oct-11 Wuhan Linuo Solar energy group co Ltd
Xiamen Hongfa electroacoustic co Ltd (75.01% stake)
Industrials & chemicals
Jiangxi electronics group; Lianfa group; and Xiamen Hongfa electroacoustic co Ltd (management and employees)
1.3 12.6 - 359
17-oct-11 H'ng Bok San; H'ng chun Hsiang; and H'ng Hsieh Ling (senior management of Leader Universal Holdings Berhad)
Leader Universal Holdings Berhad (85.59% stake)
energy, mining & Utilities
0.5 11.9 9.4 31.2% 355
28-oct-11 Undisclosed bidder evans Shoal gas field (40.00% stake)
energy, mining & Utilities
Santos Ltd - 350
Based on announced deals, including lapsed and withdrawn bids Based on dominant geography of target company being Asia-pacific Data correct as of 07-nov-11
Source: mergermarket

18
ASIA-PAcIfIc
Monthly M&A Insider
trenD grApHS
AsIA-pAcIfIc M&A quARTeRLy TReNd
0
20
40
60
80
100
120
140
160
180
Q411*
Q311
Q211
Q111
Q410
Q310
Q210
Q110
Q409
Q309
Q209
Q109
Q408
Q308
Q208
Q108
Q407
Q307
Q207
Q107
Q406
Q306
Q206
Q106
Q405
Q305
Q205
Q105
Valu
e (U
S$bn
)
Total value Mid-market value
Num
ber of deals
0
100
200
300
400
500
600
700
800
900
Total volume Mid-market volume
0
5
10
15
20
25
Q4 11*
Q3 11
Q211
Q111
Q410
Q310
Q210
Q110
Q409
Q309
Q209
Q109
Q408
Q308
Q208
Q108
Q407
Q307
Q207
Q107
Q 06
Q306
Q206
Q106
Q405
Q305
Q205
Q105
Valu
e (U
S$bn
)
Buyout value Exit value
Num
ber of deals
Buyout volume Exit volume
0
10
20
30
40
50
60
70
80
90
100
AsIA-pAcIfIc M&A ANNuAL TReNd AsIA pAcIfIc M&A ANNuAL pRIvATe equITy TReNd
0
50
100
150
200
250
300
350
400
450
500
YTD 2011*201020092008200720062005
Total value Mid-market value
Num
ber of dealsValu
e (U
S$bn
)
0
500
1,000
1,500
2,000
2,500
3,000
Total volume Mid-market volume
0
10
20
30
40
50
60
70
YTD 2011*201020092008200720062005
Valu
e (U
S$bn
)
Buyout value Exit value
Num
ber of deals
Buyout volume Exit volume
0
50
100
150
200
250
300
350
AsIA-pAcIfIc M&A quARTeRLy pRIvATe equITy TReNd
19
ASIA-PAcIfIc
Monthly M&A Insider
trenD grApHS
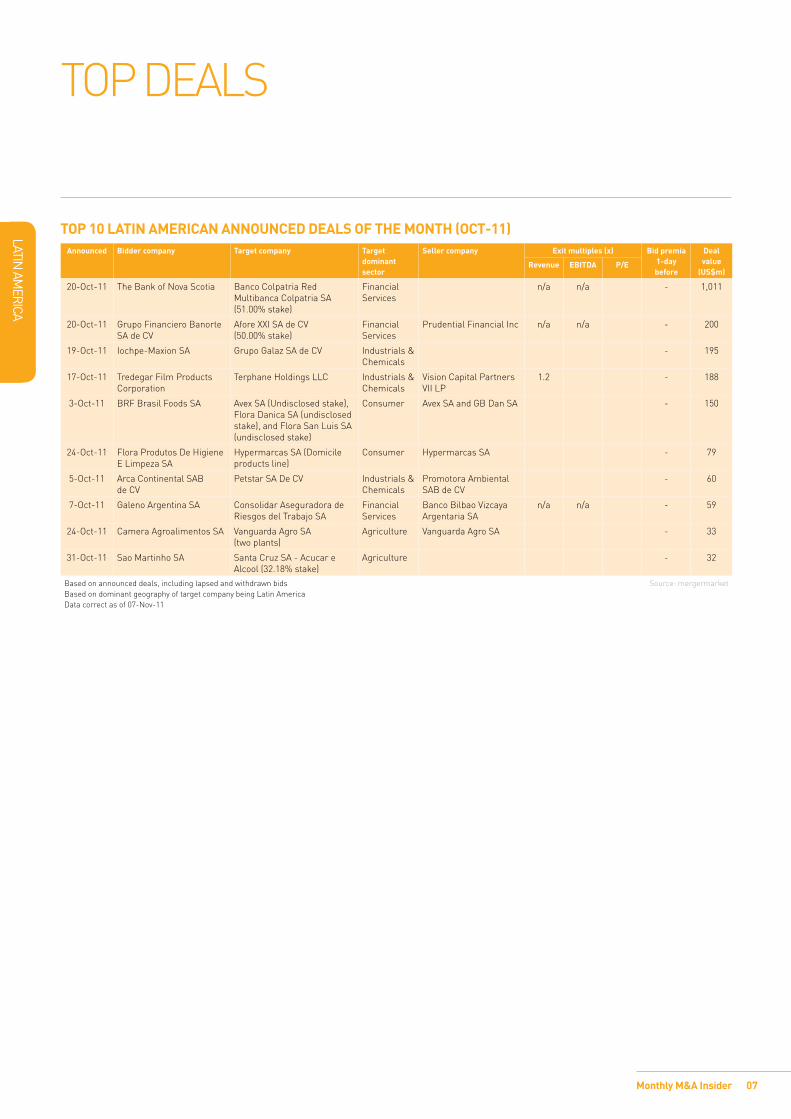
AsIA-pAcIfIc M&A GeoGRAphIc BReAKdoWN yTd 2011
vALUe voLUme
Australia
China
Hong Kong
India
Indonesia
Japan
Malaysia
Singapore
South Korea
Taiwan
Other
20.0%
4.0%2.0%
9.0%
3.0%
17.0%
4.0%
8.0%
2.0%7.0%
24.0%
Australia
China
Hong Kong
India
Indonesia
Japan
Malaysia
Singapore
South Korea
Taiwan
Other
16.0%
4.0%3.0%10.0%
4.0%
14.0%
3.0%
11.0%
2.0%8.0%
25.0%
AsIA-pAcIfIc M&A secToR BReAKdoWN yTd 2011
vALUe voLUme
21.0%
15.0%
3.0%
5.0%
15.0%
16.0%
3.0%
4.0%
3.4%
3.4%
4.0%
1.0%3.3%
4.0%
Industrials & Chemicals
Consumer
Technology
Business Services
Energy, Mining & Utilities
Financial Services
Pharma, Medical & Biotech
Leisure
Construction
Transportation
Real Estate
Media
Agriculture
Telecommunications
20.0%
13.0%
11.0%
10.0%
10.0%
4.0%
4.0%
6.0%
9.0%
4.0%3.8%
2.7%0.05%
1.2%2.6%
Industrials & Chemicals
Consumer
Technology
Business Services
Energy, Mining & Utilities
Financial Services
Pharma, Medical & Biotech
Leisure
Construction
Transportation
Real Estate
Media
Agriculture
Telecommunications
Defence

20
ASIA-PAcIfIc
Monthly M&A Insider
AsIA-pAcIfIc M&A deAL sIze BReAKdoWN
vALUe voLUme
0
10
20
30
40
50
60
70
80
90
100
YTD 2011*201020092008200720062005
<US$250m or undisclosed value
US$251m-US$500m
US$501m-US$2,000m
US$2,001m-US$5,000m
>US$5,001m
23.0%
18.8%
28.6%
9.3%
20.3%
19.0%
22.7%
26.9%
11.0%
20.4%
15.6%
17.1%
30.4%
12.6%
24.4%
29.6%
15.8%
22.13%
12.0%
20.4%
19.9%
17.0%
30.5%
11.1%
21.5% 20.9%
10.4%
27.6%
29.4%
11.6%
21.3%
13.9%
31.8%
12.5%
20.4%
Per
cent
age
75
80
85
90
95
100
YTD 2011*201020092008200720062005
1.0%
5.1%
4.5%
89.0%
1.2%
4.8%
4.9%
88.8%
0.9%
5.1%
5.4%
88.3%
0.9%
4.5%
5.8%
88.4%
1.0%
5.5%
5.3%
87.9% 88.4%
5.0%
4.7%
1.7% 0.8%
5.4%
5.9%
87.5%
0.3% 0.3% 0.2%0.4% 0.4%0.4% 0.4%
<US$250m or undisclosed value
US$251m-US$500m
US$501m-US$2,000m
US$2,001m-US$5,000m
>US$5,001m
Per
cent
age
trenD grApHS

21Monthly M&A Insider
europe
A mergermArket m&A report on
eUrope
Looking more closely at europe, there has been a constant decline in the total value of deals announced on a monthly basis. Since the peak of €59.7bn reached in April, the value continued to slide, with october closing at €27.6bn, the second lowest month of the year behind January (€21.3bn). the biggest one month drop was in June, when european m&A recorded €42.1bn worth of deals, a 25.5% drop from the €57.9bn seen in may.
Conventional wisdom states that deals are scarce during the summer months due to holidays, which is very much reflected in this year’s stats. However, a linear monthly decline since April to September, and october’s confirmation that the decline did not stop at the end of summer, tells us an altogether different story. Is the recovery in european m&A deal making we saw in 2010 losing steam, and now on potentially prolonged bearish territory? As argued in the last edition of this report, 2010 was the year for companies looking for cut-price deals in europe whilst boosted by cash hoarded during the crisis years of 2008 and 2009. that cash seemed to begin to run out by 2011. the record in october, the first month of Q4 2011, again confirmed that.
With an average of 10.6% monthly decline in value since may, assuming the downward trend continues in the two remaining months, european m&A will record €470bn worth of deals in 2011, down 7% from 2010.
Zimbabwean diamonds versus Anglo-American/De Beersthe US, eU and African countries lifted the ban on Zimbabwean diamond exports in early november, after having imposed it in 2009. the decision will significantly boost the global diamond supply because, as suggested by the Financial times, Zimbabwe may hold about a quarter of the world’s current diamond reserves. this poses a threat to De Beers, which currently controls 35% of the diamond market according to the same source, after its cartel virtually monopolised the diamond market over the last century.
Almost immediately, Anglo-American announced the US$5.1bn acquisition of a 40% stake in De Beers held by the oppenheimer family. the acquisition increases Anglo-American’s holding in the diamond company to 85%, effectively consolidating it. It sends a strong message to De Beers’ strongest competitor Alrosa, as well as to competitors, such as rio tinto and petra Diamonds, that Anglo-American means business in the diamond sector. It is ready to beef up De Beers to challenge the ever-increasing competition, especially now that Zimbabwe’s huge diamond reserve is up for grabs. Bids for marange resources and mbada, both diamond producers in Zimbabwe, are therefore expected in the coming weeks and months, especially from De Beers’ big competitors. Anglo-American may also be in a position to buy as well.
EuropEAn M&A on coursE to closE 2011 lowEr thAn 2010
AS oF 31 oCtoBer 2011, eUrope SAW A totAL oF €423.4Bn WortH oF m&A DeALS AnnoUnCeD In 2011, ABoUt €80.7Bn SHort oF tHe €504.1Bn reCorDeD At tHe enD oF 2010. WItH An AverAge oF €42.3Bn WortH oF DeALS AnnoUnCeD per montH In eUrope tHIS yeAr, It DoeS not Seem too UnreALIStIC to At LeASt reACH tHe 2010 FIgUre, AS tHe yeAr StILL HAS tWo montHS to go.

22
europe
Monthly M&A Insider
top DeALS & expeCteD DeALS
top 10 EuropEAn AnnouncED DEAls of thE Month (oct-11) Announced Bidder company target company target dominant
sectorseller company Exit multiples (x) Bid premia
1-day before
Deal value(€m)revenue EBItDA p/E
17-oct-11 g4S plc ISS A/S Industrials & Chemicals
eQt partners AB; andgS Capital partners
0.6 9.0 5,927
10-oct-11 government of Belgium
Dexia Banque Belgique S.A. Financial Services
Dexia SA 5.9 4,000
31-oct-11 China Investment Corporation
gDF Suez exploration & production (30.00% stake)
energy, mining & Utilities
3.5 5.5 2,300
10-oct-11 Banco popular espanol S.A.
Banco pastor S.A. Financial Services
1.1 30.6% 1,349
27-oct-11 Sony Corporation Sony ericsson mobile Communications management Ltd (50.00% stake)
technology ericsson AB 0.3 23.2 1,050
12-oct-11 marubeni Corporation; and teekay Lng partners Lp.
A.p. moeller – maersk (8 Lng carriers)
transportation A.p. moller – maersk A/S 1,048
10-oct-11 precision Capital kBL european private Bankers S.A.
Financial Services
kBC groep nv 14.8 1,000
14-oct-11 Unilever plc oJSC Concern kalina Consumer 2.1 12.9 23.8 57.8% 604
31-oct-11 China Investment Corporation
gDF Suez SA (train 1 of the Atlantic Lng liquefaction plant located in trinidad and tobago) (10.00% stake)
energy, mining & Utilities
gDF Suez SA 600
27-oct-11 Lansforsakringar AB Lansforsakringar Fondliv Financial Services
Lansforsakringar Liv Forsakrings AB
587
Based on announced deals, including lapsed and withdrawn bids Based on dominant geography of target company being europe Data correct as of 07-nov-11
Source: mergermarket
23
europe
Monthly M&A Insider
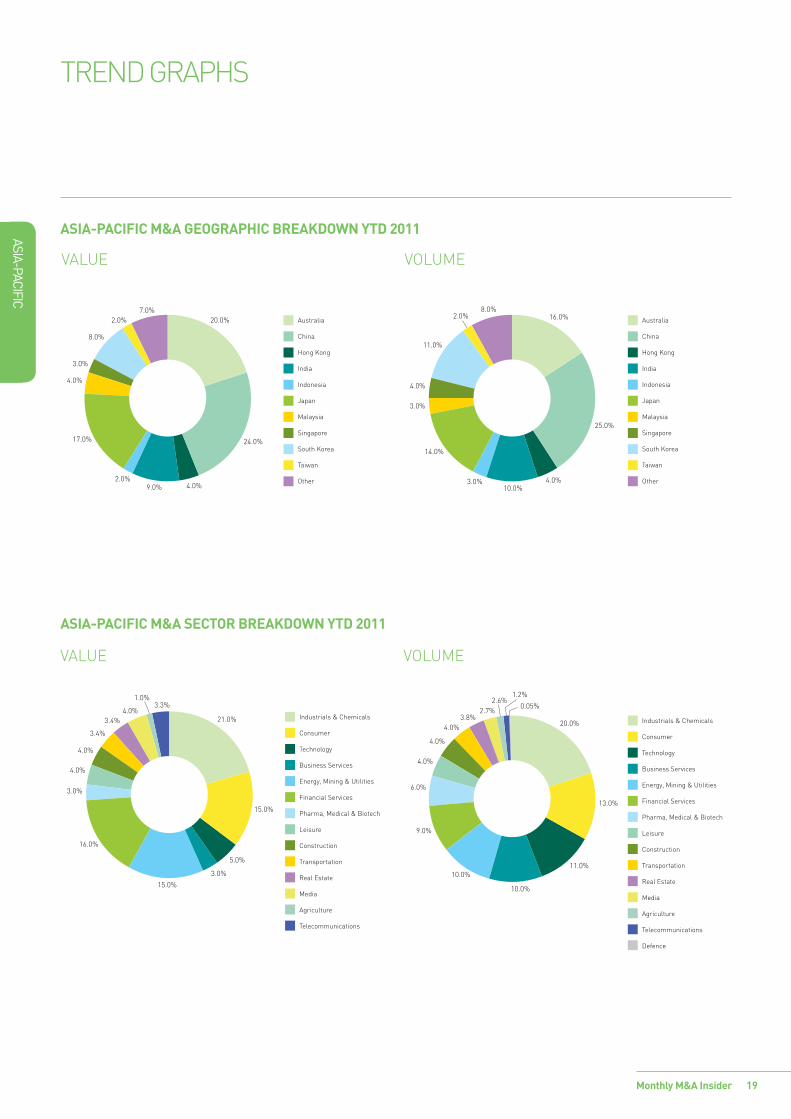
pIpElInE of EuropEAn ExpEctED DEAlssituation target company sector potential bidder
companyfinancial adviser to bidder (B); target (t); seller (s)
seller company Market cap/est.
value (€m)
comments
rumoured takeover
telecom Italia SpA telecommunications vivendi SA 16,200 vivendi [vIv Fr], the listed French media and telecom group, today denied any interest in listed Italian group telecom Italia (tI).
expected deal
orange Switzerland telecommunications Doughty Hanson; providence; eQt; goldman Sachs; and Apax
1,650 Second round bids for France telecom-owned orange Switzerland are due on 12 December, two sources close to the situation said.
potential takeover target
Detskiy mir Consumer AFk Sistema; Sberbank
478 Detskiy mir, a private, russian retailer of children's goods, is interested in approaches from strategic investors, chief financial officer katerina Laryushkina told this news service at the Adam Smith CFo Summit in moscow
potential takeover target
magellan SA pharma, medical & Biotech
enterprise Investors 55 magellan, the listed polish medical sector financing provider, is holding off a decision on a possible management buyout (mBo) and on its planned entry into the Hungarian market, Chief executive officer krzysztof kawalec said
potential takeover target
Ad2one technology France telecom; BSkyB group plc
46 Ad2one, a Uk-based digital sales agency, will look to hire an advisor in Q1 2012 with a view to selling, grant Alloway, joint managing Director said
note: expected deals based on confirmed announcements by companies involved Source: mergermarket
top DeALS & expeCteD DeALS

europe
Monthly M&A Insider 24
trenD grApHS
EuropEAn M&A quArtErly trEnD
0
100
200
300
400
500
Q4 11*
Q311
Q211
Q111
Q410
Q310
Q210
Q110
Q409
Q309
Q209
Q 09
Q408
Q308
Q208
Q108
Q407
Q307
Q207
Q107
Q406
Q306
Q206
Q106
Q405
Q305
Q205
Q105
Valu
e (€
bn)
Total value Mid-market value
Num
ber of deals
0
200
400
600
800
1,000
1,200
1,400
1,600
1,800
2,000
Total volume Mid-market volume
0
10
20
30
40
50
60
70
80
90
100
110
120
Q411*
Q3 11
Q211
Q111
Q410
Q310
Q210
Q110
Q409
Q309
Q209
Q109
Q408
Q308
Q208
Q108
Q407
Q307
Q207
Q107
Q406
Q306
Q206
Q106
Q405
Q305
Q205
Q105
Buyout value Exit value Buyout volume Exit volume
Valu
e (€
bn)
Num
ber of deals
0
50
100
150
200
250
300
350
400
450
EuropEAn M&A AnnuAl trEnD EuropEAn M&A AnnuAl prIvAtE EquIty trEnD
0
200
400
600
800
1,000
1,200
YTD 2011*201020092008200720062005
Total value Mid-market value
Num
ber of deals
Valu
e (€
bn)
0
1,000
2,000
3,000
4,000
5,000
6,000
7,000
8,000
Total volume Mid-market volume
0
50
100
150
200
250
300
YTD 2011*201020092008200720062005
Valu
e (€
bn)
Buyout value Exit value
Num
ber of deals
Buyout volume Exit volume
0
200
400
600
800
1,000
1,200
1,400
1,600
EuropEAn M&A quArtErly prIvAtE EquIty trEnD

europe
Monthly M&A Insider 25
trenD grApHS
EuropEAn M&A GEoGrAphIc BrEAkDown ytD 2011
vALUe voLUme
UK
CEE
Iberia
France
Nordic
Germany
Benelux
Italy
Others
8.0%
5.3%
8.1%
17.6%
15.0%
10.8%
13.2%
11.5%10.5%
11.9%
9.2%
9.1%
5.7%20.0%
11.8%
12.7%
6.2%
13.4%
UK
CEE
Iberia
France
Nordic
Germany
Benelux
Italy
Others
EuropEAn M&A sEctor BrEAkDown ytD 2011
vALUe voLUme
5.7%
18.0%
10.2%
0.2%
16.1%
1.3%
9.1%
1.6%2.0% 2.4%
2.2%
3.4%
22.2%
5.5%
Industrials & Chemicals
Consumer
Business Services
Technology
Energy, Mining & Utilities
Financial Services
Pharma, Medical & Biotech
Construction
Leisure
Media
Transportation
Real Estate
Telecommunications
Agriculture
Defence
0.1% 1.3%
22.1%
1.0%
4.1%
1.3%
4.1%
6.0%
3.7%3.6%
0.2%
15.6%
14.0%7.9%
7.5%
7.5%
Industrials & Chemicals
Consumer
Business Services
Technology
Energy, Mining & Utilities
Financial Services
Pharma, Medical & Biotech
Construction
Leisure
Media
Transportation
Real Estate
Telecommunications
Agriculture
Defence

europe
Monthly M&A Insider 26
trenD grApHS
EuropEAn M&A DEAl sIZE BrEAkDown
vALUe voLUme
0
10
20
30
40
50
60
70
80
90
100
YTD 2011*201020092008200720062005
<€250m or undisclosed value
€251m-€500m
€501m-€2,000m
€2,001m-€5,000m
>€5,001m
15.1%
23.9%
10.1%
17.9%
33.0%
17.7%
23.2%
8.4%
15.7%
35.1%
16.4%
22.4%
8.3%
13.7%
39.2%
14.5%
19.9%
8.8%
16.6%
40.3%
20.3%
23.7%
9.0%
20.3% 17.1%
9.2%
29.8%
20.4%
26.7% 23.5%21.2%
22.0%
29.7%
10.3%
16.8%
Per
cent
age
88
90
92
94
96
98
100
YTD 2011*201020092008200720062005
3.3%
0.7%
3.9%
91.6%
3.8%
0.9%
3.5%
91.4%
4.0%
0.9%
3.9%
90.8%
2.7%
0.6%
3.2%
93.1%
2.0%
0.6%
2.2%
95.0%
93.1%
2.8%
3.3%
0.7% 0.7%
3.4%
3.0%
92.6%
0.5% 0.5% 0.3%0.4% 0.4% 0.2% 0.2%
<€250m or undisclosed value
€251m-€500m
€501m-€2,000m
€2,001m-€5,000m
>€5,001m
Per
cent
age

27
Mid
dle east &
africa
A mergermArket m&A report on
Monthly M&A Insider
Slow Month for MIddle eASt And AfrIcA
the totAl Amount of deAls in the middle eAst And AfricA region Amounted to us$950m for the month of october, representing A 71% decreAse in vAlue compAred to the month of september (us$3.3bn) And A 77% decreAse compAred to the sAme period lAst yeAr. this shows thAt the politicAl uncertAinty in the region hAs An importAnt impAct on m&A Activity And remAins A big chAllenge to growth.
the middle eAst & AfricA
energy, mining & utilities has been the dominant sector by far for ytd 2011, with 33.5% of the total m&A activity in value, accounting for us$10.4bn. this is mainly due to the large deals that occurred in this sector, including the acquisition of south Africa based multi-commodity mining company metorex ltd by Jinchuan group international resources co. ltd for us$1.4bn and tronix inc’s us$1.3bn purchase of namakwa. industrials & chemicals came in second position with a total of us$6.3bn worth of deals and 20.6% of the total deal value, when in 2010 the sector had only 4.8% of the total m&A activity in value.
with some countries in the region still suffering from political unrest, south Africa was the most popular target for investments in october, with six deals valued at a total of us$367m, representing 39% of total m&A value for the month. the prescient holdings tender offer by ptb group topped the m&A deals in the me&A region for the month of october.
Political uncertainty hampers negotiations october has been marked by the cancellations of several acquisitions announced earlier this year. saudi food processing company, the savola group, has decided to drop its plans to acquire Al-hokair’s stake in Al-Aziza panda united company, a deal valued at us$80m, citing that the two companies failed to reach an agreement within the timeframe. national metal manufacturing and casting company (maadaniyah), the saudi steel wire manufacturer, has also decided to stop negotiations to acquire gulf twisted steel co. and its sister company techno ceram middle east. the deal was valued at around sAr255.56m (us$68.1m). it seems that companies find it more and more difficult to reach a friendly agreement in a hectic political situation. however, despite the difficult environment, some investors are trying to look beyond the current uncertainty and focus on looking for untapped opportunities.

28
Mid
dle east &
africa
Monthly M&A Insider
top deAls
toP 10 MIddle eAStern & AfrIcAn Announced deAlS of the Month (oct-11) Announced Bidder company target company target dominated
sectorSeller company exit multiples (x) Bid premia
1-day before
deal value(uS$m)revenue eBItdA P/e
03-oct-11 pbt group prescient holdings financial services 201
20-oct-11 france telecom sA congo-china telecom sArl
tmt Zte corporation; and government of democratic republic of congo
196
03-oct-11 hikma pharmaceuticals plc
promopharm sA pharma, medical & biotech
3.5 11.9 57.4% 158
03-oct-11 shanduka group pty ltd western platinum ltd. (50.00% stake)
energy, mining & utilities
lonmin plc 139
18-oct-11 savola foods limited el-maleka food industries (78.00% stake); and Al-farasha (78.00% stake)
consumer 95
20-oct-11 Qafila for trade and distribution
b-tech for trading and distribution (90.77% stake)
consumer 0.3 16.2 25.1 2.5% 35
20-oct-11 fipar holding Jibal safilait sA (37.00% stake)
consumer 1.1 25
04-oct-11 heritage energy international, limited
sahara oil services holding limited (51.00% stake)
energy, mining & utilities
20
31-oct-11 magic software enterprises ltd
bluephoenix solutions ltd (Appbuilder business)
tmt bluephoenix solutions ltd.
17
06-oct-11 psagot ofek investment house ltd
davidoff pension management (50.00% stake)
financial services davidoff group n/a n/a 13
based on announced deals, including lapsed and withdrawn bids based on dominant geography of target being middle east or Africa data correct as of 07-nov-11
source: mergermarket

29
Mid
dle east &
africa
Monthly M&A Insider
trend grAphs
MIddle eAStern & AfrIcAn M&A quArterly trend
0
5,000
10,000
15,000
20,000
25,000
30,000
35,000
40,000
Q411*
Q311
Q211
Q111
Q410
Q310
Q210
Q110
Q409
Q309
Q209
Q109
Q408
Q308
Q208
Q108
Q407
Q307
Q207
Q107
Q406
Q306
Q206
Q106
Q405
Q05
Q205
Q105
Valu
e (U
S$m
)
Total value Mid-market value
Num
ber of deals
0
20
40
60
80
100
120
140
160
Total volume Mid-market volume
0
1,000
2,000
3,000
4,000
5,000
6,000
7,000
Q411*
Q311
Q211
Q111
Q410
Q310
Q210
Q110
Q409
Q309
Q209
Q109
Q408
Q308
Q208
Q108
Q407
Q307
Q207
Q107
Q406
Q306
Q206
Q106
Q405
Q305
Q205
Q105
Buyout value Exit value Buyout volume Exit volume
Num
ber of dealsValu
e (U
S$m
)
0
5
10
15
20
25
MIddle eAStern & AfrIcAn M&A AnnuAl trend
MIddle eAStern & AfrIcAn M&A AnnuAl PrIvAte equIty trend
0
10
20
30
40
50
60
70
80
90
100
YTD 2011*201020092008200720062005
Total value Mid-market value
Valu
e (U
S$bn
)
Num
ber of deals
0
50
100
150
200
250
300
350
400
450
500
Total volume Mid-market volume
0
2
4
6
8
10
12
14
YTD 2011*201020092008200720062005
Buyout value Exit value Buyout volume Exit volume
Valu
e (U
S$bn
)
0
10
20
30
40
50
60
70
Num
ber of deals
MIddle eAStern & AfrIcAn M&A quArterly PrIvAte equIty trend

30
Mid
dle east &
africa
Monthly M&A Insider
41.7%4.8%
4.7%
2.6%
20.0%
7.2%
3.0%
2.2%
1.9%
2.2%2.6%
2.4%
South Africa
Israel
United Arab Emirates
Saudi Arabia
Egypt
Nigeria
Morocco
Kuwait
Ghana
Tunisia
Sudan
Zimbabwe
trend grAphs
MIddle eAStern & AfrIcAn M&A GeoGrAPhIc BreAKdown ytd 2011
MIddle eAStern & AfrIcAn M&A Sector BreAKdown ytd 2011
vAlue
vAlue
volume
volume
12.6%
0.2%0.3%
20.6%
13.5%
6.8%
5.1%
2.3%
0.6%
0.4%
4.2%
33.5%
Industrials & Chemicals
Consumer
Energy, Mining & Utilites
TMT
Financial Services
Business Services
Pharma, Medical & Biotech
Transportation
Construction
Real Estate
Leisure
Defence
2.1%
1.7%1.2%
2.5%
2.5%
2.9%
1.7%1.7%
1.7%
33.2%
6.2%
23.7%
5.8%
3.3%
South Africa
Israel
United Arab Emirates
Saudi Arabia
Egypt
Nigeria
Morocco
Kenya
Kuwait
Ghana
Jordan
Qatar
Namibia
Mozambique
2.8%2.8%
2.3% 0.9%0.5%
3.7%
13.8%
16.6%
18.0%
7.4%
8.3%
10.6%
12.4%
Industrials & Chemicals
Consumer
Energy, Mining & Utilites
TMT
Financial Services
Business Services
Pharma, Medical & Biotech
Transportation
Construction
Real Estate
Leisure
Defence
Agriculture
values <1% have not been shown values <1% have not been shown

31
Mid
dle east &
africa
Monthly M&A Insider
trend grAphs
MIddle eAStern & AfrIcAn M&A deAl SIZe BreAKdown
vAlue volume
0
10
20
30
40
50
60
70
80
90
100
YTD 2011*201020092008200720062005
12.1%
21.5%
54.8%
12.5%
12.8%
65.9%
13.3%
11.3%
67.2%
17.5%
19.0%
47.7%
19.2%
13.2%
53.2%
66.9%
11.6%
11.0%
11.6%
14.3%
10.3% 7.8% 7.3%14.1% 12.9% 9.3%
8.2%
13.0%
52.9%
1.3% 1.0% 0.9% 1.7% 1.6% 1.1%
<US$14.9m or undisclosed value
US$15m-US$100m
US$101m-US$250m
US$251m-US$500m
>US$501m
Per
cent
age
0
10
20
30
40
50
60
70
80
90
100
YTD 2011*201020092008200720062005
34.8%
10.7%
8.6%
5.6%
34.0%
14.2%
6.2%
9.2%
32.6%
15.4%
5.7%
7.2%
36.8%
11.2%
5.7%3.8%
32.2%
13.2%
4.1%3.4% 5.8%
5.1%
33.3%
11.2%10.4%
5.8%
40.3%36.4% 39.1% 42.5%
47.1% 44.6%48.5%
27.8%
7.5%
<US$14.9m or undisclosed value
US$15m-US$100m
US$101m-US$250m
US$251m-US$500m
>US$501m
Per
cent
age

Monthly M&A Insider 32
aBO
Ut M
err
ill cOr
POr
atiON
About merrill corporAtion
Merrill transaction and compliance Services through a broad range of tools and services, merrill corporation streamlines document composition, filing, printing, distribution and electronic access to the transaction and regulatory compliance activities of its clients engaged in securities offerings, reorganisations, mergers and acquisitions, sec and other regulatory filings. As a registered, third-party service provider offering public companies expert edgArization and Xbrl filing services, merrill professionals can compose, edit, electronically file, manage and distribute data in printed or electronic format.
Merrill legal Solutions provide both on-demand and on-site litigation support, information management and electronic and print document management services for law firms, corporate legal departments and professional services firms.
examples of our expertise include the creation of searchable litigation document repositories, management of electronic data discovery and the delivery of real-time court reporting and deposition videography services.
Merrill’s Marketing and communication Solutions supply brand identity management, customer communication and packaged direct marketing programs for sales professionals in industries such as real estate, mutual funds and insurance. examples of our services include customisable corporate identity materials, direct-mail marketing pieces and promotional programs supported by web-based technologies.
Merrill’s translations Services provide a range of translation options to help clients achieve the most efficient and cost effective approach to their translation projects. merrill brink offers extensive legal translation services for international litigation, intellectual property, patents, contractual matters, antitrust matters, mergers and acquisitions, arbitration and more.
www.datasite.com
About Merrill dataSite®
revolutionising the due diligence process
merrill datasite is designed for rapid deployment and can be up and running within two hours of a client’s need. our team can scan, upload and organise thousands of pages of content from any source in 24 hours or less. every aspect of the process, from document scanning to vdr hosting and project management is delivered by merrill’s multilingual team, available around the clock worldwide.
with merrill datasite, all documents are captured and indexed to an online database and because all rights are designated by the client, security and control are guaranteed. each user’s ability to view, print or access source documents is set up by the client administrator and can be changed at any time. merrill datasite provides useful tools, including full search, viewer audit capability, Q&A, bulk uploads and detailed user activity tracking that help clients maintain tighter control and have greater insight into reviewer behaviour.
Merrill dataSite® enhances transaction success
merrill datasite is the industry’s acknowledged leader. more than 61,000 different private and public companies across the globe have leveraged merrill datasite to increase the value of the following types of transactions:
• mergers, acquisitions and divestitures
• private placement transactions
• leveraged buyout transactions
• bankruptcy and reorganisation transactions
• financial restructuring transactions
• initial public offerings and dual-track processes
• Asset purchases and liquidations
• post-merger integration
founded in 1968 And heAdQuArtered in st. pAul, minnesotA, merrill corporAtion is A leAding provider of outsourced solutions for compleX business communicAtion And informAtion mAnAgement. merrill’s services include document And dAtA mAnAgement, litigAtion support, lAnguAge trAnslAtion services, fulfillment, imAging And printing. merrill serves the corporAte, legAl, finAnciAl services, insurAnce And reAl estAte mArkets. with more thAn 5,000 people in over 40 domestic And 22 internAtionAl locAtions, merrill empowers the communicAtions of the world’s leAding orgAnisAtions.

33Monthly M&A Insider
About merrill dAtAsite
Merrill dataSite – built with the client in mindmerrill datasite was created to meet its clients’ needs and built to their specifications. since 2002 we have consistently leveraged the experiences of our clients to add leading-edge functionality to the available toolset. merrill datasite allows its users and administrators to:
examine documents immediately. patented technology ensures you never have to wait for a document to be downloaded. because the data resides on merrill’s servers, you can simultaneously view an unlimited number of documents in multiple windows without having to close out or save to your “temp” file. when faced with hundreds of documents to review, this feature saves significant time and expense.
designate user permissions. team administrators can control which users will be able to view, print or download specific documents, folders or projects – simply and quickly.
Search every word in every document. with large document collections, sophisticated search features are key to finding critical information and accelerating the due diligence process. merrill datasite performs optical character recognition (ocr) on each and every letter in each and every document. our search capabilities allow users to search tens – if not hundreds – of thousands of pages to find what’s relevant to them. merrill datasite’s search capabilities ensure nothing is missed in any of the posted documents - regardless of where they may be organised within the index (e.g. find every instance of “contract” and “termination” within 5 words of each other, etc.). search results are returned much faster and are unlimited in terms of document results and hits within a document.
using wildcard, fuzzy, proximity, boosting, boolean and grouping modifiers, you can search and find exact matches and near-matches, including misspelled words. potential buyers will enjoy increased confidence knowing they’ve received and seen all materials and documents that are relevant to their decision-making.
Protect confidential information. ”view-only” documents are never downloaded. merrill datasite, not the computer’s browser, controls thecaching process providing unmatched security levels. unlike other vdrproviders, images are never viewable on the pc’s cache after the conclusion of a session.
track all activity accurately. Auditing and reporting tools provide a verifiable account of each individual’s time spent viewing both documents and specific pages – information that adds negotiating leverage.
need to work remotely?no problem. whether you’re working in beijing or new york, you can view your documents online without having to navigate through internal firewalls and email restrictions that often exist for outside company connections and which delay the due diligence process.
Security is our highest prioritymerrill has been a trusted provider of secure information to the financial and legal industries for more than 40 years. our employees execute letters of confidentiality and we are audited annually (internal and third-party) to make certain our it infrastructure and processes remain sound.
merrill datasite was the first virtual data room to receive the iso 27001 certification for its comprehensive information security management system (isms).
the iso 27001 standard, developed by the international organisation for standards to establish international requirements for information security and certification of isms, is designed to ensure effective protection of information assets in foreign markets, as well as across national and regional boundaries.
the best tool in the industrymerrill datasite technology allows for the fastest conversion of soft and hard copy documents to the electronic viewing platform. As a result, designated administrators are able to review documents the moment they are available.
through secure, simultaneous access, full text search capabilities and robust reporting tools, both archival and transactional due diligence processes are streamlined. As a result, merrill datasite gives you more insight and control, and dramatically reduces transaction time and costs.
As a leading provider of vdr solutions worldwide, merrill datasite has empowered nearly two million unique visitors to perform electronic due diligence on thousands of transactions totalling trillions of dollars in asset value.
now SMArter, fASter, eASIer!
PleASe vISIt our weBSIte: www.dAtASIte.coM
aBO
Ut M
err
ill datasite

ABOUT MERRILL CORPORATION
EXECUTIVE MANAGEMENT
Ed Bifulk
President Tel: +1 212 229 6563
Paul Hartzell Senior Vice President
Tel: +1 212 367 5950
EXECUTIVE SALES
Chris Beckmann
Regional Director, Europe Tel: +49 69 25617 110
Alex Gross
Regional Director, Europe Tel: +49 69 7593 7148
Michael Hinchliffe
Regional Director, Europe Tel: +44 20 7422 6100
Jonathan Hughes
Account Manager, Northern Europe Tel: +44 20 7422 6100
Shashank Jain
Representative, United Arab Emirates Tel: +52 55 9171 2237
Alvaro Ortega
Regional Director, Europe Tel: +44 20 7422 6100
Merlin J. Piscitelli
Regional Director, Europe Tel: +44 20 7422 6100
Jérôme Pottier
Regional Director, France Tel: +33 (0) 1 40 06 13 12
Colin Schopbach
Regional Director, Europe Tel: +44 20 7422 6100
Anna Scott
Regional Director, Europe Tel: +44 20 7422 6100
Hakema El-Hadad
Regional Director, Northern Africa Tel: +33 (0) 1 40 06 13 10
Mark Finnie
Regional Director, Hong Kong
Tel: +852 2536 2534
Ari Lee
Regional Director, Asia-Pacific Tel: +852 9855 3758
Vincent Lork
Regional Director, South Asia Tel: +65 6248 4602
Chris Robilliard
Regional Director, Australia & New Zealand
Tel: +612 8667 3064
Manuel Bentosinos
Regional Director, Mexico Tel: +52 55 9171 2237
Ana Paula Macêd Távora de Castro
Regional Director, South America Tel: +55 11 9908 0858
Felipe Cunha
Regional Director, Brazil Tel: +55 11 3568 2429
Carlos Nogueira
Diretor Regional, Brazil Tel: +55 11 3895 8572
Will Brown
Regional Director, Canada Tel: +1 514 877 5177
Hank Gregory
SVP, Western Canada & US Tel: + 604 603 4360
Ryan MacMillan
Regional Director, Canada Tel: +1 416 214 2448
Michael Kennedy
Regional Director, Boston Tel: +1 207 829 4369
Ross Whittaker
Regional Director, New England Tel: +1 617 535 1516
Forrest R. Doane
Regional Director, New York Tel: +1 917 934 7341
Adam Kuritzky
Regional Director, New York Tel: +1 917 934 7340
Shelle Martin
Regional Director, New York Tel: +1 212 229 6613
John McElrone
Regional Director, New York Tel: +1 212 229 6656
Matthew Mezzancello
Regional Director, New York Tel: +1 917 934 7346
Steve Piccone
Vice President, New York Tel: +1 212 229 6883
William Polese
Regional Director, New York Tel: +1 212 229 6612
Paul Kleinkauf
Regional Director, Southeast Tel: +1 404 602 3251
Scott Haugen
Regional Director, Minnesota Tel: +1 651 632 4375
Anthony Crosby
Regional Director, Chicago Tel: +1 312 674 6511
Mark Plaehn
Regional Director, Chicago Tel: +1 312 674 6527
Brian Gilbreath
Regional Director, Omaha Tel: +1 404 934 8085
Nicholas Renter
Regional Director, Dallas Tel: +1 214 754 2100
Andrew Buonincontro
Regional Director, Palo Alto Tel: +1 650 493 1400
Erik Sandie
Regional Director, Palo Alto Tel: +1 650 493 1400
Dan Phelan
Regional Director, Los Angeles Tel: +1 213 253 2139
Jay Loyola
Regional Director, Irvine Tel: +1 949 622 0663
Hans Schumann Regional Director, San Diego Tel: +1 760 635 0830
David Yeary
VP, DataSite Life Sciences Tel: +1 415 307 4414
James Snaza
Director, Life Sciences Tel: +1 651 632 4585
AB
OU
T M
ER
RIL
L C
OR
PO
RA
TIO
N
34Monthly M&A Insider

www.mergermarket.comremark, part of the mergermarket group
80 StrandLondon, WC2R 0RLUnited Kingdom
t: +44 (0)20 7059 6100f: +44 (0)20 7059 [email protected]
11 West 19th Street, 2nd fl.New York, NY 10011USA
t: +1 212 686-5606f: +1 212 [email protected]
Suite 2401-3Grand Millennium Plaza181 Queen’s Road, CentralHong Kong
t: +852 2158 9700f: +852 2158 [email protected]
disclaimer
this publication contains general information and is not intended to be comprehensive nor to provide financial, investment, legal, tax or other professional advice or services. this publication is not a substitute for such professional advice or services, and it should not be acted on or relied upon or used as a basis for any investment or other decision or action that may affect you or your business. before taking any such decision you should consult a suitably qualified professional adviser. whilst reasonable effort has been made to ensure the accuracy of the information contained in this publication, this cannot be guaranteed and neither mergermarket nor any of its subsidiaries nor any affiliate thereof or other related entity shall have any liability to any person or entity which relies on the information contained in this publication, including incidental or consequential damages arising from errors or omissions. Any such reliance is solely at the user’s risk.
remark, the events and publications arm of the mergermarket group, offers a range of publishing, research and events services that enable clients to enhance their own profile, and to develop new business opportunities with their target audience.
The following notes pertain to data contained in this publication:
• deals are included where the deal value is greater than or equal to €5m.
• where no deal value has been disclosed, deals are included if the turnover of the target is greater than or equal to €10m.
• deals are included in the graphs and top deals in each section based on the dominant geography and dominant sector of the target company. data underlying the league tables are based on deals where the bidder, target or parent geography of either is that of the geography in focus.
• ytd 2011 refers to the period 01-Jan-11 to 31-oct-11. Q4 2011 refers to the period 01-oct-11 to 31-oct 11.