A mechanism for preseismic steady rupture fronts observed ...
7
A mechanism for preseismic steady rupture fronts observed in laboratory experiments Y. Kaneko 1 and J.‐P. Ampuero 2 Received 10 October 2011; accepted 11 October 2011; published 10 November 2011. [1] It has been shown that the onset of frictional instability is characterized by a transition from stable, quasi‐static rupture growth to unstable, inertially‐controlled high‐speed rupture. In particular, slow rupture fronts propagating at a steady speed V slow of the order of 5% of the S‐wave speed have been observed prior to the onset of dynamic rupture in recent fault‐friction laboratory experiments. However, the precise mechanism governing this V slow stage is unknown. Here we reproduce this phenomenon in numerical simulations of earthquake sequences that incorporate laboratory ‐ derived rate ‐ and ‐ state friction laws. Our simulations show that the V slow stage originates from a stress concentration inherited from the coalescence of interseismic slow creep fronts. Its occurrence is limited to a narrow range of the parameter space but is found in simulations with two commonly ‐ used state ‐ variable evolution laws in the rate ‐ and ‐ state formulation. The sensitivity of the speed V slow to the model parameters suggests that the propagation speed V slow reported in laboratory experiments may also be sensitive to parameters of friction and stress conditions. Our results imply that time and space dimensions associated with the propagation of V slow on natural faults can be as much as a few seconds and several hundred meters, respectively. Hence the detection of such preseismic signals may be possible with near‐field high‐resolution observations. Citation: Kaneko, Y., and J.‐P. Ampuero (2011), A mechanism for preseismic steady rupture fronts observed in laboratory experiments, Geophys. Res. Lett. , 38, L21307, doi:10.1029/2011GL049953. 1. Introduction [2] The onset of frictional instability is a key mechanism governing the nucleation of crustal earthquakes and land- slides. It has been demonstrated both in laboratory experi- ments [e.g., Dieterich, 1979; Ruina, 1983; Dieterich and Kilgore, 1996; Ohnaka and Shen, 1999; Nielsen et al. , 2010] and numerical simulations [e.g., Okubo, 1989; Rice and Ben‐ Zion, 1996; Lapusta et al. , 2000; Rubin and Ampuero, 2005] that the onset of frictional instability is characterized by a transition from stable, quasi‐static rupture growth to unstable, inertially‐controlled high‐speed rupture. While these studies have advanced our understanding of the transitional behavior, direct comparisons between numerical models and laboratory observations remain quite challenging due to difficulties in accurately monitoring the transitional behavior in laboratory friction experiments and in reprodu- cing the laboratory observations in numerical simulations that incorporate appropriate friction laws. [3] Several laboratory studies attempted to understand the behavior of the quasi‐static to dynamic transition of stick‐ slip motion on experimental faults (i.e., pre‐cut interfaces). Ohnaka and Shen [1999] reported an initial, quasi‐static phase in which the rupture grows at a slow and steady speed, followed by a rupture acceleration phase up to dynamic speeds. In friction experiments on polymethyl‐methacrylate (PMMA), Rubinstein et al. [2004] observed a slow detach- ment front propagating at 5% of the S‐wave speed (V s ) after the passage of a supershear rupture front. More recently, Nielsen et al. [2010] reported steady rupture fronts system- atically propagating at about 5% of V s on experimental faults where a stick‐slip instability was spontaneously nucleated under slow loading. However, under different loading con- ditions, Ben‐David et al. [2010] found variability of rupture speeds ranging from a few percent of V s to P‐wave speed (V p ) depending on the ratio of local shear to normal stresses, suggesting that the speed of slow steady fronts (∼5% of V s ) observed in Rubinstein et al. [2004] and Nielsen et al. [2010] is not universal. Hence the mechanism of a slow steady propagation front remains elusive. [4] In this study, we reproduce the occurrence of slow steady propagation fronts preceding fast dynamic rupture in numerical simulations of spontaneous earthquake sequences, consistent with the laboratory findings of Nielsen et al. [2010]. We refer to this phenomenon as a ‘V slow stage’ and to its propagation speed as ‘V slow ’. We discuss the mecha- nism of the V slow stage, the dependence of V slow on model parameters, and its potential occurrence on natural faults. 2. Model Set‐Up [5] We conduct 2‐D simulations of spontaneous earth- quake sequences on a 1‐D fault subjected to slow, tectonic loading [Kaneko et al., 2010]. We consider an antiplane (Mode III) configuration in which purely dip‐slip motion is assumed. The simulations resolve all stages of the seismic cycle: the aseismic nucleation process, the subsequent dynamic rupture event, the postseismic slip, and the inter- seismic quasi‐static deformation. [6] The fault resistance to sliding is described by labora- tory‐derived rate and state friction laws [Dieterich, 1979; Rice and Ruina, 1983; Ruina, 1983]. For time‐independent effective normal stress ', the shear strength t on the fault is expressed as ( ¼ ' f 0 þ a ln _ = _ 0 þ b ln _ 0 =L ; ð1Þ 1 Institute of Geophysics and Planetary Physics, Scripps Institution of Oceanography, University of California, San Diego, La Jolla, California, USA. 2 Division of Geological and Planetary Sciences, California Institute of Technology, Pasadena, California, USA. Copyright 2011 by the American Geophysical Union. 0094‐8276/11/2011GL049953 GEOPHYSICAL RESEARCH LETTERS, VOL. 38, L21307, doi:10.1029/2011GL049953, 2011 L21307 1 of 7
Transcript of A mechanism for preseismic steady rupture fronts observed ...
A mechanism for preseismic steady rupture fronts observedin laboratory experiments
Y. Kaneko1 and J.‐P. Ampuero2
Received 10 October 2011; accepted 11 October 2011; published 10 November 2011.
[1] It has been shown that the onset of frictional instability ischaracterized by a transition from stable, quasi‐static rupturegrowth to unstable, inertially‐controlled high‐speed rupture.In particular, slow rupture fronts propagating at a steadyspeed Vslow of the order of 5% of the S‐wave speed havebeen observed prior to the onset of dynamic rupture inrecent fault‐friction laboratory experiments. However, theprecise mechanism governing this Vslow stage is unknown.Here we reproduce this phenomenon in numericalsimulations of earthquake sequences that incorporatelaboratory‐derived rate‐and‐state friction laws. Oursimulations show that the Vslow stage originates from astress concentration inherited from the coalescence ofinterseismic slow creep fronts. Its occurrence is limited to anarrow range of the parameter space but is found insimulations with two commonly‐used state‐variableevolution laws in the rate‐and‐state formulation. Thesensitivity of the speed Vslow to the model parameterssuggests that the propagation speed Vslow reported inlaboratory experiments may also be sensitive to parametersof friction and stress conditions. Our results imply that timeand space dimensions associated with the propagation ofVslow on natural faults can be as much as a few seconds andseveral hundred meters, respectively. Hence the detectionof such preseismic signals may be possible with near‐fieldhigh‐resolution observations. Citation: Kaneko, Y., and J.‐P.Ampuero (2011), A mechanism for preseismic steady rupture frontsobserved in laboratory experiments, Geophys. Res. Lett., 38,L21307, doi:10.1029/2011GL049953.
1. Introduction
[2] The onset of frictional instability is a key mechanismgoverning the nucleation of crustal earthquakes and land-slides. It has been demonstrated both in laboratory experi-ments [e.g., Dieterich, 1979; Ruina, 1983; Dieterich andKilgore, 1996; Ohnaka and Shen, 1999; Nielsen et al.,2010] and numerical simulations [e.g., Okubo, 1989; Riceand Ben‐Zion, 1996; Lapusta et al., 2000; Rubin andAmpuero, 2005] that the onset of frictional instability ischaracterized by a transition from stable, quasi‐static rupturegrowth to unstable, inertially‐controlled high‐speed rupture.While these studies have advanced our understanding of thetransitional behavior, direct comparisons between numerical
models and laboratory observations remain quite challengingdue to difficulties in accurately monitoring the transitionalbehavior in laboratory friction experiments and in reprodu-cing the laboratory observations in numerical simulationsthat incorporate appropriate friction laws.[3] Several laboratory studies attempted to understand the
behavior of the quasi‐static to dynamic transition of stick‐slip motion on experimental faults (i.e., pre‐cut interfaces).Ohnaka and Shen [1999] reported an initial, quasi‐staticphase in which the rupture grows at a slow and steady speed,followed by a rupture acceleration phase up to dynamicspeeds. In friction experiments on polymethyl‐methacrylate(PMMA), Rubinstein et al. [2004] observed a slow detach-ment front propagating at 5% of the S‐wave speed (Vs) afterthe passage of a supershear rupture front. More recently,Nielsen et al. [2010] reported steady rupture fronts system-atically propagating at about 5% of Vs on experimental faultswhere a stick‐slip instability was spontaneously nucleatedunder slow loading. However, under different loading con-ditions, Ben‐David et al. [2010] found variability of rupturespeeds ranging from a few percent of Vs to P‐wave speed(Vp) depending on the ratio of local shear to normal stresses,suggesting that the speed of slow steady fronts (∼5% of Vs)observed in Rubinstein et al. [2004] and Nielsen et al. [2010]is not universal. Hence the mechanism of a slow steadypropagation front remains elusive.[4] In this study, we reproduce the occurrence of slow
steady propagation fronts preceding fast dynamic rupture innumerical simulations of spontaneous earthquake sequences,consistent with the laboratory findings of Nielsen et al.[2010]. We refer to this phenomenon as a ‘Vslow stage’ andto its propagation speed as ‘Vslow’. We discuss the mecha-nism of the Vslow stage, the dependence of Vslow on modelparameters, and its potential occurrence on natural faults.
2. Model Set‐Up
[5] We conduct 2‐D simulations of spontaneous earth-quake sequences on a 1‐D fault subjected to slow, tectonicloading [Kaneko et al., 2010]. We consider an antiplane(Mode III) configuration in which purely dip‐slip motion isassumed. The simulations resolve all stages of the seismiccycle: the aseismic nucleation process, the subsequentdynamic rupture event, the postseismic slip, and the inter-seismic quasi‐static deformation.[6] The fault resistance to sliding is described by labora-
tory‐derived rate and state friction laws [Dieterich, 1979;Rice and Ruina, 1983; Ruina, 1983]. For time‐independenteffective normal stress �, the shear strength t on the fault isexpressed as
� ¼ � f0 þ a ln _�= _�0� �þ b ln _�0�=L
� �� �; ð1Þ
1Institute of Geophysics and Planetary Physics, Scripps Institutionof Oceanography, University of California, San Diego, La Jolla,California, USA.
2Division of Geological and Planetary Sciences, California Instituteof Technology, Pasadena, California, USA.
Copyright 2011 by the American Geophysical Union.0094‐8276/11/2011GL049953
GEOPHYSICAL RESEARCH LETTERS, VOL. 38, L21307, doi:10.1029/2011GL049953, 2011
L21307 1 of 7
where a and b are rate and state constitutive parameters, _� isslip velocity, f0 is a reference friction coefficient corre-sponding to a reference slip velocity _�0, � is a state variable,and L is the characteristic slip for state evolution [e.g.,Dieterich, 1979; Ruina, 1983; Rice and Ruina, 1983]. Weconsider the two most classical state variable evolution laws:
d�=dt ¼ 1� _��=L aging lawð Þ; ð2Þ
d�=dt ¼ � _��=L� �
ln _��=L� �
slip lawð Þ ð3Þ
[Dieterich, 1979; Ruina, 1983]. Recently, Ampuero andRubin [2008] rekindled the discussion of which state evo-lution laws are more appropriate to use in earthquakemodeling. Bayart et al. [2006] showed that the slip lawprovides a better match to velocity‐jump experiments. Onthe other hand, Beeler et al. [1994] found, during slide‐hold‐slide experiments using a servo‐control system, that africtional surface heals with time, rather than with sliprate, suggesting that the aging law is a more appropriaterepresentation.[7] The parameter combination a − b < 0 corresponds to
steady‐state velocity‐weakening friction and can lead tounstable slip, whereas a − b > 0 corresponds to steady‐statevelocity‐strengthening and leads to stable sliding. Through-out this article, we omit the words “steady‐state” and simplyrefer to velocity weakening or strengthening.[8] Under slow tectonic loading, a frictional instability
(i.e., an earthquake) is able to develop only if the velocity‐
weakening region of the fault exceeds the nucleation sizeh* [Rice and Ruina, 1983; Rubin and Ampuero, 2005].Two theoretical estimates of the earthquake nucleation sizefor 2‐D problems are given by
hRR* ¼ �
4
�L
� b� að Þ ; ð4Þ
hRA* ¼ 2
�
�Lb
� b� að Þ2 ; ð5Þ
where m is shear modulus for mode III. The estimate h*RRwas derived from the linear stability analysis of steadysliding by Rice and Ruina [1983], while h*RA was obtainedfor a/b ^ 0.5 by Rubin and Ampuero [2005] on the basis ofenergy balance for a quasi‐statically expanding crackgoverned by the aging law (2). Rubin and Ampuero [2005]gave formulae for half of the nucleation size but we use fullsizes.[9] Our simulated fault is 300‐cm long. Slip evolution is
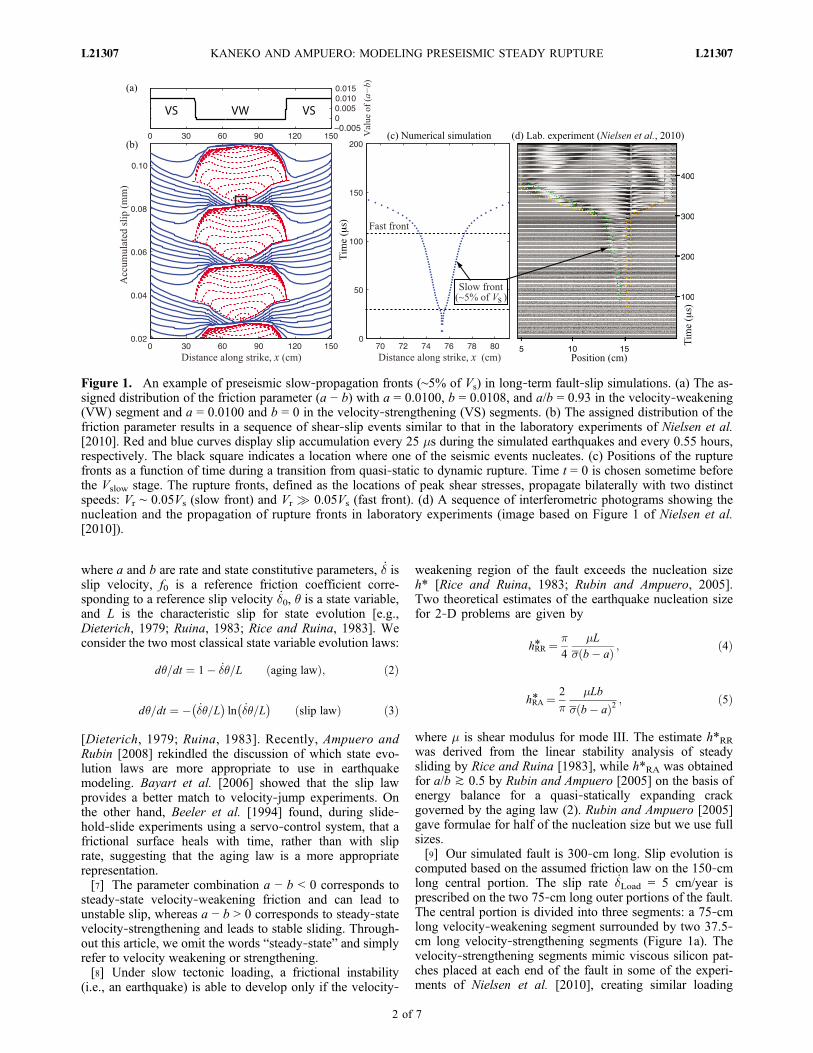
computed based on the assumed friction law on the 150‐cmlong central portion. The slip rate _�Load = 5 cm/year isprescribed on the two 75‐cm long outer portions of the fault.The central portion is divided into three segments: a 75‐cmlong velocity‐weakening segment surrounded by two 37.5‐cm long velocity‐strengthening segments (Figure 1a). Thevelocity‐strengthening segments mimic viscous silicon pat-ches placed at each end of the fault in some of the experi-ments of Nielsen et al. [2010], creating similar loading
Figure 1. An example of preseismic slow‐propagation fronts (∼5% of Vs) in long‐term fault‐slip simulations. (a) The as-signed distribution of the friction parameter (a − b) with a = 0.0100, b = 0.0108, and a/b = 0.93 in the velocity‐weakening(VW) segment and a = 0.0100 and b = 0 in the velocity‐strengthening (VS) segments. (b) The assigned distribution of thefriction parameter results in a sequence of shear‐slip events similar to that in the laboratory experiments of Nielsen et al.[2010]. Red and blue curves display slip accumulation every 25 ms during the simulated earthquakes and every 0.55 hours,respectively. The black square indicates a location where one of the seismic events nucleates. (c) Positions of the rupturefronts as a function of time during a transition from quasi‐static to dynamic rupture. Time t = 0 is chosen sometime beforethe Vslow stage. The rupture fronts, defined as the locations of peak shear stresses, propagate bilaterally with two distinctspeeds: Vr ∼ 0.05Vs (slow front) and Vr � 0.05Vs (fast front). (d) A sequence of interferometric photograms showing thenucleation and the propagation of rupture fronts in laboratory experiments (image based on Figure 1 of Nielsen et al.[2010]).
KANEKO AND AMPUERO: MODELING PRESEISMIC STEADY RUPTURE L21307L21307
2 of 7
conditions. Note that, in the study of Nielsen et al. [2010],the Vslow stage was observed for smooth fault surfaces withor without viscous patches (S. Nielsen, written communi-cation, 2009), but was not observed for rough surfaces withviscous patches.[10] Table 1 gives a range of model parameters considered
in this study. Since values of rate‐and‐state parameters a, b,and L are not known for the laboratory specimen of Nielsenet al. [2010], we do not attempt to exactly reproduce thespatial and temporal scales of the Vslow stage observed intheir laboratory experiments. Instead, we set the spatial scaleand nucleation sizes to be roughly equal to those in thelaboratory experiments by adjusting the value of L. Thevalues of other model parameters are chosen to representplausible stress and friction values on natural faults inseismogenic conditions rather than those in the laboratoryexperiments.
3. Simulations of Slow Steady Propagation Fronts
[11] Figure 1 shows one of the simulation examples inwhich slow steady fronts (Vslow) propagate at about 5% of Vs
systematically during the nucleation processes of seismicevents. Motivated by the fact that a/b of many velocity‐weakening materials in laboratory experiments is closer to1 than 0, we set a/b = 0.93. In this example (Figure 1b) weadopt the slip law (3). The blue lines show the continuousslow sliding of the velocity‐strengthening segments, whichcreates a stress concentration at its tip and penetrates intothe velocity‐weakening segment (Figure 1b). In due time,seismic rupture nucleates and propagates bilaterally (itsprogression is shown by red lines in Figure 1b). After aseismic event, the velocity‐strengthening segments experi-ence postseismic sliding due to the transferred stress. Theinterseismic period between two successive events is 5 hours.[12] Figure 1c shows a close‐up look at the onset of one of
the seismic events. The rupture fronts, the positions of whichare defined here by the peak values of shear stress, begin at alocalized point, expand quasi‐statically, then steadily prop-agate at about 5% of Vs before accelerating to much fasterspeeds. The behavior of the Vslow fronts (Figure 1c) issimilar to that in the laboratory experiments of Nielsen et al.[2010] (Figure 1d) in that the speed Vslow is about 5% of Vs
and remains about the same for all events in a given simu-lation (except for the first few that are affected by initialconditions).[13] To understand the mechanism of the slow steady
fronts, we look at the evolution of slip rates _�, shear stress,and the quantity _��/L before and during the occurrence of
the Vslow stage (Figure 2). During the interseismic period,two creep fronts emanate from the rheological boundaries(x ≈ 45, 105 cm) and then propagate inward. Their eventualcoalescence creates favorable conditions for earthquakenucleation near the center of the fault (Figures 2a, 2c, and2e). Behind the two creep fronts, the condition is nearsteady‐state ( _��/L ≈ 1), and there is no evolution of statevariable � according to (3). The Vslow stage originates froma stress concentration inherited from the coalescence of thecreep fronts (Figures 2b, 2d, and 2f). During the Vslow
stage, the peak slip velocities remain roughly constant intime (∼0.05 m/s in this example). The expansion of rupturetakes the form of a bilateral crack (Figure 2b) as opposed toa unilateral pulse reported by Ampuero and Rubin [2008]under different loading conditions.[14] The relation between propagation speed Vslow and
peak slip rate _�max is consistent with a theoretical relationgiven by equation (53) of Ampuero and Rubin [2008]:
Vprop � 0:75� _�max
b�ln
_�max�iL
!�1
; ð6Þ
where �i is the value of the state variable prior to the arrivalof the rupture front. For instance, for the case shown inFigure 2, ln( _�max�i/L) ≈ 11–16 and _�max ∼ 0.05 m/s, whichyields Vprop/Vs = 0.04–0.06. This is consistent with thespeed Vslow obtained in the simulation (Figure 1c).[15] Setting _�max = 2asVs/m in (6), the slip velocity at
which the effect of radiation damping is comparable to thedirect effect of rate‐and‐state friction, Perfettini andAmpuero [2008] proposed that a typical rupture speed atthe onset of elastodynamic effects was Vprop ∼ 0.05Vs. Toassess the relevance of elastodynamics, Figure 2 shows re-sults obtained by first simulating three earthquake cycles(Figure 1b), then continuing with a quasi‐static simulation(by turning off the inertial effects). We find that the Vslow
stage occurs despite the quasi‐static assumption, suggestingthat the speed Vslow does not explicitly depend on Vs. Asubtle effect of elastodynamics is however not discardedbecause the arrest of the last dynamic event sets the back-ground conditions for the creep front propagation.[16] A fracture mechanics argument based on an idealized
model provides insight on how the stress concentrationinduced by the coalescence of the creep fronts gives rise to aperiod of a steady propagation speed. Let us consider thequasi‐static growth of a mode III crack of length 2‘ under astress field that consists of a uniform background value (andhence constant stress drop D�) plus a highly concentrated
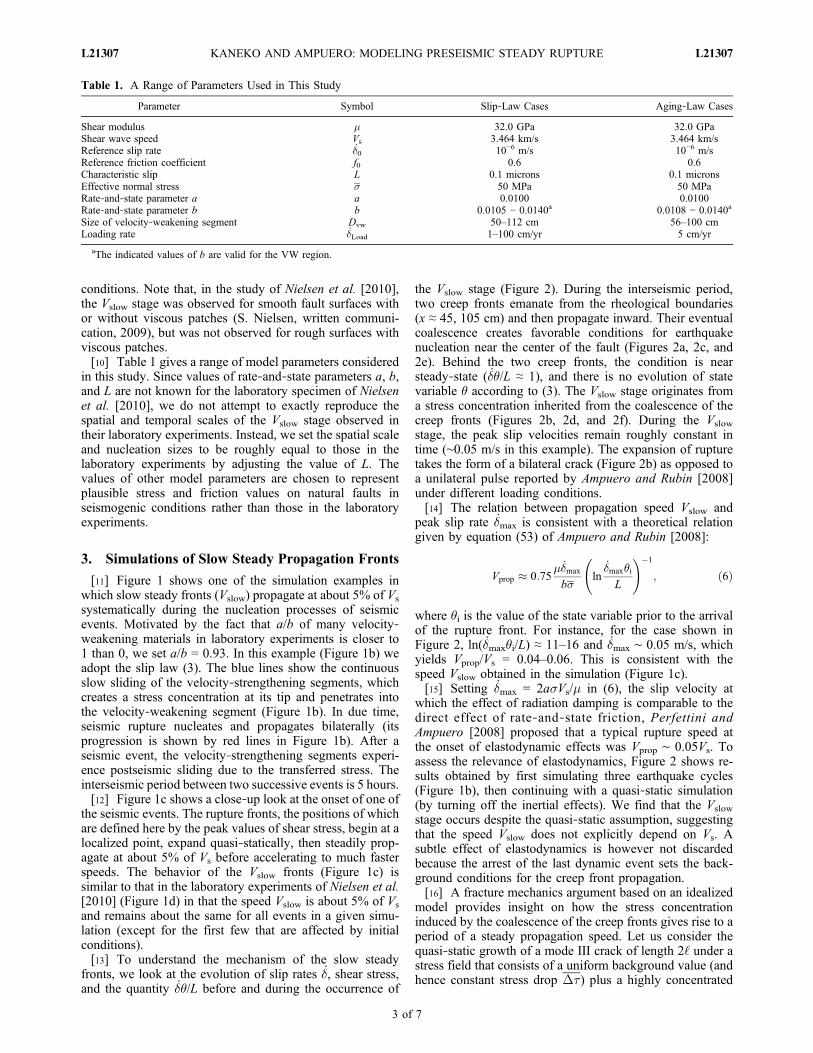
Table 1. A Range of Parameters Used in This Study
Parameter Symbol Slip‐Law Cases Aging‐Law Cases
Shear modulus m 32.0 GPa 32.0 GPaShear wave speed Vs 3.464 km/s 3.464 km/sReference slip rate _�0 10−6 m/s 10−6 m/sReference friction coefficient f0 0.6 0.6Characteristic slip L 0.1 microns 0.1 micronsEffective normal stress � 50 MPa 50 MPaRate‐and‐state parameter a a 0.0100 0.0100Rate‐and‐state parameter b b 0.0105 − 0.0140a 0.0108 − 0.0140a
Size of velocity‐weakening segment Dvw 50–112 cm 56–100 cmLoading rate _�Load 1–100 cm/yr 5 cm/yr
aThe indicated values of b are valid for the VW region.
KANEKO AND AMPUERO: MODELING PRESEISMIC STEADY RUPTURE L21307L21307
3 of 7

force F at the center of the crack. The balance between theenergy release rate at the crack tip, G, and the fractureenergy, Gc, provides a relation between crack speed Vprop
and crack half‐length ‘. On the one hand, the static energyrelease rate G, given by [e.g., Ampuero et al., 2006]
G ‘ð Þ ¼ �‘
2�D� þ 2
�
F
‘
� �2
; ð7Þ
reaches a minimum when ‘ = ‘min = 2F/(pD�). On the otherhand, the effective fracture energy of rate‐and‐state frictionbehaves as Gc ≈ b�Lln( _�max/ _�Load)
n, where n = 1 for the sliplaw and n = 2 for the aging law [Ampuero and Rubin, 2008].Equation (6) implies that _�max, and hence Gc, is anincreasing function of Vprop. Since G(‘) = Gc(Vprop), thecrack propagation speed is almost steady when the energyrelease rate G(‘) is almost constant. This happens when thecrack length is close to 2‘min. This analysis shows that aquasi‐statically expanding crack subjected to a stress con-centration can lead to a period of a steady propagationspeed. The previous analysis also provides an estimate ofthe propagation speed, which depends on the product FDt.However, deriving an adequate estimate of F is notstraightforward, and the quantitative comparison of the
idealized model to the numerical simulation results remainsa subject of future work.
4. Dependence of the Speed of Steady PropagationFronts on Model Parameters
[17] To identify the parameters controlling Vslow, weperform a number of earthquake‐sequence simulations withdifferent sets of model parameters indicated in Table 1.First, we vary the size of the velocity‐weakening segmentDvw while other parameters are held fixed. We normalizeDvw by h*RR/2, a length that agrees well with our simulatednucleation sizes. We find that by increasing Dvw/h* thespeed Vslow increases (Figure 3a), the duration of the Vslow
stage decreases dramatically, and its spatial extent remainsabout the same (Figure 3b).[18] Different speeds of Vslow fronts (Figure 3a) are related
to different amplitudes of slow creep fronts during the in-terseismic period. For a larger value of Dvw/h*, the slip rateof slow creep fronts is larger (e.g., ∼10−8 vs. ∼10−9 m/s inFigure 3c) and, upon their coalescence, the resulting peakslip rate ( _�max) during the Vslow stage also becomes larger(Figure 3c). From (6), the speed Vslow is strongly correlatedto the peak slip rate (Figure 3b). Hence the coalescence of
Figure 2. Snapshots of (a, b) slip rates, (c, d) shear stress t with respect to a reference stress value fo�, and (e, f) _��/L,before and during the Vslow stage. Each snapshot in Figures 2a, 2c, and 2e is taken at times before the onset of the Vslow
stage indicated in Figure 2e. Snapshots in Figures 2b, 2d, and 2f are taken every 13 ms. Arrows indicate the propagationdirection of the peak values in each plot. The inset in Figure 2b shows slip accumulation during the Vslow stage, indicatinga crack‐like expansion of rupture growth. The propagation of Vslow originates from a stress concentration inherited fromthe coalescence of the slow creep fronts. The result from a quasi‐static simulation is shown, and the outermost curves inFigures 2b, 2d, and 2f correspond to the time just before the quasi‐static solution ceased to exist.
KANEKO AND AMPUERO: MODELING PRESEISMIC STEADY RUPTURE L21307L21307
4 of 7

larger‐amplitude creep fronts emerging during the inter-seismic period leads eventually to a faster propagation speedduring the Vslow stage.[19] We also vary the value of the rate‐and‐state param-
eter b in the velocity‐weakening segment. We find that Vslow
decreases with increasing a/b (Figure 3d). This behavior canbe attributed to the dependence of Vslow on Dvw/h* shown inFigure 3a, which indicates that a smaller nucleation size h*leads to a faster Vslow; theoretical estimates (4) and (5) andnumerical simulations show that h* generally decreases as bincreases. When a/b becomes even smaller (a/b < 0.88), thenucleation occurs near one of the rheological transitions andtakes the form of a unilateral pulse (Figures 4a and 4d).Since the nucleation size becomes smaller and the faultbecomes more unstable with larger b − a, one of the slowcreep fronts can self‐accelerate towards earthquake nucle-ation, without coalescence (Figure 4d). Its peak slip rateincreases monotonically with time, and so does its propa-gation speed as predicted by (6) (Figures 4a and 4d). Hencethere is no steady Vslow stage when the nucleation occursnear one of the rheological transitions (Figures 4a and 4d).
This behavior was also observed by Nielsen et al. [2010] inexperiments with rough surfaces and viscous patches. Wefind that this style of nucleation is the most common in theparameter range shown in Table 1. This is probably why aVslow stage was not reported in previous theoretical studies.[20] Since the assumed loading rate _�Load is orders of
magnitudes slower than that in the laboratory experiments,we further explore the dependence of Vslow on _�Load.Figure 3e shows that the speed Vslow increases with theloading rate. Kaneko and Lapusta [2008] demonstrated howincreased loading conditions could change the nucleationprocess and, in particular, cause order‐of‐magnitude smallernucleation sizes. Since a larger loading rate leads to asmaller nucleation size, the quantity Dvw/h* increases withthe loading rate, resulting in larger Vslow in our simulations(Figure 3e).[21] We also find the occurrence of a Vslow stage in si-
mulations with the aging law (2) (Figure 4c). The depen-dence of the properties of the Vslow stage on modelparameters is qualitatively similar to the case of the slip law,although the parameter ranges in which a Vslow stage occurs
Figure 3. Dependence of the speed Vslow of slow propagation fronts on model parameters. (a) Vslow/Vs vs. the size of thevelocity‐weakening segment Dvw divided by a theoretical estimate of the nucleation size h*RR/2, with h*RR/2 = 3.1 cm forthe parameters used. Vslow increases with Dvw/h*. The evolution of (b) peak shear stress and (c) slip rates for two end‐member cases shown in Figure 3a. Top plots in Figures 3b and 3c correspond to the same case. The peak slip rates duringthe Vslow stage and of the slow creeping fronts during the interseismic period are an order of magnitude larger for the casewith larger Vslow. (d) Vslow/Vs vs. a/b in the velocity‐weakening segment, with a = 0.01. Vslow decreases as a/b increases.(e) Vslow/Vs vs. the loading rate _�Load. Note that the horizontal axis is on a logarithmic scale. Vslow increases with theloading rate. Indicated parameters and their values are held unchanged for the results shown in Figures 3a, 3d, and 3e.
KANEKO AND AMPUERO: MODELING PRESEISMIC STEADY RUPTURE L21307L21307
5 of 7

are different. Under the same rate and state parameters, Vslow
∼ 0.05Vs when Dvw/h* ∼ 24 for the slip law and Dvw/h* ∼3.4 for the aging law, respectively (Figures 4a and 4b). Forboth laws a Vslow stage exists when nucleation proceeds bycoalescence of two slow creeping fronts (Figures 4c and 4f),but not if nucleation occurs near a rheological transition(Figures 4b and 4e).
5. Discussion
[22] We have found that in rupture models nucleated bythe coalescence of aseismic slip fronts, dynamic rupture ispreceded by a stage of slow, steady rupture propagation. Itsrupture speed Vslow is not universal, but depends on fric-tional and loading parameters (Figures 3 and 4). This sug-gests that the value Vslow ∼ 0.05Vs reported in the laboratoryexperiments of Nielsen et al. [2010] may also be sensitive toparameters of friction and stress conditions. Future workmay be directed towards determining the values of the rate‐and‐state parameters of the laboratory specimen to allowquantitative comparison between laboratory observationsand numerical simulations.[23] Slow propagation fronts have been observed in labo-
ratory experiments under a variety of loading conditions [e.g.,Rubinstein et al., 2004;Nielsen et al., 2010; Ben‐David et al.,2010]. In this study, the occurrence of a Vslow stage resultsfrom coalescence of slow creep fronts emanating from rhe-ological boundaries, and hence loading conditions play animportant role in generating a Vslow stage. We have not yetexplored scenarios where the fault is characterized byvelocity‐weakening conditions only (i.e., no rheologicaltransitions). Whether the Vslow stage would occur under suchscenarios remains a subject of future work.
[24] Earthquake nucleation is relevant to earthquake pre-diction because nucleation determines the origin time andhypocenter of seismic rupture and may result in detectableprecursors. Laboratory rock‐sliding experiments showedthat values of characteristic slip L range from ∼1 to ∼500 mm,depending on the fault roughness and gouge width [Marone,1998]. Space dimension in numerical models can be non‐dimensionalized, for example, by x’ = x/L such that the resultsof numerical simulations can be scaled with L. The resultsshown in Figures 1c and 4c combined with the upperbound of the laboratory value L = 500 mm suggest that thespace and time dimensions associated with hypotheticalVslow fronts propagating at 5% of Vs on natural faultscorrespond to ∼100 m and ∼0.6 s ( = 100 m divided by0.05Vs) for the cases with the slip law, respectively, and∼500 m and ∼3 s ( = 500 m divided by 0.05Vs) for thecases with the aging law, respectively. This implies thatinferences of such preseismic steady rupture propagationbefore the break‐out of a seismic event may be possiblewith near‐field high‐resolution observations.
[25] Acknowledgments. The authors thank Stefan Nielsen for shar-ing the results of his laboratory experiments. The reviews by Maria ElinaBelardinelli and an anonymous reviewer helped us improve the manuscript.This study was supported by NSF (grant EAR‐1015698) and SCEC(funded by NSF Cooperative Agreement EAR‐0106924 and USGS Coop-erative Agreement 02HQAG0008). This is SCEC contribution number1511.[26] The Editor thanks Maria Elina Belardinelli and an anonymous
reviewer for their assistance in evaluating this paper.
ReferencesAmpuero, J.‐P., and A. M. Rubin (2008), Earthquake nucleation on rate
and state faults: Aging and slip laws, J. Geophys. Res., 113, B01302,doi:10.1029/2007JB005082.
Figure 4. Nucleation processes for the cases with (a, d) the slip law and a/b = 0.83, (b, e) the aging law and a/b = 0.83, and(c, f) the aging law and a/b = 0.87. The evolution of peak shear stress (Figures 4a–4c) and slip rates (Figures 4d–4f) in eachcase is shown. A theoretical estimate of the nucleation size h*RA given in (5) is indicated for the cases with the aging law. InFigures 4d and 4e, the nucleation occurs near the rheological transition where a slow creep front becomes unstable. Arrowsin Figures 4d and 4e indicate the propagation direction of the slow creep font. In Figure 4f, the coalescence of two slowcreep fronts during the interseismic period leads to a nucleation characterized by the Vslow stage prior to the onset of theunstable rupture.
KANEKO AND AMPUERO: MODELING PRESEISMIC STEADY RUPTURE L21307L21307
6 of 7

Ampuero, J.‐P., J. Ripperger, and P. M. Mai (2006), Properties ofdynamic earthquake ruptures with heterogeneous stress drop, Earth-quakes: Radiated Energy and the Physics of Faulting, Geophys.Monogr. Ser., vol. 170, 255–261, edited by R. Abercrombie et al.,AGU, Washington, D. C.
Bayart, E., A. M. Rubin, and C. Marone (2006), Evolution of fault frictionfollowing large velocity jumps, Eos Trans. AGU, 87(52), Fall Meet.Suppl., Abstract S31A‐0180.
Beeler, N. M., T. E. Tullis, and J. D. Weeks (1994), The roles of time anddisplacement in the evolution effect in rock friction, Geophys. Res. Lett.,21, 1987–1990, doi:10.1029/94GL01599.
Ben‐David, O., G. Cohen, and J. Fineberg (2010), The dynamics of the onsetof frictional slip, Science, 330, 211–214, doi:10.1126/science.1194777.
Dieterich, J. H. (1979), Modeling of rock friction: 1. Experimental resultsand constitutive equations, J. Geophys. Res., 84 , 2161–2168,doi:10.1029/JB084iB05p02161.
Dieterich, J. H., and B. H. Kilgore (1996), Implications of fault constitu-tive properties for earthquake prediction, Proc. Natl. Acad. Sci. U. S. A.,93(9), 3787–3794.
Kaneko, Y., and N. Lapusta (2008), Variability of earthquake nucleation incontinuum models of rate‐and‐state faults and implications for after-shock rates, J. Geophys. Res., 113, B12312, doi:10.1029/2007JB005154.
Kaneko, Y., J.‐P. Avouac, and N. Lapusta (2010), Towards inferring earth-quake patterns from geodetic observations of interseismic coupling, Nat.Geosci., 3, 363–369, doi:10.1038/NGEO843.
Lapusta, N., J. Rice, Y. Ben‐Zion, and G. Zheng (2000), Elastodynamicanalysis for slow tectonic loading with spontaneous rupture episodeson faults with rate‐ and state‐dependent friction, J. Geophys. Res.,105(B10), 23,765–23,789, doi:10.1029/2000JB900250.
Marone, C. (1998), Laboratory‐derived friction laws and their applicationto seismic faulting, Annu. Rev. Earth Planet. Sci., 26, 643–696,doi:10.1146/annurev.earth.26.1.643.
Nielsen, S., J. Taddeucci, and S. Vinciguerra (2010), Experimental obser-vation of stick‐slip instability fronts, Geophys. J. Int., 180, 697–702,doi:10.1111/j.1365-246X.2009.0444.x.
Ohnaka, M., and L. F. Shen (1999), Scaling of the shear rupture processfrom nucleation to dynamic propagation: Implications of geometric irreg-ularity of the rupturing surfaces, J. Geophys. Res., 104, 817–844,doi:10.1029/1998JB900007.
Okubo, P. G. (1989), Dynamic rupture modeling with laboratory‐derived con-stitutive relations, J. Geophys. Res., 94, 12,321–12,335, doi:10.1029/JB094iB09p12321.
Perfettini, H., and J.‐P. Ampuero (2008), Dynamics of a velocity strength-ening fault region: Implications for slow earthquakes and postseismicslip, J. Geophys. Res., 113, B09411, doi:10.1029/2007JB005398.
Rice, J. R., and Y. Ben‐Zion (1996), Slip complexity in earthquake faultmodels, Proc. Natl. Acad. Sci. U. S. A., 93, 3811–3818, doi:10.1073/pnas.93.9.3811.
Rice, J. R., and A. L. Ruina (1983), Stability of steady frictional slipping,J. Appl. Mech, 50, 343–349, doi:10.1115/1.3167042.
Rubin, A. M., and J.‐P. Ampuero (2005), Earthquake nucleation on (aging)rate and state faults, J. Geophys. Res., 110, B11312, doi:10.1029/2005JB003686.
Rubinstein, S. M., G. Cohen, and J. Fineberg (2004), Detachment frontsand the onset of dynamic friction, Nature , 430 , 1005–1009,doi:10.1038/nature02830.
Ruina, A. L. (1983), Slip instability and state variable friction laws, J. Geo-phys. Res., 88, 10,359–10,370, doi:10.1029/JB088iB12p10359.
J.‐P. Ampuero, Division of Geological and Planetary Sciences, CaliforniaInstitute of Technology, 1200 E. California Blvd., MC 252‐21, Pasadena,CA 91125, USA. ([email protected])Y. Kaneko, Institute of Geophysics and Planetary Physics, Scripps
Institution of Oceanography, University of California, 9500 Gilman Dr.,MC 0225, San Diego, La Jolla, CA 92093, USA. ([email protected])
KANEKO AND AMPUERO: MODELING PRESEISMIC STEADY RUPTURE L21307L21307
7 of 7