A Mathematical Framework for Modelling the Metastatic ...
46
Bulletin of Mathematical Biology (2019) 81:1965–2010 https://doi.org/10.1007/s11538-019-00597-x A Mathematical Framework for Modelling the Metastatic Spread of Cancer Linnea C. Franssen 1 · Tommaso Lorenzi 1 · Andrew E. F. Burgess 2 · Mark A. J. Chaplain 1 Received: 13 November 2018 / Accepted: 8 March 2019 / Published online: 22 March 2019 © The Author(s) 2019 Abstract Cancer is a complex disease that starts with mutations of key genes in one cell or a small group of cells at a primary site in the body. If these cancer cells continue to grow suc- cessfully and, at some later stage, invade the surrounding tissue and acquire a vascular network, they can spread to distant secondary sites in the body. This process, known as metastatic spread, is responsible for around 90% of deaths from cancer and is one of the so-called hallmarks of cancer. To shed light on the metastatic process, we present a mathematical modelling framework that captures for the first time the interconnected processes of invasion and metastatic spread of individual cancer cells in a spatially explicit manner—a multigrid, hybrid, individual-based approach. This framework accounts for the spatiotemporal evolution of mesenchymal- and epithelial-like can- cer cells, membrane-type-1 matrix metalloproteinase (MT1-MMP) and the diffusible matrix metalloproteinase-2 (MMP-2), and for their interactions with the extracellular matrix. Using computational simulations, we demonstrate that our model captures all the key steps of the invasion-metastasis cascade, i.e. invasion by both heterogeneous cancer cell clusters and by single mesenchymal-like cancer cells; intravasation of these clusters and single cells both via active mechanisms mediated by matrix-degrading enzymes (MDEs) and via passive shedding; circulation of cancer cell clusters and single cancer cells in the vasculature with the associated risk of cell death and disaggregation of clusters; extravasation of clusters and single cells; and metastatic growth at distant secondary sites in the body. By faithfully reproducing experimental results, our simu- lations support the evidence-based hypothesis that the membrane-bound MT1-MMP is the main driver of invasive spread rather than diffusible MDEs such as MMP-2. LCF is funded by the Engineering and Physical Sciences Research Council (EPSRC). MAJC gratefully acknowledges the support of EPSRC Grant No. EP/N014642/1 (EPSRC Centre for Multiscale Soft Tissue Mechanics with Application to Heart & Cancer). B Linnea C. Franssen [email protected] Extended author information available on the last page of the article 123
Transcript of A Mathematical Framework for Modelling the Metastatic ...

Bulletin of Mathematical Biology (2019) 81:1965–2010https://doi.org/10.1007/s11538-019-00597-x
AMathematical Framework for Modelling the MetastaticSpread of Cancer
Linnea C. Franssen1 · Tommaso Lorenzi1 · Andrew E. F. Burgess2 ·Mark A. J. Chaplain1
Received: 13 November 2018 / Accepted: 8 March 2019 / Published online: 22 March 2019© The Author(s) 2019
AbstractCancer is a complex disease that startswithmutations of key genes in one cell or a smallgroup of cells at a primary site in the body. If these cancer cells continue to grow suc-cessfully and, at some later stage, invade the surrounding tissue and acquire a vascularnetwork, they can spread to distant secondary sites in the body. This process, known asmetastatic spread, is responsible for around 90% of deaths from cancer and is one ofthe so-called hallmarks of cancer. To shed light on themetastatic process, we present amathematical modelling framework that captures for the first time the interconnectedprocesses of invasion and metastatic spread of individual cancer cells in a spatiallyexplicit manner—a multigrid, hybrid, individual-based approach. This frameworkaccounts for the spatiotemporal evolution of mesenchymal- and epithelial-like can-cer cells, membrane-type-1 matrix metalloproteinase (MT1-MMP) and the diffusiblematrix metalloproteinase-2 (MMP-2), and for their interactions with the extracellularmatrix. Using computational simulations, we demonstrate that our model captures allthe key steps of the invasion-metastasis cascade, i.e. invasion by both heterogeneouscancer cell clusters and by singlemesenchymal-like cancer cells; intravasation of theseclusters and single cells both via active mechanisms mediated by matrix-degradingenzymes (MDEs) andvia passive shedding; circulation of cancer cell clusters and singlecancer cells in the vasculature with the associated risk of cell death and disaggregationof clusters; extravasation of clusters and single cells; and metastatic growth at distantsecondary sites in the body. By faithfully reproducing experimental results, our simu-lations support the evidence-based hypothesis that the membrane-bound MT1-MMPis the main driver of invasive spread rather than diffusible MDEs such as MMP-2.
LCF is funded by the Engineering and Physical Sciences Research Council (EPSRC). MAJC gratefullyacknowledges the support of EPSRC Grant No. EP/N014642/1 (EPSRC Centre for Multiscale Soft TissueMechanics with Application to Heart & Cancer).
B Linnea C. [email protected]
Extended author information available on the last page of the article
123
1966 L. C. Franssen et al.
Keywords Metastatic spread · Mathematical oncology · Tumour microenvironment ·Individual-based model · Multigrid framework
1 Introduction
Most solid tumours start withmutations of key genes either in one or in a small group ofthemore than 1013 healthy cells in the human body (Bianconi et al. 2013). Abnormallyrapid cell proliferation is one of the most notable results of these acquired cancerousmutations, which can lead to the formation of a small nodule of cancer cells. Over time,this nodule can expand, while acquiring increasingly aggressive mutations, into a fullavascular tumour with a diameter of up to approximately 0.1–0.2 cm (Folkman 1990),limited by the diffusion of nutrients (e.g. oxygen). For successful growth beyond thissize, the cancer cells start recruiting new blood vessels by secreting chemicals, whichare collectively known as tumour angiogenic factors (TAFs) (Folkman and Klagsbrun1987). This neovascularisation process is called (tumour-induced) angiogenesis. Theresulting vasculature serves the tumour’s increased metabolic needs by transportingthe required nutrients. The newly formed blood vessels additionally benefit the tumourin the subsequent vascular growth phase, when the cancer cells become invasive so thatgradients in nutrients, oxygen and extracellular matrix (ECM) drive cancer cells awayfrom the primary tumour mass. In the event that cancer cells successfully intravasateinto the newly grown blood vessels and survive in the vessel environment (where theyare exposed to risks such as attacks by the immune system and shear stress in theblood flow), they can extravasate and relocate at distant sites in the body. At thesenew sites, nutrients and space are less of a limiting factor to growth. The describedsequence of steps of successful relocation of cancer cells from a primary locationto a secondary location is known as metastatic spread. It can lead to the formationof secondary tumours, called metastases, at sites in the body away from the primarytumour. In the first instance, however, the successfully extravasated cancer cells occureither as single disseminated tumour cells (DTCs) or as small clusters of cancer cells,called micrometastases. These DTCs and micrometastases may remain dormant buthave the potential to proliferate into vascularised metastases at the metastatic sitesat some later point in time. The full process we have described here, which is shownschematically in Fig. 1, is also known as the invasion-metastasis cascade (Fidler 2003;Talmadge and Fidler 2010).
Expanding and deepening our understanding of the invasion-metastasis cascade isof vital importance. Only approximately 10% of cancer-related deaths are caused byprimary tumours alone that, for example, have grown to a size at which they affectorgan function by exerting physical pressure. Although this by itself is an incentive tomodel cancer growth, the other 90% of cancer-related deaths arise due to metastaticspread andmetastases growing at distant sites away from the primary tumour (HanahanandWeinberg 2000; Gupta andMassagué 2006). Many localised primary tumours canbe treated successfully, e.g. by resection or chemotherapy, but once cancer cells havebegun to spread throughout the body, it becomes increasingly difficult to treat a patientand prognosis is very poor.
123

A Mathematical Framework for Modelling the Metastatic... 1967
Fig. 1 Schematic overview of the invasion-metastasis cascade. Single mesenchymal-like cancer cells andheterogeneous clusters of mesenchymal- and epithelial-like cancer cells break free from the primary tumourand invade the surrounding tissue (top left). They can intravasate via active MDE-mediated and passivemechanisms (upper left, along epithelium of the vessel). Once in the vasculature, CTC clusters may disag-gregate (centre) and CTCs may die. Surviving cells may extravasate via the walls of the microvasculatureto various secondary sites in the body. Successful colonisation there is rare but can result in either DTCsor micrometastases (bottom right), which have the potential to develop into full-blown metastases (Colourfigure online)
The invasion-metastasis cascade is a complex biological process, and many ques-tions about its details remain unanswered to date. Mathematical modelling cantherefore be a useful tool to capture and unravel this complexity, and to thereby gain abetter understanding of the invasion-metastasis cascade. Ultimately, predictive mod-elling may help to advance treatment success through personalised medicine.
While spatial mathematical models of the cancer invasion process alone as wellas non-spatial models of metastatic spread exist, these two processes, both of whichare spatial in nature, have, to our knowledge, not been combined into a unified math-ematical modelling framework previously. In this paper, we hence propose a firstsuch framework to model cancer cell invasion and metastatic spread in a explic-itly spatial manner. We consider two phenotypes of cancer cells—the more motilemesenchymal-like and the more proliferative epithelial-like cancer cells. Adoptinga multigrid, hybrid, individual-based approach, our mathematical model is capableof capturing all the key steps of the invasion-metastasis cascade, i.e. invasion byboth heterogeneous cancer cell clusters and by single mesenchymal-like cancer cells;intravasation of these clusters and single cells both via active mechanisms, which
123
1968 L. C. Franssen et al.
are mediated by matrix-degrading enzymes (MDEs), and via passive shedding; cir-culation of cancer cell clusters and single cancer cells in the vasculature with theassociated disaggregation of clusters and risk of cell death; extravasation of clustersand single cells; and metastatic growth at distant sites in the body. We verify the bio-logical accuracy of our model by varying key model parameters and checking resultsagainst biological findings. We specifically find that the co-presence of epithelial-like and mesenchymal-like cancer cells enhances local tissue invasion and metastaticspread. Furthermore, by reproducing experimental results, the simulations support theevidence-based hypothesis that the membrane-boundmembrane-type-1 matrix metal-loproteinase (MT1-MMP) is the main driver of invasive spread rather than diffusibleMDEs such as matrix metalloproteinase-2 (MMP-2), in particular when we switchfrom diffusion-dominated to haptotaxis-dominated cancer cell invasion.
The remainder of the paper is organised as follows. In Sect. 2, we summarisethe key steps of the invasion-metastasis cascade and the roles of different cancer cellphenotypes inmore detail. In Sect. 3,we introduce our generalmathematicalmodellingframework ofmetastatic spread. As part of introducing this newmodelling framework,we give an overview of previous models of both cancer invasion and metastasis at thebeginning of this section. In Sect. 4, we explain how we set up the computationalsimulations and how we calibrated the model. In Sect. 5, we present the simulationresults. Finally, in Sect. 6, we discuss the biological implications of our results as wellas future work.
2 Biological Background
In this section,wedescribe themain steps of the invasion-metastasis cascade (cf.Wein-berg 2013) that can enable a small primary nodule of cancer cells to spread to distantsites throughout the body and then colonise at these secondary sites.
2.1 Local Cancer Cell Invasion
When the cancer cells are invading the tissue surrounding the primary tumour, theyhave to overcome structural obstacles. The cells need to make their way through thefairly rigid ECM, which mainly consists of various tissue-bound macromoleculessuch as structure-providing collagens (mainly of type-I), as well as of fibronectin, vit-ronectin and laminin, which influence the spreading, motility and adhesion of cancerscells. Often, the cancer cells additionally have to penetrate the even more rigid basallaminae of blood vessels and potentially of the primary sites they originate from.
The two main mechanisms used by cancer cells to overcome these hurdles, whichhave been discussed in detail by, for example, Friedl and Wolf (2003), are protease-dependent and protease-independent invasions. Protease-dependent invasion earns itsname from collagen-cleaving proteinases, and more specifically MDEs, which aresecreted by some cancer cell types. The cleaving of collagen allows all types of cancercells to subsequently invade along the paths created. Protease-independent invasionrelies on cancer cells changing from amesenchymal-like to an amoeboid-like shape—
123

A Mathematical Framework for Modelling the Metastatic... 1969
a process called mesenchymal-amoeboid transition. This increases the morphologicalplasticity of the cells and enables them to squeeze through the collagen-like pores,instead of solely relying on ECM degradation for invasion.
However, it has been shown by Sabeh et al. (2009) that cancer cells cannot migrateunless the proteinases have cleared the collagen prevalent in normal tissue of its cova-lent cross-links, and that protease-dependent invasion on its own is a sufficient invasionmechanism. Therefore, we focus only on the mechanism of protease-dependent inva-sion throughout the rest of this paper.
We distinguish between two cancer cell phenotypes—epithelial-like cancer cellsand mesenchymal-like cancer cells. These cancer cell types arise due to an observedtrade-off between a cell’s invasiveness and its ability to proliferate—this is also knownas the go-or-grow dichotomy (Giese et al. 1996). The mesenchymal-like cancer cellsresemble mobile cells in embryo development and are therefore more motile. Themesenchymal-like cancer cells can also invade and intravasate as single cells. This isdue to their loss of cell–cell adhesion as well as their expression of MDEs, such as themembrane-bound MT1-MMP and the diffusible MMP-2. Epithelial-like cancer cells,on the other hand, cannot invade effectively without the coexistence ofMDE-secretingmesenchymal-like cancer cells. This is because the cancer cells with an epithelial-likephenotype do not express MDEs. They are also comparatively less motile. How-ever, the epithelial-like cell type is more proliferative and its role should not to beignored in the invasion-metastasis cascade. Also, mesenchymal-like cancer cells havebeen suggested to be able to develop from epithelial-like cancer cells via a processtermed epithelial-mesenchymal transition (EMT) (Kalluri andWeinberg 2009), whichis shown schematically in Fig. 2. The reverse process, mesenchymal-epithelial transi-tion (MET), has additionally been suggested to be involved in metastatic spread, forinstance by contributing to the colonisation of DTCs at secondary sites (Gunasingheet al. 2012).
Mesenchymal-like and epithelial-like cancer cells have been observed to invademost effectively in a setting where both cancer cell types are present. This gives riseto the hypothesis of a second protease-dependent invasion mechanism in addition tomesenchymal-like cancer cells invading individually.Collective migration of cohesivecell cohorts has been shown to be important for the invasion of cancer cells by Friedlet al. (2012), amongst others. The theory is that clusters consisting of cancer cells ofheterogeneous phenotypes may invade the ECM together. Figure 1 provides a schemeof the invasion of single mesenchymal-like cells versus collective groups of cells.
2.2 Intravasation
Once suitably mutated cancer cells—whether in the form of oligoclonal clustersderived from the same primary tumour (Aceto et al. 2014) or individually—havemanaged to invade the tissue far enough to find themselves adjacent to a lymph orblood vessel, they can potentially intravasate into the blood system through the basallaminae of these vessels.While there is experimental evidence suggesting that a subsetof cancer cell lines may only be able to access the blood vessels indirectly via priorintravasation into the lymph vessels, the spread to distant sites in the body ultimately
123

1970 L. C. Franssen et al.
Fig. 2 Schematic representation of the EMT. As an outcome of EMT, the cell–cell adhesion betweenformerly epithelial-like cancer cells is reduced, while the cancer cells express more cell–matrix adhesionenhancing molecules such as cadherin. This combination of changes enhances invasiveness. Further, cancercells becomemore potent at degrading the underlying basement membranes of organs and vessels, as showntowards the right of the figure, as well as the ECM in general. This allows the mesenchymal-like cancercells to invade into the surrounding stroma. Reproduced from Micalizzi et al. (2010) with permission fromSpringer (Colour figure online)
happens by dissemination through the blood vessels (Wong and Hynes 2006; Lambertet al. 2017).
The exact mechanism of intravasation into the vasculature is still unclear. How-ever, the two main proposed biological intravasation modes—active versus passiveintravasation—are likely not mutually exclusive, as suggested for instance by Caval-laro and Christofori (2001), Bockhorn et al. (2007) and Jie et al. (2017). The activeintravasation hypothesis postulates that cancer cells crawl towards and into vesselsactively with help of MDEs. Passive intravasation, on the other hand, implies a moreaccidental shedding of cancer cells via newly formed, immature vessels, which arefragile and may collapse due to trauma or under the physical pressure caused by rapidtumour expansion.
The above-explained difference between more mesenchymal-like and moreepithelial-like cancer cells together with this differentiation between active and pas-sive intravasation gives rise to three entry modes of cancer cells into the vasculature,which are further explained in Francart et al. (2018):
1. Single MDE-expressing mesenchymal-like cancer cells actively enter the bloodvessels and thereafter disseminate as single circulating tumour cells (CTCs).
2. Cancer cells of epithelial and of mesenchymal phenotypes cooperate in the sensethat mesenchymal-like cells allow epithelial-like cells to enter the vasculaturetogether with them, or shortly after them. Mesenchymal-like cells express theMDEs required to degrade the vessels’ basal laminae. This allows for co-invasionof the epithelial-like cancer cells in the vicinity. Thus, both mesenchymal-like andepithelial-like cancer cells enter the blood system jointly as a cluster.
3. Any single cancer cells or cancer cell clusters near a ruptured blood vesselintravasate via the passive entry mode.
These entry mechanisms are depicted—left to right—along the upper left bloodvessel wall in Fig. 1.
123

A Mathematical Framework for Modelling the Metastatic... 1971
Fig. 3 Cancer cells in the blood system. Once single cancer cells or cancer cell clusters have intravasated,a number of mechanisms—both to aid the cancer cells (e.g. platelets covering cell surface, neutrophils thatenhance extravasation through NET expression, and MMP secretion) and to destroy them (e.g. physicalstresses; attacks by NK cells)—come into action. Reproduced from Lambert et al. (2017) with permissionfrom Elsevier Inc (Colour figure online)
2.3 Travel Through theVasculature and Extravasation
Successful intravasation into the vasculature by no means implies that the respectivecancer cells will succeed in metastasising. Cancer cells encounter further obstacles inthe bloodstream. In fact, as Fig. 3 shows, single CTCs and CTC clusters are exposedto physical stresses and are attacked by natural killer (NK) cells. This causes cancercell clusters to disaggregate, as shown in the centre of Fig. 1, leading to smaller CTCclusters and an increased number of single CTCs. Also, it further leads to a significantdecrease in the number of cancer cells that reach the metastatic site from the primarytumour.
Other cells in the bloodstream assist the cancer cells. Platelets coat the surfaces ofthe cancer cells, which prevents NK cells from recognising and destroying them. Neu-trophils have a similar effect and additionally support metastatic seeding. As depictedin the middle of the lower vessel wall shown in Fig. 3, neutrophils can express neu-trophil extracellular traps (NETs), which entangle cancer cells. This is suggested toenhance the survival potential of the cancer cells, aswell as the probability that theywilladhere to endothelial cells and extravasate. Neutrophils also secret variousmetallopro-teases (MMPs) upon arrest, which aid extravasation of the cancer cells by cleaving thevessel wall. Transendothelial migration (TEM) is further provoked by bioactive fac-tors (e.g. vascular endothelial growth factor (VEGF), MMPs and ADAM12), whichare secreted by activated platelets and by cancer cells. These factors can act on cancercells themselves, on monocytes and on endothelial cells. Inflammatory monocytespromote TEM by differentiating into metastasis-associated macrophages that residein the parenchyma of the potential secondary sites. Finally, it has recently been found
123

1972 L. C. Franssen et al.
by Strilic et al. (2016) that cancer cells can induce necroptosis of healthy endothe-lial cells, as shown on the bottom right of Fig. 3, which allows the cancer cells toextravasate without TEM. More in-depth information on the biological backgroundof extravasation can be found in Lambert et al. (2017).
2.4 Metastatic Spread and Colonisation
A successfully extravasated single cancer cell or cluster of cancer cells can eithercontribute to self-seeding to an existing metastasis or to the primary tumour, or itcan settle as a potential initial seed of a new metastasis (Pantel and Speicher 2016).However, even if a cancer cell has extravasated successfully into the parenchyma of apotential new metastatic site, success in growing into a full-blown secondary tumouris not guaranteed. In fact, to give a rough idea of the probability that a cancer cell,which has already intravasated successfully, will ultimately develop into a micro-or macrometastasis, we can quote the result of an experimental study by Luzzi et al.(1998). The authors investigated the proportions of melanoma cells that formedmicro-and macrometastases after the cells were injected intraportally to target mouse livers.They found that 2.04% of the injected cancer cells formed micrometastases after 3days but that after 13 days only 0.07% of the initially injected cancer cells were stillpresent asmicrometastases.Additionally, 0.018%±0.017%of initially injected cancercells had formedmacrometastases after 13 days. These survival probabilities for singleCTCs, may, according to Valastyan and Weinberg (2011), even be an overestimation.CTC clusters were described to have between 23 and 50 times the metastatic potentialof singleCTCs (Aceto et al. 2014). Note, however, that this is only a rough estimate andwill depend on other factors such as the particular cancer cell lines and the secondarysites involved, as explained in detail below.
The main mechanisms by which successfully extravasated cancer cells are pre-vented from forming malignant secondary tumours are related to them beingmaladapted to their new microenvironment, as first suggested by the “seed and soilhypothesis” of Paget (1889). Hence, most cancer cells will be eliminated from theparenchyma at the secondary site. Others will stay at the distant site for periods lastingup to decades but will remain in a dormant state. They fail to proliferate at the sec-ondary site as they are, for example, actively inhibited by the immune system or failto induce angiogenesis. These—at least transiently—indolent cancer cells can existeither as single DTCs or in the form of micrometastases.
The mechanisms of and the reasons for cancerous spread to specific metastaticsites are largely unknown. However, there are studies that can provide insight intotypical patterns of metastatic tumour spread of a certain primary cancer type. To tiein with Paget’s more than 100-year-old observation that breast cancer spread does notoccur randomly (Paget 1889), we can, for example, consult data on the metastaticspread of primary breast cancer that were collected from 4181 breast cancer patients(3735 early stage breast cancer patients diagnosed atMDAnderson Cancer Center and446 breast cancer patients at Memorial Sloan Kettering Cancer Center, who had nodetectablemetastases upondiagnosis but all developed someeventually) andvisualisedin interactive graphs by Kuhn Laboratory (2017). Figure 4 presents a snapshot of such
123

A Mathematical Framework for Modelling the Metastatic... 1973
Fig. 4 Metastatic progression of breast cancer. Circular chord diagram showing Markov chain network ofdata on metastatic spread from 4181 breast cancer patients over a 10-year period. Primary breast canceris located on top with metastatic sites—including bone, lung and brain—ordered clockwise accordingto decreasing transition probability from the primary breast tumour. Chord widths at the ‘breast’ startinglocation represents one-step transitionprobabilities from the locationof the breast to the respective secondarysite. Further information on the exact data origin and patient criteria can be found at http://kuhn.usc.edu/breast_cancer/. Courtesy of Dr. Jeremy Mason, University of Southern California using the interactivetool published at http://kuhn.usc.edu/forecasting—the corresponding publication is Newton et al. (2013)(Colour figure online)
an interactive figure, which shows typical metastatic spread patterns of a primarybreast tumour after 10 years.
3 TheMathematical Modelling Framework
In this section, we introduce our general spatial modelling framework of themetastaticspread of cancer.Webegin bygiving anoverviewof previousmodels of cancer invasion
123

1974 L. C. Franssen et al.
and subsequently of metastasis. Throughout, we distinguish models which includeonly local interactions between cancer cells and their environment and those thatadditionally capture interactions that are non-local in space.
Several continuous local models formulated in terms of differential equations havebeenproposed. Following earlyordinary differential equation (ODE)models (Gatenby1991, 1995a, b), a first one-dimensional spatially explicit model was introduced in theseminal work byGatenby andGawlinski (1996). Their paper described spatiotemporalacid-mediated invasion using a system of reaction-diffusion-taxis partial differentialequations (PDEs). Perumpanani et al. (1996) published a first model of several thatconsidered randommotility, haptotaxis and chemotaxis in the context of invasive can-cer cells interacting with MDEs, ECM proteins, normal cells and non-invasive cancercells. The model examined how deeply and at which speed cancer cells invaded theECMwhen led by hapto- and chemotactic cues. Ambrosi and Preziosi (2002) proposeda model, in which a tumour spheroid was seen as a growing and deformable porousmedium. Using this approach, they introduced a multiphase mechanical framework oftumour growth. A much-cited model focussing on haptotaxis is the continuum PDEmodel by Anderson et al. (2000), which to our knowledge was the first of its kindto extend modelling to a 2D setting. A number of subsequent continuum reaction-diffusion-taxis PDE models focussed on specific MDEs. An example is the work byChaplain and Lolas (2005, 2006), who studied the role of urokinase-type plasminogenactivator, which is one of the proteolytic enzymes over-expressed in cancer cells, incancer invasion. Work by Andasari et al. (2011) extended this modelling approach.Further, Deakin and Chaplain (2013) took a spatial approach to investigating the rolesof membrane-bound MMPs such as MT1-MMP and of soluble MMPs like MMP-2.
Local models relying on discrete and hybrid approaches have also been proposed:for instance, individual-based models (IBMs) in Anderson and Chaplain (1998),Anderson et al. (2000) andZhang et al (2009), cellular automatamodels inKansal et al.(2000), Deutsch and Dormann (2005), Hatzikirou and Deutsch (2008) and Enderlinget al. (2009), cellular Potts model approaches in Turner and Sherratt (2002), Popławskiet al. (2009), Scianna et al. (2013), Kabla (2012), and Hallou et al. (2017), and hybrid-discrete continuum models in Anderson (2005), Rejniak and Anderson (2011) andSfakianakis et al. (2018).
Further, non-local PDEmodels in the form of integro-differential equations, whichincorporate cell–cell adhesion using integral terms, have been developed.A continuummodel of adhesion forces and their influence on cell movement were proposed byArmstrong et al. (2006). They accounted for adhesion by an integral term, whichmodelled non-local interactions in the PDEmodel. Their model was the first of its kindto include cell–cell adhesion in a continuummodel of interacting cell populations. Twoyears later, Gerisch and Chaplain (2008) based their first non-local cancer invasionPDE model on Armstrong et al. (2006). They represented one or more cancer cellpopulations by a PDE each and additionally considered a PDE to represent the ECM,which was modelled to be fixed in space. In this way, cancer cell–cell and cancercell–matrix adhesion were modelled. Sherratt et al. (2009) proposed a similar non-local PDE model of cancer invasion based on the same work by Armstrong et al.(2006). Chaplain et al. (2011) studied the nature of the proliferative properties of non-local PDE models analytically by proving some results on the basis of the paper by
123
A Mathematical Framework for Modelling the Metastatic... 1975
Gerisch and Chaplain (2008). Furthermore, they provided computational simulationsillustrating the relative effects of cell–cell and cell–matrix adhesion on cancer invasion.Domschke et al. (2014) further developed the model by Gerisch and Chaplain (2008)to study the influence of cell–cell and cell–matrix adhesion on tumour growth anddevelopment in more depth. In particular, they introduced a subpopulation of cancercells of a second type that was assumed to have grown to become more aggressiveover time through mutations. A non-local multiscale PDE model for glioma invasion,which considered the clinically observed migration pathways of invading cancer cellsalong neural fibre tracts, was presented by Painter and Hillen (2013). This model madeit possible to study the impact of fibre alignment on the cancer cells’ invasion pathwaysand to connect diffusion tensor imaging data to the model’s parameters.
Metastasis involves a variety of sub-processes at multiple temporal and spatialscales, as discussed in Sect. 2. Hence, different models are appropriate to shed lighton the various sub-processes. These models can broadly be categorised into thosedescribing how successful metastatic phenotypes evolve by epigenetic and geneticmutations—such as Moran process models by Michor et al. (2006) or by Michorand Iwasa (2006), or the time-branching process model by Dingli et al. (2007)—and those modelling the growth dynamics of metastases. In what follows, we willgive an overview of the latter modelling approaches. Saidel et al. (1976) proposeda compartmentalised translational ODE model of metastasis distribution over time.Consecutively, a Markov Chain model by Liotta et al. (1976); Liotta et al (1977)considered a subset of the compartments in Saidel et al. (1976) to predict metastaticformation. Iwata et al. (2000) introduced a hyperbolic PDE model for the colonysize distribution of multiple metastatic tumours that form from an untreated tumour,which many subsequent papers used as a basis for their work. For instance, the modelby Iwata et al. (2000) was further analysed and solved numerically by Barbolosiet al. (2009) and Devys et al. (2009). It was then used in Benzekry (2011) to modelmetastasis density, while tumour growth and angiogenesis were accounted for by anODE model by Hahnfeldt et al. (1999). The paper by Iwata et al. (2000) additionallyformed the basis for amathematical model by Benzekry et al. (2016), which connectedpresurgical primary tumour volume and post-surgical metastatic burden. Finally, anin vivo human xenograft model by Hartung et al. (2014) was also based on Iwata et al.(2000). This described primary tumour growth by a set of phenomenological models,and metastatic growth by a transport equation that was endowed with a boundarycondition for metastatic emission. Other models of metastatic dynamics include: fullystochastic mechanistic models (Xu and Prorok 1998; Bartoszynski et al. 2001; Haninet al. 2006) that used similar growth laws to those proposed by Iwata et al. (2000) topredict the probability that a certain given distribution of metastatic colony size occursat a given time; another stochastic model by Haeno and Michor (2010); and time-branching models by Iwasa et al. (2006) and Haeno et al. (2007). The latter three areall of similar type to the aforementioned, phenotype-focussed models by Michor et al.(2006),Michor and Iwasa (2006) andDingli et al. (2007) but examine an exponentiallyexpanding rather than a constant cancer cell population. Out of these three, the modelsby Iwasa et al. (2006) and Haeno et al. (2007) studied the dynamics of one or twomutations in metastasis-suppressor genes to investigate the probability that a tumourbecomes resistant to therapy. Haeno and Michor (2010) aimed to provide a theoretical
123

1976 L. C. Franssen et al.
example of how to use a mathematical model to examine the effects of the choiceof treatment (chemotherapy and/or tumour resection) and of its timing. Scott et al.(2013) proposed amodel of self-seeding to study the relative likelihood of primary andsecondary seeding by assuming that a primary tumour consists of a set of independentloci, on which tumours undergo saturating growth according to a logistic law. Fromthese loci, cancer cells are shed and potentially return to their original loci or form newloci. Newton et al. (2013) presented a stochastic Markov Chain/Monte Carlo model tostudy multidirectional metastatic spread of lung cancer while distinguishing betweenspreader and sponge metastatic sites, which was extended to be used in breast cancerin Newton et al. (2015). Cisneros and Newman (2014) proposed another stochasticmodel that used a birth–death process to investigate whether metastasis occurs frommany poorly adapted cancer cells or from a few well-adapted cancer cells. Finally,Margarit and Romanelli (2016) developed a patient-statistics-based absorbingMarkovChain model to analyse the metastatic routes between principal organs.
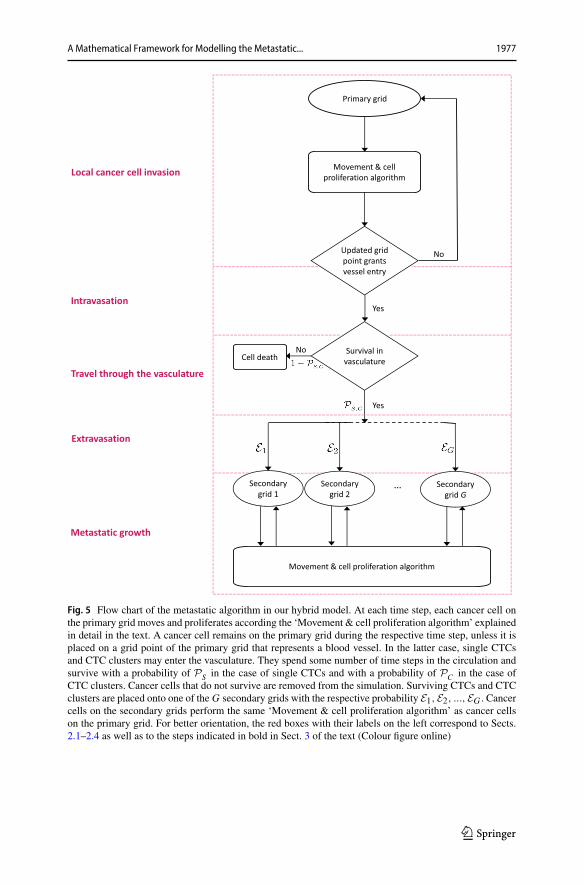
While all processes in the invasion-metastatic cascade are inherently spatial, weconclude that, to our knowledge, no spatially explicit model to describe metastasisand metastatic spread exists, not to mention a model that combines all of the stepsof the invasion-metastasis cascade—i.e. cancer cell invasion, intravasation, vasculartravel, extravasation and regrowth at new sites in the body—in a spatial manner. Withthe aim of closing this gap in the existing literature, we propose a novel spatiallyexplicit hybrid modelling framework that describes the invasive growth dynamicsboth of the primary tumour and at potential secondary metastatic sites as well as thetransport from primary to secondary sites. In what follows, we introduce the ideas andassumptions that our modelling framework builds on. The corresponding modellingalgorithm is described in Fig. 5 in the form of a flow chart.
In order to account for cancer cell metastasis in a spatially explicit manner, weconsider G + 1 spatial domains. These consist of the spatial domain representing theprimary tumour site, ΩP , as well as the G ∈ N spatial domains representing the sitesof potential secondary metastatic spread, Ωa
S, where a = 1, 2, ...,G. In these spatial
domains, we represent the MMP-2 concentration and the ECM density at position(x, y) at time t by the continuous functions m(t, x, y) and w(t, x, y), respectively,while capturing the spatiotemporal evolution of epithelial-like and mesenchymal-likecancer cells individually. We model the local cancer cell invasion by expanding themodelling approach used in Anderson and Chaplain (1998) and Anderson et al. (2000)to our specific biological problem. We include a second cancer cell phenotype andalso additionally consider MT1-MMP, which is taken to be bound to the membranesof the mesenchymal-like cancer cells and thus follows their discrete spatiotemporaldynamics. We designate locations in the primary spatial domain to function as entrypoints into the vasculature and, similarly, impose a spatial map of exit locations fromthe vasculature onto the secondary metastatic domains. This allows cancer cells totravel from the primary tumour site to secondary sites via blood vessels.
We next consider one key step of the invasion-metastasis cascade after the other.To make the key steps more recognisable, we begin each paragraph by printing thedescription of the corresponding step in the invasion-metastasis cascade (cf. Sects.2.1–2.4) in bold. Further, the same step descriptions can be found on the left of the
123
A Mathematical Framework for Modelling the Metastatic... 1977
Fig. 5 Flow chart of the metastatic algorithm in our hybrid model. At each time step, each cancer cell onthe primary grid moves and proliferates according the ‘Movement & cell proliferation algorithm’ explainedin detail in the text. A cancer cell remains on the primary grid during the respective time step, unless it isplaced on a grid point of the primary grid that represents a blood vessel. In the latter case, single CTCsand CTC clusters may enter the vasculature. They spend some number of time steps in the circulation andsurvive with a probability of PS in the case of single CTCs and with a probability of PC in the case ofCTC clusters. Cancer cells that do not survive are removed from the simulation. Surviving CTCs and CTCclusters are placed onto one of the G secondary grids with the respective probability E1,E2, ...,EG . Cancercells on the secondary grids perform the same ‘Movement & cell proliferation algorithm’ as cancer cellson the primary grid. For better orientation, the red boxes with their labels on the left correspond to Sects.2.1–2.4 as well as to the steps indicated in bold in Sect. 3 of the text (Colour figure online)
123
1978 L. C. Franssen et al.
flow chart in Fig. 5. This highlights which parts of our algorithm correspond to whichsections in the text.
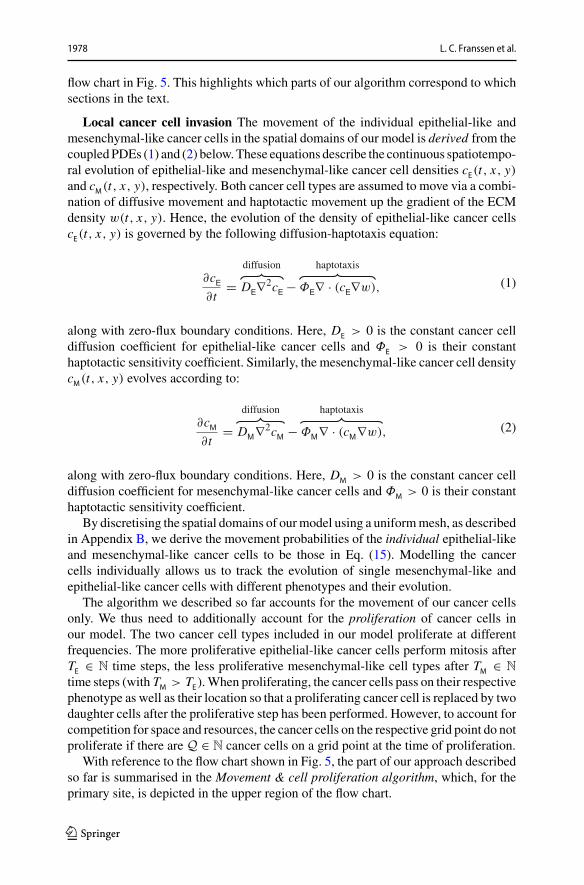
Local cancer cell invasion The movement of the individual epithelial-like andmesenchymal-like cancer cells in the spatial domains of our model is derived from thecoupledPDEs (1) and (2) below.These equations describe the continuous spatiotempo-ral evolution of epithelial-like and mesenchymal-like cancer cell densities cE(t, x, y)and cM(t, x, y), respectively. Both cancer cell types are assumed to move via a combi-nation of diffusive movement and haptotactic movement up the gradient of the ECMdensity w(t, x, y). Hence, the evolution of the density of epithelial-like cancer cellscE(t, x, y) is governed by the following diffusion-haptotaxis equation:
∂cE∂t
= DE∇2cE − ΦE∇ · (cE∇w),
diffusion haptotaxis
(1)
along with zero-flux boundary conditions. Here, DE > 0 is the constant cancer celldiffusion coefficient for epithelial-like cancer cells and ΦE > 0 is their constanthaptotactic sensitivity coefficient. Similarly, the mesenchymal-like cancer cell densitycM(t, x, y) evolves according to:
∂cM∂t
= DM∇2cM − ΦM∇ · (cM∇w),
diffusion haptotaxis
(2)
along with zero-flux boundary conditions. Here, DM > 0 is the constant cancer celldiffusion coefficient for mesenchymal-like cancer cells and ΦM > 0 is their constanthaptotactic sensitivity coefficient.
By discretising the spatial domains of ourmodel using a uniformmesh, as describedin Appendix B, we derive the movement probabilities of the individual epithelial-likeand mesenchymal-like cancer cells to be those in Eq. (15). Modelling the cancercells individually allows us to track the evolution of single mesenchymal-like andepithelial-like cancer cells with different phenotypes and their evolution.
The algorithm we described so far accounts for the movement of our cancer cellsonly. We thus need to additionally account for the proliferation of cancer cells inour model. The two cancer cell types included in our model proliferate at differentfrequencies. The more proliferative epithelial-like cancer cells perform mitosis afterTE ∈ N time steps, the less proliferative mesenchymal-like cell types after TM ∈ N
time steps (with TM > TE).When proliferating, the cancer cells pass on their respectivephenotype as well as their location so that a proliferating cancer cell is replaced by twodaughter cells after the proliferative step has been performed. However, to account forcompetition for space and resources, the cancer cells on the respective grid point do notproliferate if there are Q ∈ N cancer cells on a grid point at the time of proliferation.
With reference to the flow chart shown in Fig. 5, the part of our approach describedso far is summarised in the Movement & cell proliferation algorithm, which, for theprimary site, is depicted in the upper region of the flow chart.
123
A Mathematical Framework for Modelling the Metastatic... 1979
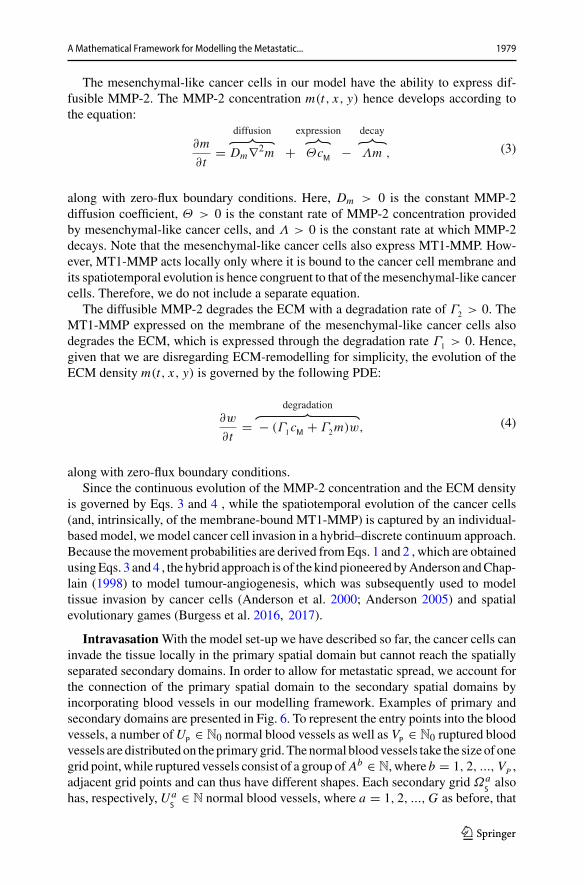
The mesenchymal-like cancer cells in our model have the ability to express dif-fusible MMP-2. The MMP-2 concentration m(t, x, y) hence develops according tothe equation:
∂m
∂t= Dm∇2m + ΘcM − Λm ,
diffusion expression decay
(3)
along with zero-flux boundary conditions. Here, Dm > 0 is the constant MMP-2diffusion coefficient, Θ > 0 is the constant rate of MMP-2 concentration providedby mesenchymal-like cancer cells, and Λ > 0 is the constant rate at which MMP-2decays. Note that the mesenchymal-like cancer cells also express MT1-MMP. How-ever, MT1-MMP acts locally only where it is bound to the cancer cell membrane andits spatiotemporal evolution is hence congruent to that of themesenchymal-like cancercells. Therefore, we do not include a separate equation.
The diffusible MMP-2 degrades the ECM with a degradation rate of Γ2 > 0. TheMT1-MMP expressed on the membrane of the mesenchymal-like cancer cells alsodegrades the ECM, which is expressed through the degradation rate Γ1 > 0. Hence,given that we are disregarding ECM-remodelling for simplicity, the evolution of theECM density m(t, x, y) is governed by the following PDE:
∂w
∂t= − (Γ1cM + Γ2m)w,
degradation
(4)
along with zero-flux boundary conditions.Since the continuous evolution of the MMP-2 concentration and the ECM density
is governed by Eqs. 3 and 4 , while the spatiotemporal evolution of the cancer cells(and, intrinsically, of the membrane-bound MT1-MMP) is captured by an individual-based model, we model cancer cell invasion in a hybrid–discrete continuum approach.Because themovement probabilities are derived fromEqs. 1 and 2 , which are obtainedusingEqs. 3 and 4 , the hybrid approach is of the kind pioneered byAnderson andChap-lain (1998) to model tumour-angiogenesis, which was subsequently used to modeltissue invasion by cancer cells (Anderson et al. 2000; Anderson 2005) and spatialevolutionary games (Burgess et al. 2016, 2017).
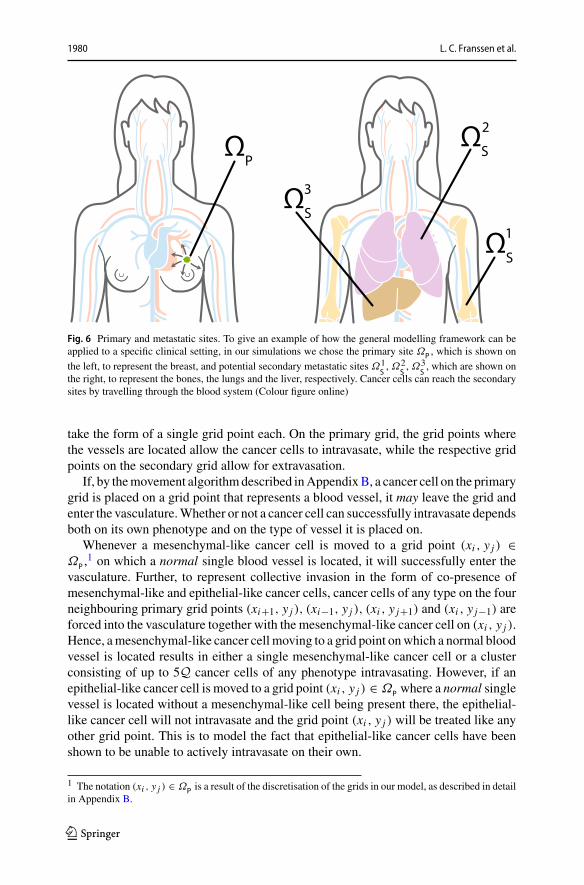
IntravasationWith the model set-up we have described so far, the cancer cells caninvade the tissue locally in the primary spatial domain but cannot reach the spatiallyseparated secondary domains. In order to allow for metastatic spread, we account forthe connection of the primary spatial domain to the secondary spatial domains byincorporating blood vessels in our modelling framework. Examples of primary andsecondary domains are presented in Fig. 6. To represent the entry points into the bloodvessels, a number ofUP ∈ N0 normal blood vessels as well as VP ∈ N0 ruptured bloodvessels are distributedon theprimarygrid.Thenormal bloodvessels take the size of onegrid point, while ruptured vessels consist of a group of Ab ∈ N, where b = 1, 2, ..., VP ,adjacent grid points and can thus have different shapes. Each secondary grid Ωa
Salso
has, respectively, UaS
∈ N normal blood vessels, where a = 1, 2, ...,G as before, that
123
1980 L. C. Franssen et al.
Fig. 6 Primary and metastatic sites. To give an example of how the general modelling framework can beapplied to a specific clinical setting, in our simulations we chose the primary site ΩP , which is shown on
the left, to represent the breast, and potential secondary metastatic sites Ω1S, Ω2
S, Ω3
S, which are shown on
the right, to represent the bones, the lungs and the liver, respectively. Cancer cells can reach the secondarysites by travelling through the blood system (Colour figure online)
take the form of a single grid point each. On the primary grid, the grid points wherethe vessels are located allow the cancer cells to intravasate, while the respective gridpoints on the secondary grid allow for extravasation.
If, by themovement algorithmdescribed inAppendixB, a cancer cell on the primarygrid is placed on a grid point that represents a blood vessel, it may leave the grid andenter the vasculature.Whether or not a cancer cell can successfully intravasate dependsboth on its own phenotype and on the type of vessel it is placed on.
Whenever a mesenchymal-like cancer cell is moved to a grid point (xi , y j ) ∈ΩP ,
1 on which a normal single blood vessel is located, it will successfully enter thevasculature. Further, to represent collective invasion in the form of co-presence ofmesenchymal-like and epithelial-like cancer cells, cancer cells of any type on the fourneighbouring primary grid points (xi+1, y j ), (xi−1, y j ), (xi , y j+1) and (xi , y j−1) areforced into the vasculature together with the mesenchymal-like cancer cell on (xi , y j ).Hence, amesenchymal-like cancer cell moving to a grid point onwhich a normal bloodvessel is located results in either a single mesenchymal-like cancer cell or a clusterconsisting of up to 5Q cancer cells of any phenotype intravasating. However, if anepithelial-like cancer cell is moved to a grid point (xi , y j ) ∈ ΩP where a normal singlevessel is located without a mesenchymal-like cell being present there, the epithelial-like cancer cell will not intravasate and the grid point (xi , y j ) will be treated like anyother grid point. This is to model the fact that epithelial-like cancer cells have beenshown to be unable to actively intravasate on their own.
1 The notation (xi , y j ) ∈ ΩP is a result of the discretisation of the grids in our model, as described in detailin Appendix B.
123

A Mathematical Framework for Modelling the Metastatic... 1981
Further, a cancer cell on the primary grid can move to one of the grid points wherea ruptured vessel is located. Contrary to the above-described scenario of entering anormal vessel, a cancer cell of any type, which is placed on a grid point representingpart of a ruptured vessel, can enter the circulation. The respective cancer cell takes withit any other cancer cells residing both on the grid points representing the ruptured bloodvessel andon the regular grid points bordering the rupturedvessel.Biologically, the factthat cancer cells of any phenotype can intravasate mirrors that these blood vessels arealready ruptured due to trauma or pressure applied by the expanding tumour, makingthe requirement of MDE-mediated degradation of the vessel wall redundant. The factthat other cancer cells on bordering grid points will enter the circulation together withcancer cells placed on grid points representing blood vessels captures some degree ofthe cell–cell adhesion found in collectively invading cancer cell clusters.
Travel through the vasculature If a cancer cell of either phenotype or a cluster ofcancer cells successfully enters the vasculature either through a ruptured or a normalvessel, it will be removed from the primary grid and moved to the vasculature. Cancercells and cancer cell clusters remain in the vasculature for some number of timesteps TV ∈ N, which biologically represents the average time the cancer cells spendin the blood system. Any cancer cells that enter a particular vessel at the same timeare treated as one cluster and hence as a single entity once they are located in thevasculature. However, each cancer cell that is part of a cancer cell cluster disaggregates
from its cluster with some probabilityPd after⌈TV2
⌉time steps. At the end of TV time
steps, the single cancer cells and the remaining cancer cell clusters are removed fromthe simulation unless they are randomlydetermined to survive. The survival probabilityis PS for single cancer cells and PC for cancer cell clusters.
Extravasation Any surviving cancer cells and cancer cell clusters are placed onone of theG secondary gridsΩa
S with probability E1, E2, ..., EG , where∑G
a=1 Ea = 1.Also, on each specific secondary grid, the cancer cells extravasate through one of therandomly chosenUa
S grid points that represent a blood vessel with equal probability. Ifthe respective grid point cannot accommodate all of the entering cancer cells withoutviolating the carrying capacityQ, the remaining cancer cells are randomly distributedonto the four non-diagonally neighbouring grid points until these are filled to carryingcapacityQ. If there are further cancer cells to be placed onto the respective grid pointat this instance, such cancer cells are killed to capture the influence of competition forspace in combination with vascular flow dynamics.
Metastatic growth If and when cancer cells reach a secondary grid, they behave(i.e. replicate, move, produce MDEs etc.) there according to the same rules as on theprimary grid, as indicated on the bottom of the flow chart in Fig. 5.
4 Set-up of Computational Simulations andModel Calibration
To perform numerical simulations, we non-dimensionalised the system of Eqs. (1)–(4) as described in Appendix A. Like Anderson et al. (2000), we chose to rescaledistance with an appropriate length scale L = 0.2 cm (since 0.1–1cm is estimated to
123

1982 L. C. Franssen et al.
be the maximum invasion distance of cancer cells at an early stage of cancer invasion)and time with an appropriate scaling parameter τ = L2
D . Here D = 10−6cm2s−1
is a reference chemical diffusion coefficient suggested by Bray (1992), such thatτ = 4 × 10⁴s, which corresponds to approximately 11 h.
We considered spatial domains of size [0, 1]×[0, 1], which corresponds to physicaldomains of size [0, 0.2] cm × [0, 0.2] cm. In particular, we let the spatial domain ΩP
represent the primary site and the spatial domains Ω1S, Ω2
Sand Ω3
Sdescribe three
metastatic sites. These spatial domains could represent any primary and secondarycarcinoma sites.However, to give an example of a particular application,we considereda study of 4181 breast cancer patients atMemorial SloanKetteringCancerCenter. Dataand graphs from this study can be found at http://kuhn.usc.edu/breast_cancer (KuhnLaboratory 2017).We accordingly choseΩP to represent the primary site of the breast,and Ω1
S, Ω2
Sand Ω3
Sto correspond to the common metastatic sites of bones, lungs
and liver, respectively. Disregarding potential spread to any other metastatic sites, thedata from Kuhn Laboratory (2017) provided us with an extravasation probability ofE1 ≈ 0.5461 to the bones, of E2 ≈ 0.2553 to the lungs, and of E3 ≈ 0.1986 to theliver.
We discretised the four spatial domains to contain 201×201 grid points each. Thiscorresponds to a non-dimensionalised space step of Δx = Δy = 5 × 10⁻³, whichresults in a dimensional space step of 1 × 10⁻³cm, and thus roughly correspondsto the diameter of a breast cancer cell (Vajtai 2013). We then chose a time step ofΔt = 1× 10⁻³, corresponding to 40s, to comply with the Courant–Friedrichs–Lewycondition (Anderson et al. 2000). We ran our simulation for 48,000Δt time steps,which corresponds to ∼22 days.
On each secondary grid, we chose U 1S
= U 2S
= U 3S
= 10 distinct grid points,on which blood vessels are located. For each grid, these blood vessels were placedrandomly but at least two grid step widths away from the respective grid’s boundary.The same applies to the primary grid ΩP but with the additional condition that theUP = 8 single grid points, where normal blood vessels are located, and the VP = 2sets of five grid points, where ruptured blood vessels are placed, are located outsidea quasi-circular region containing the 200 centre-most grid points. While these 10randomly placed vessels are modelled to exist from the beginning, they representthose vessels that grow as a result of tumour-induced angiogenesis in the vasculartumour growth phase.
To represent a two-dimensional cross section of a small avascular primary tumour,we placed a nodule that consisted of 388 randomly distributed cancer cells in thequasi-circular region of the 97 centre-most grid points of the primary grid, with nomore thanQ = 4 cancer cells on any grid point to account for competition for space.This carrying capacity of Q = 4 was applied throughout the simulation. A randomlychosen 40% of these cancer cells were of epithelial-like phenotype, and the remaining60% of mesenchymal-like phenotype. The described initial condition ensures that thecancer cells are placed away from any pre-existing vessels to match the biology of anavascular tumour. Figure 7 gives an example of a typical initial cancer cell placementand vessel distribution on the primary grid.
123

A Mathematical Framework for Modelling the Metastatic... 1983
Fig. 7 Vessel distribution and initial condition of cancer cells. The plot shows (in red) ten randomly dis-tributed blood vessels on the primary grid, two of which are so-called ruptured vessels that consist of fiverather than one grid point. In the centre of the grid, the initial cancer cell distribution is shown. Thereare between 0 (white) and 4 (black) cancer cells on a grid point. As the initial distribution of cancer cellsrepresents a 2D section through an avascular tumour, the blood vessels are placed at some distance awayfrom the initial nodule of cancer cells. The scale bar denotes 0.02 cm (Colour figure online)
In accordance with the ranges provided in Table 1, we chose the mesenchymal-like cancer cell diffusion coefficient to be DM = 1 × 10⁻⁴, the epithelial-like cancercell diffusion coefficient to be DE = 5 × 10⁻⁵, and the mesenchymal and epithelialhaptotactic sensitivity coefficients to be ΦM = ΦE = 5 × 10⁻⁴.
We further assumed that, once in the vasculature, a single CTC had a survivalprobability ofPS = 5×10⁻⁴, which is of the order of the micro- and macrometastaticgrowth success rates proposed in Luzzi et al. (1998). We chose the success rate formetastatic growth to be our survival probability because our model in its current statedisregards cancer cell death at secondary sites so that any successfully extravasatedcancer cell will initiate micrometastatic growth over time. CTC clusters had a survivalprobability PC = 50PS = 2.5× 10⁻², in accordance with the finding by Aceto et al.(2014) that the survival probability of CTC clusters is between 23 and 50 times higherthan that of single CTCs. Surviving single CTCs and CTC clusters exited onto thesecondary grids after spending TV = 0.18 in the blood system, which corresponds to2h and hence to the breast cancer-specific clinical results in Meng et al. (2004).
Further, we assumed a uniform initial ECM density of w(t, x, y) = 1 across all thespatial domains, while the initial MMP-2 concentration wasm(t, x, y) = 0. We chosethe other parameters as shown in Table 1 and assumed that epithelial-like cancer cellsdivide bymitosis every TE = 2000 time steps andmesenchymal-like cancer cells everyTM = 3000 time steps. This corresponds to approximately 22 h and 33 h, respectively,
123

1984 L. C. Franssen et al.
Table1
Baselineparameter
settingsused
inthesimulations
Descriptio
nNon-dim
ensionalvalue
Biologicalreference
(modellin
greference)
Originalv
alue
Δt
Tim
estep
1×
10−3
40s
Δx,
Δy
Spacestep
5×
10−3
Breastcelld
iameter
inVajtai(20
13)
1×
10−3
cm
DM
(dM
)Mesenchym
al-likecancer
celldiffusion
coefficient
1×
10−4
Bray(199
2),A
ndersonetal.(20
00),Deakin
andChaplain(201
3)1
×10
− 10cm
2s−
1
DE(d
E)
Epithelial-lik
ecancer
celldiffusion
coefficient
5×
10−5
Bray(199
2),A
ndersonetal.(20
00),Deakin
andChaplain(201
3)5
×10
−11cm
2s−
1
ΦM
(φM
)Mesenchym
alhaptotactic
sensitivity
coefficient
5×
10−4
Stokes
etal.(19
90),Andersonetal.(20
00)
2.6
×10
3cm
2M
−1s−
1
ΦE(
φE)
Epithelialh
aptotacticsensitivity
coefficient
5×
10−4
Stokes
etal.(19
90),Andersonetal.(20
00)
2.6
×10
3cm
2M
−1s−
1
Dm
(dm
)MMP-2diffusioncoefficient
1×
10−3
Collieretal.(20
11)
1×
10−9
cm2s−
1
Θ(θ
)MMP-2productio
nrate
0.195
Estim
ated
4.87
5×
10−6
Ms−
1
Λ(λ
)MMP-2decayrate
0.1
Estim
ated
inDeakinandChaplain(201
3)2.5
×10
−6s−
1
Γ1(γ
1)
ECM
degradationrateby
MT1-MMP
1Based
onDeakinandChaplain(201
3)1
×10
−4s−
1
Γ2(γ
2)
ECM
degradationrateby
MMP-2
1Based
on(A
ndersonetal.2
000)
1×
10−4
M−1
s−1
T VTim
eCTCsspendin
thevasculature
0.18
Mengetal.(20
04)
7.2
×10
3s
T MEpitheliald
oublingtim
e3
Milo
etal.(20
09)
1.2
×10
5s
T EMesenchym
aldoublin
gtim
e2
Milo
etal.(20
09)
8×
104s
P SSingleCTCsurvivalprobability
5×
10−4
Luzzietal.(19
98)
5×
10−4
P CCTCclustersurvivalprobability
2.5
×10
−2Luzzietal.(19
98)Aceto
etal.(20
14)
2.5
×10
−2E 1
Extravasatio
nprobability
tobones
∼0.546
1Kuh
nLaboratory(201
7)∼0
.546
1
E 2Extravasatio
nprobability
tolungs
∼0.255
3Kuh
nLaboratory(201
7)∼0
.255
3
E 3Extravasatio
nprobability
toliv
er∼0
.198
6Kuh
nLaboratory(201
7)∼0
.198
6
Inthefirstcolumn,no
n-dimension
alparametersareindicatedby
upper-case
notatio
n.Correspon
ding
dimension
alparametersarestated
inbracketsusinglower-caseno
tatio
n.In
thefourth
column,
wereferenceothermathematicalmod
ellin
gpapersin
bracketsandbiolog
icalpaperswith
outb
rackets
123

A Mathematical Framework for Modelling the Metastatic... 1985
which is consistent with the average doubling times found in breast cancer cell lines(Milo et al. 2009).
5 Computational Simulation Results
To verify that our modelling framework is suitable to capture the key steps of theinvasion-metastasis cascade, we first ran simulations with the base parameters shownin Table 1. As indicated by the headings throughout this section, we then variedthese base parameters across biologically realistic ranges to further confirm that ourframework delivers biologically realistic results and to gain insight into the underlyingbiology. For each of the parameter studies, we took the average results from running thesimulation three times—unless stated otherwise—and indicated error bars to displaythe standard deviation in the corresponding plots. This way, we studied the effectthat changing the initial ratio of epithelial-like to mesenchymal-like cancer cells, thenumber of blood vessels in the primary site, and the survival probability of cancer cellshad on the overall cancer dynamics. We investigated the roles of MMP-2 and MT1-MMP as well as their role in comparison with one another. Finally, we changed theparameters to describe haptotaxis-dominated rather than diffusion-dominated cancercell movement at the end of this section to re-examine the role of membrane-boundversus diffusible MDEs. We compared the outcomes of these simulations to a rangeof experimental and clinical results.
5.1 Simulations with Base Parameters
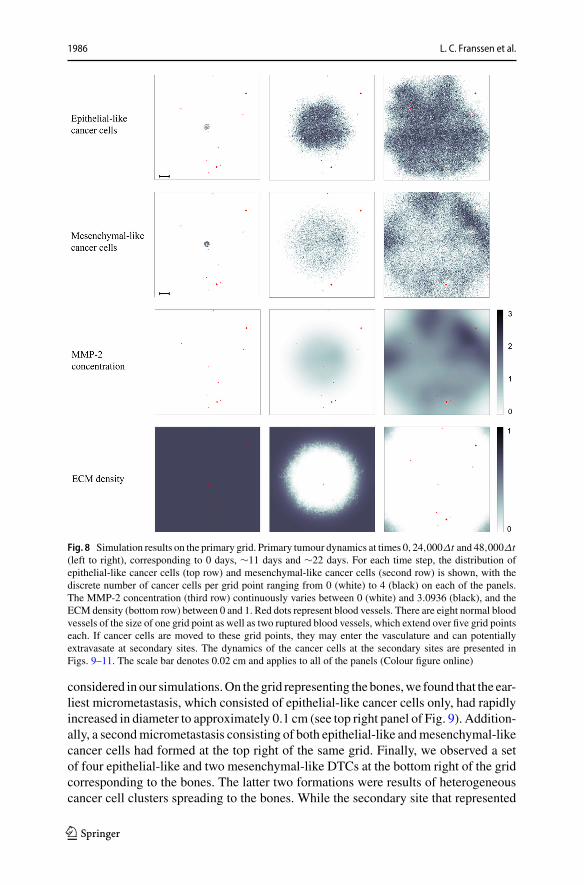
When using the settings outlined in the previous section, we observed in our simu-lations that both epithelial-like and mesenchymal-like cancer cells invaded the tissuesurrounding the primary tumour, which is represented by the primary grid, over a 22day period. This is shown in the simulation results in the two upper rows of pan-els in Fig. 8, respectively. The epithelial-like cancer cells formed the bulk of thecentral tumour mass, while the mesenchymal-like cancer cells were predominantlyfound at the outermost tissue-invading edge. The maximum observed invasion dis-tance of the cancer cells over this time span was approximately 0.13 cm. The patternof MMP-2 concentration for the same simulation roughly followed the distributionof the mesenchymal-like cancer cells as shown in the third row of panels in Fig. 8.The ECM density, which is depicted in the bottom row of Fig. 8, also followed theevolution of the MMP-2 concentration but in a more uniform fashion.
In addition to the cancer cell invasion on the primary grid, we also observedmetastatic spread of single cancer cells, as well as of homogeneous and heteroge-neous cancer cell clusters, to the grids representing the secondary sites of the bones(Fig. 9), the lungs (Fig. 10) and the liver (Fig. 11). The results obtained here showedthat the first metastatic spread occurred at the site of the bones. As shown in the panelon the top left of Fig. 9, after 11 days we already observed a micrometastatic lesionof epithelial-like cancer cells with an approximate diameter of 0.04 cm on the gridthat represented the bones, but in none of the other locations. Yet, after 22 days wediscovered metastatic spread at all three of the secondary locations in the body that we
123
1986 L. C. Franssen et al.
Fig. 8 Simulation results on the primary grid. Primary tumour dynamics at times 0, 24,000Δt and 48,000Δt(left to right), corresponding to 0 days, ∼11 days and ∼22 days. For each time step, the distribution ofepithelial-like cancer cells (top row) and mesenchymal-like cancer cells (second row) is shown, with thediscrete number of cancer cells per grid point ranging from 0 (white) to 4 (black) on each of the panels.The MMP-2 concentration (third row) continuously varies between 0 (white) and 3.0936 (black), and theECM density (bottom row) between 0 and 1. Red dots represent blood vessels. There are eight normal bloodvessels of the size of one grid point as well as two ruptured blood vessels, which extend over five grid pointseach. If cancer cells are moved to these grid points, they may enter the vasculature and can potentiallyextravasate at secondary sites. The dynamics of the cancer cells at the secondary sites are presented inFigs. 9–11. The scale bar denotes 0.02 cm and applies to all of the panels (Colour figure online)
considered in our simulations.On the grid representing the bones,we found that the ear-liest micrometastasis, which consisted of epithelial-like cancer cells only, had rapidlyincreased in diameter to approximately 0.1 cm (see top right panel of Fig. 9). Addition-ally, a secondmicrometastasis consisting of both epithelial-like andmesenchymal-likecancer cells had formed at the top right of the same grid. Finally, we observed a setof four epithelial-like and two mesenchymal-like DTCs at the bottom right of the gridcorresponding to the bones. The latter two formations were results of heterogeneouscancer cell clusters spreading to the bones. While the secondary site that represented
123
A Mathematical Framework for Modelling the Metastatic... 1987
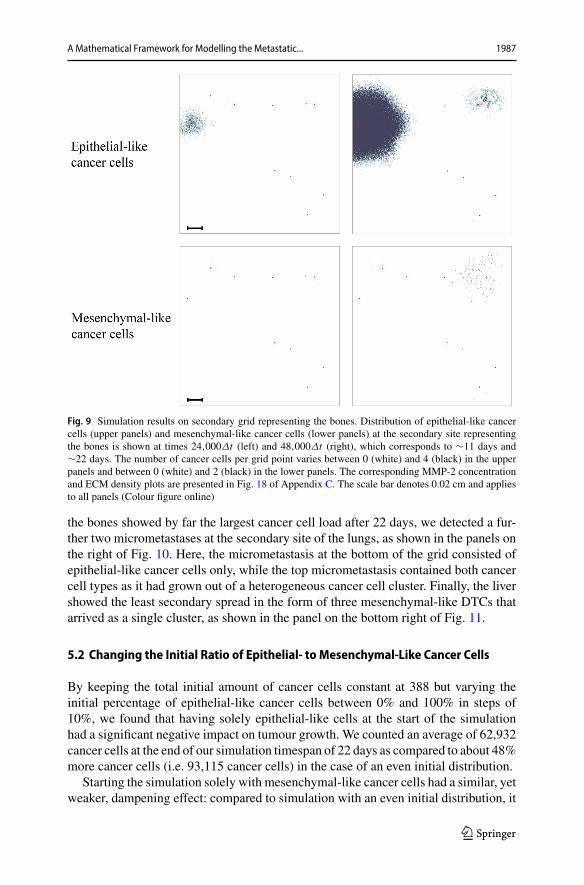
Fig. 9 Simulation results on secondary grid representing the bones. Distribution of epithelial-like cancercells (upper panels) and mesenchymal-like cancer cells (lower panels) at the secondary site representingthe bones is shown at times 24,000Δt (left) and 48,000Δt (right), which corresponds to ∼11 days and∼22 days. The number of cancer cells per grid point varies between 0 (white) and 4 (black) in the upperpanels and between 0 (white) and 2 (black) in the lower panels. The corresponding MMP-2 concentrationand ECM density plots are presented in Fig. 18 of Appendix C. The scale bar denotes 0.02 cm and appliesto all panels (Colour figure online)
the bones showed by far the largest cancer cell load after 22 days, we detected a fur-ther two micrometastases at the secondary site of the lungs, as shown in the panels onthe right of Fig. 10. Here, the micrometastasis at the bottom of the grid consisted ofepithelial-like cancer cells only, while the top micrometastasis contained both cancercell types as it had grown out of a heterogeneous cancer cell cluster. Finally, the livershowed the least secondary spread in the form of three mesenchymal-like DTCs thatarrived as a single cluster, as shown in the panel on the bottom right of Fig. 11.
5.2 Changing the Initial Ratio of Epithelial- to Mesenchymal-Like Cancer Cells
By keeping the total initial amount of cancer cells constant at 388 but varying theinitial percentage of epithelial-like cancer cells between 0% and 100% in steps of10%, we found that having solely epithelial-like cells at the start of the simulationhad a significant negative impact on tumour growth. We counted an average of 62,932cancer cells at the end of our simulation timespan of 22 days as compared to about 48%more cancer cells (i.e. 93,115 cancer cells) in the case of an even initial distribution.
Starting the simulation solely with mesenchymal-like cancer cells had a similar, yetweaker, dampening effect: compared to simulation with an even initial distribution, it
123

1988 L. C. Franssen et al.
Fig. 10 Simulation results on secondary grid representing the lungs. Distribution of epithelial-like cancercells (upper panels) and mesenchymal-like cancer cells (lower panels) at the secondary site representingthe lungs is shown at times 24,000Δt (left) and 48,000Δt (right), which corresponds to ∼11 days and ∼22days, respectively. The number of cancer cells per grid point varies between 0 (white) and 2 (black) in theupper panels and 0 (white) and 3 (black) in the lower panels. The corresponding MMP-2 concentration andECM density plots are presented in Fig. 19 of Appendix C. The scale bar denotes 0.02 cm and applies toall panels (Colour figure online)
reduced growth to 86425, and thus by about 7.7%. Otherwise, we generally found thata higher percentage of epithelial-like cancer cells at the start coincided with a lowernumber of mesenchymal-like cancer cells at the end of the simulations. At the sametime, the number of epithelial-like cancer cells after 22 days increased. We observedthat the maximum number of cancer cells occurred under initial conditions with evenparts ofmesenchymal-like and epithelial-like cancer cells but that the combined cancercell count at the end of the simulation was relatively stable if we varied the initialnumber of epithelial-like cancer cells between 0% and 90% (see Fig. 12).
With regards to shedding from the primary tumour, and hence also to chances ofsuccessful metastasis, we found that a higher initial percentage of mesenchymal-likecancer cells correlated to a higher number of intravasating single cancer cells andcancer cell clusters, likely as a result of an overall higher number of mesenchymal-like cancer cells (see Fig. 13). If we started our simulation with mesenchymal-likecancer cells only, we observed an average total of 634 intravasations by single cancercells or cell clusters — compared to only 7 over the same time range in the case of theaverage of simulations that included epithelial-like cancer cells only. When we set thenumber of ruptured vessels in the primary grid to 0 and considered 10 normal vesselsonly, we observed no intravasations.
123

A Mathematical Framework for Modelling the Metastatic... 1989
Fig. 11 Simulation results on secondary grid representing the liver. Distribution of epithelial-like cancercells (upper panels) and mesenchymal-like cancer cells (lower panels) at the secondary site representing theliver is shown at times 24,000Δt (left) and 48,000Δt (right), which corresponds to∼11 days and∼22 days,respectively. The panel on the bottom right contains three single mesenchymal-like cancer cells indicatedin black, while the other panels do not contain any cells. The corresponding MMP-2 concentration andECM density plots are presented in Fig. 20 of Appendix C. The scale bar denotes 0.02 cm and applies toall panels (Colour figure online)
5.3 Changing the Survival Probability of Cells in the Vasculature
As Aceto et al. (2014) suggested that the probability of cluster survival in the vas-culature (PC ) is 23 to 50 times higher than that for single CTCs (PS ), in the nextsimulations, we examined the effects of changing the probability of cluster survivalin the vasculature to be PC = 23PS = 1.15× 10⁻²—so to take the value of the lowerrather than the upper bound suggested by the authors. For this purpose, we did notallow cancer cell clusters to break up in the vasculature. Averaged over 12 simula-tions, the observed cluster survival was caused to be changed from 2.503×10⁻² (withPC = 2.5×10⁻²) to 1.137×10⁻². While this change had no significant effect on thenumber of single cells and clusters intravasating, it did reduce the average number ofextravasating cancer cell clusters, as expected.
5.4 The Role of MMP-2
To investigate the role of MMP-2 in the spatiotemporal evolution of the cancer cells,we varied both the MMP-2 production rate and the MMP-2 diffusion coefficient.
123
1990 L. C. Franssen et al.
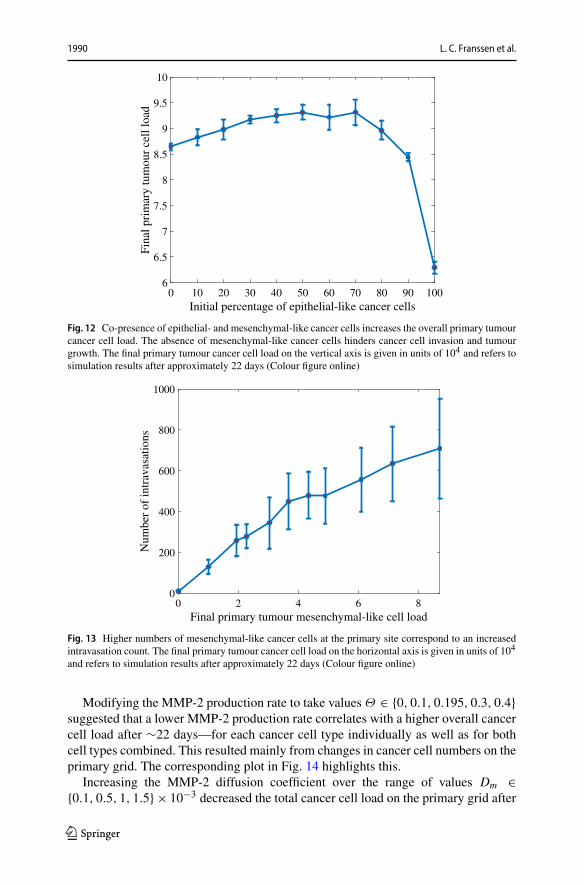
Fig. 12 Co-presence of epithelial- and mesenchymal-like cancer cells increases the overall primary tumourcancer cell load. The absence of mesenchymal-like cancer cells hinders cancer cell invasion and tumourgrowth. The final primary tumour cancer cell load on the vertical axis is given in units of 104 and refers tosimulation results after approximately 22 days (Colour figure online)
Fig. 13 Higher numbers of mesenchymal-like cancer cells at the primary site correspond to an increasedintravasation count. The final primary tumour cancer cell load on the horizontal axis is given in units of 104
and refers to simulation results after approximately 22 days (Colour figure online)
Modifying the MMP-2 production rate to take values Θ ∈ {0, 0.1, 0.195, 0.3, 0.4}suggested that a lower MMP-2 production rate correlates with a higher overall cancercell load after ∼22 days—for each cancer cell type individually as well as for bothcell types combined. This resulted mainly from changes in cancer cell numbers on theprimary grid. The corresponding plot in Fig. 14 highlights this.
Increasing the MMP-2 diffusion coefficient over the range of values Dm ∈{0.1, 0.5, 1, 1.5} × 10−3 decreased the total cancer cell load on the primary grid after
123

A Mathematical Framework for Modelling the Metastatic... 1991
Fig. 14 AhigherMMP-2 production rate lowers the final primary tumour cancer cell load. The final primarytumour cancer cell load on the vertical axis is given in units of 104 and refers to simulation results afterapproximately 22 days (Colour figure online)
22 days. The total number of intravasations and, coherently, the metastatic cancer cellload decreased as well. This is shown in Fig. 15.
5.5 The Effects of MMP-2 Degradation Alone
We next set the MT1-MMP degradation rate to be Γ1 = 0 to examine the situation inwhich the diffusibleMMP-2 is the onlyMDE in our system.We then varied theMMP-2production rate, aswe had done beforewhen studying the effects of varying theMMP-2production rate in the presence of MT1-MMP, to be Θ ∈ {0, 0.1, 0.195, 0.3, 0.4}.
Generally, we found that the total primary cancer cell load after 22 days was sig-nificantly reduced compared to simulations in which MT1-MMP was present. Forinstance, comparing against simulations with our baseline MMP-2 production rate ofΘ = 0.195, the total primary cancer cell load was between 8.2% and 58.0% lower.However, invasion was still possible.
5.6 The Role of MDEs in the Context of Haptotaxis-Dominated Cancer CellMovement
In all of the above simulations, we have considered diffusion-dominated cancer cellmovement. We next investigated the roles of MT1-MMP and MMP-2 in cancer cellinvasion in the scenario of haptotaxis-dominated cancer cell movement. For this, wechanged our epithelial-like and mesenchymal-like cancer cell diffusion coefficientsto be DE = 5 × 10⁻¹¹ and DM = 1 × 10⁻¹⁰, respectively. Further, we focussedon cancer cell invasion in the primary grid in these simulations and hence set thenumber of normal and ruptured vessels to zero. Ceteris paribus, we then re-examinedthe effectiveness of invasion involving solely MT1-MMP as well as solely MMP-2in a system with haptotaxis-dominated cancer cell movement. We first set the MT1-
123

1992 L. C. Franssen et al.
Fig. 15 A higher MMP-2 diffusion coefficient corresponds to a lower final primary tumour cancer cellload. The MMP-2 diffusion coefficient on the horizontal axis is given in units of 10−3 and the final primarytumour cancer cell load on the vertical axis in units of 104. The results were measured after approximately22 days (Colour figure online)
MMP degradation rate to be Γ1 = 0, allowing us to represent the situation in whichthe diffusible MMP-2 is the only MDE in our system. We then, as before, variedthe MMP-2 production rate to be Θ ∈ {0, 0.1, 0.195, 0.3, 0.4}. As opposed to ourfindings when studying diffusion-dominated cancer cell movement, we observed thatinvasion was no longer possible for the same range of MMP-2 production rates. Thefinal cancer cell numbers on the primary grid averaged below a tenfold increase in cellpopulation when compared to the original nodule of 388 cancer cells. Moreover, thefinal cancer cell constellation was located at the centre of the grid due to the very lowinvasion distance of the cancer cells.
When we increased the MT1-MMP degradation coefficient back to the baselineΓ1 = 1 but set the MMP-2 production rate to beΘ = 0, we found that the cancer cellsdid invade with an average total of 18312 cancer cells after approximately 22 days.By decreasing the MT1-MMP degradation coefficient to Γ1 = 0.5, we observed aneven larger cancer cell load of 28157.
5.7 Simulation Results Coincide with Experimental Evidence that StressesImportance of MT1-MMP in Cancer Invasion
We next ran simulations with an initial cell distribution and domain size that matchedthe experiments conducted bySabeh et al. (2009),who embeddedHT-1080 cancer cellsinto 3D type-I collagen gels as central nodules of diameter 1.5 × 10⁻²–2 × 10⁻²cm.Coherently, we increased the diameter of our initial centred quasi-circular noduleto 1.5 × 10⁻²cm and let it consist of 700 cancer cells, 40% (i.e. 280) of which wereepithelial-like and 60%(i.e. 420)mesenchymal-like. Further,we decreased our domainsize to be 0.1cm× 0.1cm to match that in the experimental conditions of Sabeh et al.(2009). Figure 16 shows a snapshot of the spatiotemporal evolution of epithelial-like
123

A Mathematical Framework for Modelling the Metastatic... 1993
Fig. 16 Simulation results for a heterogeneous cancer cell population subject to haptotaxis-dominatedmovement. To match the domain size and initial cell count of experiments by Sabeh et al. (2009), westarted our simulation by placing 420 mesenchymal-like cancer cells and 280 epithelial-like cancer cellsin a quasi-circular region with diameter 1.5 × 10⁻² cm at the centre of a 0.1 cm × 0.1 cm grid (initialconditions not shown). Depicted is the distribution of epithelial-like (upper panels) and mesenchymal-like(lower panels) cancer cells at time 34,560Δt , corresponding to 16 days. Left to right, the invasive patternsin the presence of both MDEs (Θ = 0.195, Γ1 = 1), in the presence of MT1-MMP only (Θ = 0, Γ1 = 1)and in the presence of MMP-2 only (Θ = 0.195, Γ1 = 0) are shown for both cancer cell phenotypes. Thescale bar denotes 0.01 cm and applies to all panels (Colour figure online)
and mesenchymal-like cancer cells under these experimental conditions after runninga simulation for 720 time steps, which corresponds to 16 days. As expected, we stillobserved that invasion by both epithelial-like and mesenchymal-like cancer cells waspossiblewhen bothMDEswere present (i.e. withΘ = 0.195,Γ1 = 1) andwhen solelyMT1-MMP was present (i.e. with Θ = 0, Γ1 = 1), while invasion was not possiblewhen solely MMP-2 was expressed (i.e. with Θ = 0.195, Γ1 = 0). These results areshown in the left, middle and right column of panels of Fig. 16, respectively. Out of thethree mechanisms, invasion under expression of MT1-MMP alone yielded the highestaverage invasion depth. We further observed that the switch from diffusion-dominatedto haptotaxis-dominated cancer cell movement triggered more prominent finger-likeprotrusions in the invasive pattern of the epithelial-like cancer cells in the scenarioswhere either both MDEs or MT1-MMP alone were present, which is shown in the leftand in the middle panel of the top row of Fig. 16, respectively.
However, Sabeh et al. (2009) used a homogeneous HT-1080 cancer cell popula-tion, and thus cells of mesenchymal origin, in their experiments to examine the roleof MT1-MMP and MMP-2 in cancer invasion. In order to fully match the experi-mental conditions of Sabeh et al. (2009), we next changed our initial conditions toconsider a cancer cell population consisting of 700 mesenchymal-like cancer cellsonly, as shown in the third row of panels in Fig. 17. Sabeh et al. (2009) electroporatedmulticellular clusters of HT-1080 cancer cells of diameter 1.5 × 10⁻²–2 × 10⁻²cmeither with a control small interfering RNA (siRNA), which leaves the diffusiblematrixmetalloproteinase-1 (MMP-1) and MMP-2 as well as the non-diffusible MT1-MMPactivated; or with MMP-1 and MMP-2 siRNAs, which leaves MT1-MMP alone acti-
123

1994 L. C. Franssen et al.
vated but silences the diffusible MDEs MMP-1 and MMP-2; or with MT1 siRNA,which silences MT1-MMP but leaves MMP-1 and MMP-2 activated. These electro-porated multicellular clusters were then embedded centrally in 3D-type-I collagengels. The initial experimental set-ups and their respective evolution after 3 days areshown—left to right—in the two upper rows of panels in Fig. 17. Since the evolutionof the two diffusible MDEs, MMP-1 and MMP-2, in the experiments can be jointlyaccounted for by the MMP-2 equation of our model, our modelling framework canreplicate the above-described experimental settings well. We did this by, again, con-sidering a system with both MDEs (i.e. with Θ = 0.05, Γ1 = 1), with MT1-MMPonly (i.e. with Θ = 0, Γ1 = 1) and with MMP-2 only (i.e. with Θ = 0.05, Γ1 = 0),respectively. When looking at the invasion results after 720 time steps, which corre-sponds to 16 days, we observed similar results as in the case of a mixed initial cancercell population. As the first panel of the bottom row of Fig. 17 shows, invasion waspossible with both MDEs present. Yet, the invasion depth was slightly lower com-pared to the case where we allowed for MT1-MMP expression alone, which is shownin the second panel of the bottom row of the same figure. Finally, we again found thatinvasion was not possible in the presence of MMP-2 alone as the third panel of thebottom row of Fig. 17 shows. As Fig. 17 suggests, these results are qualitatively ingood agreement with the experiments by Sabeh et al. (2009).
Finally, due to our awareness that Sabeh et al. (2009) used cancer cells of mes-enchymal origin only in their experiments, we further sought to reproduce the resultsof experiments by Gaggioli et al. (2007), who studied the invasion of squamous cellcarcinoma (SCC) cells, which are of epithelial origin. They found that SCC cells relyon fibroblasts for their invasion, which are cells of mesenchymal-like type that arecapable of matrix remodelling, like the mesenchymal-like cancer cells in our model.In the absence of fibroblasts, the authors observed that the cancer cells were unable toinvade.While we showed that a mixed population of epithelial-like andmesenchymal-like cancer cells was indeed able to invade when both MDEs are present (see panelson the left of Fig. 16), we ran the same simulations again with epithelial-like cancercells only. This showed that the epithelial-like cancer cells in our model were unableto invade on their own, as observed experimentally by Gaggioli et al. (2007). (Datanot shown—similar to bottom right panel of Fig. 17.)
6 Discussion and Perspective
In this paper, we have presented a novel mathematical framework to model themetastatic spread of cancer in a spatially explicit manner. For this, we have useda hybrid approach (cf. Anderson and Chaplain (1998); Anderson et al. (2000)) thatcaptures individual cancer cell dynamics while treating abiotic factors as a continuum.We have confirmed through computational simulations that this framework accountsfor the key steps of the spatial modelling of metastatic spread.
In carrying out the computational simulations, we found that such a modellingframework provides biologically realistic outcomes and gives further insight intothe mechanisms underpinning the invasion-metastasis cascade at the cellular scale.Tumour shape and metastatic distribution were predicted to appear as one would
123
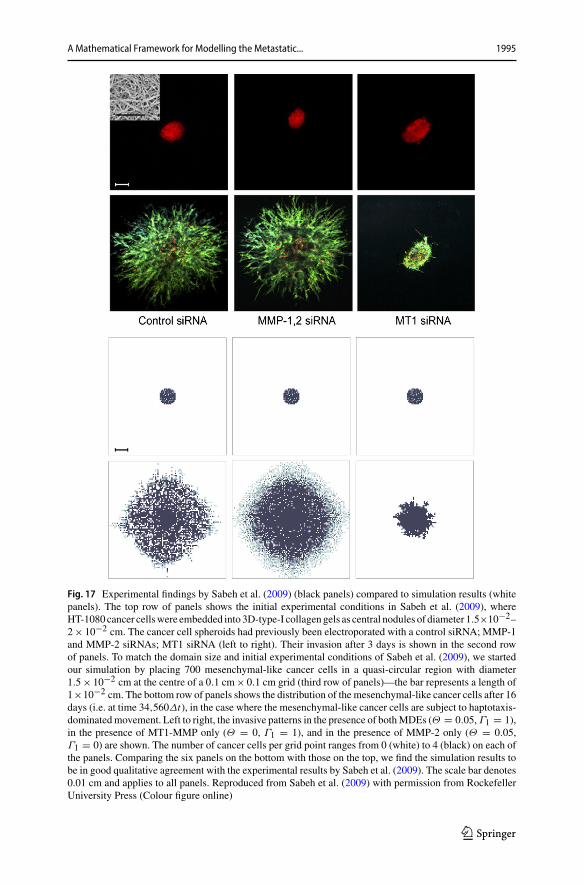
A Mathematical Framework for Modelling the Metastatic... 1995
Fig. 17 Experimental findings by Sabeh et al. (2009) (black panels) compared to simulation results (whitepanels). The top row of panels shows the initial experimental conditions in Sabeh et al. (2009), whereHT-1080 cancer cellswere embedded into 3D-type-I collagengels as central nodules of diameter 1.5×10⁻²–2× 10⁻² cm. The cancer cell spheroids had previously been electroporated with a control siRNA; MMP-1and MMP-2 siRNAs; MT1 siRNA (left to right). Their invasion after 3 days is shown in the second rowof panels. To match the domain size and initial experimental conditions of Sabeh et al. (2009), we startedour simulation by placing 700 mesenchymal-like cancer cells in a quasi-circular region with diameter1.5× 10−2 cm at the centre of a 0.1 cm× 0.1 cm grid (third row of panels)—the bar represents a length of1×10−2 cm. The bottom row of panels shows the distribution of the mesenchymal-like cancer cells after 16days (i.e. at time 34,560Δt), in the case where the mesenchymal-like cancer cells are subject to haptotaxis-dominatedmovement. Left to right, the invasive patterns in the presence of bothMDEs (Θ = 0.05,Γ1 = 1),in the presence of MT1-MMP only (Θ = 0, Γ1 = 1), and in the presence of MMP-2 only (Θ = 0.05,Γ1 = 0) are shown. The number of cancer cells per grid point ranges from 0 (white) to 4 (black) on each ofthe panels. Comparing the six panels on the bottom with those on the top, we find the simulation results tobe in good qualitative agreement with the experimental results by Sabeh et al. (2009). The scale bar denotes0.01 cm and applies to all panels. Reproduced from Sabeh et al. (2009) with permission from RockefellerUniversity Press (Colour figure online)
123
1996 L. C. Franssen et al.
expect in a cancer patient who has not yet received treatment. In particular, we foundthat the mesenchymal-like cancer cells formed a ring-shaped leading front along thetumour edge, which was also seen in experiments (Nurmenniemi et al. 2009) and isoften described as a leader-follower phenomenon in the literature. Nurmenniemi et al.(2009) further observed an averagemaximum invasion depth of 5.47×10⁻²cmover 14days, when culturing HSC-3 cancer cells, a human oral squamous carcinoma cell linewith high metastatic potential, on top of myoma tissue. This translates into an averagemaximum invasion speed of approximately 4.52 × 10⁻⁸cm s−1. It suggests that ourobserved maximum invasion depth of∼0.13cm in 22 days and resulting average max-imum invasion speed of approximately 6.77 × 10⁻⁸cm s−1 is a realistic result, giventhat migration speed varies between cancer cell lines. The distribution of the cancercell spread between the secondary sites that we considered in our model, measuredvia the metastatic cancer cell load and number of metastases at the respective sites,further matched the clinical data of 4181 breast cancer patients, summarised in Fig. 4,which underlie our simulations. As Fig. 9 indicates, the largest micrometastasis, whichresulted from the earliest metastatic spread, occurred at the site of the bones. This isthe most frequently observed site of metastatic spread from primary breast cancer inthe data processed by the Kuhn Laboratory (2017). Overall, we observed two furthersuccessful extravasations to the site of the bones, resulting in both phenotypicallyhomogeneous and heterogeneous secondary growth at this site. The second heaviestcancer cell load, in the form of one heterogeneous micrometastases and one consistingof epithelial-like cancer cells only, was found in the lungs. The least metastatic spreadoccurred to the liver with only three mesenchymal-like DTCs being observed, whicharrived jointly as part of the same successfully extravasated mesenchymal-like can-cer cell cluster. While, of course, stochasticity underpins the results of the metastaticspread, we again found that our results matched the clinical observations summarisedin Fig. 4. To our knowledge, there are currently no data available that claim to deliveran accurate estimation of the typical metastatic load from primary breast cancer tosecondary sites over a specified time frame. However, we believe our result is biolog-ically appropriate with regards to its timing, in correspondence with the conclusionreached by Obenauf and Massagué (2015) in their review of the metastatic traits thatallow cancer cells to colonise various secondary sites, who suggested that CTCs andmetastatic spread can be detected soon after vascularisation of the primary tumour, asin our simulations. Nonetheless, Obenauf and Massagué (2015) argue that the mostlimiting step of the invasion-metastasis cascade is not the dissemination through thevasculature, which we account for in our model, but the transition from infiltrationof a secondary site to overt colonisation. To achieve this final step of colonisation,which is not (yet) part of our modelling framework, the cancer cells need to survivesecondary site-derived detrimental signals and simultaneously exploit secondary site-derived survival signals (Obenauf and Massagué 2015). Also, observed dormancy oftumours over extended periods may occur in the form of pre-angiogenic micrometas-tases that, at a later point in time, acquire the ability to become vascularised (Chamberset al. 2002). As avascular tumours can grow up to 0.1–0.2cm via diffusion only (Folk-man 1990), all metastatic spread observed in our simulation is assumed to fall intothis pre-angiogenic category.
123

A Mathematical Framework for Modelling the Metastatic... 1997
In addition to obtaining expected simulation outcomes on the cell-level, both forprimary tumour growth and secondary spread, by using the baseline parameter set-tings in Table 1, we obtained other biologically realistic and relevant results from thesimulations by varying key parameters.
Changing the initial ratio of mesenchymal-like cancer cells to epithelial-like cancercells emphasised the importance of co-presence of the two cancer cell types for rapidinvasive tumour growth. In particular, it highlighted that cancer cell invasion relies onthe expression of MDEs (and MT1-MMP in particular), which are required to clearthe collagen in the normal tissue of its covalent cross-links, as proposed by Sabehet al. (2009). These results further suggested that a relatively small percentage ofMDE-expressing cancer cells suffices to induce rapid cancer cell invasion.
We observed that higher numbers of mesenchymal-like cancer cells at the primarytumour location increased the number of cancer cell intravasations. Also, cancer cellsfrom primary tumours consisting of a homogeneous epithelial-like cell population didnot intravasate (unless ruptured vessels were present, in which case minimal sheddingoccurred). This coincides with experimental findings by Tsuji et al. (2009). Resultsfrom theirmousemodel indicated that cancer cells originating fromprimary tumours ofhomogeneously mesenchymal-like phenotype could intravasate. The same applied tocancer cells that stemmed from tumours consisting of a combination of epithelial-likeand mesenchymal-like cancer cells. On the contrary, no intravasations were observedwhen the primary tumour consisted of epithelial-like cancer cells only.
The fact that we, as opposed to Tsuji et al. (2009), found a small amount of suc-cessfully intravasated cancer cells, even when our tumour consisted of epithelial-likecancer cells only, was to be expected. This was a result of our inclusion of rupturedvessels in the model, which we considered in accordance with the biological findingsby Bockhorn et al. (2007). Since these blood vessels are ruptured due to trauma orpressure applied from the expanding tumour, no MDEs are required to degrade thevessel wall and thus any cell type can intravasate through a ruptured blood vessel.We verified that the ruptured vessels were indeed the cause of this discrepancy byrerunning the simulations with an initial nodule consisting of epithelial-like cancercells only on a primary grid that solely contained normal blood vessels.
Furthermore, we showed that our model was able to reproduce the survival prob-abilities of single CTCs and of CTC clusters observed in experiments by Luzzi et al.(1998) and Aceto et al. (2014).
Regarding the role of the MDEs in our model, we found that both less MMP-2production as well as less MMP-2 diffusion caused faster cancer cell invasion andthus a higher metastatic cancer cell load after 22 days. If the MMP-2 was too diffusiveor too abundant, it degraded the ECM very rapidly. The result was a ring-shapedarea around the tumour edge, in which the ECM was fully degraded. This causedthe influence of haptotaxis on cancer cell movement to diminish or even to ceasecompletely. Hence, a more local or decreased degradation caused the cancer cells toinvade the tissue more rapidly.
When we reduced the MMP-2 production rate to zero, we observed that the cancercells could effectively invade in the presence ofMT1-MMPonly, which coincides withthe experimental results by Sabeh et al. (2009). On the contrary, when we set theMT1-MMP degradation rate to zero and studied the effects ofMMP-2 degradation alone, we
123

1998 L. C. Franssen et al.
found that the final total primary cancer cell load was significantly reduced comparedto simulations withMT1-MMP present, which showed again the same tendency as theresults by Sabeh et al. (2009). However, contrary to the findings in these experiments,invasion was still possible in our model when considering diffusion-dominated cancercell movement.
To further investigate the reason for this, we reduced the diffusion coefficients ofboth the mesenchymal-like and the epithelial-like cancer cells, resulting in haptotaxis-dominated rather than diffusion-dominated cancer cell movement.We then studied theinvasion of a mixed cancer cell population, consisting of 40% epithelial-like and 60%mesenchymal-like cancer cells, as well as of homogeneous cell populations consistingof mesenchymal-like or epithelial-like cancer cells only, under various MDE-relatedconditions. These conditionswere the presence of bothMT1-MMPandMMP-2 aswellas settings with solely MT1-MMP or solely MMP-2 present. We chose these MDE-related conditions as they correspond to those in experiments conducted by Sabehet al. (2009). We first ran simulations with a heterogeneous initial cancer cell popula-tion and then, to fully match the experimental conditions of Sabeh et al. (2009), withmesenchymal-like cancer cells alone. In both cases,we found that invasionwasnot pos-sible in the presence ofMMP-2 alone,while invasionwas possiblewhenwe consideredMT1-MMP expression alone. Invasion was also possible with both MDEs present butthe invasiondepthwas slightly decreased compared towhenweconsideredMT1-MMPalone. In the case of a heterogeneous initial cell population, we again observed that themesenchymal-like cancer cells formed the invading edge of the tumour by occurringmost abundantly around the central cluster of epithelial-like cancer cells. Further, theepithelial-like cancer cells formed a pattern of finger-like protrusions. The simulationresults observed in the case of a homogeneouslymesenchymal-like cancer cell popula-tion were in qualitative agreement with the experimental results by Sabeh et al. (2009).For these in vitro experiments, HT-1080 cancer cell spheroidswere electroporatedwitha control siRNA, MMP-1 and MMP-2 siRNAs, or MT1 siRNA. These multicellularclusters were then embedded in 3D-type-I collagen gels as central nodules of diameter1.5×10−2–2×10⁻²cm. The invasive patterns of the HT-1080 cells under the variousconditionswere then studied after 3 days.Ourmodel’s results in comparisonwith thoseof Sabeh et al. (2009) are shown in Fig. 17. Finally, we also matched experimentalresults by Gaggioli et al. (2007) confirming that in the case of an initial population ofepithelial-like cancer cells only, invasion is not possible. However, the same epithelial-like population mixed with mesenchymal-like cancer cells could invade.
Since we present a first spatiotemporal modelling framework of metastatic spread,we have focussed on capturing the main steps involved in the invasion-metastasiscascade. In future work, we aim to include more biological detail.
The effect of mutations on cell phenotypes can easily be included in this cell-basedmodelling framework. SinceEMTandMETaremajor factors in themetastatic process,a first natural extension to themodel would be the inclusion of phenotypic switching torepresent permanent and transient transitions between the epithelial and mesenchymalphenotypic state as biologically observed in the invasion-metastasis cascade (Celià-Terrassa et al. 2012). Since our modelling technique is spatially explicit, we could alsoaccount for the fact that EMT has been shown to predominantly occur at the tumourboundary (Tsuji et al. 2009) and that MET has been suggested to contribute to the
123
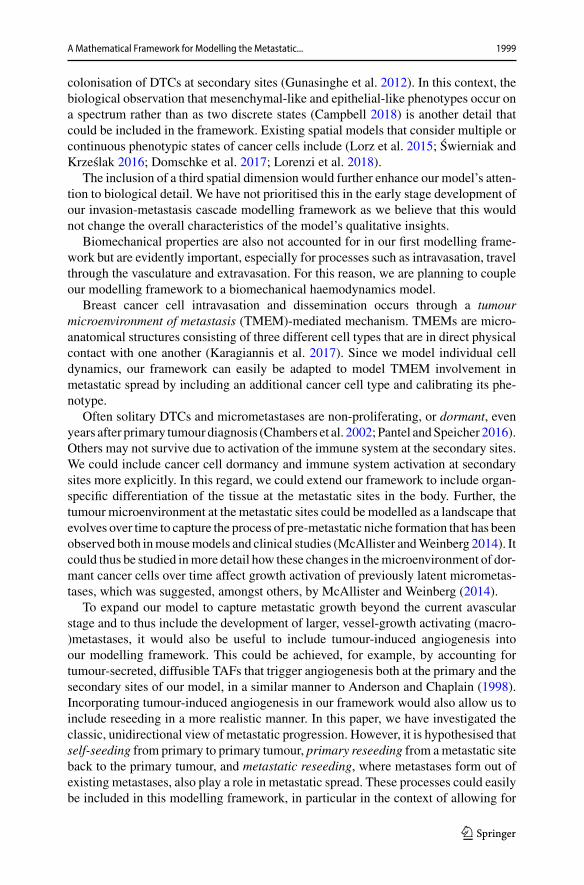
A Mathematical Framework for Modelling the Metastatic... 1999
colonisation of DTCs at secondary sites (Gunasinghe et al. 2012). In this context, thebiological observation that mesenchymal-like and epithelial-like phenotypes occur ona spectrum rather than as two discrete states (Campbell 2018) is another detail thatcould be included in the framework. Existing spatial models that consider multiple orcontinuous phenotypic states of cancer cells include (Lorz et al. 2015; Swierniak andKrzeslak 2016; Domschke et al. 2017; Lorenzi et al. 2018).
The inclusion of a third spatial dimension would further enhance our model’s atten-tion to biological detail. We have not prioritised this in the early stage development ofour invasion-metastasis cascade modelling framework as we believe that this wouldnot change the overall characteristics of the model’s qualitative insights.
Biomechanical properties are also not accounted for in our first modelling frame-work but are evidently important, especially for processes such as intravasation, travelthrough the vasculature and extravasation. For this reason, we are planning to coupleour modelling framework to a biomechanical haemodynamics model.
Breast cancer cell intravasation and dissemination occurs through a tumourmicroenvironment of metastasis (TMEM)-mediated mechanism. TMEMs are micro-anatomical structures consisting of three different cell types that are in direct physicalcontact with one another (Karagiannis et al. 2017). Since we model individual celldynamics, our framework can easily be adapted to model TMEM involvement inmetastatic spread by including an additional cancer cell type and calibrating its phe-notype.
Often solitary DTCs and micrometastases are non-proliferating, or dormant, evenyears after primary tumour diagnosis (Chambers et al. 2002; Pantel andSpeicher 2016).Others may not survive due to activation of the immune system at the secondary sites.We could include cancer cell dormancy and immune system activation at secondarysites more explicitly. In this regard, we could extend our framework to include organ-specific differentiation of the tissue at the metastatic sites in the body. Further, thetumour microenvironment at the metastatic sites could be modelled as a landscape thatevolves over time to capture the process of pre-metastatic niche formation that has beenobserved both inmousemodels and clinical studies (McAllister andWeinberg 2014). Itcould thus be studied inmore detail how these changes in themicroenvironment of dor-mant cancer cells over time affect growth activation of previously latent micrometas-tases, which was suggested, amongst others, by McAllister and Weinberg (2014).
To expand our model to capture metastatic growth beyond the current avascularstage and to thus include the development of larger, vessel-growth activating (macro-)metastases, it would also be useful to include tumour-induced angiogenesis intoour modelling framework. This could be achieved, for example, by accounting fortumour-secreted, diffusible TAFs that trigger angiogenesis both at the primary and thesecondary sites of our model, in a similar manner to Anderson and Chaplain (1998).Incorporating tumour-induced angiogenesis in our framework would also allow us toinclude reseeding in a more realistic manner. In this paper, we have investigated theclassic, unidirectional view of metastatic progression. However, it is hypothesised thatself-seeding from primary to primary tumour, primary reseeding from ametastatic siteback to the primary tumour, and metastatic reseeding, where metastases form out ofexisting metastases, also play a role in metastatic spread. These processes could easilybe included in this modelling framework, in particular in the context of allowing for
123
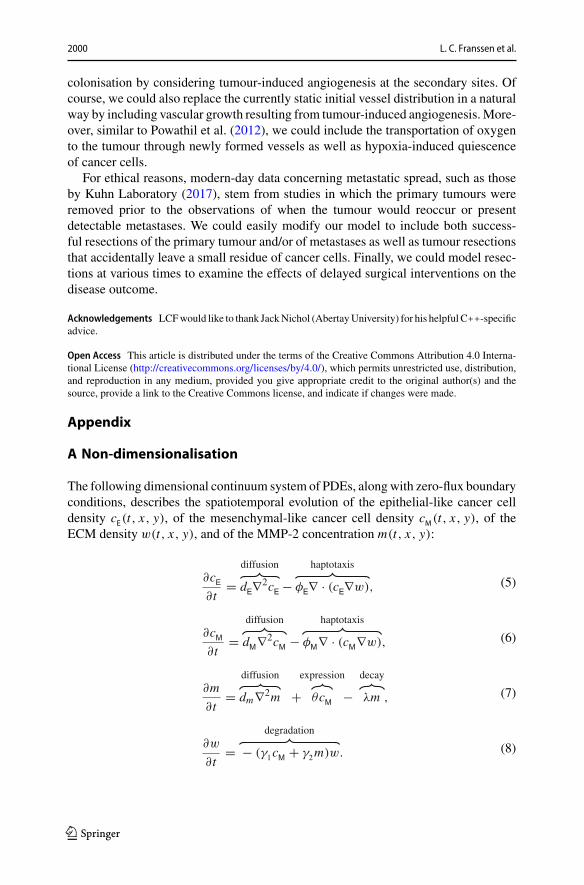
2000 L. C. Franssen et al.
colonisation by considering tumour-induced angiogenesis at the secondary sites. Ofcourse, we could also replace the currently static initial vessel distribution in a naturalway by including vascular growth resulting from tumour-induced angiogenesis.More-over, similar to Powathil et al. (2012), we could include the transportation of oxygento the tumour through newly formed vessels as well as hypoxia-induced quiescenceof cancer cells.
For ethical reasons, modern-day data concerning metastatic spread, such as thoseby Kuhn Laboratory (2017), stem from studies in which the primary tumours wereremoved prior to the observations of when the tumour would reoccur or presentdetectable metastases. We could easily modify our model to include both success-ful resections of the primary tumour and/or of metastases as well as tumour resectionsthat accidentally leave a small residue of cancer cells. Finally, we could model resec-tions at various times to examine the effects of delayed surgical interventions on thedisease outcome.
Acknowledgements LCFwould like to thank JackNichol (AbertayUniversity) for his helpful C++-specificadvice.
Open Access This article is distributed under the terms of the Creative Commons Attribution 4.0 Interna-tional License (http://creativecommons.org/licenses/by/4.0/), which permits unrestricted use, distribution,and reproduction in any medium, provided you give appropriate credit to the original author(s) and thesource, provide a link to the Creative Commons license, and indicate if changes were made.
Appendix
A Non-dimensionalisation
The following dimensional continuum system of PDEs, alongwith zero-flux boundaryconditions, describes the spatiotemporal evolution of the epithelial-like cancer celldensity cE(t, x, y), of the mesenchymal-like cancer cell density cM(t, x, y), of theECM density w(t, x, y), and of the MMP-2 concentration m(t, x, y):
∂cE∂t
= dE∇2cE − φE∇ · (cE∇w),
diffusion haptotaxis
(5)
∂cM∂t
= dM∇2cM − φM∇ · (cM∇w),
diffusion haptotaxis
(6)
∂m
∂t= dm∇2m + θcM − λm ,
diffusion expression decay
(7)
∂w
∂t= − (γ1cM + γ2m)w.
degradation
(8)
123

A Mathematical Framework for Modelling the Metastatic... 2001
We non-dimensionalise the system in coherence with Anderson et al. (2000). So,we choose to rescale distance with a length scale L = 0.2cm, which represents anappropriate choice for the maximum invasion distance of cancer cells at an early stageof cancer growth, and rescale time by τ = L2
D , where D = e − 6cm2s−1 is a referencechemical diffusion coefficient, such that τ = 4×10⁴ s,which gives approximately 11h.We non-dimensionalise our model by setting t = t
τ, x = x
L , y = yL , cE(t, x, y) =
cE (t,x,y)cE
, cM(t, x, y) = cM (t,x,y)cM
, m(t, x, y) = m(t,x,y)m and w(t, x, y) = w(t,x,y)
w,
where cE , cM , m and w are appropriate reference parameters. When substituting theseinto the system of PDEs (5)–(8) and dropping the tildes for better readability, weobtain
∂cE∂t
= DE∇2cE − ΦE∇ · (cE∇w), (9)
∂cM∂t
= DM∇2cM − ΦM∇ · (cM∇w), (10)
∂m
∂t= Dm∇2m + ΘcM − Λm, (11)
∂w
∂t= −(Γ1cM + Γ2m)w, (12)
where DE = τdEL2 = dE
D , ΦE = τφE w
L2 = φE w
D , DM = τdML2 = dM
D , ΦM = τφM w
L2 =φM w
D , Dm = τdmL2 = dm
D , Θ = τθ cMm , Λ = τλ, Γ1 = τ cMγ1 , and Γ2 = τ mγ2 .
To choose biologically realistic parameter values for our model, we consult biolog-ical publications on the topic (Stokes et al. 1990; Bray 1992; Luzzi et al. 1998; Menget al. 2004; Milo et al. 2009; Collier et al. 2011; Vajtai 2013; Aceto et al. 2014; KuhnLaboratory 2017) as well as comparable PDE models (Anderson et al. 2000; Deakinand Chaplain 2013). An overview of the parameter values used together with theirmathematical and experimental origin is found in Table 1.
B Hybrid Approach Outline
We fix a time step Δt and set tn = nΔt . We discretise each of the G + 1 squaredomains using a uniform mesh with step size Δx = Δy = 1
l . We set xi = iΔx andy j = jΔy, where i, j ∈ [0, l] ⊂ N0. We continue by approximating the MMP-2concentration m(t, x, y) and the ECM density w(t, x, y) by discrete values mn
i, j andwni, j , respectively, and denote the number of epithelial- and mesenchymal-like cancer
cells on grid point (xi , y j ) at time tn by cEni, j and cM
ni, j , respectively.
123
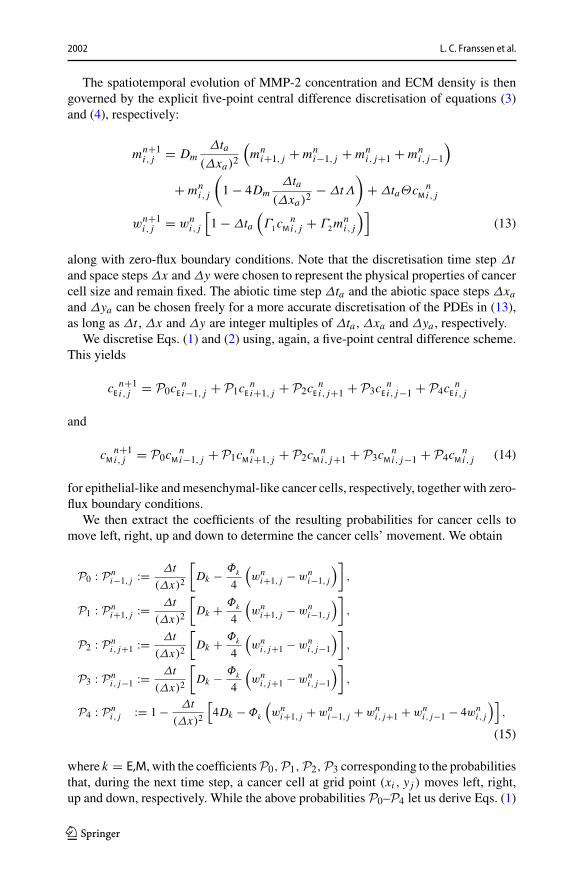
2002 L. C. Franssen et al.
The spatiotemporal evolution of MMP-2 concentration and ECM density is thengoverned by the explicit five-point central difference discretisation of equations (3)and (4), respectively:
mn+1i, j = Dm
Δta(Δxa)2
(mn
i+1, j + mni−1, j + mn
i, j+1 + mni, j−1
)
+ mni, j
(1 − 4Dm
Δta(Δxa)2
− ΔtΛ
)+ ΔtaΘcM
ni, j
wn+1i, j = wn
i, j
[1 − Δta
(Γ1cM
ni, j + Γ2m
ni, j
)](13)
along with zero-flux boundary conditions. Note that the discretisation time step Δtand space steps Δx and Δy were chosen to represent the physical properties of cancercell size and remain fixed. The abiotic time step Δta and the abiotic space steps Δxaand Δya can be chosen freely for a more accurate discretisation of the PDEs in (13),as long as Δt , Δx and Δy are integer multiples of Δta , Δxa and Δya , respectively.
We discretise Eqs. (1) and (2) using, again, a five-point central difference scheme.This yields
cEn+1i, j = P0cE
ni−1, j + P1cE
ni+1, j + P2cE
ni, j+1 + P3cE
ni, j−1 + P4cE
ni, j
and
cMn+1i, j = P0cM
ni−1, j + P1cM
ni+1, j + P2cM
ni, j+1 + P3cM
ni, j−1 + P4cM
ni, j (14)
for epithelial-like andmesenchymal-like cancer cells, respectively, together with zero-flux boundary conditions.
We then extract the coefficients of the resulting probabilities for cancer cells tomove left, right, up and down to determine the cancer cells’ movement. We obtain
P0 : Pni−1, j := Δt
(Δx)2
[Dk − Φk
4
(wni+1, j − wn
i−1, j
)],
P1 : Pni+1, j := Δt
(Δx)2
[Dk + Φk
4
(wni+1, j − wn
i−1, j
)],
P2 : Pni, j+1 := Δt
(Δx)2
[Dk + Φk
4
(wni, j+1 − wn
i, j−1
)],
P3 : Pni, j−1 := Δt
(Δx)2
[Dk − Φk
4
(wni, j+1 − wn
i, j−1
)],
P4 : Pni, j := 1 − Δt
(Δx)2
[4Dk − Φk
(wni+1, j + wn
i−1, j + wni, j+1 + wn
i, j−1 − 4wni, j
)],
(15)
where k = E,M, with the coefficientsP0,P1,P2,P3 corresponding to the probabilitiesthat, during the next time step, a cancer cell at grid point (xi , y j ) moves left, right,up and down, respectively. While the above probabilities P0–P4 let us derive Eqs. (1)
123
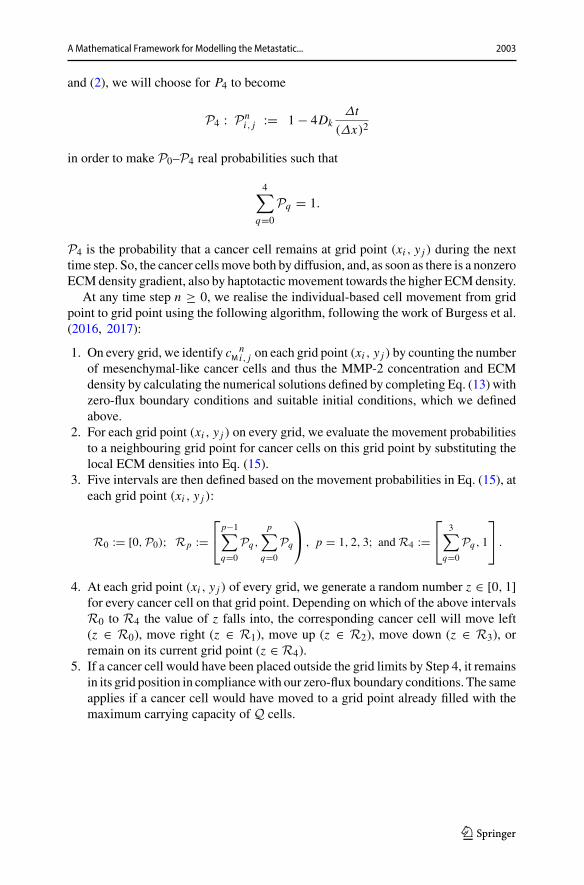
A Mathematical Framework for Modelling the Metastatic... 2003
and (2), we will choose for P4 to become
P4 : Pni, j := 1 − 4Dk
Δt
(Δx)2
in order to make P0–P4 real probabilities such that
4∑q=0
Pq = 1.
P4 is the probability that a cancer cell remains at grid point (xi , y j ) during the nexttime step. So, the cancer cellsmove both by diffusion, and, as soon as there is a nonzeroECMdensity gradient, also by haptotactic movement towards the higher ECMdensity.
At any time step n ≥ 0, we realise the individual-based cell movement from gridpoint to grid point using the following algorithm, following the work of Burgess et al.(2016, 2017):
1. On every grid, we identify cMni, j on each grid point (xi , y j ) by counting the number
of mesenchymal-like cancer cells and thus the MMP-2 concentration and ECMdensity by calculating the numerical solutions defined by completing Eq. (13) withzero-flux boundary conditions and suitable initial conditions, which we definedabove.
2. For each grid point (xi , y j ) on every grid, we evaluate the movement probabilitiesto a neighbouring grid point for cancer cells on this grid point by substituting thelocal ECM densities into Eq. (15).
3. Five intervals are then defined based on the movement probabilities in Eq. (15), ateach grid point (xi , y j ):
R0 := [0,P0); Rp :=⎡⎣
p−1∑q=0
Pq ,
p∑q=0
Pq
⎞⎠ , p = 1, 2, 3; and R4 :=
⎡⎣
3∑q=0
Pq , 1
⎤⎦ .
4. At each grid point (xi , y j ) of every grid, we generate a random number z ∈ [0, 1]for every cancer cell on that grid point. Depending on which of the above intervalsR0 to R4 the value of z falls into, the corresponding cancer cell will move left(z ∈ R0), move right (z ∈ R1), move up (z ∈ R2), move down (z ∈ R3), orremain on its current grid point (z ∈ R4).
5. If a cancer cell would have been placed outside the grid limits by Step 4, it remainsin its grid position in compliancewith our zero-flux boundary conditions. The sameapplies if a cancer cell would have moved to a grid point already filled with themaximum carrying capacity of Q cells.
123

2004 L. C. Franssen et al.
C Figures
See Figs. 18, 19 and 20.
Fig. 18 Simulation results on secondary grid representing the bones. Distribution of MMP-2 concentration(top panels) and ECMdensity (bottom panels) at the secondary site of the bones is shown at times 24,000Δt(left) and 48,000Δt (right). This corresponds to∼11 days and∼22 days, respectively. TheMMP-2 concen-tration ranges from 0 (white) to 3.4737 × 10⁻² (black) and the ECM density from 0.17559 (light grey) to1 (black). The red grid points represent blood vessels, through which cancer cells can extravasate. Figure 9shows the corresponding plots of the cancer cell distributions. The scale bar denotes 0.02 cm and appliesto all of the panels (Colour figure online)
123

A Mathematical Framework for Modelling the Metastatic... 2005
Fig. 19 Simulation results on secondary grid representing the lungs. Distribution of MMP-2 concentration(upper panels) and ECMdensity (lower panels) at the secondary site of the lungs is shown at times 24,000Δt(left) and 48,000Δt (right). This corresponds to∼11 days and∼22 days, respectively. TheMMP-2 concen-tration ranges from 0 (white) to 1.5876×10⁻² (black) and the ECM density from 0.41137 (light grey) to 1(black). The red grid points represent blood vessels, through which cancer cells can extravasate. Figure 10shows the corresponding plots of the cancer cell distributions. The scale bar denotes 0.02 cm and appliesto all of the panels (Colour figure online)
123

2006 L. C. Franssen et al.
Fig. 20 Simulation results on secondary grid representing the liver. Distribution of MMP-2 concentration(top panels) and ECM density (bottom panels) at the secondary site of the liver is shown at times 24,000Δt(left) and 48,000Δt (right). This corresponds to∼11 days and∼22 days, respectively. TheMMP-2 concen-tration ranges from 0 (white) to 3.7129× 10⁻³ (black) and the ECM density from 0.58015 (light grey) to 1(black). The red grid points represent blood vessels, through which cancer cells can extravasate. Figure 11shows the corresponding plots of the cancer cell distributions. The scale bar denotes 0.02 cm and appliesto all of the panels (Colour figure online)
References
Aceto N, Bardia A, Miyamoto DT, Donaldson MC, Wittner BS, Spencer JA, Yu M, Pely A, EngstromA, Zhu H, Brannigan BW (2014) Circulating tumor cell clusters are oligoclonal precursors of breastcancer metastasis. Cell 158(5):1110–1122
Ambrosi D, Preziosi L (2002) On the closure of mass balance models for tumor growth. Math ModelsMethods Appl Sci 12(05):737–754
Andasari V, Gerisch A, Lolas G, South AP, Chaplain MA (2011) Mathematical modeling of cancer cellinvasion of tissue: biological insight frommathematical analysis and computational simulation. JMathBiol 63(1):141–171
AndersonAR(2005)Ahybridmathematicalmodel of solid tumour invasion: the importanceof cell adhesion.Math Med Biol 22(2):163–186
Anderson AR, ChaplainMA (1998) Continuous and discrete mathematical models of tumor-induced angio-genesis. Bull Math Biol 60(5):857–899
Anderson AR, Chaplain MA, Newman EL, Steele RJ, Thompson AM (2000) Mathematical modelling oftumour invasion and metastasis. Comput Math Methods Med 2(2):129–154
Armstrong NJ, Painter KJ, Sherratt JA (2006) A continuum approach to modelling cell-cell adhesion. JTheor Biol 243(1):98–113
123
A Mathematical Framework for Modelling the Metastatic... 2007
Barbolosi D, Benabdallah A, Hubert F, Verga F (2009) Mathematical and numerical analysis for a modelof growing metastatic tumors. Math Biosci 218(1):1–14
Bartoszynski R, Edler L, Hanin L, Kopp-Schneider A, Pavlova L, Tsodikov A, Zorin A, Yakovlev AY(2001) Modeling cancer detection: tumor size as a source of information on unobservable stages ofcarcinogenesis. Math Biosci 171(2):113–142
Benzekry S (2011) Mathematical analysis of a two-dimensional population model of metastatic growthincluding angiogenesis. J Evol Equ 11(1):187–213
Benzekry S, Tracz A,Mastri M, Corbelli R, Barbolosi D, Ebos JM (2016)Modeling spontaneous metastasisfollowing surgery: an in vivo-in silico approach. Cancer Res 76(3):535–547
Bianconi E, Piovesan A, Facchin F, Beraudi A, Casadei R, Frabetti F, Vitale L, Pelleri MC, Tassani S, PivaF, Perez-Amodio S (2013) An estimation of the number of cells in the human body. Ann Hum Biol40(6):463–471
Bockhorn M, Jain RK, Munn LL (2007) Active versus passive mechanisms in metastasis: do cancer cellscrawl into vessels, or are they pushed? Lancet Oncol 8(5):444–448
Bray D (1992) Cell movements. Garland Publishing, New YorkBurgess AE, Schofield PG, Hubbard SF, Chaplain MA, Lorenzi T (2016) Dynamical patterns of coexisting
strategies in a hybrid discrete-continuum spatial evolutionary game model. Math Model Nat Phenom11(5):49–64
Burgess AE, Lorenzi T, Schofield PG, Hubbard SF, Chaplain MA (2017) Examining the role of individualmovement in promoting coexistence in a spatially explicit prisoner’s dilemma. J Theor Biol 419:323–332
Campbell K (2018) Contribution of epithelial-mesenchymal transitions to organogenesis and cancer metas-tasis. Curr Opin Cell Biol 55:30–35
Cavallaro U, Christofori G (2001) Cell adhesion in tumor invasion and metastasis: loss of the glue is notenough. Biochim Biophys Acta 1552(1):39–45
Celià-Terrassa T, Meca-Cortés Ó, Mateo F, de Paz AM, Rubio N, Arnal-Estapé A, Ell BJ, Bermudo R,Díaz A, Guerra-Rebollo M, Lozano JJ (2012) Epithelial-mesenchymal transition can suppress majorattributes of human epithelial tumor-initiating cells. J Clin Investig 122(5):1849–1868
Chambers AF, Groom AC, MacDonald IC (2002) Metastasis: Dissemination and growth of cancer cells inmetastatic sites. Nat Rev Cancer 2(8):563–572
Chaplain MA, Lolas G (2005) Mathematical modelling of cancer cell invasion of tissue: the role of theurokinase plasminogen activation system. Math Models Methods Appl Sci 15(11):1685–1734
ChaplainMA, Lolas G (2006)Mathematical modelling of cancer invasion of tissue: dynamic heterogeneity.Netw Heterog Media 1(3):399–439
Chaplain MA, Lachowicz M, Szymanska Z, Wrzosek D (2011) Mathematical modelling of cancer inva-sion: the importance of cell–cell adhesion and cell–matrix adhesion. Math Models Methods Appl Sci21(04):719–743
Cisneros LH, Newman TJ (2014) Quantifying metastatic inefficiency: rare genotypes versus rare dynamics.Phys Biol 11(4):046003
Collier IE, Legant W, Marmer B, Lubman O, Saffarian S, Wakatsuki T, Elson E, Goldberg GI (2011)Diffusion of MMPs on the surface of collagen fibrils: the mobile cell surface–collagen substratuminterface. PLoS ONE 6(9):e24029
Deakin NE, Chaplain MA (2013) Mathematical modeling of cancer invasion: the role of membrane-boundmatrix metalloproteinases. Front Oncol 3:70
Deutsch A, Dormann S (2005)Mathematical modeling of biological pattern formation. Springer, NewYorkDevys A, Goudon T, Lafitte P (2009) A model describing the growth and the size distribution of multiple
metastatic tumors. Discrete Cont Dyn-B 12:731–767Dingli D, Michor F, Antal T, Pacheco JM (2007) The emergence of tumor metastases. Cancer Biol Ther
6(3):383–390Domschke P, Trucu D, Gerisch A, Chaplain MA (2014) Mathematical modelling of cancer invasion: impli-
cations of cell adhesion variability for tumour infiltrative growth patterns. J Theor Biol 361:41–60Domschke P, Trucu D, Gerisch A, Chaplain MA (2017) Structured models of cell migration incorporating
molecular binding processes. J Math Biol 75(6–7):1517–1561Enderling H, Anderson AR, Chaplain MA, Beheshti A, Hlatky L, Hahnfeldt P (2009) Paradoxical depen-
dencies of tumor dormancy and progression on basic cell kinetics. Cancer Res 69(22):8814–8821Fidler IJ (2003) The pathogenesis of cancer metastasis: the ‘seed and soil’ hypothesis revisited. Nat Rev
Cancer 3(6):453–458
123

2008 L. C. Franssen et al.
Folkman J (1990)What is the evidence that tumors are angiogenesis dependent? JNatl Cancer Inst 82(1):4–7Folkman J, Klagsbrun M (1987) Angiogenic factors. Science 235(4787):442–447Francart ME, Lambert J, Vanwynsberghe AM, Thompson EW, Bourcy M, Polette M, Gilles C (2018)
Epithelial-mesenchymal plasticity and circulating tumor cells: travel companions to metastases. DevDyn 247(3):432–450
Friedl P, Wolf K (2003) Tumour-cell invasion and migration: diversity and escape mechanisms. Nat RevCancer 3(5):362–374
Friedl P, Locker J, Sahai E, Segall JE (2012) Classifying collective cancer cell invasion. Nat Cell Biol14(8):777–783
Gaggioli C, Hooper S, Hidalgo-Carcedo C, Grosse R,Marshall JF, Harrington K, Sahai E (2007) Fibroblast-led collective invasion of carcinoma cells with differing roles for RhoGTPases in leading and followingcells. Nat Cell Biol 9(12):1392
Gatenby RA (1991) Population ecology issues in tumor growth. Cancer Res 51(10):2542–2547Gatenby RA (1995a) Models of tumor-host interaction as competing populations: implications for tumor
biology and treatment. J Theor Biol 176(4):447–455Gatenby RA (1995b) The potential role of transformation-induced metabolic changes in tumor-host inter-
action. Cancer Res 55(18):4151–4156GatenbyRA,Gawlinski ET (1996)A reaction–diffusionmodel of cancer invasion. CancerRes 56(24):5745–
5753Gerisch A, Chaplain MA (2008) Mathematical modelling of cancer cell invasion of tissue: local and non-
local models and the effect of adhesion. J Theor Biol 250(4):684–704Giese A, Loo MA, Tran N, Haskett D, Coons SW, Berens ME (1996) Dichotomy of astrocytoma migration
and proliferation. Int J Cancer 67(2):275–282Gunasinghe ND, Wells A, Thompson EW, Hugo HJ (2012) Mesenchymal-epithelial transition (MET) as a
mechanism for metastatic colonisation in breast cancer. Cancer Metastasis Rev 31(3–4):469–478Gupta GP, Massagué J (2006) Cancer metastasis: building a framework. Cell 127(4):679–695Haeno H, Michor F (2010) The evolution of tumor metastases during clonal expansion. J Theor Biol
263(1):30–44Haeno H, Iwasa Y, Michor F (2007) The evolution of two mutations during clonal expansion. Genetics
177(4):2209–2221Hahnfeldt P, Panigrahy D, Folkman J, Hlatky L (1999) Tumor development under angiogenic signaling:
a dynamical theory of tumor growth, treatment response, and postvascular dormancy. Cancer Res59(19):4770–4775
Hallou A, Jennings J, Kabla AJ (2017) Tumour heterogeneity promotes collective invasion and cancermetastatic dissemination. R Soc Open Sci 4(8):161007
Hanahan D, Weinberg RA (2000) The hallmarks of cancer. Cell 100(1):57–70Hanin L, Rose J, Zaider M (2006) A stochastic model for the sizes of detectable metastases. J Theor Biol
243(3):407–417HartungN,Mollard S,BarbolosiD,BenabdallahA,ChapuisatG,HenryG,Giacometti S, IliadisA,Ciccolini
J, Faivre C, Hubert F (2014) Mathematical modeling of tumor growth and metastatic spreading:validation in tumor-bearing mice. Cancer Res 74(22):6397–6407
HatzikirouH,DeutschA (2008)Cellular automata asmicroscopicmodels of cellmigration in heterogeneousenvironments. Curr Top Dev Biol 81:401–434
Iwasa Y, Nowak MA, Michor F (2006) Evolution of resistance during clonal expansion. Genetics172(4):2557–2566
Iwata K, Kawasaki K, Shigesada N (2000) A dynamical model for the growth and size distribution ofmultiple metastatic tumors. J Theor Biol 203(2):177–186
Jie XX, Zhang XY, Xu CJ (2017) Epithelial-to-mesenchymal transition, circulating tumor cells and cancermetastasis: mechanisms and clinical applications. Oncotarget 8(46):81558
Kabla AJ (2012) Collective cell migration: leadership, invasion and segregation. J Royal Soc Interface prsif20120448
Kalluri R,Weinberg RA (2009) The basics of epithelial-mesenchymal transition. J Clin Invest 119(6):1420–1428
Kansal A, Torquato S, Harsh Iv G, Chiocca E, Deisboeck T (2000) Cellular automaton of idealized braintumor growth dynamics. Biosystems 55(1):119–127
Karagiannis GS, Pastoriza JM, Wang Y, Harney AS, Entenberg D, Pignatelli J, Sharma VP, Xue EA, ChengE, D’Alfonso TM, Jones JG, Anampa J, Rohan TE, Sparano JA, Condeelis JS, Oktay MH (2017)
123

A Mathematical Framework for Modelling the Metastatic... 2009
Neoadjuvant chemotherapy induces breast cancer metastasis through a TMEM-mediated mechanism.Sci Transl Med 9(397):eaan0026
Kuhn Laboratory (2017) Breast Cancer Progression Models. http://kuhn.usc.edu/breast_cancer/. Accessed22 Oct 2017
Lambert AW, Pattabiraman DR, Weinberg RA (2017) Emerging biological principles of metastasis. Cell168(4):670–691
Liotta LA, Saidel GM, Kleinerman J (1976) Stochastic model of metastases formation. Biometrics 32:535–550
Liotta LA, Delisi C, Saidel G, Kleinerman J (1977) Micrometastases formation: a probabilistic model.Cancer Lett 3:203–208
Lorenzi T, Venkataraman C, Lorz A, Chaplain MA (2018) The role of spatial variations of abiotic factorsin mediating intratumour phenotypic heterogeneity. J Theor Biol 451:101–110
Lorz A, Lorenzi T, Clairambault J, Escargueil A, Perthame B (2015)Modeling the effects of space structureand combination therapies on phenotypic heterogeneity and drug resistance in solid tumors. Bull MathBiol 77(1):1–22
Luzzi KJ,MacDonald IC, Schmidt EE, Kerkvliet N,Morris VL, Chambers AF, GroomAC (1998)Multistepnature of metastatic inefficiency: dormancy of solitary cells after successful extravasation and limitedsurvival of early micrometastases. Am J Pathol 153(3):865–873
Margarit DH, Romanelli L (2016) A mathematical model of absorbing Markov chains to understand theroutes of metastasis. Biomath 5(1):1607281
McAllister SS, Weinberg RA (2014) The tumour-induced systemic environment as a critical regulator ofcancer progression and metastasis. Nat Cell Biol 16(8):717–727
Meng S, Tripathy D, Frenkel EP, Shete S, Naftalis EZ, Huth JF, Beitsch PD, Leitch M, Hoover S, Euhus D,Haley B, Morrison L, Fleming TP, Herlyn D, Terstappen LWMM, Fehm T, Tucker TF, Lane N, WangJ, Uhr JW (2004) Circulating tumor cells in patients with breast cancer dormancy. Clin Cancer Res10(24):8152–8162
Micalizzi DS, Farabaugh SM, Ford HL (2010) Epithelial-mesenchymal transition in cancer: parallelsbetween normal development and tumor progression. J Mammary Gland Biol Neoplasia 15(2):117–134
Michor F, Iwasa Y (2006) Dynamics of metastasis suppressor gene inactivation. J Theor Biol 241(3):676–689
Michor F, Nowak MA, Iwasa Y (2006) Stochastic dynamics of metastasis formation. J Theor Biol240(4):521–530
Milo R, Jorgensen P, Moran U, Weber G, Springer M (2009) Bionumbers–the database of key numbersin molecular and cell biology. Nucleic acids res 38(suppl_1):D750–D753, http://bionumbers.hms.harvard.edu/bionumber.aspx?&id=100685&ver=21. Accessed 22 Oct 2017
Newton PK, Mason J, Bethel K, Bazhenova L, Nieva J, Norton L, Kuhn P (2013) Spreaders and spongesdefine metastasis in lung cancer: a Markov chain Monte Carlo mathematical model. Cancer Res73(9):2760–2769
Newton PK, Mason J, Venkatappa N, Jochelson MS, Hurt B, Nieva J, Comen E, Norton L, Kuhn P (2015)Spatiotemporal progression of metastatic breast cancer: a Markov chain model highlighting the roleof early metastatic sites. NPJ Breast Cancer 1(15):018
Nurmenniemi S, Sinikumpu T, Alahuhta I, Salo S, Sutinen M, Santala M, Risteli J, Nyberg P, Salo T (2009)A novel organotypic model mimics the tumor microenvironment. Am J Pathol 175(3):1281–1291
Obenauf AC,Massagué J (2015) Surviving at a distance: organ-specific metastasis. Trends Cancer 1(1):76–91
Paget S (1889) The distribution of secondary growths in cancer of the breast. Lancet 133(3421):571–573Painter KJ, Hillen T (2013) Mathematical modelling of glioma growth: the use of diffusion tensor imaging
(DTI) data to predict the anisotropic pathways of cancer invasion. J Theor Biol 323:25–39Pantel K, Speicher M (2016) The biology of circulating tumor cells. Oncogene 35(10):1216Perumpanani AJ, Sherratt JA, Norbury J, Byrne HM (1996) Biological inferences from a mathematical
model for malignant invasion. Invas Metastasis 16:209–22lPopławski NJ, Agero U, Gens JS, Swat M, Glazier JA, Anderson AR (2009) Front instabilities and inva-
siveness of simulated avascular tumors. Bull Math Biol 71(5):1189–1227Powathil GG, Gordon KE, Hill LA, Chaplain MA (2012) Modelling the effects of cell-cycle heterogeneity
on the response of a solid tumour to chemotherapy: biological insights from a hybridmultiscale cellularautomaton model. J Theor Biol 308:1–19
123
2010 L. C. Franssen et al.
Rejniak KA, Anderson AR (2011) Hybrid models of tumor growth. Wiley Interdiscip Rev Syst Biol Med3(1):115–125
Sabeh F, Shimizu-Hirota R, Weiss SJ (2009) Protease-dependent versus-independent cancer cell invasionprograms: three-dimensional amoeboid movement revisited. J Cell Biol 185(1):11–19
Saidel GM, Liotta LA, Kleinerman J (1976) System dynamics of a metastatic process from an implantedtumor. J Theor Biol 56(2):417–434
Scianna M, Preziosi L, Wolf K (2013) A cellular Potts model simulating cell migration on and in matrixenvironments. Math Biosci Eng 10(1):235–261
Scott JG, Basanta D, Anderson AR, Gerlee P (2013) A mathematical model of tumour self-seeding revealssecondarymetastatic deposits as drivers of primary tumour growth. J R Soc Interface 10(82):20130011
Sfakianakis N, Madzvamuse A, Chaplain MA (2018) A hybrid multiscale model for cancer invasion of theextracellular matrix. Preprint arXiv:1805.10541
Sherratt JA,Gourley SA,ArmstrongNJ, PainterKJ (2009)Boundedness of solutions of a non-local reaction-diffusionmodel for adhesion in cell aggregation and cancer invasion. Eur J ApplMath 20(01):123–144
Stokes C, Rupnick M, Williams S, Lauffenburger D (1990) Chemotaxis of human microvessel endothelialcells in response to acidic fibroblast growth factor. Lab Invest 63(5):657–668
Strilic B, Yang L, Albarrán-Juárez J, Wachsmuth L, Han K, Müller UC, Pasparakis M, Offermanns S(2016) Tumour-cell-induced endothelial cell necroptosis via death receptor 6 promotes metastasis.Nature 536(7615):215–218
Swierniak A, Krzeslak M (2016) Cancer heterogeneity and multilayer spatial evolutionary games. BiolDirect 11(1):53
Talmadge JE, Fidler IJ (2010) AACR centennial series: the biology of cancer metastasis: historical perspec-tive. Cancer Res 70(14):5649–5669
Tsuji T, Ibaragi S, Hu GF (2009) Epithelial-mesenchymal transition and cell cooperativity in metastasis.Cancer Res 69(18):7135–7139
Turner S, Sherratt JA (2002) Intercellular adhesion and cancer invasion: a discrete simulation using theextended Potts model. J Theor Biol 216(1):85–100
Vajtai R (2013) Springer handbook of nanomaterials. Springer, New YorkValastyan S, Weinberg RA (2011) Tumor metastasis: molecular insights and evolving paradigms. Cell
147(2):275–292Weinberg R (2013) The biology of cancer. Garland Science, Boca RatonWong SY, Hynes RO (2006) Lymphatic or hematogenous dissemination: how does a metastatic tumor cell
decide? Cell cycle 5(8):812–817Xu JL, Prorok PC (1998) Estimating a distribution function of the tumor size at metastasis. Biometrics
54:859–864Zhang L, Wang Z, Sagotsky JA, Deisboeck TS (2009) Multiscale agent-based cancer modeling. J Math
Biol 58(4–5):545–559
Publisher’s Note Springer Nature remains neutral with regard to jurisdictional claims in published mapsand institutional affiliations.
Affiliations
Linnea C. Franssen1 · Tommaso Lorenzi1 · Andrew E. F. Burgess2 ·Mark A. J. Chaplain1
1 School of Mathematics and Statistics, University of St Andrews, St Andrews, UK
2 Division of Mathematics, University of Dundee, Dundee, UK
123