A market approach for valuing wind farm assets Global · PDF fileA market approach for...
24
A market approach for valuing wind farm assets Global results April 2014
Transcript of A market approach for valuing wind farm assets Global · PDF fileA market approach for...
A market approach for valuing wind farm assetsGlobal results
April 2014

Table of contents
1. Foreword
2. Executive summary
3. Methodology
4. Onshore transaction analysis
5. Offshore transaction analysis
Appendix A – summary of transaction data from the onshore wind farm industry
Appendix B – regression output – onshore wind farm analysis
Appendix C – summary of transaction data from the offshore wind farm industry
Appendix D – regression output – offshore wind farm analysis
Order form for geographical analysis and transaction details
About Financial Advisory Services
Deloitte contacts
Terms and conditions:• This article and all of its content are property of Deloitte Statsautoriseret Revisionspartnerselskab (“Deloitte”) and protected by DK and International property
rights and laws. You may not publish, distribute or otherwise disclose the article or any of its content to any third party or use for commercial purposes any mate-rial or results therein.
• Deloitte has not verified the information referred to in the article (or the information gathered with connection to those transactions included in the datasets and models).
• While every care has been taken in the compilation of the article and the analyses and results therein and every attempt has been made to present up-to-date and accurate information, we cannot guarantee that inaccuracies do not occur.
• Deloitte takes no responsibility for any direct or indirect losses, damages, costs or expenses which arise from or in any connection with the use of the article, in-cluding but not limited to investment decisions and financial decisions based on the article.
• Deloitte Statsautoriseret Revisionspartnerselskab is a member of the DTTL network which refers to Deloitte Touche Tohmatsu Limited, a UK private company limit-ed by guarantee, and its network of member firms and their affiliates, predecessors, successors and representatives as well as partners, managements, members, owners, directors, managers, employees, subcontractors and agents of all such entities operating under the names of “Deloitte”, “Deloitte Touche”, “Deloitte Touche Tohmatsu” or other related names. The member firms are legally separate and independent entities and have no liability for each other’s acts or omissions.
3457
1216171819202122
3A market approach for valuing wind farm assets
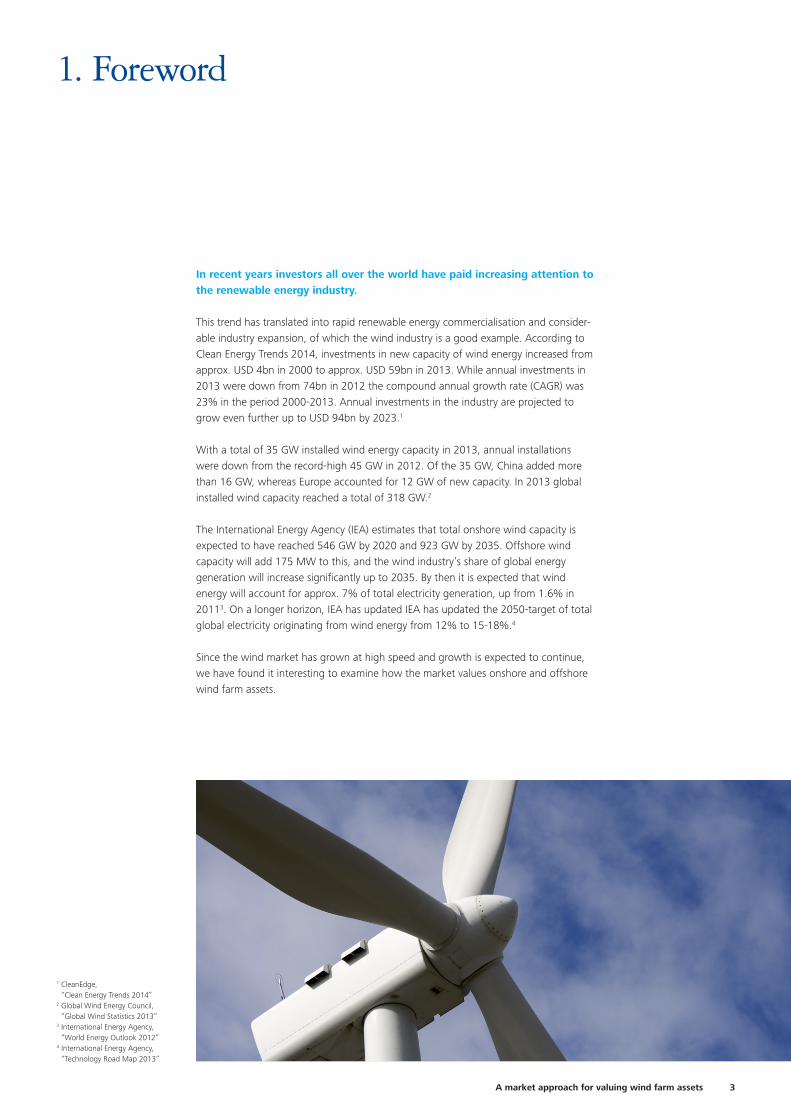
1. Foreword
In recent years investors all over the world have paid increasing attention to the renewable energy industry.
This trend has translated into rapid renewable energy commercialisation and consider-able industry expansion, of which the wind industry is a good example. According to Clean Energy Trends 2014, investments in new capacity of wind energy increased from approx. USD 4bn in 2000 to approx. USD 59bn in 2013. While annual investments in 2013 were down from 74bn in 2012 the compound annual growth rate (CAGR) was 23% in the period 2000-2013. Annual investments in the industry are projected to grow even further up to USD 94bn by 2023.1
With a total of 35 GW installed wind energy capacity in 2013, annual installations were down from the record-high 45 GW in 2012. Of the 35 GW, China added more than 16 GW, whereas Europe accounted for 12 GW of new capacity. In 2013 global installed wind capacity reached a total of 318 GW.2
The International Energy Agency (IEA) estimates that total onshore wind capacity is expected to have reached 546 GW by 2020 and 923 GW by 2035. Offshore wind capacity will add 175 MW to this, and the wind industry’s share of global energy generation will increase significantly up to 2035. By then it is expected that wind energy will account for approx. 7% of total electricity generation, up from 1.6% in 20113. On a longer horizon, IEA has updated IEA has updated the 2050-target of total global electricity originating from wind energy from 12% to 15-18%.4
Since the wind market has grown at high speed and growth is expected to continue, we have found it interesting to examine how the market values onshore and offshore wind farm assets.
1 CleanEdge, “Clean Energy Trends 2014”
2 Global Wind Energy Council, “Global Wind Statistics 2013”
3 International Energy Agency, “World Energy Outlook 2012”
4 International Energy Agency, “Technology Road Map 2013”
4
2. Executive summary
In the past few years focus on renewable energy has led to high growth in investments in renewable energy assets. Especially wind and solar assets have been exposed to great interest from investors, and markets expect high growth rates in investments in these assets in the coming decades. Due to the current growth and expec-tations for these markets, we find it interesting to identify the structure of assets held by wind and solar farm investors and to create suitable methods to value such assets.
This paper addresses how and why multiple regression analyses on wind farm transactions are a good supple-ment to more comprehensive cash flow models when valuing wind farm assets. Our analyses of onshore wind farm transactions have led to the conclusion that installed capacity, capacity under construction and capacity in late stage pipeline affect the enterprise value of trans-actions significantly. Additionally we have concluded that investors in wind farm assets do not assign any significant value to capacity in early stage pipeline. Our analysis on offshore wind transactions leads to similar results. However, not surprisingly, we see more value in each stage in offshore projects.
We have performed a similar analysis of solar PV farm assets and refer to “A market approach for valuing solar PV farm assets” for that analysis.
Since the release of the 5th edition of this analysis in September 2013, we have added an additional 30 transactions that are suitable for our analysis of wind farm assets. The sample now totals 232 transactions, including 203 onshore and 29 offshore transactions. The explanatory power of the onshore and offshore
model is 95% and 91% respectively. The precision of our analyses increases as the dataset grows, and thus this year we have been able to reduce the uncertainty related to the installed capacity multiple for onshore wind assets by 15% compared to the last edition of this paper. The uncertainty in the installed capacity for offshore transactions has been reduced by 35%.
Due to the large size of the dataset, we have been able to perform various in-depth analyses. We have analysed whether the value of installed onshore capacity has changed over time. Our analysis shows an overall decline in installed capacity multiples of EUR 0.4m per MW between the peak in 2008 and 2012. However, we also show indications of increasing transaction multiples between 2012 and 2014. This is consistent with reports on increasing construction costs during the past year. Since 2008 the overall decline in the installed onshore capacity multiple has been approx. EUR 0.2m.
We have tested for geographical differences in prices of onshore assets. We conclude that installed capacity in the US trades at a lower price than the global multiple, while installed capacity in Europe trades at the global multiple. We also find that large variations exist among the European countries. We find that installed capacity in France and Germany trades at a discount while installed capacity in Spain and UK trades at a premium compared with the global multiple. Installed capacity in Asia also trades at a discount compared with the rest of the world.
For transaction details and details on the geographical analysis we refer to “A market approach for valuing wind farm assets – Geographical analysis and transaction details” and the order form on page 20.
5A market approach for valuing wind farm assets
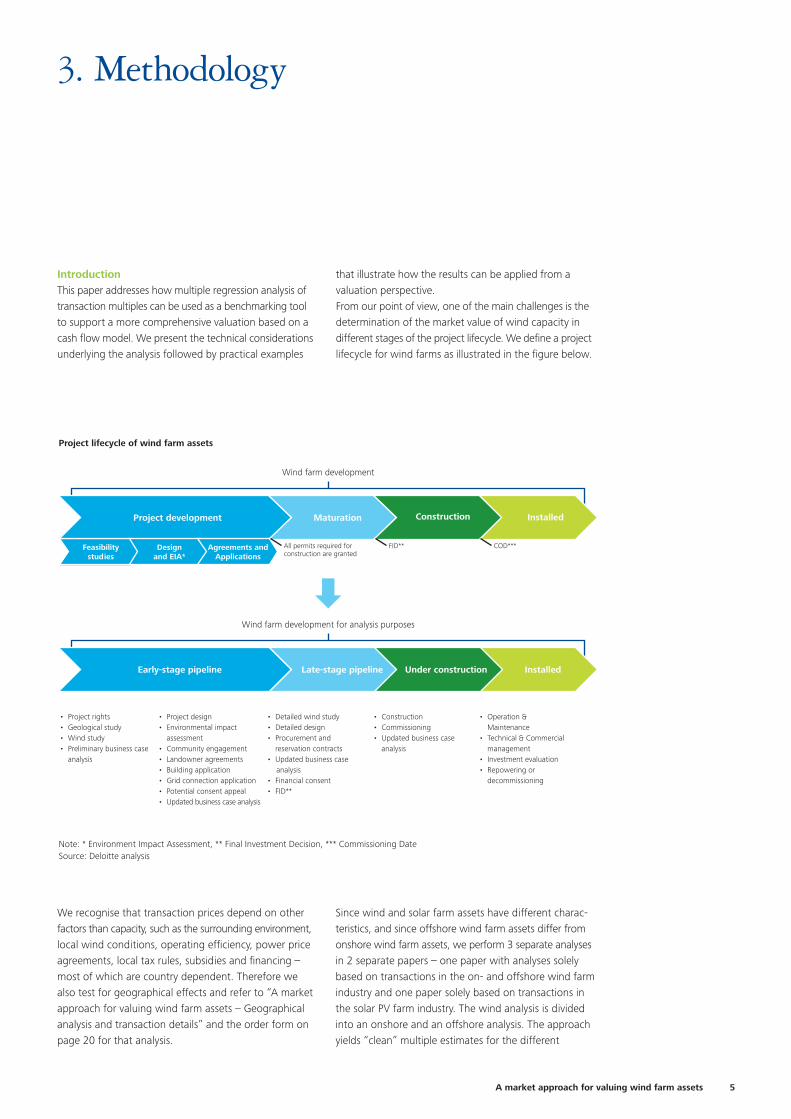
IntroductionThis paper addresses how multiple regression analysis of transaction multiples can be used as a benchmarking tool to support a more comprehensive valuation based on a cash flow model. We present the technical considerations underlying the analysis followed by practical examples
3. Methodology
that illustrate how the results can be applied from a valuation perspective.From our point of view, one of the main challenges is the determination of the market value of wind capacity in different stages of the project lifecycle. We define a project lifecycle for wind farms as illustrated in the figure below.
Project lifecycle of wind farm assets
Note: * Environment Impact Assessment, ** Final Investment Decision, *** Commissioning DateSource: Deloitte analysis
Wind farm development
Wind farm development for analysis purposes
Project development Maturation Construction Installed
Early-stage pipeline Installed
• Project rights• Geological study• Wind study• Preliminary business case
analysis
• Detailed wind study• Detailed design• Procurement and
reservation contracts• Updated business case
analysis• Financial consent• FID**
• Construction• Commissioning• Updated business case
analysis
• Operation & Maintenance
• Technical & Commercial management
• Investment evaluation• Repowering or
decommissioning
Feasibilitystudies
Design and EIA*
Agreements and Applications
All permits required for construction are granted
FID** COD***
• Project design• Environmental impact
assessment• Community engagement• Landowner agreements• Building application• Grid connection application• Potential consent appeal• Updated business case analysis
Late-stage pipeline Under construction
We recognise that transaction prices depend on other factors than capacity, such as the surrounding environment, local wind conditions, operating efficiency, power price agreements, local tax rules, subsidies and financing – most of which are country dependent. Therefore we also test for geographical effects and refer to “A market approach for valuing wind farm assets – Geographical analysis and transaction details” and the order form on page 20 for that analysis.
Since wind and solar farm assets have different charac-teristics, and since offshore wind farm assets differ from onshore wind farm assets, we perform 3 separate analyses in 2 separate papers – one paper with analyses solely based on transactions in the on- and offshore wind farm industry and one paper solely based on transactions in the solar PV farm industry. The wind analysis is divided into an onshore and an offshore analysis. The approach yields “clean” multiple estimates for the different
6
stages of the project, and it indirectly implies that in our analyses we assume that there is no interaction effect between holding a portfolio containing more than one kind of these assets. The multiple regression analysis is a market-based valuation approach as it is based on data from historical transactions.
In the analyses we disaggregate transactions into the different project stages as illustrated in the figure above. This disaggregation makes it possible to apply the multiple regression approach and also gives us the possibility of assigning separate multiples to each stage of the project. The reason for applying the multiple regression approach is that it allows us to estimate EV/MW multiples for the capacity in each stage of the project lifecycle.
The quality of a multiple regression analysis is critically dependent on the quality of the underlying dataset. Therefore the data collection process becomes important to ensure sufficient and reliable data. It is our experience
that collection of data is one of the main challenges when using statistical analysis. The accessibility of enter-prise value and the total capacity of target’s assets divided into the different project stages have been the primary criterias for including transactions in our analyses.
Below we give a more thorough introduction to the multiple regression analyses and present the underlying technical considerations of the analysis that we have performed. To exemplify the analyses performed, we use a fictive company named Renewable Energy Company (REC) throughout the paper to illustrate how a multiple regression can be applied for valuation purposes. REC has wind farm assets in different lifecycle stages as illustrated in the table below.
The following sections 4 and 5 are structured in the same way. First we present the findings of the regression analysis, followed by practical examples that illustrate how the results can be applied from a valuation perspective.
(1) EV = α + β1 · MWinstalled + β2 · MWunder construction + β3 · MWlate stage + β4 · MWearly stage
Renewable Energy Company (REC)
Source: Deloitte analysis
MWs Early stage Late stage Under construction Installed
Wind farms 1,600 800 400 200
Total 1,600 800 400 200
Identification of data and choice of methodOur analysis of the value of wind farm assets is based on transactions over the past 8 years to secure a sufficient dataset. We have identified 232 wind farm transactions, which we find suitable for our multiple regression analysis. Of these transactions, 203 are transactions of onshore wind assets while 29 are transactions of offshore wind assets.
The major challenge that we experienced during our data collection was the classification of transactions into project stages, especially for the early stages. Moreover not all companies report capacity in the screening stage. We have therefore merged the screening stage with the under approval stage into what we name early stage.
Our analyses derive from the following regression model (1) which we have performed on the onshore and the offshore transactions. Based on this model we find that installed capacity, capacity under construction and capacity in late stage affect the enterprise value of onshore farm assets significantly. Also, based on this model, we can conclude that early stage capacity has no meaningful effect on the enterprise value (negative multiple close to nil) in onshore wind farms. Our analysis of offshore wind transactions leads to similar results.
However, not surprisingly, we see more value in each stage in offshore projects. Therefore the early stage multiple has been excluded in the following analyses:
7A market approach for valuing wind farm assets
4. Onshore transaction analysis
Regression and valuation of wind assets
EURm Early stage Non-installed Installed
EV/MW coefficient1 0.3x 0.9x 1.7x
Significance (p-value) 0.0 0.0 0.0
Upper 95% 0.3x 1.0x 1.7x
Lower 95% 0.2x 0.7x 1.6x
REC wind MWs 800 400 200
REC wind EVs 221 341 334
REC total EV 895
1 Transactions (n): 203. R-square: 0.95 Source: Deloitte analysis
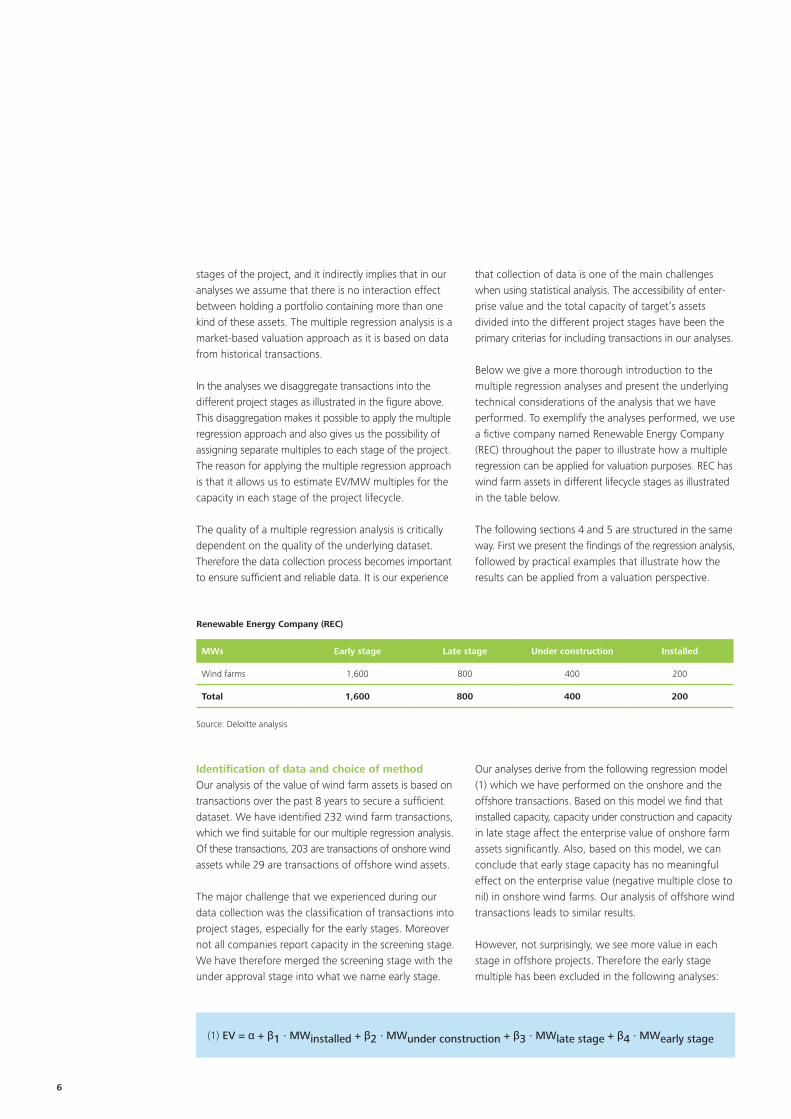
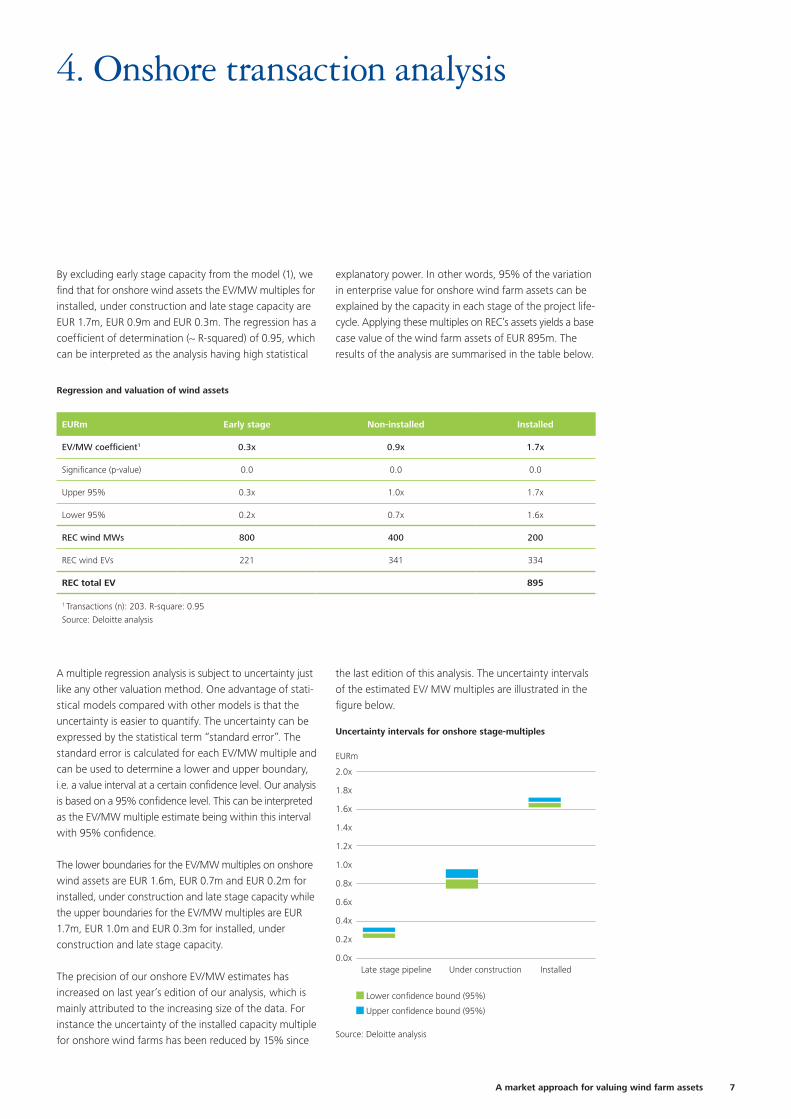
By excluding early stage capacity from the model (1), we find that for onshore wind assets the EV/MW multiples for installed, under construction and late stage capacity are EUR 1.7m, EUR 0.9m and EUR 0.3m. The regression has a coefficient of determination (~ R-squared) of 0.95, which can be interpreted as the analysis having high statistical
explanatory power. In other words, 95% of the variation in enterprise value for onshore wind farm assets can be explained by the capacity in each stage of the project life- cycle. Applying these multiples on REC’s assets yields a base case value of the wind farm assets of EUR 895m. The results of the analysis are summarised in the table below.
A multiple regression analysis is subject to uncertainty just like any other valuation method. One advantage of stati-stical models compared with other models is that the uncertainty is easier to quantify. The uncertainty can be expressed by the statistical term “standard error”. The standard error is calculated for each EV/MW multiple and can be used to determine a lower and upper boundary, i.e. a value interval at a certain confidence level. Our analysis is based on a 95% confidence level. This can be interpreted as the EV/MW multiple estimate being within this interval with 95% confidence.
The lower boundaries for the EV/MW multiples on onshore wind assets are EUR 1.6m, EUR 0.7m and EUR 0.2m for installed, under construction and late stage capacity while the upper boundaries for the EV/MW multiples are EUR 1.7m, EUR 1.0m and EUR 0.3m for installed, under construction and late stage capacity.
The precision of our onshore EV/MW estimates has increased on last year’s edition of our analysis, which is mainly attributed to the increasing size of the data. For instance the uncertainty of the installed capacity multiple for onshore wind farms has been reduced by 15% since
the last edition of this analysis. The uncertainty intervals of the estimated EV/ MW multiples are illustrated in the figure below.
Lower confidence bound (95%)
Upper confidence bound (95%)
Uncertainty intervals for onshore stage-multiples
EURm
2.0x
1.8x
1.6x
1.4x
1.2x
1.0x
0.8x
0.6x
0.4x
0.2x
0.0x
Source: Deloitte analysis
Late stage pipeline Under construction Installed
8
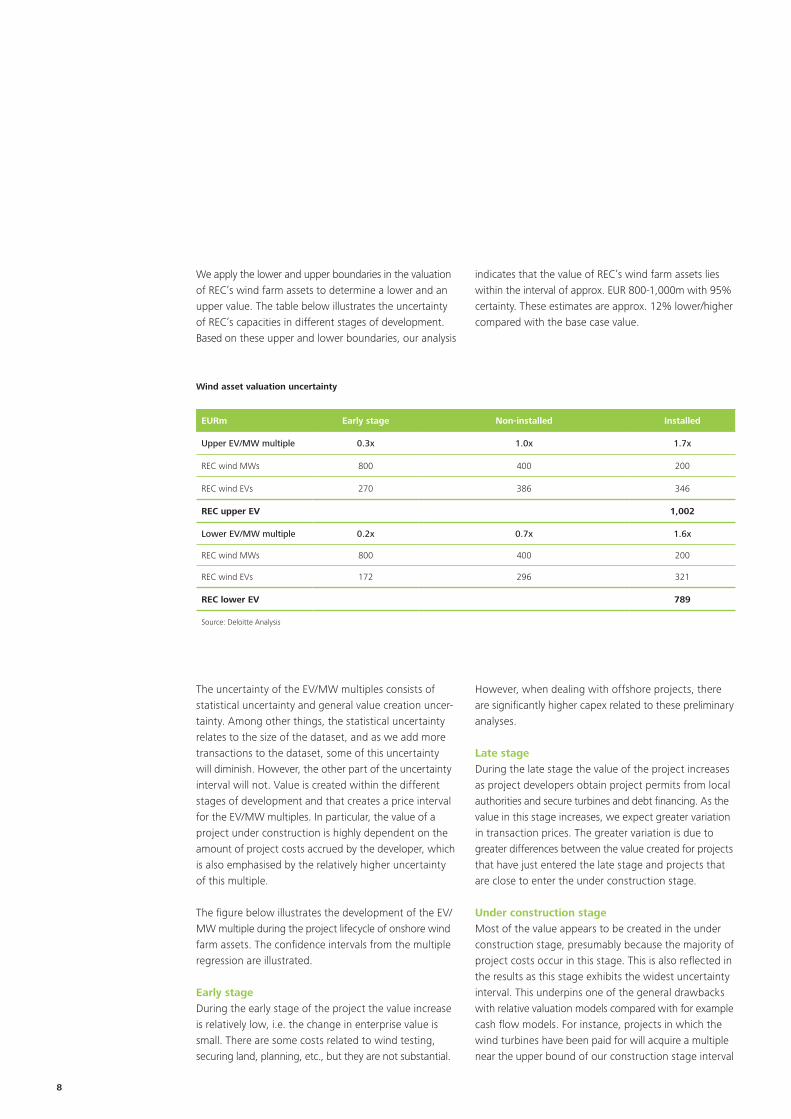
We apply the lower and upper boundaries in the valuation of REC’s wind farm assets to determine a lower and an upper value. The table below illustrates the uncertainty of REC’s capacities in different stages of development. Based on these upper and lower boundaries, our analysis
indicates that the value of REC’s wind farm assets lies within the interval of approx. EUR 800-1,000m with 95% certainty. These estimates are approx. 12% lower/higher compared with the base case value.
Wind asset valuation uncertainty
EURm Early stage Non-installed Installed
Upper EV/MW multiple 0.3x 1.0x 1.7x
REC wind MWs 800 400 200
REC wind EVs 270 386 346
REC upper EV 1,002
Lower EV/MW multiple 0.2x 0.7x 1.6x
REC wind MWs 800 400 200
REC wind EVs 172 296 321
REC lower EV 789
Source: Deloitte Analysis
The uncertainty of the EV/MW multiples consists of statistical uncertainty and general value creation uncer-tainty. Among other things, the statistical uncertainty relates to the size of the dataset, and as we add more transactions to the dataset, some of this uncertainty will diminish. However, the other part of the uncertainty interval will not. Value is created within the different stages of development and that creates a price interval for the EV/MW multiples. In particular, the value of a project under construction is highly dependent on the amount of project costs accrued by the developer, which is also emphasised by the relatively higher uncertainty of this multiple.
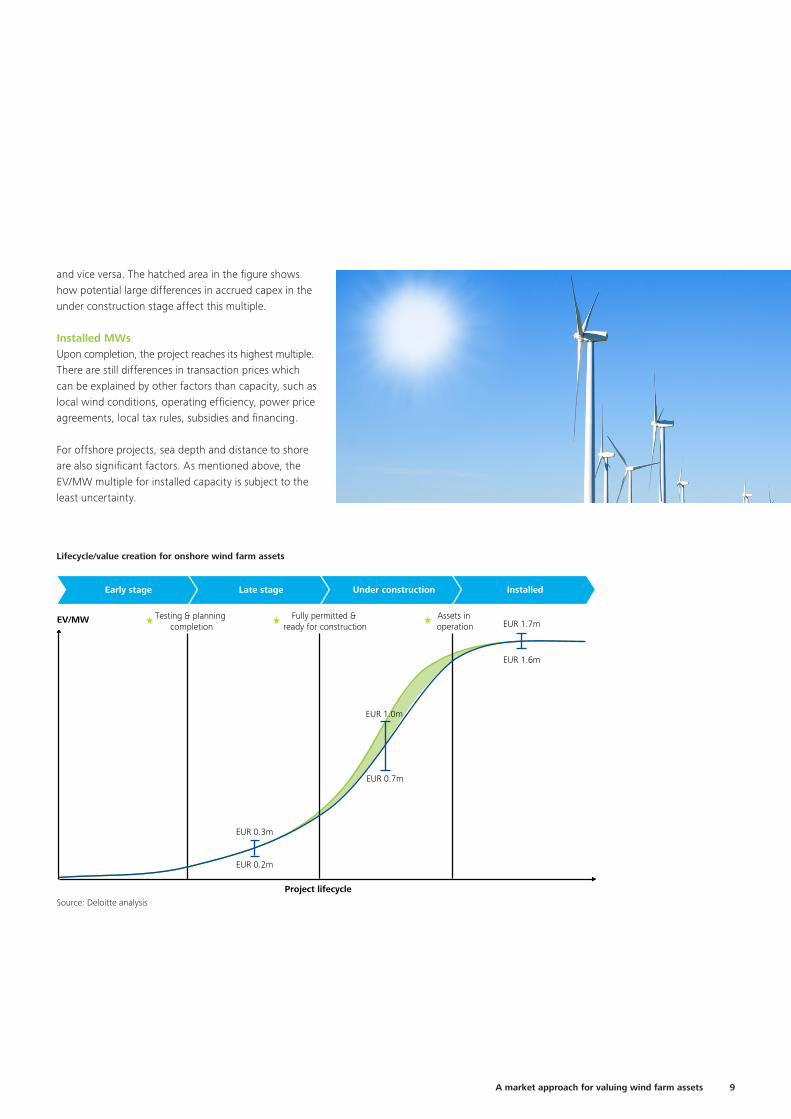
The figure below illustrates the development of the EV/MW multiple during the project lifecycle of onshore wind farm assets. The confidence intervals from the multiple regression are illustrated.
Early stageDuring the early stage of the project the value increase is relatively low, i.e. the change in enterprise value is small. There are some costs related to wind testing, securing land, planning, etc., but they are not substantial.
However, when dealing with offshore projects, there are significantly higher capex related to these preliminary analyses.
Late stageDuring the late stage the value of the project increases as project developers obtain project permits from local authorities and secure turbines and debt financing. As the value in this stage increases, we expect greater variation in transaction prices. The greater variation is due to greater differences between the value created for projects that have just entered the late stage and projects that are close to enter the under construction stage.
Under construction stageMost of the value appears to be created in the under construction stage, presumably because the majority of project costs occur in this stage. This is also reflected in the results as this stage exhibits the widest uncertainty interval. This underpins one of the general drawbacks with relative valuation models compared with for example cash flow models. For instance, projects in which the wind turbines have been paid for will acquire a multiple near the upper bound of our construction stage interval
9A market approach for valuing wind farm assets
EUR 1.6m
EUR 0.7m
EUR 0.2m
EUR 0.3m
Project lifecycle
Early stage Late stage Under construction Installed
Assets in operation
Fully permitted & ready for construction
Testing & planning completion
EV/MW EUR 1.7m
EUR 1.0m
Lifecycle/value creation for onshore wind farm assets
Source: Deloitte analysis
and vice versa. The hatched area in the figure shows how potential large differences in accrued capex in the under construction stage affect this multiple.
Installed MWsUpon completion, the project reaches its highest multiple. There are still differences in transaction prices which can be explained by other factors than capacity, such as local wind conditions, operating efficiency, power price agreements, local tax rules, subsidies and financing.
For offshore projects, sea depth and distance to shore are also significant factors. As mentioned above, the EV/MW multiple for installed capacity is subject to the least uncertainty.
10
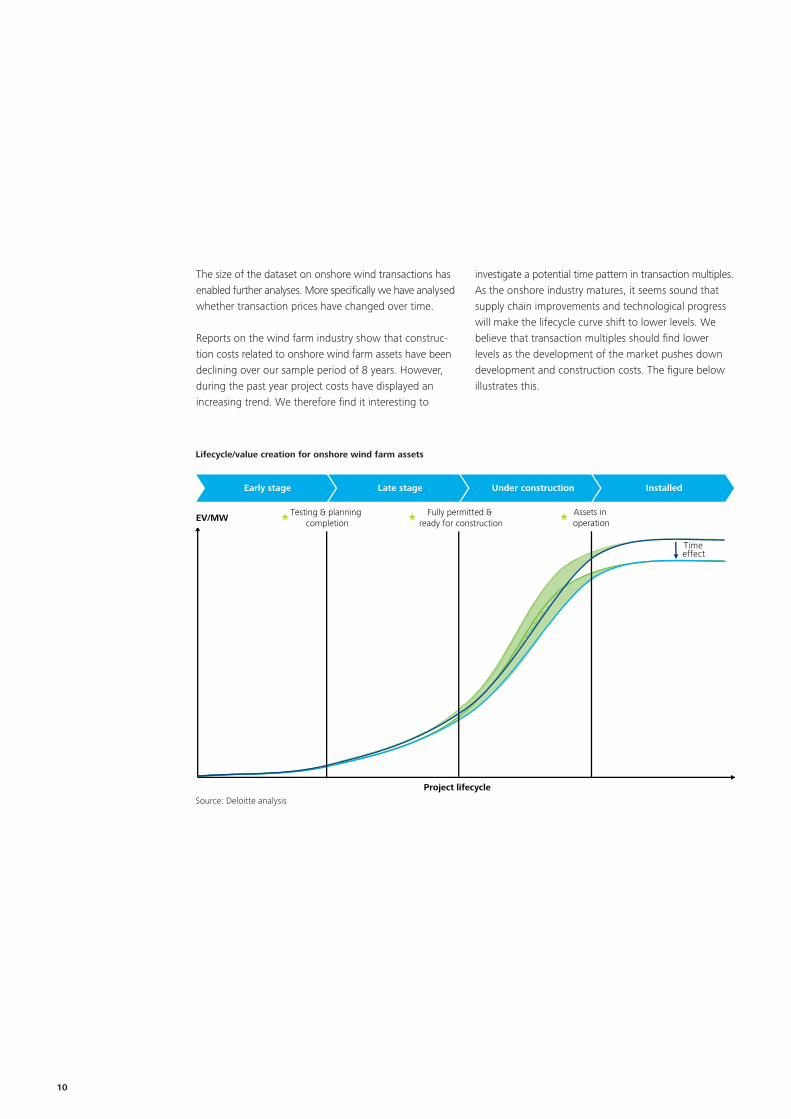
The size of the dataset on onshore wind transactions has enabled further analyses. More specifically we have analysed whether transaction prices have changed over time.
Reports on the wind farm industry show that construc-tion costs related to onshore wind farm assets have been declining over our sample period of 8 years. However, during the past year project costs have displayed an increasing trend. We therefore find it interesting to
investigate a potential time pattern in transaction multiples.As the onshore industry matures, it seems sound that supply chain improvements and technological progress will make the lifecycle curve shift to lower levels. We believe that transaction multiples should find lower levels as the development of the market pushes down development and construction costs. The figure below illustrates this.
Time effect
Project lifecycle
Early stage Late stage Under construction Installed
EV/MWAssets in operation
Fully permitted & ready for construction
Testing & planning completion
Lifecycle/value creation for onshore wind farm assets
Source: Deloitte analysis
11A market approach for valuing wind farm assets
13%
Time
(0.2)
2008 2009 2010 2011 2012 2013
EV/Installed MW (EURm)2.0
1.8
1.6
1.4
1.2
1.0
0.8
0.6
Installed capacity multiple Project costs Turbine costs
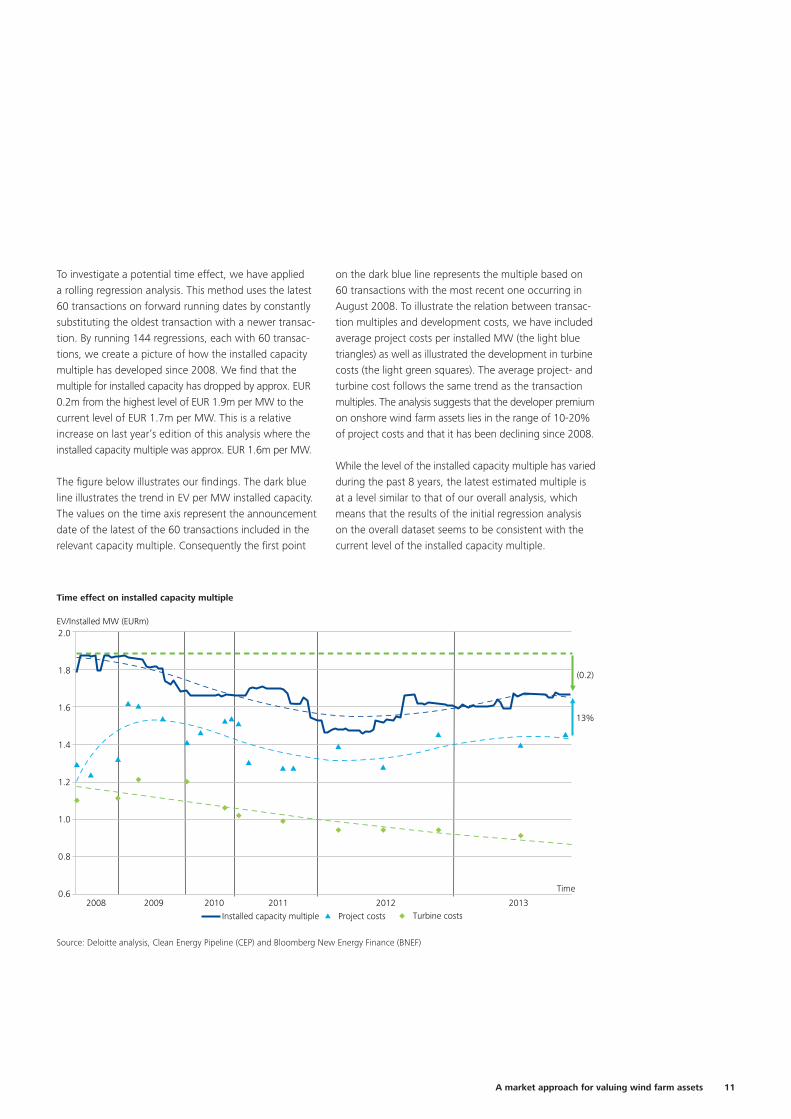
Time effect on installed capacity multiple
Source: Deloitte analysis, Clean Energy Pipeline (CEP) and Bloomberg New Energy Finance (BNEF)
To investigate a potential time effect, we have applied a rolling regression analysis. This method uses the latest 60 transactions on forward running dates by constantly substituting the oldest transaction with a newer transac-tion. By running 144 regressions, each with 60 transac-tions, we create a picture of how the installed capacity multiple has developed since 2008. We find that the multiple for installed capacity has dropped by approx. EUR 0.2m from the highest level of EUR 1.9m per MW to the current level of EUR 1.7m per MW. This is a relative increase on last year’s edition of this analysis where the installed capacity multiple was approx. EUR 1.6m per MW.
The figure below illustrates our findings. The dark blue line illustrates the trend in EV per MW installed capacity. The values on the time axis represent the announcement date of the latest of the 60 transactions included in the relevant capacity multiple. Consequently the first point
on the dark blue line represents the multiple based on 60 transactions with the most recent one occurring in August 2008. To illustrate the relation between transac-tion multiples and development costs, we have included average project costs per installed MW (the light blue triangles) as well as illustrated the development in turbine costs (the light green squares). The average project- and turbine cost follows the same trend as the transaction multiples. The analysis suggests that the developer premium on onshore wind farm assets lies in the range of 10-20% of project costs and that it has been declining since 2008.
While the level of the installed capacity multiple has varied during the past 8 years, the latest estimated multiple is at a level similar to that of our overall analysis, which means that the results of the initial regression analysis on the overall dataset seems to be consistent with the current level of the installed capacity multiple.
12
Regression and valuation of offshore wind farm assets
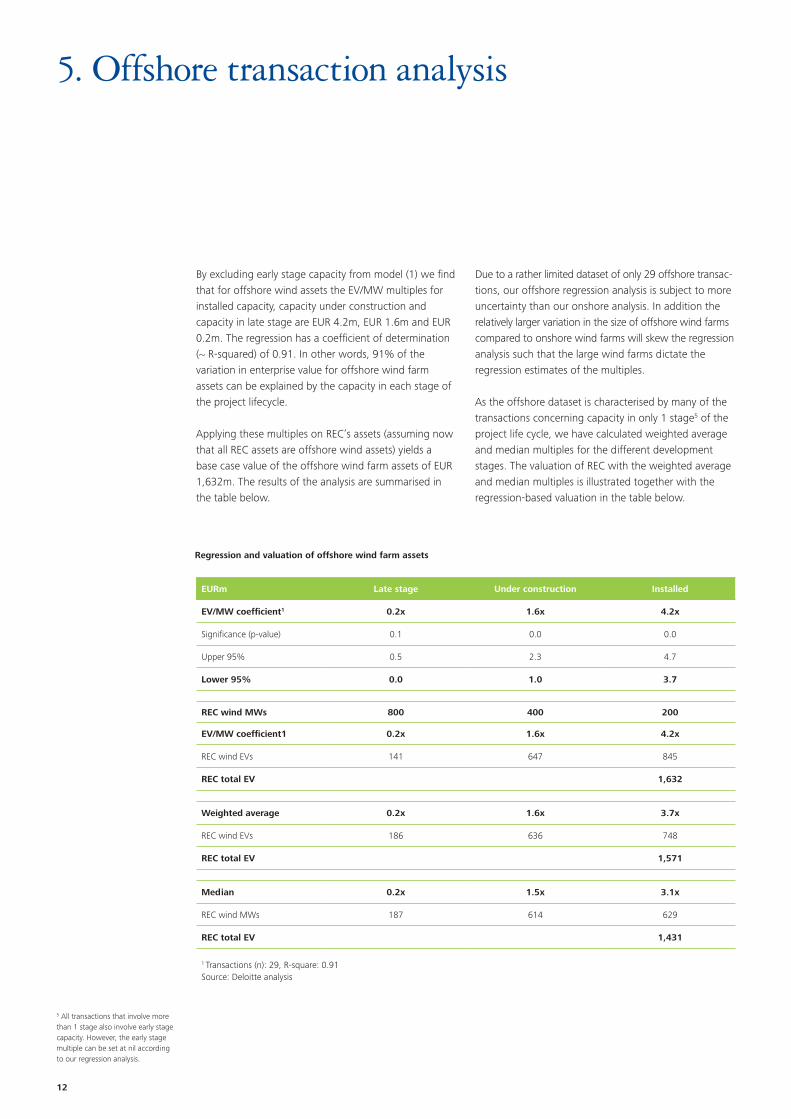
By excluding early stage capacity from model (1) we find that for offshore wind assets the EV/MW multiples for installed capacity, capacity under construction and capacity in late stage are EUR 4.2m, EUR 1.6m and EUR 0.2m. The regression has a coefficient of determination (~ R-squared) of 0.91. In other words, 91% of the variation in enterprise value for offshore wind farm assets can be explained by the capacity in each stage of the project lifecycle.
Applying these multiples on REC’s assets (assuming now that all REC assets are offshore wind assets) yields a base case value of the offshore wind farm assets of EUR 1,632m. The results of the analysis are summarised in the table below.
Due to a rather limited dataset of only 29 offshore transac-tions, our offshore regression analysis is subject to more uncertainty than our onshore analysis. In addition the relatively larger variation in the size of offshore wind farms compared to onshore wind farms will skew the regression analysis such that the large wind farms dictate the regression estimates of the multiples.
As the offshore dataset is characterised by many of the transactions concerning capacity in only 1 stage5 of the project life cycle, we have calculated weighted average and median multiples for the different development stages. The valuation of REC with the weighted average and median multiples is illustrated together with the regression-based valuation in the table below.
5. Offshore transaction analysis
5 All transactions that involve more than 1 stage also involve early stage capacity. However, the early stage multiple can be set at nil according to our regression analysis.
EURm Late stage Under construction Installed
EV/MW coefficient1 0.2x 1.6x 4.2x
Significance (p-value) 0.1 0.0 0.0
Upper 95% 0.5 2.3 4.7
Lower 95% 0.0 1.0 3.7
REC wind MWs 800 400 200
EV/MW coefficient1 0.2x 1.6x 4.2x
REC wind EVs 141 647 845
REC total EV 1,632
Weighted average 0.2x 1.6x 3.7x
REC wind EVs 186 636 748
REC total EV 1,571
Median 0.2x 1.5x 3.1x
REC wind MWs 187 614 629
REC total EV 1,431
1 Transactions (n): 29, R-square: 0.91 Source: Deloitte analysis
13A market approach for valuing wind farm assets
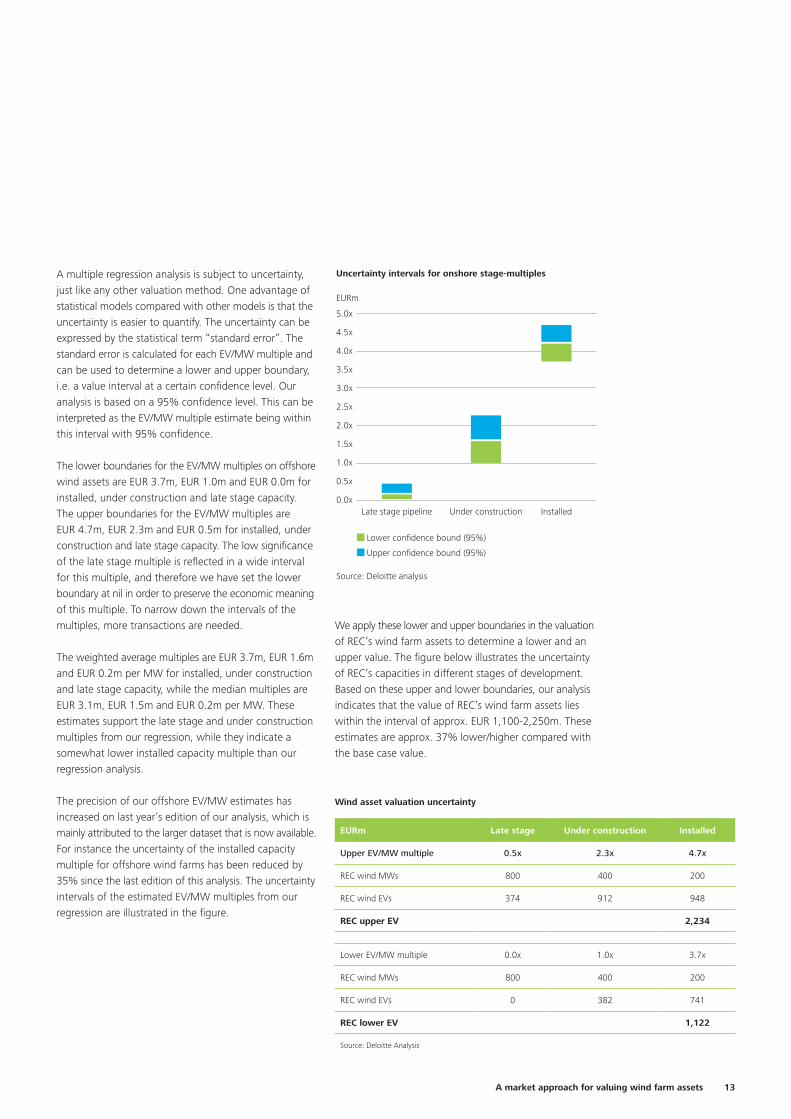
A multiple regression analysis is subject to uncertainty, just like any other valuation method. One advantage of statistical models compared with other models is that the uncertainty is easier to quantify. The uncertainty can be expressed by the statistical term “standard error”. The standard error is calculated for each EV/MW multiple and can be used to determine a lower and upper boundary, i.e. a value interval at a certain confidence level. Our analysis is based on a 95% confidence level. This can be interpreted as the EV/MW multiple estimate being within this interval with 95% confidence.
The lower boundaries for the EV/MW multiples on offshore wind assets are EUR 3.7m, EUR 1.0m and EUR 0.0m for installed, under construction and late stage capacity. The upper boundaries for the EV/MW multiples are EUR 4.7m, EUR 2.3m and EUR 0.5m for installed, under construction and late stage capacity. The low significance of the late stage multiple is reflected in a wide interval for this multiple, and therefore we have set the lower boundary at nil in order to preserve the economic meaning of this multiple. To narrow down the intervals of the multiples, more transactions are needed.
The weighted average multiples are EUR 3.7m, EUR 1.6m and EUR 0.2m per MW for installed, under construction and late stage capacity, while the median multiples are EUR 3.1m, EUR 1.5m and EUR 0.2m per MW. These estimates support the late stage and under construction multiples from our regression, while they indicate a some what lower installed capacity multiple than our regression analysis.
The precision of our offshore EV/MW estimates has increased on last year’s edition of our analysis, which is mainly attributed to the larger dataset that is now available. For instance the uncertainty of the installed capacity multiple for offshore wind farms has been reduced by 35% since the last edition of this analysis. The uncertainty intervals of the estimated EV/MW multiples from our regression are illustrated in the figure.
Lower confidence bound (95%)
Upper confidence bound (95%)
Uncertainty intervals for onshore stage-multiples
EURm
5.0x
4.5x
4.0x
3.5x
3.0x
2.5x
2.0x
1.5x
1.0x
0.5x
0.0x
Source: Deloitte analysis
Late stage pipeline Under construction Installed
We apply these lower and upper boundaries in the valuation of REC’s wind farm assets to determine a lower and an upper value. The figure below illustrates the uncertainty of REC’s capacities in different stages of development. Based on these upper and lower boundaries, our analysis indicates that the value of REC’s wind farm assets lies within the interval of approx. EUR 1,100-2,250m. These estimates are approx. 37% lower/higher compared with the base case value.
Wind asset valuation uncertainty
EURm Late stage Under construction Installed
Upper EV/MW multiple 0.5x 2.3x 4.7x
REC wind MWs 800 400 200
REC wind EVs 374 912 948
REC upper EV 2,234
Lower EV/MW multiple 0.0x 1.0x 3.7x
REC wind MWs 800 400 200
REC wind EVs 0 382 741
REC lower EV 1,122
Source: Deloitte Analysis
14
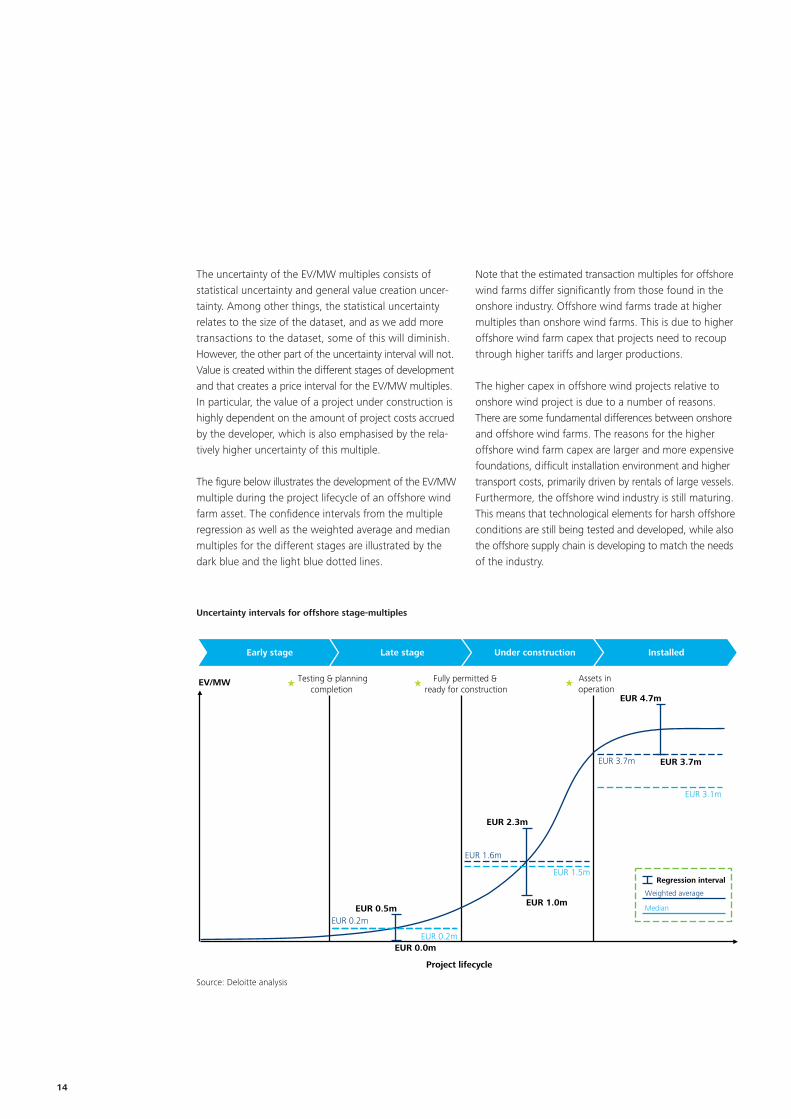
The uncertainty of the EV/MW multiples consists of statistical uncertainty and general value creation uncer-tainty. Among other things, the statistical uncertainty relates to the size of the dataset, and as we add more transactions to the dataset, some of this will diminish. However, the other part of the uncertainty interval will not. Value is created within the different stages of development and that creates a price interval for the EV/MW multiples. In particular, the value of a project under construction is highly dependent on the amount of project costs accrued by the developer, which is also emphasised by the rela-tively higher uncertainty of this multiple.
The figure below illustrates the development of the EV/MW multiple during the project lifecycle of an offshore wind farm asset. The confidence intervals from the multiple regression as well as the weighted average and median multiples for the different stages are illustrated by the dark blue and the light blue dotted lines.
Note that the estimated transaction multiples for offshore wind farms differ significantly from those found in the onshore industry. Offshore wind farms trade at higher multiples than onshore wind farms. This is due to higher offshore wind farm capex that projects need to recoup through higher tariffs and larger productions.
The higher capex in offshore wind projects relative to onshore wind project is due to a number of reasons. There are some fundamental differences between onshore and offshore wind farms. The reasons for the higher offshore wind farm capex are larger and more expensive foundations, difficult installation environment and higher transport costs, primarily driven by rentals of large vessels. Furthermore, the offshore wind industry is still maturing. This means that technological elements for harsh offshore conditions are still being tested and developed, while also the offshore supply chain is developing to match the needs of the industry.
Uncertainty intervals for offshore stage-multiples
Source: Deloitte analysis
EUR 0.2m
EV/MW
EUR 3.7m
EUR 1.6m
EUR 0.0m
EUR 0.2m
EUR 2.3m
EUR 3.7m
EUR 1.0mEUR 0.5m
EUR 4.7m
Project lifecycle
Early stage Late stage Under construction Installed
Assets in operation
Fully permitted & ready for construction
Testing & planning completion
EUR 1.5m
EUR 3.1m
Median
Regression interval
Weighted average

15A market approach for valuing wind farm assets
16
20
13
7
25
5
277
21
1
6
4
11
9
15
7
1
1
21
2
5
1
32
1
1
2
1
1
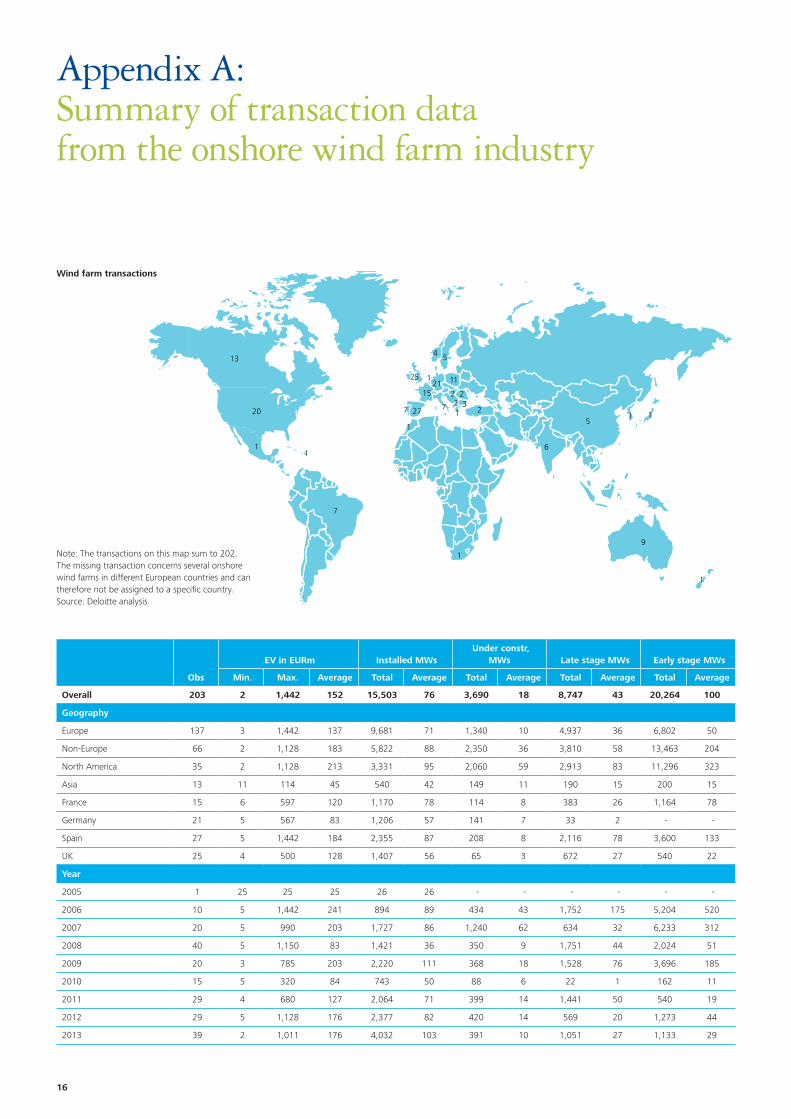
Appendix A: Summary of transaction data from the onshore wind farm industry
Wind farm transactions
Note: The transactions on this map sum to 202. The missing transaction concerns several onshore wind farms in different European countries and can therefore not be assigned to a specific country.Source: Deloitte analysis
Obs
EV in EURm Installed MWs Under constr,
MWs Late stage MWs Early stage MWs
Min. Max. Average Total Average Total Average Total Average Total Average
Overall 203 2 1,442 152 15,503 76 3,690 18 8,747 43 20,264 100
Geography
Europe 137 3 1,442 137 9,681 71 1,340 10 4,937 36 6,802 50
Non-Europe 66 2 1,128 183 5,822 88 2,350 36 3,810 58 13,463 204
North America 35 2 1,128 213 3,331 95 2,060 59 2,913 83 11,296 323
Asia 13 11 114 45 540 42 149 11 190 15 200 15
France 15 6 597 120 1,170 78 114 8 383 26 1,164 78
Germany 21 5 567 83 1,206 57 141 7 33 2 - -
Spain 27 5 1,442 184 2,355 87 208 8 2,116 78 3,600 133
UK 25 4 500 128 1,407 56 65 3 672 27 540 22
Year
2005 1 25 25 25 26 26 - - - - - -
2006 10 5 1,442 241 894 89 434 43 1,752 175 5,204 520
2007 20 5 990 203 1,727 86 1,240 62 634 32 6,233 312
2008 40 5 1,150 83 1,421 36 350 9 1,751 44 2,024 51
2009 20 3 785 203 2,220 111 368 18 1,528 76 3,696 185
2010 15 5 320 84 743 50 88 6 22 1 162 11
2011 29 4 680 127 2,064 71 399 14 1,441 50 540 19
2012 29 5 1,128 176 2,377 82 420 14 569 20 1,273 44
2013 39 2 1,011 176 4,032 103 391 10 1,051 27 1,133 29
17A market approach for valuing wind farm assets
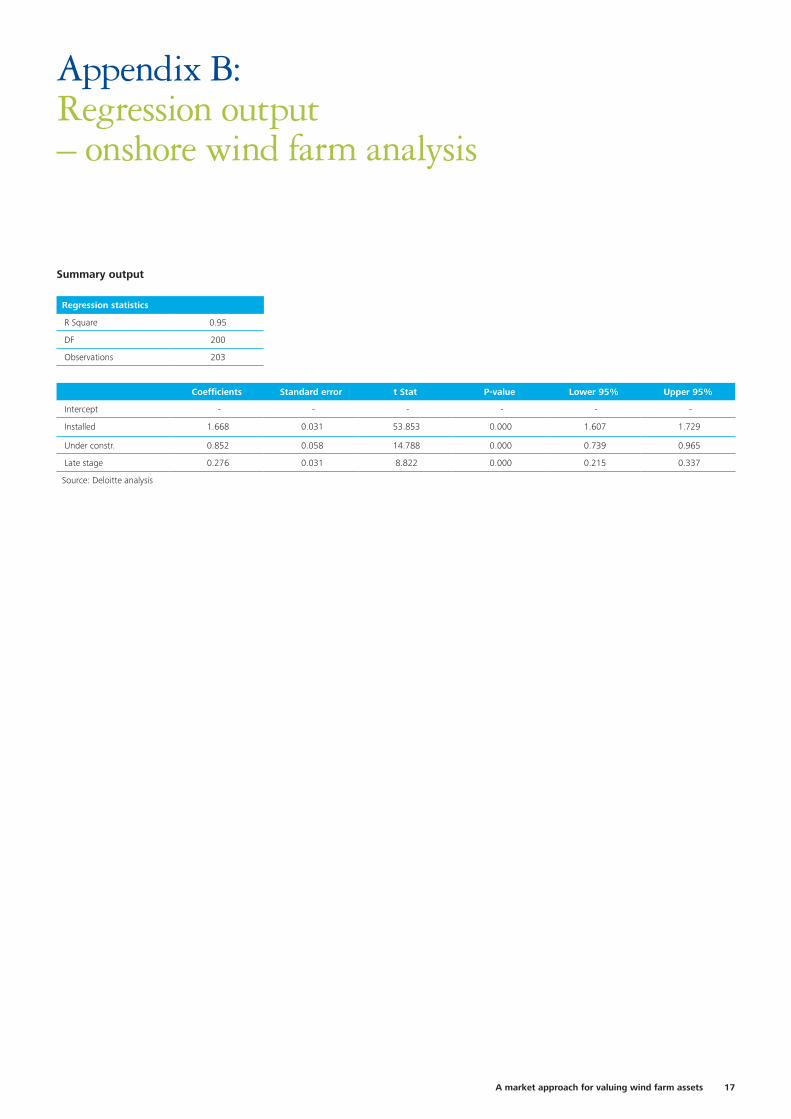
Regression statistics
R Square 0.95
DF 200
Observations 203
Coefficients Standard error t Stat P-value Lower 95% Upper 95%
Intercept - - - - - -
Installed 1.668 0.031 53.853 0.000 1.607 1.729
Under constr. 0.852 0.058 14.788 0.000 0.739 0.965
Late stage 0.276 0.031 8.822 0.000 0.215 0.337
Source: Deloitte analysis
Summary output
Appendix B: Regression output – onshore wind farm analysis
18
15
10
3
1
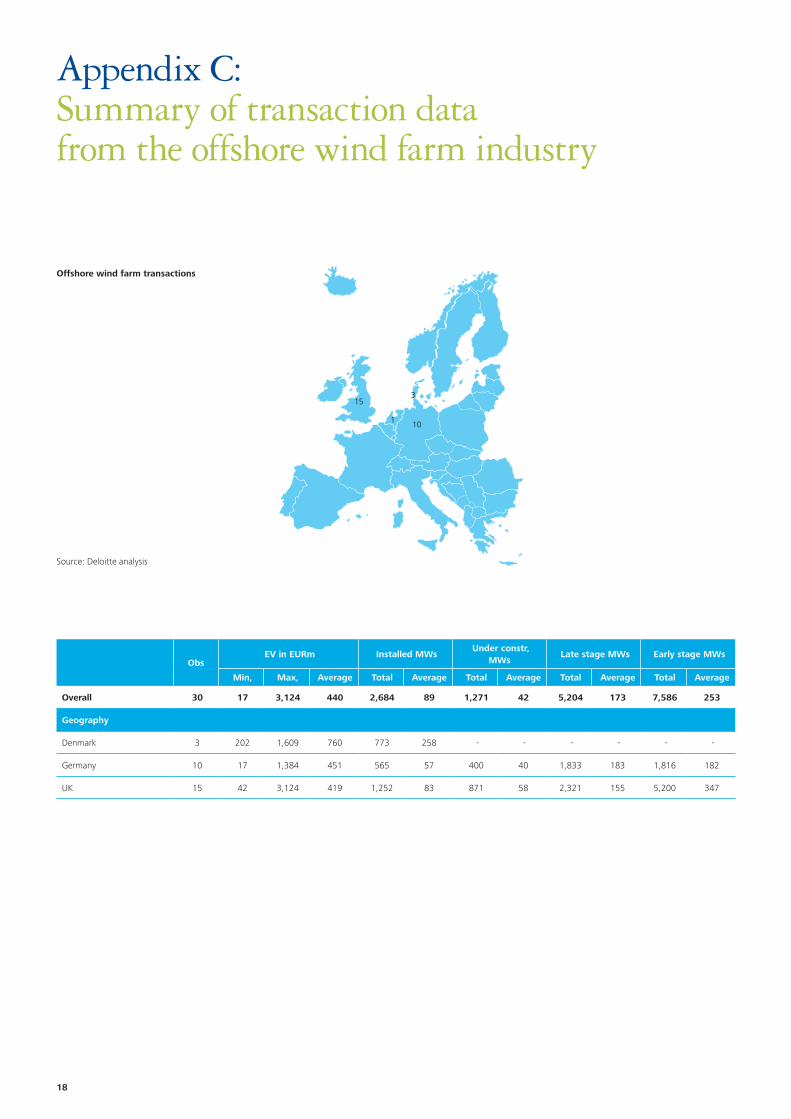
Appendix C: Summary of transaction data from the offshore wind farm industry
Offshore wind farm transactions
Source: Deloitte analysis
Obs EV in EURm Installed MWs
Under constr, MWs
Late stage MWs Early stage MWs
Min, Max, Average Total Average Total Average Total Average Total Average
Overall 30 17 3,124 440 2,684 89 1,271 42 5,204 173 7,586 253
Geography
Denmark 3 202 1,609 760 773 258 - - - - - -
Germany 10 17 1,384 451 565 57 400 40 1,833 183 1,816 182
UK 15 42 3,124 419 1,252 83 871 58 2,321 155 5,200 347
19A market approach for valuing wind farm assets
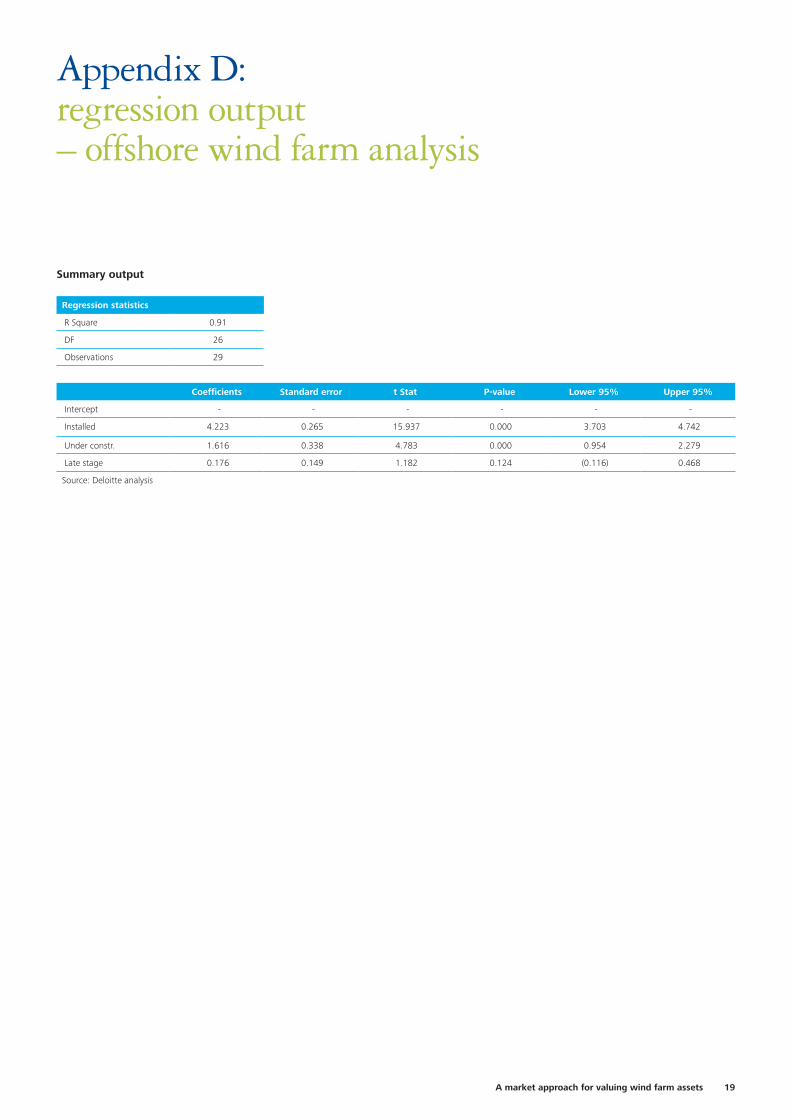
Regression statistics
R Square 0.91
DF 26
Observations 29
Coefficients Standard error t Stat P-value Lower 95% Upper 95%
Intercept - - - - - -
Installed 4.223 0.265 15.937 0.000 3.703 4.742
Under constr. 1.616 0.338 4.783 0.000 0.954 2.279
Late stage 0.176 0.149 1.182 0.124 (0.116) 0.468
Source: Deloitte analysis
Summary output
Appendix D: regression output – offshore wind farm analysis
20
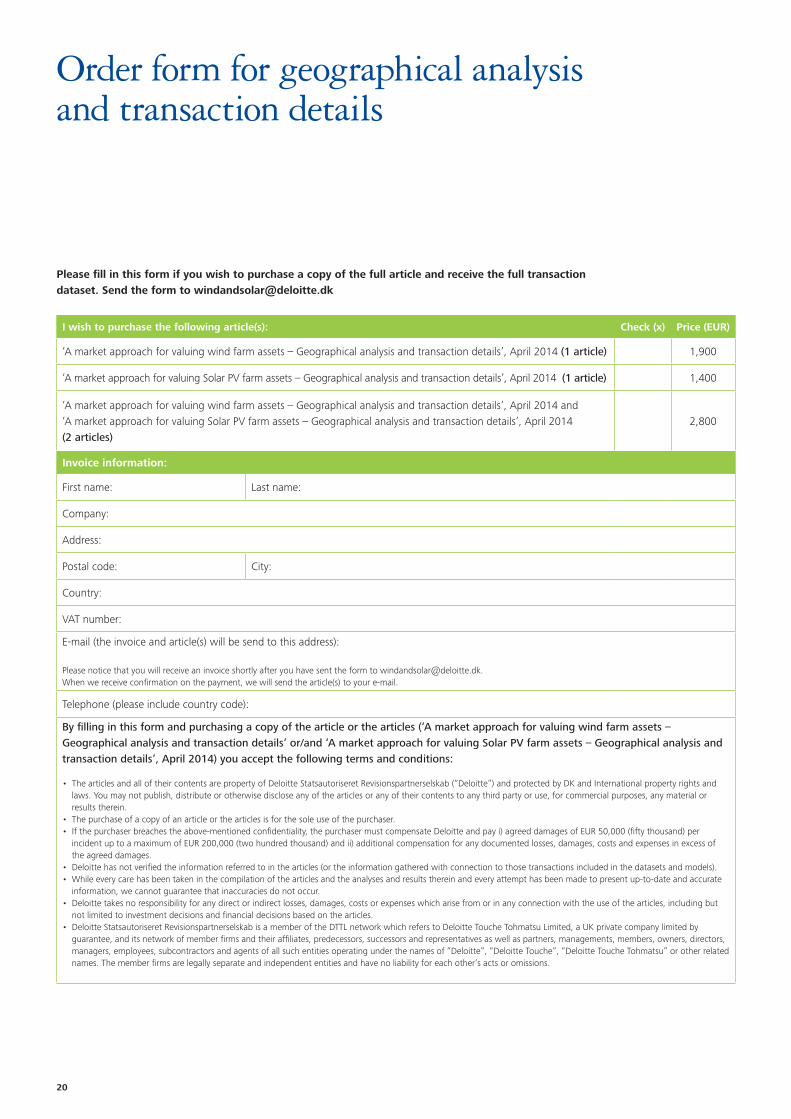
Order form for geographical analysis and transaction details
Please fill in this form if you wish to purchase a copy of the full article and receive the full transaction dataset. Send the form to [email protected]
I wish to purchase the following article(s): Check (x) Price (EUR)
‘A market approach for valuing wind farm assets – Geographical analysis and transaction details’, April 2014 (1 article) 1,900
‘A market approach for valuing Solar PV farm assets – Geographical analysis and transaction details’, April 2014 (1 article) 1,400
‘A market approach for valuing wind farm assets – Geographical analysis and transaction details’, April 2014 and ‘A market approach for valuing Solar PV farm assets – Geographical analysis and transaction details’, April 2014 (2 articles)
2,800
Invoice information:
First name: Last name:
Company:
Address:
Postal code: City:
Country:
VAT number:
E-mail (the invoice and article(s) will be send to this address):
Please notice that you will receive an invoice shortly after you have sent the form to [email protected]. When we receive confirmation on the payment, we will send the article(s) to your e-mail.
Telephone (please include country code):
By filling in this form and purchasing a copy of the article or the articles (‘A market approach for valuing wind farm assets – Geographical analysis and transaction details’ or/and ‘A market approach for valuing Solar PV farm assets – Geographical analysis and transaction details’, April 2014) you accept the following terms and conditions:
• The articles and all of their contents are property of Deloitte Statsautoriseret Revisionspartnerselskab (“Deloitte”) and protected by DK and International property rights and laws. You may not publish, distribute or otherwise disclose any of the articles or any of their contents to any third party or use, for commercial purposes, any material or results therein.
• The purchase of a copy of an article or the articles is for the sole use of the purchaser.• If the purchaser breaches the above-mentioned confidentiality, the purchaser must compensate Deloitte and pay i) agreed damages of EUR 50,000 (fifty thousand) per
incident up to a maximum of EUR 200,000 (two hundred thousand) and ii) additional compensation for any documented losses, damages, costs and expenses in excess of the agreed damages.
• Deloitte has not verified the information referred to in the articles (or the information gathered with connection to those transactions included in the datasets and models).• While every care has been taken in the compilation of the articles and the analyses and results therein and every attempt has been made to present up-to-date and accurate
information, we cannot guarantee that inaccuracies do not occur.• Deloitte takes no responsibility for any direct or indirect losses, damages, costs or expenses which arise from or in any connection with the use of the articles, including but
not limited to investment decisions and financial decisions based on the articles.• Deloitte Statsautoriseret Revisionspartnerselskab is a member of the DTTL network which refers to Deloitte Touche Tohmatsu Limited, a UK private company limited by
guarantee, and its network of member firms and their affiliates, predecessors, successors and representatives as well as partners, managements, members, owners, directors, managers, employees, subcontractors and agents of all such entities operating under the names of “Deloitte”, “Deloitte Touche”, “Deloitte Touche Tohmatsu” or other related names. The member firms are legally separate and independent entities and have no liability for each other’s acts or omissions.
21A market approach for valuing wind farm assets
About Financial Advisory Services
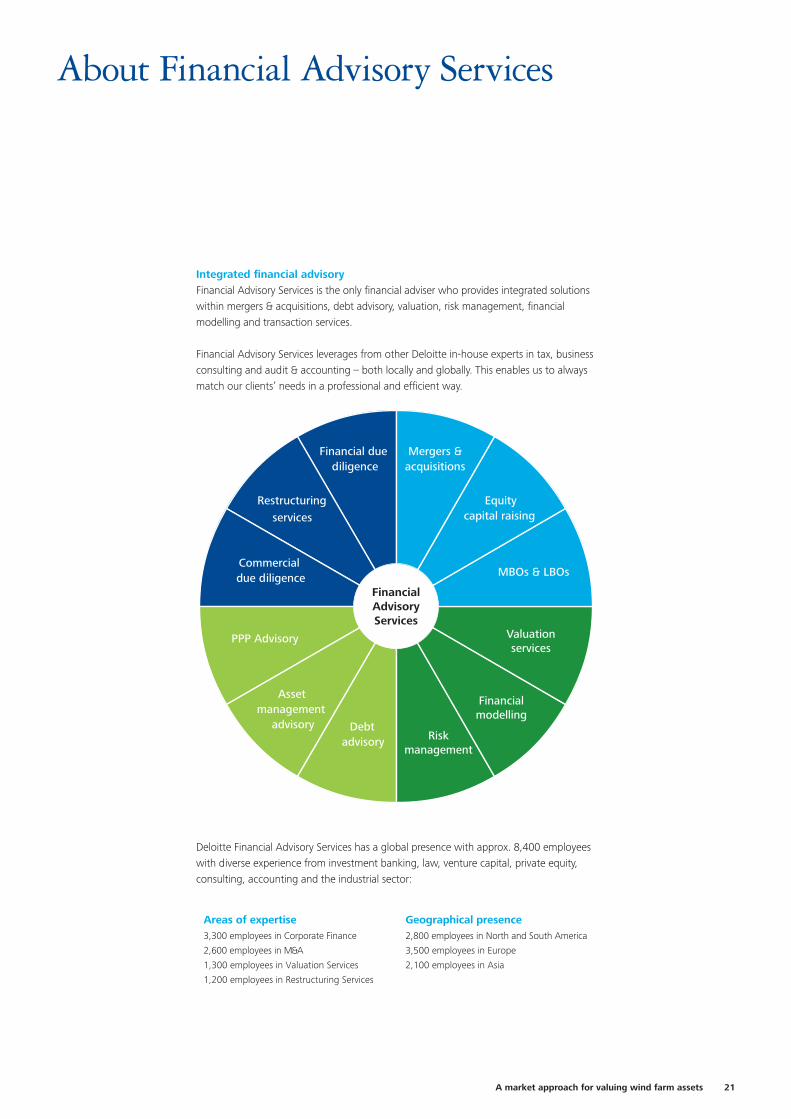
Integrated financial advisoryFinancial Advisory Services is the only financial adviser who provides integrated solutions within mergers & acquisitions, debt advisory, valuation, risk management, financial modelling and transaction services.
Financial Advisory Services leverages from other Deloitte in-house experts in tax, business consulting and audit & accounting – both locally and globally. This enables us to always match our clients’ needs in a professional and efficient way.
Financial due diligence
Mergers &acquisitions
Equitycapital raising
FinancialAdvisoryServices
Restructuring
services
Commercial due diligence MBOs & LBOs
Valuationservices
PPP Advisory
Asset management
advisory Debt advisory
Financialmodelling
Riskmanagement
Deloitte Financial Advisory Services has a global presence with approx. 8,400 employees with diverse experience from investment banking, law, venture capital, private equity, consulting, accounting and the industrial sector:
3,300 employees in Corporate Finance
2,600 employees in M&A
1,300 employees in Valuation Services
1,200 employees in Restructuring Services
2,800 employees in North and South America
3,500 employees in Europe
2,100 employees in Asia
Areas of expertise Geographical presence
22
CopenhagenWeidekampsgade 62300 Copenhagen STel. +45 36 10 20 [email protected]
Tinus B. ChristensenPartnerValuation ServicesTel. +45 36 10 31 [email protected]
Thomas BertelsenManagerDebt & Capital AdvisoryTel. +45 30 93 53 [email protected]
Deloitte contacts
Troels E. LorentzenDirectorFinancial ModellingTel. +45 89 41 42 [email protected]
Steffen LückManagerFinancial ModellingTel. +45 23 20 50 [email protected]
Rasmus MaarbjergAssociateFinancial ModellingTel. +45 30 93 62 [email protected]


About DeloitteDeloitte provides audit, tax, consulting, and financial advisory services to public and private clients spanning multiple industries. With a globally connected network of member firms in more than 150 countries, Deloitte brings world-class capabilities and high-quality service to clients, delivering the insights they need to address their most complex business challenges. Deloitte has in the region of 200,000 professionals, all committed to becoming the standard of excellence.
Deloitte Touche Tohmatsu LimitedDeloitte refers to one or more of Deloitte Touche Tohmatsu Limited, a UK private company limited by guarantee, and its network of member firms, each of which is a legally separate and independent entity. Please see www.deloitte.com/about for a detailed description of the legal structure of Deloitte Touche Tohmatsu Limited and its member firms.
© 2014 Deloitte Statsautoriseret Revisionspartnerselskab. Member of Deloitte Touche Tohmatsu Limited