A Market Analysis of the Bitcoin Economy - Finance 2.0 Market Analysis of the Bitcoin Economy Paolo...
28
A Market Analysis of the Bitcoin Economy Paolo Tasca Deutsche Bundesbank, 1 ECUREX Research Zurich :: Finance 2.0 | CRYPTO 2015 September 23, 2015 1 The statements reflect the personal views of the speaker and do not necessarily coincide with the position of the Deutsche Bundesbank. Paolo Tasca (BBK & ECUREX) Zurich :: Finance 2.0 |CRYPTO2015 September 23, 2015 1 / 28
Transcript of A Market Analysis of the Bitcoin Economy - Finance 2.0 Market Analysis of the Bitcoin Economy Paolo...

A Market Analysis of the Bitcoin Economy
Paolo Tasca
Deutsche Bundesbank,1 ECUREX Research
Zurich :: Finance 2.0 | CRYPTO 2015
September 23, 2015
1The statements reflect the personal views of the speaker and do not necessarilycoincide with the position of the Deutsche Bundesbank.
Paolo Tasca (BBK & ECUREX) Zurich :: Finance 2.0 |CRYPTO2015 September 23, 2015 1 / 28
1 Bitcoin as Payment Network
2 Bitcoin as Currency
3 Groups of Interest. Investors
4 Distribution of Income and Wealth
5 Take-home Message
Paolo Tasca (BBK & ECUREX) Zurich :: Finance 2.0 |CRYPTO2015 September 23, 2015 2 / 28
https://ecurex.com/2015report
Paolo Tasca (BBK & ECUREX) Zurich :: Finance 2.0 |CRYPTO2015 September 23, 2015 3 / 28

Bitcoin as Payment Network. Network Expansion
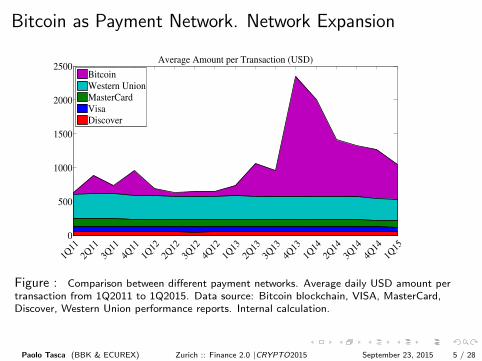
The average amount transferred per Bitcoin transaction is larger thanin any other major payment network.
During the period 2011–2015, the average amount (in USD equivalent) pertransaction constantly increased, and remained larger than in the majorpayment networks such as Visa, Mastercard, Discover, or Western Union.
The Bitcoin network is mostly used to remit money from user to user.2
2Studies show that the amount migrants send per transaction typically rangesbetween USD 100 and USD 1,000 for international remittances (e.g., Sander C., 2003);Paolo Tasca (BBK & ECUREX) Zurich :: Finance 2.0 |CRYPTO2015 September 23, 2015 4 / 28
Bitcoin as Payment Network. Network Expansion
0
500
1000
1500
2000
2500
1Q11
2Q11
3Q11
4Q11
1Q12
2Q12
3Q12
4Q12
1Q13
2Q13
3Q13
4Q13
1Q14
2Q14
3Q14
4Q14
1Q15
Average Amount per Transaction (USD)
Bitcoin
Western Union
MasterCard
Visa
Discover
Figure : Comparison between different payment networks. Average daily USD amount pertransaction from 1Q2011 to 1Q2015. Data source: Bitcoin blockchain, VISA, MasterCard,Discover, Western Union performance reports. Internal calculation.
Paolo Tasca (BBK & ECUREX) Zurich :: Finance 2.0 |CRYPTO2015 September 23, 2015 5 / 28

Bitcoin as Currency. Network Expansion
The relative capitalisation of Bitcoin with regard to other digitalcurrencies is receding in favour of Ripples.
Until mid-2014, Bitcoin dominated the digital currency market bycovering up to 95% of its total volume.
Since the 2nd part of 2014, the Bitcoin dominant position has beeneroded by Ripple, which now covers about 10% of the total marketcapitalisation.
Even though Bitcoin remains dominant on the digital currencymarket, the relative currency strength of Bitcoin has decreased – onaverage –, compared to that of the other (almost) existing 500 digitalcurrencies.
Paolo Tasca (BBK & ECUREX) Zurich :: Finance 2.0 |CRYPTO2015 September 23, 2015 6 / 28

Bitcoin as Currency. Network Expansion
01/11 07/11 01/12 07/12 01/13 07/13 01/14 07/14 01/15 07/15
10%
20%
30%
40%
50%
60%
70%
80%
90%
100%Relative Market Cap
% Dogecoin
% Dash
% Litecoin
% Ripple
% Bitcoin
Figure : Relative market capitalisation of Bitcoin, Ripple, Litecoin, Dash, Dogecoin. Datasource : Coinmarketcap. Internal calculation.
Paolo Tasca (BBK & ECUREX) Zurich :: Finance 2.0 |CRYPTO2015 September 23, 2015 7 / 28

Bitcoin as Currency. Currency Competition
01/14 04/14 07/14 10/14 01/15 04/15 07/150
50
100
150
200
250
300
350
400Relative Currency Strength
BTCX
LTCX
XRPX
Figure : Comparison between relative index strengths. Ba= 100 on 01.01.2014 (BTCX, LTCX,XRPX). Internal calculation.
Paolo Tasca (BBK & ECUREX) Zurich :: Finance 2.0 |CRYPTO2015 September 23, 2015 8 / 28

Bitcoin as Currency. Currency CompetitionBTCX: rel. strength of BTC wrt LTC and XRP, weighted by: (1) their respective rel.market cap. expressed in USD; (2) the inverse of the BTC exchange rate volatility.
LTCX: rel. strength of LTC wrt both BTC and XRP, weighted by: (1) their respective rel.market cap. expressed in USD; (2) the inverse of the LTC exchange rate volatility.
XRP: rel. strength of XRP wrt both BTC and LTC, weighted by: (1) their respective rel.market cap. expressed in USD; (2) the inverse of the XRP exchange rate volatility.
Currency competition expressed in currency strength indices
BTCX := ∆BTC × Exp
{Log
[BTC/LTC
σ (BTC/LTC)
](WBTC ) + Log
[BTC/XRP
σ (BTC/XRP)
](1−WBTC )
}LTCX := ∆LTC × Exp
{Log
[LTC/BTC
σ (LTC/BTC)
](WLTC ) + Log
[LTC/XRP
σ (LTC/XRP)
](1−WLTC )
}XRPX := ∆XRP × Exp
{Log
[XRP/BTC
σ (XRP/BTC)
](WXRP) + Log
[XRP/LTC
σ (XRP/LTC)
](1−WXRP)
}where:
WBTC =
(ωLTC
ωLTC + ωXRP
);WLTC =
(ωBTC
ωBTC + ωXRP
);WXRP =
(ωBTC
ωBTC + ωLTC
);
∆BTC , ∆LTC and ∆XRP are normalisation factors;
ωBTC , ωLTC , ωXRP : market capitalisation of BTC, LTC and XRP expressed in USD.
Paolo Tasca (BBK & ECUREX) Zurich :: Finance 2.0 |CRYPTO2015 September 23, 2015 9 / 28

Groups of Interest. Investors
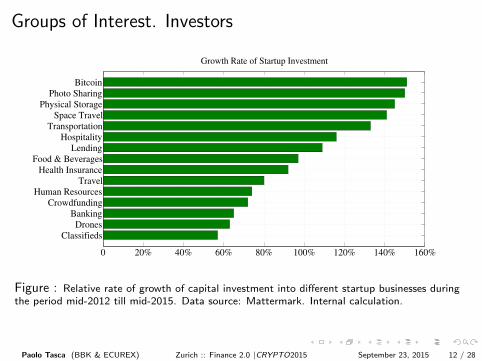
Bitcoin startups raised almost USD 1 billion in three years with anannual investment growth rate of about 150%
Capital investments in Bitcoin-related startups is a recent trend thatstarted in 1Q 2012.
Since 1Q 2012, the Bitcoin industry represents the fastest growingsector for capital investment.
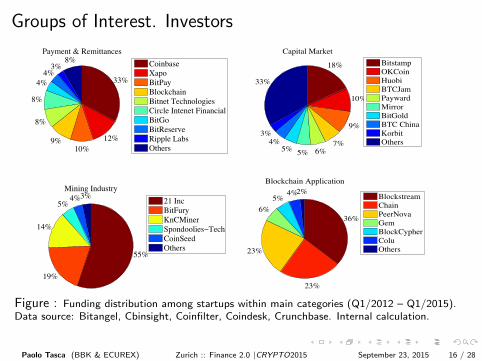
Within the Bitcoin sector, the Mining and Payment & Remittanceindustries drove the funding race.
21 Inc alone covered over half of the capital raised by the Miningindustry and Coinbase one third of the capital raised by the wholePayment & Remittance industry.
Paolo Tasca (BBK & ECUREX) Zurich :: Finance 2.0 |CRYPTO2015 September 23, 2015 10 / 28

Groups of Interest. Investors
0 1% 2% 3% 4% 5% 6% 7%
Classifieds
Drones
Banking
Crowdfunding
Human Resources
Travel
Health Insurance
Food & Beverages
Lending
Hospitality
Transportation
Space Travel
Physical Storage
Photo Sharing
Bitcoin
Relative Share of Dollars Raised
Figure : Relative Capital investment into different startup businesses during the periodmid-2012 till mid-2015. Data source: Mattermark. Internal calculation.
Paolo Tasca (BBK & ECUREX) Zurich :: Finance 2.0 |CRYPTO2015 September 23, 2015 11 / 28
Groups of Interest. Investors
0 20% 40% 60% 80% 100% 120% 140% 160%
Classifieds
Drones
Banking
Crowdfunding
Human Resources
Travel
Health Insurance
Food & Beverages
Lending
Hospitality
Transportation
Space Travel
Physical Storage
Photo Sharing
Bitcoin
Growth Rate of Startup Investment
Figure : Relative rate of growth of capital investment into different startup businesses duringthe period mid-2012 till mid-2015. Data source: Mattermark. Internal calculation.
Paolo Tasca (BBK & ECUREX) Zurich :: Finance 2.0 |CRYPTO2015 September 23, 2015 12 / 28

Groups of Interest. Investors
Capital Market Payment and Financial Blockchain Mining MiscellaneousRemittance Services Application Industry
Exchange Payment Accounting Smart Contracts Mining Solutions Bitcoin FaucetDerivatives Remittance Security Blockchain API Mining Pool TippingCommodity Wallet ATM MessagingInstitutional Trading Market andCrowdfunding and Data AnalysisCrypto Equity
Table : Classification of business categories in the Bitcoin industry.
Paolo Tasca (BBK & ECUREX) Zurich :: Finance 2.0 |CRYPTO2015 September 23, 2015 13 / 28

Groups of Interest. Investors
0
5
10
15
20
25
30
35
2012
Q1
2012
Q2
2012
Q3
2013
Q4
2013
Q1
2013
Q2
2013
Q3
2013
Q4
2014
Q1
2014
Q2
2014
Q3
2014
Q4
2015
Q1
Number of Deals
Payment & Remittances
Mining Industry
Capital Market
Blockchain Application
Financial Service
Miscellaneous
0
50
100
150
200
250
2012
Q1
2012
Q2
2012
Q3
2012
Q4
2013
Q1
2013
Q2
2013
Q3
2013
Q4
2014
Q1
2014
Q2
2014
Q3
2014
Q4
2015
Q1
(mil
lio
n U
SD
)
Quarterly Funding Amount for Bitcoin Startups
Payment & Remittances
Mining Industry
Capital Market
Blockchain Application
Financial Service
Miscellaneous
Figure : Left: Quarterly number of deals for startups in different Bitcoin industries. Right:Quarterly funding amount for startups in different Bitcoin industries. Data source: Bitangel,Cbinsight, Coinfilter, Coindesk, Crunchbase. Internal calculation.
Paolo Tasca (BBK & ECUREX) Zurich :: Finance 2.0 |CRYPTO2015 September 23, 2015 14 / 28

Groups of Interest. Investors
0
20
40
60
80
<0.1
mill
ion
0.1−
0.5
mill
ion
0.5−
1 m
illio
n
1−10
mill
ion
>10 m
illio
n
Number of Deals in Each Funding Scale (2012−2015)
Num
ber
of
Deals
Miscellaneous
Blockchain Application
Mining Industry
Financial Service
Capital Market
Payment & Remittances
Figure : Number of deals in each funding scale (Q1/2012 to Q1/2015). Deals in each fundingscale are further divided into business categories. Data source: Bitangel, Cbinsight, Coinfilter,Coindesk, Crunchbase. Internal calculation.
Paolo Tasca (BBK & ECUREX) Zurich :: Finance 2.0 |CRYPTO2015 September 23, 2015 15 / 28
Groups of Interest. Investors
8%3%
4%4%
8%
8%
9%10%
12%
33%
Payment & Remittances
CoinbaseXapoBitPayBlockchainBitnet TechnologiesCircle Intenet FinancialBitGoBitReserveRipple LabsOthers
33%
3%4%
5% 5% 6%7%
9%
10%
18%
Capital Market
BitstampOKCoinHuobiBTCJamPaywardMirrorBitGoldBTC ChinaKorbitOthers
3%4%5%
14%
19%
55%
Mining Industry
21 IncBitFuryKnCMinerSpondoolies−TechCoinSeedOthers
2%4%5%
6%
23%
23%
36%
Blockchain Application
BlockstreamChainPeerNovaGemBlockCypherColuOthers
Figure : Funding distribution among startups within main categories (Q1/2012 – Q1/2015).Data source: Bitangel, Cbinsight, Coinfilter, Coindesk, Crunchbase. Internal calculation.
Paolo Tasca (BBK & ECUREX) Zurich :: Finance 2.0 |CRYPTO2015 September 23, 2015 16 / 28

Distribution of Income and Wealth.
The wealth distribution in the Bitcoin ecosystem is highlyunequal,and this inequality is growing.
The inequality of the distribution of Bitcoins amongst addresses,summarised by the Gini coefficient grew from 0.09 in 2010 to 0.99in 2015.
During the period 20092015, the top 100 richest addresses kept aconstant relative wealth, totalling about 20% of the total value ofthe Bitcoin economy.
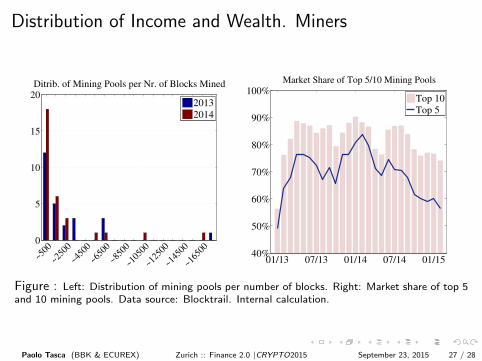
The Bitcoin mining market is under control by 5 to 7 major miningpools.
During the period 2013-2015, the cumulative market share of thelargest 10 pools relative to the total market hovered in the 70% –80% range.
Paolo Tasca (BBK & ECUREX) Zurich :: Finance 2.0 |CRYPTO2015 September 23, 2015 17 / 28

Distribution of Income and Wealth. Users
! !
Figure : Lorenz Curve and Gini Coefficient for the Bitcoin Economy. Percentile of addressessorted by wealth wrt to the percentile of the wealth own.
Paolo Tasca (BBK & ECUREX) Zurich :: Finance 2.0 |CRYPTO2015 September 23, 2015 18 / 28

Distribution of Income and Wealth. Users
! !
Figure : Lorenz Curve and Gini Coefficient for the Bitcoin Economy. Percentile of addressessorted by wealth wrt to the percentile of the wealth own.
Paolo Tasca (BBK & ECUREX) Zurich :: Finance 2.0 |CRYPTO2015 September 23, 2015 19 / 28

Distribution of Income and Wealth. Users
! !
Figure : Lorenz Curve and Gini Coefficient for the Bitcoin Economy. Percentile of addressessorted by wealth wrt to the percentile of the wealth own.
Paolo Tasca (BBK & ECUREX) Zurich :: Finance 2.0 |CRYPTO2015 September 23, 2015 20 / 28

Distribution of Income and Wealth. Users
The Gini coefficient (G) is an inequality index of income or wealth.3
G can be calculated from unordered size data as half of the Relative MeanDifference (RMD), which is the average absolute difference between everypossible pair of values, divided by the mean size µ,
G =RMD
2with : RMD =
MD
µ,MD =
1
n2
n∑i=1
n∑j=1
|xi − xj |
G=0: every person receives the same income;
G=1: theoretical value for n→∞ where a single person receives100% of the total income and the remaining people receive none
xi : income or wealth of person i .
n: population size.
3Gini C., Variabilita’ e mutabilita’, 1912, reprinted in Memorie di metodologica statistica(Ed. Pizetti E, Salvemini, T). Rome: Libreria Eredi Virgilio Veschi 1955.Paolo Tasca (BBK & ECUREX) Zurich :: Finance 2.0 |CRYPTO2015 September 23, 2015 21 / 28

Distribution of Income and Wealth. UsersThe Lorenz curve can be represented by a function L(F ) where:
F is the cumulative portion of the population represented by thehorizontal axis;
L is the cumulative portion of the total wealth or income representedby the vertical axis.
For a discrete probability function f (y), let yi , i = 1, .., n, be the pointswith non-zero probabilities indexed in increasing order (yi < yi+1). TheLorenz curve is the continuous piecewise linear function connecting thepoints (Fi , Li ), i = 0, ..., n, where F0 = 0, L0 = 0, and for i = 1, ..., n:
Fi =i∑
j=1
f (yj)
Li =SiSn
with Si =i∑
j=1
f (yj)yj
Paolo Tasca (BBK & ECUREX) Zurich :: Finance 2.0 |CRYPTO2015 September 23, 2015 22 / 28

Distribution of Income and Wealth. Users
10%
20%
30%
40%
50%
60%
70%
80%
90%
100%
01.09 04.10 12.10 10.11 09.12 08.13 05.14 03.15
Percent of Bitcoins Owned by Richest Addresses
Top 500Top 100
1 2 3 4 5 10 50 100 1500
50
100
150
200
250
300
Magnitude (thousand Bitcoin)
Fre
quency
Wealth Distribution of Top 500 Richest Addresses
2010
2011
2012
2013
2014
Figure : Left: Relative wealth of the top 100 and 500 richest Bitcoin addresses. Right: Wealthdistribution among the top 500 richest Bitcoin addresses (with x-axis log-transformed). Datasource: Bitcoin blockchain. Internal calculation.
Paolo Tasca (BBK & ECUREX) Zurich :: Finance 2.0 |CRYPTO2015 September 23, 2015 23 / 28

Distribution of Income and Wealth. Users
100BTC 1000BTC 10000BTC 100000BTC
101
102
103
104
105
Fre
quen
cy
Income Distribution for All Clusters (bin size: 100BTC)
Power Law Function:
y = (2.0133e+05) * x−1.2038
MSE: 1794790.7437
R2: 0.89329
Figure : Income distribution for all clusters. Data source: Bitcoin Core parsed from the 3rd ofJanuary 2009 until the 8th of May 2015. Total nr. addresses: 75,191,953. Total nr. clusters(contains at least addresses): 30,708,660 (9,847,999 ≥ 2 nodes) and 4,810,342 with non-zerobalance. Total TXs between clusters: 88,950,021. Internal calculation.
Paolo Tasca (BBK & ECUREX) Zurich :: Finance 2.0 |CRYPTO2015 September 23, 2015 24 / 28

Distribution of Income and Wealth. MinersGhash.IO hashing power was close to “51% attack” for several times.
01/13 05/13 09/13 12/13 04/14 08/14 12/14
20%
40%
60%
80%
100%Distribution of Transaction Fee in Each Diffeculty Level
Unknown
Others
BTCChina Pool
P2Pool.org
DeepBit
Ozcoin
CloudHashing
KNCMiner
Bitfury
AntPool
EclipseMC
ASICMiner
BitMinter
50BTC
Slush
Eligius
DiscusFish / F2Pool
BTC Guild
GHash.IO
Figure : Top 17 mining pools (out of 40) per relative amount of fees earned. In each difficultylevel, transaction fees collected by each mining pool are summed up and compared to the totalfees earned and collected by the market. Period: From January 2013 to February 2015. Datasource: Blocktrail. Internal calculation.
Paolo Tasca (BBK & ECUREX) Zurich :: Finance 2.0 |CRYPTO2015 September 23, 2015 25 / 28

Distribution of Income and Wealth. Miners
01/13 05/13 09/13 12/13 04/14 08/14 12/140
500
1000
1500
20002
01
6 B
lock
s in
Each
Dif
ficu
lty
Lev
el
Mining Market Share among Countries (by number of blocks)
Unknown
USA
Global
Europe
China
Figure : Top mining activity per country. Mining pools are classified per country of operation.Many mining pools operate in different countries (e.g, BTC Guild and BitMinter run theirmining operation in both USA and Europe), so they are classified as “Global”. Period: fromJanuary 2013 to February 2015. Data source: Blocktrail, Bitcoin Wiki (comparison of miningpools). Internal calculation.
Paolo Tasca (BBK & ECUREX) Zurich :: Finance 2.0 |CRYPTO2015 September 23, 2015 26 / 28
Distribution of Income and Wealth. Miners
0
5
10
15
20
~500
~4500
~6500
~8500
~1050
0
~1250
0
~1450
0
~1650
0
Ditrib. of Mining Pools per Nr. of Blocks Mined
~2500
2013
2014
01/13 07/13 01/14 07/14 01/1540%
50%
60%
70%
80%
90%
100%Market Share of Top 5/10 Mining Pools
Top 10
Top 5
Figure : Left: Distribution of mining pools per number of blocks. Right: Market share of top 5and 10 mining pools. Data source: Blocktrail. Internal calculation.
Paolo Tasca (BBK & ECUREX) Zurich :: Finance 2.0 |CRYPTO2015 September 23, 2015 27 / 28

Take-Home Message
1 The average amount transferred per Bitcoin transaction is larger than in any other majorpayment network.
2 The relative capitalisation of Bitcoin with regard to other digital currencies is receding infavour of Ripple’s.
3 China is the largest country in the world per: (1) number of active Bitcoin clients; (2)mining capacity; (3) volume of Bitcoins exchanged via electronic trading platforms.
4 Bitcoin startups raised almost USD 1 billion in three years with an annual investmentgrowth rate of about 150%.
5 In Jan. 2015 the Bitcoin volume exchanged on electronic trading platforms reached 50%of the total number of Bitcoins ever mined at that time.
6 During the year 2014, the transaction costs in digital currencies dropped significantly.
7 The year 2014 saw fewer incidences and less arbitrage opportunities than the previousyears. In effect, the digital currency market is becoming more efficient.
8 The wealth distribution in the Bitcoin ecosystem is highly unequal, and this inequality isgrowing.
9 The Mining industry is consolidating as an oligopoly.
Paolo Tasca (BBK & ECUREX) Zurich :: Finance 2.0 |CRYPTO2015 September 23, 2015 28 / 28


![CryptoNote v 2.0 from3.5%creditcardfeestoessentially0 ... › whitepaper_annotated.pdf · CryptoNote v 2.0 Nicolas van Saberhagen October 17, 2013 1 Introduction \Bitcoin" [1] has](https://static.fdocuments.in/doc/165x107/5f1ef555ba0d79177447d92e/cryptonote-v-20-from35creditcardfeestoessentially0-a-whitepaperannotatedpdf.jpg)