a Marine Biotic Index To Establish The Ecological - ECASA · A Marine Biotic Index to Establish the...
15
A Marine Biotic Index to Establish the Ecological Quality of Soft-Bottom Benthos Within European Estuarine and Coastal Environments A. BORJA*, J. FRANCO and V. P EREZ Department of Oceanography and Marine Environment, Technological Institute for Fisheries and Food (AZTI), Av. Satr ustegui 8, 20008 San Sebasti an, Spain In this paper, a marine Biotic Index (BI) for soft-bottom benthos of European estuarine and coastal environments is proposed. This is derived from the proportions of indi- vidual abundance in five ecological groups, which are re- lated to the degree of sensitivity/tolerance to an environmental stress gradient. The main dierence with previously published indices is the use of a simple formula that produces a continuous Biotic Coecient (BC) – which makes it more suitable for statistical analysis, in opposition with previous discreet biotic indices – not af- fected by subjectivity. Relationships between this coe- cient and a complementary BI with several environmental variables are discussed. Finally, a validation of the pro- posed index is made with data from systems aected by recent human disturbances, showing that dierent an- thropogenic changes in the environment can be detected through the use of this BI. Ó 2000 Elsevier Science Ltd. All rights reserved. Keywords: biotic index; ecological quality; diversity; benthos; soft-bottom; European coastal environments. Introduction Marine environmental quality control is undertaken usually by means of monitoring dierent parameters in water, sediment and sentinel organisms (i.e. Mussel Watch), as in the USA (OÕConnor, 1992), France (RNO, 1998) or Great Britain (Franklin and Jones, 1994). This control is centred on physico-chemical and ecotoxico- logical variables and, less usually, on biological vari- ables. Dauer (1993) stated that biological criteria are considered important components of water quality be- cause: (i) they are direct measures of the condition of the biota, (ii) they may uncover problems undetected or underestimated by other methods; and (iii) such criteria provide measurements of the progress of restoration eorts. New European rules (see Directive Proposal 1999/C 343/01, Ocial Journal of the European Communities 30/11/1999) emphasize the importance of biological in- dicators, in order to establish the ecological quality of European coasts and estuaries. Benthic invertebrates are used frequently as bio-indicators of marine monitoring, because various studies have demonstrated that macro- benthos responds relatively rapidly to anthropic and natural stress (Pearson and Rosenberg, 1978; Dauer, 1993). River ecology has an established long tradition in applying macrobenthos as bio-indicators; likewise some biotic indices have been proposed (Woodiwiss, 1964; Cairns et al., 1968; Chandler, 1970; ISO-BMWP, 1979, etc.). On the other hand, some attempts to provide useful ‘tools’ to measure ecological quality in the marine environment have been developed in Europe and North America (Hily, 1984; Majeed, 1987; Dauer, 1993; Grall and Gl emarec, 1997; Weisberg et al., 1997). All the aforementioned studies utilize soft-bottom communities to construct the indices, because macro- benthic animals are relatively sedentary (and cannot avoid deteriorating water/sediment quality conditions), have relatively long life-spans (thus, indicate and inte- grate water/sediment quality conditions, with time), consist of dierent species that exhibit dierent toler- ances to stress and have an important role in cycling nutrients and materials between the underlying sedi- ments and the overlying water column (Hily, 1984; Dauer, 1993). In this contribution, a marine Biotic Index (BI) is designed to establish the ecological quality of European coasts. This explores the response of soft-bottom com- munities to natural and man-induced changes in water quality, integrating long-term environmental conditions. Marine Pollution Bulletin Vol. 40, No. 12, pp. 1100–1114, 2000 Ó 2000 Elsevier Science Ltd. All rights reserved Printed in Great Britain 0025-326X/00 $ - see front matter PII: S0025-326X(00)00061-8 *Corresponding author. E-mail address: [email protected] (A. Borja). 1100
Transcript of a Marine Biotic Index To Establish The Ecological - ECASA · A Marine Biotic Index to Establish the...

A Marine Biotic Index to Establish theEcological Quality of Soft-BottomBenthos Within European Estuarine andCoastal EnvironmentsA. BORJA*, J. FRANCO and V. P�EREZDepartment of Oceanography and Marine Environment, Technological Institute for Fisheries and Food (AZTI),Av. Satr�ustegui 8, 20008 San Sebasti�an, Spain
In this paper, a marine Biotic Index (BI) for soft-bottombenthos of European estuarine and coastal environments isproposed. This is derived from the proportions of indi-vidual abundance in ®ve ecological groups, which are re-lated to the degree of sensitivity/tolerance to anenvironmental stress gradient. The main di�erence withpreviously published indices is the use of a simple formulathat produces a continuous Biotic Coe�cient (BC) ±which makes it more suitable for statistical analysis, inopposition with previous discreet biotic indices ± not af-fected by subjectivity. Relationships between this coe�-cient and a complementary BI with several environmentalvariables are discussed. Finally, a validation of the pro-posed index is made with data from systems a�ected byrecent human disturbances, showing that di�erent an-thropogenic changes in the environment can be detectedthrough the use of this BI. Ó 2000 Elsevier Science Ltd.All rights reserved.
Keywords: biotic index; ecological quality; diversity;benthos; soft-bottom; European coastal environments.
Introduction
Marine environmental quality control is undertakenusually by means of monitoring di�erent parameters inwater, sediment and sentinel organisms (i.e. MusselWatch), as in the USA (OÕConnor, 1992), France (RNO,1998) or Great Britain (Franklin and Jones, 1994). Thiscontrol is centred on physico-chemical and ecotoxico-logical variables and, less usually, on biological vari-ables. Dauer (1993) stated that biological criteria areconsidered important components of water quality be-cause: (i) they are direct measures of the condition of the
biota, (ii) they may uncover problems undetected orunderestimated by other methods; and (iii) such criteriaprovide measurements of the progress of restoratione�orts.
New European rules (see Directive Proposal 1999/C343/01, O�cial Journal of the European Communities30/11/1999) emphasize the importance of biological in-dicators, in order to establish the ecological quality ofEuropean coasts and estuaries. Benthic invertebrates areused frequently as bio-indicators of marine monitoring,because various studies have demonstrated that macro-benthos responds relatively rapidly to anthropic andnatural stress (Pearson and Rosenberg, 1978; Dauer,1993).
River ecology has an established long tradition inapplying macrobenthos as bio-indicators; likewise somebiotic indices have been proposed (Woodiwiss, 1964;Cairns et al., 1968; Chandler, 1970; ISO-BMWP, 1979,etc.). On the other hand, some attempts to provideuseful `tools' to measure ecological quality in the marineenvironment have been developed in Europe and NorthAmerica (Hily, 1984; Majeed, 1987; Dauer, 1993; Gralland Gl�emarec, 1997; Weisberg et al., 1997).
All the aforementioned studies utilize soft-bottomcommunities to construct the indices, because macro-benthic animals are relatively sedentary (and cannotavoid deteriorating water/sediment quality conditions),have relatively long life-spans (thus, indicate and inte-grate water/sediment quality conditions, with time),consist of di�erent species that exhibit di�erent toler-ances to stress and have an important role in cyclingnutrients and materials between the underlying sedi-ments and the overlying water column (Hily, 1984;Dauer, 1993).
In this contribution, a marine Biotic Index (BI) isdesigned to establish the ecological quality of Europeancoasts. This explores the response of soft-bottom com-munities to natural and man-induced changes in waterquality, integrating long-term environmental conditions.
Marine Pollution Bulletin Vol. 40, No. 12, pp. 1100±1114, 2000
Ó 2000 Elsevier Science Ltd. All rights reserved
Printed in Great Britain
0025-326X/00 $ - see front matterPII: S0025-326X(00)00061-8
*Corresponding author.E-mail address: [email protected] (A. Borja).
1100
Methods
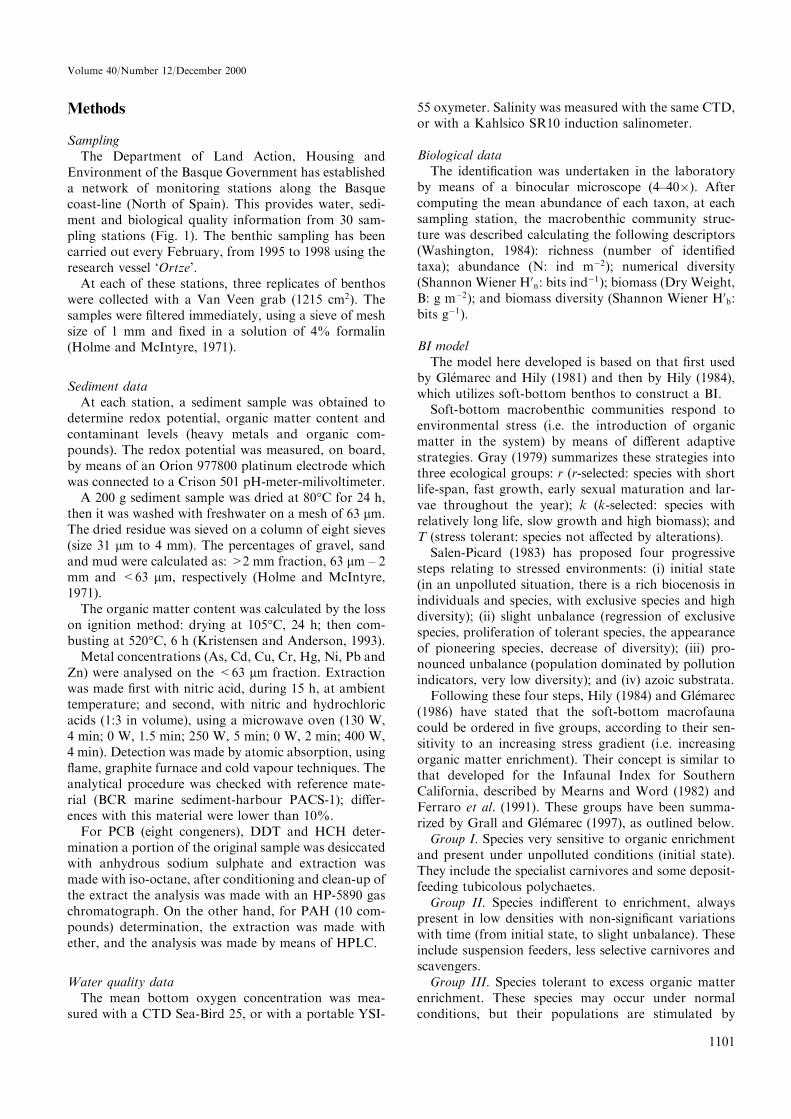
SamplingThe Department of Land Action, Housing and
Environment of the Basque Government has establisheda network of monitoring stations along the Basquecoast-line (North of Spain). This provides water, sedi-ment and biological quality information from 30 sam-pling stations (Fig. 1). The benthic sampling has beencarried out every February, from 1995 to 1998 using theresearch vessel `Ortze'.
At each of these stations, three replicates of benthoswere collected with a Van Veen grab (1215 cm2). Thesamples were ®ltered immediately, using a sieve of meshsize of 1 mm and ®xed in a solution of 4% formalin(Holme and McIntyre, 1971).
Sediment dataAt each station, a sediment sample was obtained to
determine redox potential, organic matter content andcontaminant levels (heavy metals and organic com-pounds). The redox potential was measured, on board,by means of an Orion 977800 platinum electrode whichwas connected to a Crison 501 pH-meter-milivoltimeter.
A 200 g sediment sample was dried at 80°C for 24 h,then it was washed with freshwater on a mesh of 63 lm.The dried residue was sieved on a column of eight sieves(size 31 lm to 4 mm). The percentages of gravel, sandand mud were calculated as: >2 mm fraction, 63 lm ± 2mm and <63 lm, respectively (Holme and McIntyre,1971).
The organic matter content was calculated by the losson ignition method: drying at 105°C, 24 h; then com-busting at 520°C, 6 h (Kristensen and Anderson, 1993).
Metal concentrations (As, Cd, Cu, Cr, Hg, Ni, Pb andZn) were analysed on the <63 lm fraction. Extractionwas made ®rst with nitric acid, during 15 h, at ambienttemperature; and second, with nitric and hydrochloricacids (1:3 in volume), using a microwave oven (130 W,4 min; 0 W, 1.5 min; 250 W, 5 min; 0 W, 2 min; 400 W,4 min). Detection was made by atomic absorption, using¯ame, graphite furnace and cold vapour techniques. Theanalytical procedure was checked with reference mate-rial (BCR marine sediment-harbour PACS-1); di�er-ences with this material were lower than 10%.
For PCB (eight congeners), DDT and HCH deter-mination a portion of the original sample was desiccatedwith anhydrous sodium sulphate and extraction wasmade with iso-octane, after conditioning and clean-up ofthe extract the analysis was made with an HP-5890 gaschromatograph. On the other hand, for PAH (10 com-pounds) determination, the extraction was made withether, and the analysis was made by means of HPLC.
Water quality dataThe mean bottom oxygen concentration was mea-
sured with a CTD Sea-Bird 25, or with a portable YSI-
55 oxymeter. Salinity was measured with the same CTD,or with a Kahlsico SR10 induction salinometer.
Biological dataThe identi®cation was undertaken in the laboratory
by means of a binocular microscope (4±40�). Aftercomputing the mean abundance of each taxon, at eachsampling station, the macrobenthic community struc-ture was described calculating the following descriptors(Washington, 1984): richness (number of identi®edtaxa); abundance (N: ind mÿ2); numerical diversity(Shannon Wiener H0n: bits indÿ1); biomass (Dry Weight,B: g mÿ2); and biomass diversity (Shannon Wiener H0b:bits gÿ1).
BI modelThe model here developed is based on that ®rst used
by Gl�emarec and Hily (1981) and then by Hily (1984),which utilizes soft-bottom benthos to construct a BI.
Soft-bottom macrobenthic communities respond toenvironmental stress (i.e. the introduction of organicmatter in the system) by means of di�erent adaptivestrategies. Gray (1979) summarizes these strategies intothree ecological groups: r (r-selected: species with shortlife-span, fast growth, early sexual maturation and lar-vae throughout the year); k (k-selected: species withrelatively long life, slow growth and high biomass); andT (stress tolerant: species not a�ected by alterations).
Salen-Picard (1983) has proposed four progressivesteps relating to stressed environments: (i) initial state(in an unpolluted situation, there is a rich biocenosis inindividuals and species, with exclusive species and highdiversity); (ii) slight unbalance (regression of exclusivespecies, proliferation of tolerant species, the appearanceof pioneering species, decrease of diversity); (iii) pro-nounced unbalance (population dominated by pollutionindicators, very low diversity); and (iv) azoic substrata.
Following these four steps, Hily (1984) and Gl�emarec(1986) have stated that the soft-bottom macrofaunacould be ordered in ®ve groups, according to their sen-sitivity to an increasing stress gradient (i.e. increasingorganic matter enrichment). Their concept is similar tothat developed for the Infaunal Index for SouthernCalifornia, described by Mearns and Word (1982) andFerraro et al. (1991). These groups have been summa-rized by Grall and Gl�emarec (1997), as outlined below.
Group I. Species very sensitive to organic enrichmentand present under unpolluted conditions (initial state).They include the specialist carnivores and some deposit-feeding tubicolous polychaetes.
Group II. Species indi�erent to enrichment, alwayspresent in low densities with non-signi®cant variationswith time (from initial state, to slight unbalance). Theseinclude suspension feeders, less selective carnivores andscavengers.
Group III. Species tolerant to excess organic matterenrichment. These species may occur under normalconditions, but their populations are stimulated by
1101
Volume 40/Number 12/December 2000
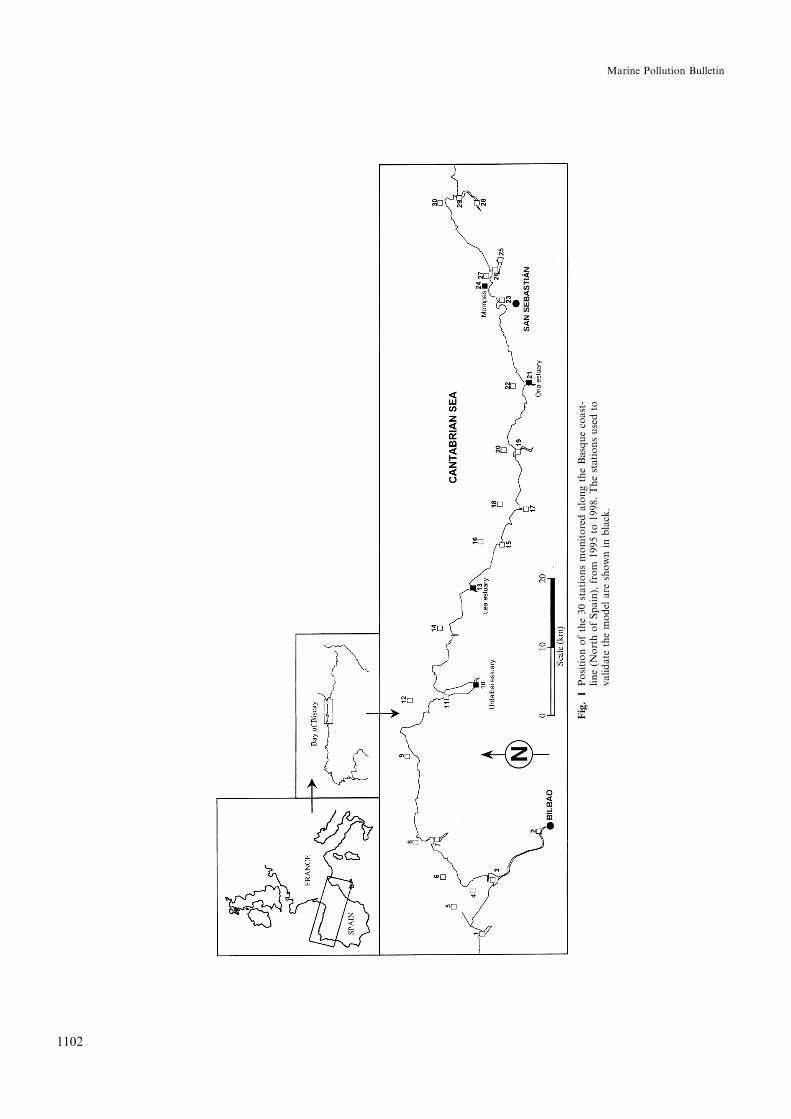
Fig.1
Positionofthe30stationsmonitoredalongtheBasquecoast-
line(N
orthofSpain),from
1995to
1998.Thestationsusedto
validate
themodel
are
shownin
black.
1102
Marine Pollution Bulletin

organic richment (slight unbalance situations). They aresurface deposit-feeding species, as tubicolous spionids.
Group IV. Second-order opportunistic species (slightto pronounced unbalanced situations). Mainly smallsized polychaetes: subsurface deposit-feeders, such ascirratulids.
Group V. First-order opportunistic species (pro-nounced unbalanced situations). These are deposit-feeders, which proliferate in reduced sediments.
The distribution of these ecological groups, accordingto their sensitivity to pollution stress, provides a BI witheight levels, from 0 to 7 (Hily, 1984; Hily et al., 1986;Majeed, 1987).
In the aforementioned monitoring network of sam-pling stations, together with other studies developed byAZTI along the Basque coastline within the last ®veyears (Borja et al., 1995, 1999a,b), more than 900 taxahave been identi®ed. These species are representative ofthe most important soft-bottom communities present atEuropean estuarine and coastal systems. The taxa havebeen classi®ed (list in Appendix A) according to theabove ecological groups, following Majeed (1987),Dauer (1993), Weisberg et al. (1997), Grall andGl�emarec (1997) and Roberts et al. (1998). Only about
12% of the taxa have not been possible to be assigned toan ecological group.
Based upon HilyÕs model (Hily, 1984; Hily et al., 1986;Majeed, 1987), Fig. 2 shows the theoretical distributionof relative abundance of each ecological group, along apollution gradient.
A possible limitation in the utilisation of the model ofHily is that each BI has a discreet value and its calcu-lation is not systematized. In order to improve the index,a single formula is proposed here. This is based upon thepercentages of abundance of each ecological group,within each sample, to obtain a continuous index (theBiotic Coe�cient (BC)), where
Biotic Coefficient � f�0�% GI� � �1:5�% GII�� �3�% GIII� � �4:5�% GIV�� �6�% GV�g=100:
The above-mentioned ecological groups (GI, GII,GIII, GIV and GV) are summarized in Table 1. Speciesnot assigned to a group were not taken into account.These species represent only a mean abundance of 1.4%,for the total number of samples.
In this way, use of the BC can derive a series ofcontinuous values, from 0 to 6, being 7 when the sedi-ment is azoic. Nonetheless, the BC can be compared tothe Grall and Gl�emarec (1997) BI, as adapted in thispaper (Table 1). The result obtained is a `pollutionclassi®cation' of a site which is a function of the BC.Consequently, this represents the benthic community`health', represented by the entire numbers of the BI.
Results
The mean and standard error values of grain size andphysical characteristic associated with each of the sam-pling stations (17 estuarine and 13 littoral) are listed inTable 2. The water depth range is very large at each ofthe stations (under Mean High Water Neap to 24 m inthe estuaries and 30±35 m associated with the littoralsamples). Mean salinity, at bottom water, ranges from16.2 to 35.3 in estuaries, but is restricted within thecoastal areas (35.3±35.5).
The range in the percentage of oxygen saturation isvery high within the estuaries (43±119%), but ranges inthe littoral stations from 92% to 97%. The organic
Fig. 2 Theoretical model, modi®ed from Hily (1984), Hily et al. (1986)and Majeed (1987), which provides the ordination of soft-bottom macrofauna species into ®ve ecological groups (GroupI: species very sensitive; Group II: species indi�erent; GroupIII: species tolerant; Group IV: second-order opportunisticspecies; Group V: ®rst-order opportunistic species), accordingto their sensitivity to an increasing pollution gradient. Therelative proportion of abundance of each group in a sampleprovides a discreet BI with eight levels (0±7) and an equivalentcontinuous BC (values between 0 and 6).
TABLE 1
Summary of the BC and BI (modi®ed from Grall and Gl�emarec, 1997).
Site pollution classi®cation Biotic Coe�cient Biotic index Dominating ecological group Benthic community health
Unpolluted 0:0 < BC � 0:2 0 I NormalUnpolluted 0:2 < BC � 1:2 1 ImpoverishedSlightly polluted 1:2 < BC � 3:3 2 III UnbalancedMeanly polluted 3:3 < BC � 4:3 3 Transitional to pollutionMeanly polluted 4:5 < BC � 5:0 4 IV±V PollutedHeavily polluted 5:0 < BC � 5:5 5 Transitional to heavy pollutionHeavily polluted 5:5 < BC � 6:0 6 V Heavy pollutedExtremely polluted Azoic 7 Azoic Azoic
1103
Volume 40/Number 12/December 2000

matter content in the sediments is higher in the estuaries(2.3±28.2%) than in littoral zone (3.4±6.8%). This cor-responds to a higher range of the mud content within thesediments (0.3±80.1% and 0.1±17.3%, respectively). Theredox potential ranges from )185 to 410 mV within theestuaries, and from )84 to 405 mV within the littoralsamples.
From 30 stations, some 114 samples of benthos havebeen obtained over a 4 year period. These samplescorrespond to di�erent environments (estuarine, littoral,intertidal, subtidal) and physico-chemical characteristics(reduced and oxidized sediments, hypoxia and oversat-uration in the bottom waters, poor organic matterproportion and enrichment, etc.).
After the application of the BC, considering its cor-respondence with the BI (Table 1), the results were: 2samples with a BI� 0; 23 samples of BI� 1; 48 samplesof BI� 2; 15 samples of BI� 3; 7 samples of BI� 4; 6samples of BI� 5; 6 samples of BI� 6; and 7 samples ofBI� 7.
Fig. 3 shows the results obtained by comparing dif-ferent biological parameters, on samples having thesame biotic indices. The BI� 7 is equivalent to an azoicsite, so all the biological parameters are equal to 0 inthese particular samples.
The mean abundance increases from 36.7 ind mÿ2
(BI� 0) to 2 559 ind mÿ2 (BI� 6), with the exception ofBI� 5, with a value of 456 ind mÿ2 (Fig. 3(a)). Withinthe lowest of the Biotic Indices (0, 1 and 2), the standarderror of the mean is very small; it is progressively largerin the highest.
Statistical analyses were made considering the BCbecause, as this coe�cient can derive continuous values,it is more suitable for this purpose than the BI. Takinginto account all the samples analysed, the non-para-metric Spearman rank correlation between the abun-dance and the BC is not statistically signi®cant(p > 0:05).
On the other hand, biomass (Fig. 3(b)) increases from0.1 g mÿ2 (BI� 0) to 14.3 g mÿ2 (BI� 4). However forBiotic Indices 5 and 6, dominated by small opportunisticspecies, the biomass is lower than 4 g mÿ2. There is no astatistically signi®cant correlation between biomass andBC (Spearman rank correlation).
Fig. 3(c) shows the mean richness of the samples.Except in the case of BI� 0, with a mean richness of 2,in the other biotic indices the richness decreases pro-gressively from 26 to 27 species (BI� 1 and 2) to 0species (BI� 7). Richness and BC are highly correlated(p < 0:001, Spearman rank correlation).
TABLE 2
Physico-chemical characterisation of sampling stations, showing mean and standard error (SE) values of some sedimentological and waterparameters.a
Stationnumber
Stationtype
Depth(m)
Salinity Dissolvedoxygen (ml lÿ1)
% Oxygensaturation
% Sand % Mud % Organicmatter
Redoxpotential (mV)
Mean Mean� SE Mean� SE Mean� SE Mean� SE Mean� SE Mean� SE Mean� SE
1 E I 23:5� 2:3 6:1� 0:2 101� 3:8 95:1� 3:8 4:6� 4:0 5:2� 0:2 296� 41:72 E 3 16:2� 2:0 3:1� 0:5 43� 6:0 38:5� 6:3 47:7� 6:2 8:7� 1:0 ÿ101� 38:23 E 14 35:1� 0:1 5:0� 0:1 87� 1:7 19:6� 2:1 80:1� 2:1 13:0� 0:3 ÿ53� 37:74 E 24 35:3� 0:1 5:4� 0:1 94� 1:3 80:7� 4:6 18:3� 4:8 6:0� 0:4 153� 45:25 L 34 35:3� 0:1 5:6� 0:1 96� 1:7 96:3� 0:8 3:3� 0:9 3:9� 0:3 248� 45:56 L 32 35:3� 0:1 5:5� 0:1 95� 1:7 94:8� 3:2 0:4� 0:2 6:8� 1:7 405� 18:27 E I 29:5� 1:6 6:1� 0:2 105� 3:3 85:3� 2:4 0:5� 0:2 2:3� 0:1 388� 18:78 L 34 35:4� 0:0 5:5� 0:1 95� 1:5 81:5� 6:7 0:7� 0:5 3:8� 0:8 389� 7:29 L 33 35:4� 0:0 5:5� 0:1 96� 2:0 98:4� 0:2 1:1� 0:2 3:4� 0:4 322� 26:910 E I 25:7� 2:5 6:1� 0:2 102� 3:3 27:4� 2:9 64:8� 4:2 7:7� 0:4 25� 20:211 E I 34:8� 0:1 6:6� 0:2 119� 3:3 97:6� 1:3 0:3� 0:3 3:4� 0:5 410� 45:012 L 31 35:5� 0:0 5:6� 0:1 97� 1:8 95:6� 0:8 3:6� 0:8 3:6� 0:7 268� 43:813 E I 26:3� 3:0 6:5� 0:2 111� 3:1 82:4� 4:8 12:5� 3:9 4:6� 0:7 167� 50:414 L 34 35:5� 0:0 5:6� 0:1 96� 2:0 93:8� 2:3 5:4� 2:3 3:7� 0:3 299� 34:515 E I 28:9� 1:6 5:0� 0:3 87� 3:9 38:6� 3:1 16:7� 2:6 6:1� 0:5 0� 32:316 L 34 35:4� 0:1 5:3� 0:3 94� 3:4 94:3� 3:5 0:1� 0:1 3:7� 0:6 336� 11:517 E I 17:5� 2:7 5:9� 0:2 89� 3:7 55:8� 5:8 40:3� 6:8 6:7� 0:6 63� 48:918 L 32 35:4� 0:1 5:4� 0:1 94� 1:8 95:1� 1:0 3:3� 1:0 4:2� 0:1 264� 37:219 E I 23:3� 2:2 5:8� 0:2 96� 2:9 40:1� 5:2 51:3� 5:6 9:0� 0:7 24� 21:320 L 32 35:4� 0:0 5:3� 0:1 93� 2:0 84:8� 6:5 8:7� 6:7 5:5� 1:2 286� 39:021 E I 21:1� 2:2 6:0� 0:2 97� 3:0 85:3� 5:0 7:4� 4:8 4:0� 0:6 313� 38:022 L 32 35:4� 0:1 5:4� 0:1 95� 2:0 86:2� 2:9 11:0� 2:7 3:8� 0:2 83� 18:123 E I 21:1� 3:1 5:7� 0:3 92� 5:2 84:2� 5:8 5:4� 4:1 4:2� 1:3 210� 49:324 L 34 35:4� 0:0 5:5� 0:1 95� 2:3 81:6� 4:2 17:3� 4:3 5:0� 0:6 ÿ84� 45:425 E 9 34:0� 0:2 3:2� 0:3 55� 4:9 36:7� 7:6 59:9� 8:8 28:2� 2:8 ÿ185� 8:026 E 8 33:3� 0:4 5:0� 0:2 88� 3:7 46:8� 6:7 36:0� 7:6 9:4� 1:0 ÿ71� 21:927 L 32 35:4� 0:0 5:3� 0:1 92� 2:2 89:1� 4:7 3:4� 2:2 3:4� 0:5 240� 53:028 E I 19:3� 2:3 5:2� 0:3 83� 4:4 80:8� 5:0 13:7� 5:2 5:0� 1:0 102� 35:129 E I 26:2� 1:6 5:6� 0:2 91� 4:6 91:9� 2:2 0:7� 0:3 2:7� 0:1 285� 32:030 L 33 35:3� 0:1 5:5� 0:1 97� 2:1 89:0� 5:7 6:4� 5:5 5:8� 1:8 232� 61:4
a E: estuarine site; L: littoral site; I: intertidal site.
1104
Marine Pollution Bulletin
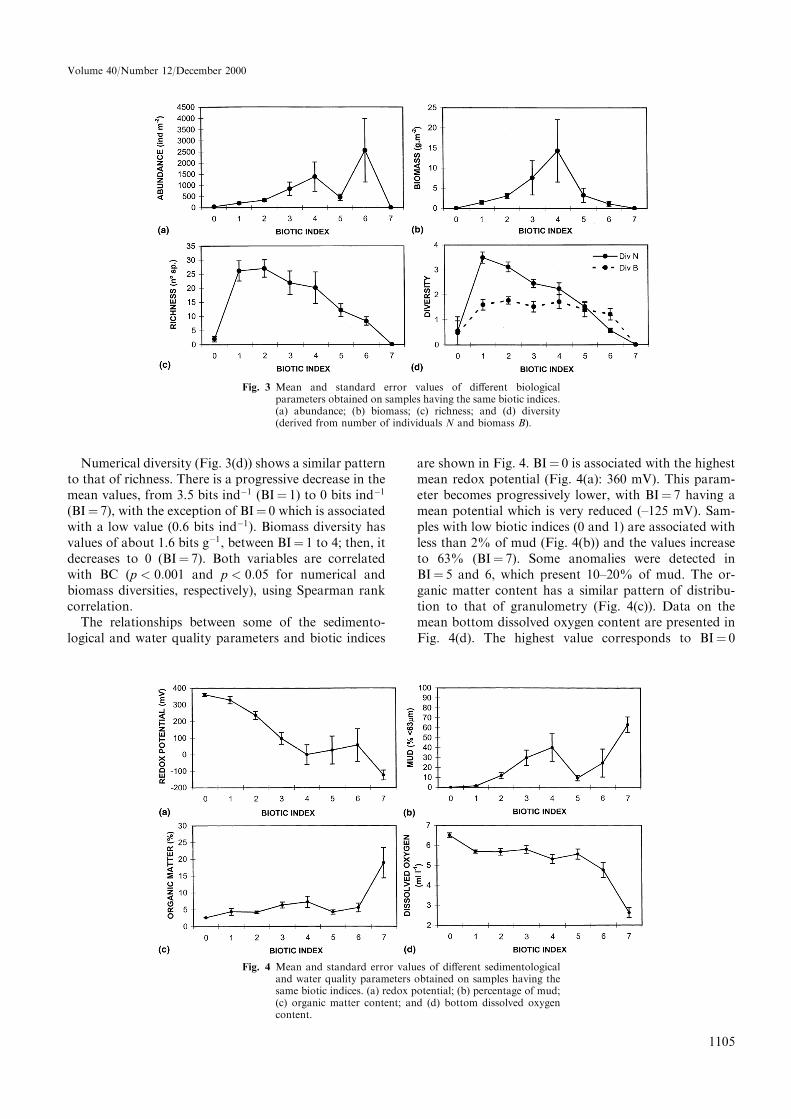
Numerical diversity (Fig. 3(d)) shows a similar patternto that of richness. There is a progressive decrease in themean values, from 3.5 bits indÿ1 (BI� 1) to 0 bits indÿ1
(BI� 7), with the exception of BI� 0 which is associatedwith a low value (0.6 bits indÿ1). Biomass diversity hasvalues of about 1.6 bits gÿ1, between BI� 1 to 4; then, itdecreases to 0 (BI� 7). Both variables are correlatedwith BC (p < 0:001 and p < 0:05 for numerical andbiomass diversities, respectively), using Spearman rankcorrelation.
The relationships between some of the sedimento-logical and water quality parameters and biotic indices
are shown in Fig. 4. BI� 0 is associated with the highestmean redox potential (Fig. 4(a): 360 mV). This param-eter becomes progressively lower, with BI� 7 having amean potential which is very reduced (±125 mV). Sam-ples with low biotic indices (0 and 1) are associated withless than 2% of mud (Fig. 4(b)) and the values increaseto 63% (BI� 7). Some anomalies were detected inBI� 5 and 6, which present 10±20% of mud. The or-ganic matter content has a similar pattern of distribu-tion to that of granulometry (Fig. 4(c)). Data on themean bottom dissolved oxygen content are presented inFig. 4(d). The highest value corresponds to BI� 0
Fig. 4 Mean and standard error values of di�erent sedimentologicaland water quality parameters obtained on samples having thesame biotic indices. (a) redox potential; (b) percentage of mud;(c) organic matter content; and (d) bottom dissolved oxygencontent.
Fig. 3 Mean and standard error values of di�erent biologicalparameters obtained on samples having the same biotic indices.(a) abundance; (b) biomass; (c) richness; and (d) diversity(derived from number of individuals N and biomass B).
1105
Volume 40/Number 12/December 2000
(6.5 ml lÿ1), decreasing to 2.6 ml lÿ1 at BI� 7. TheSpearman rank correlations between these variables andBC are highly signi®cant (p < 0:001).
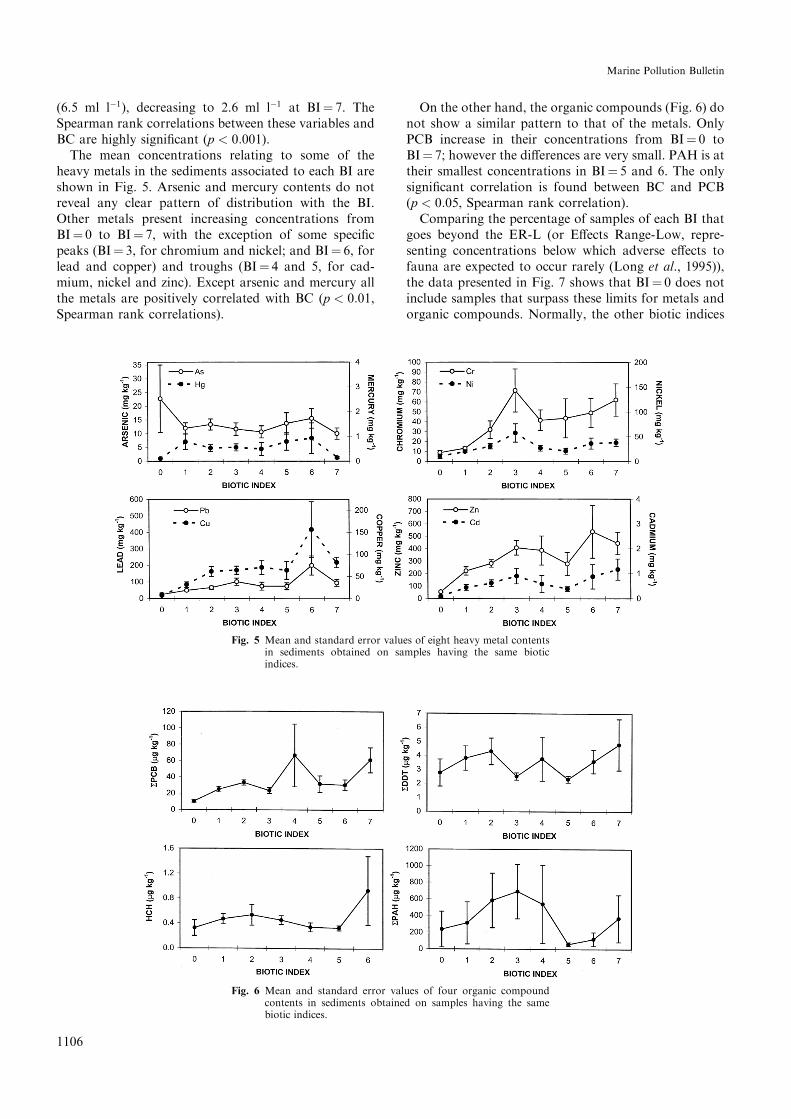
The mean concentrations relating to some of theheavy metals in the sediments associated to each BI areshown in Fig. 5. Arsenic and mercury contents do notreveal any clear pattern of distribution with the BI.Other metals present increasing concentrations fromBI� 0 to BI� 7, with the exception of some speci®cpeaks (BI� 3, for chromium and nickel; and BI� 6, forlead and copper) and troughs (BI� 4 and 5, for cad-mium, nickel and zinc). Except arsenic and mercury allthe metals are positively correlated with BC (p < 0:01,Spearman rank correlations).
On the other hand, the organic compounds (Fig. 6) donot show a similar pattern to that of the metals. OnlyPCB increase in their concentrations from BI� 0 toBI� 7; however the di�erences are very small. PAH is attheir smallest concentrations in BI� 5 and 6. The onlysigni®cant correlation is found between BC and PCB(p < 0:05, Spearman rank correlation).
Comparing the percentage of samples of each BI thatgoes beyond the ER-L (or E�ects Range-Low, repre-senting concentrations below which adverse e�ects tofauna are expected to occur rarely (Long et al., 1995)),the data presented in Fig. 7 shows that BI� 0 does notinclude samples that surpass these limits for metals andorganic compounds. Normally, the other biotic indices
Fig. 5 Mean and standard error values of eight heavy metal contentsin sediments obtained on samples having the same bioticindices.
Fig. 6 Mean and standard error values of four organic compoundcontents in sediments obtained on samples having the samebiotic indices.
1106
Marine Pollution Bulletin

increase progressively in the percentage of samples sur-passing these limits (see data presented for arsenic,mercury, nickel, lead, copper, chromium, PCB andDDT).
Discussion
Many of the biotic indices developed in the literature(Clements et al., 1992; Mouthon, 1993; Stark, 1993;Grall and Gl�emarec, 1997; Roberts et al., 1998, etc.)have been based on the paradigm of Pearson and Ro-senberg (1978), as stated by Weisberg et al. (1997) indeveloping their own index. The paradigm states thatbenthic communities respond to improvements in hab-itat quality in three progressive steps: the abundanceincreases; species diversity increases; and dominantspecies change from pollution-tolerant to pollution-sensitive species.
This generally accepted paradigm has been adaptedfrom Grall and Gl�emarec (1997) in this contribution, inorder to obtain an European BI. This should be able todistinguish easily estuaries and coastal reference sitesfrom polluted sites, with di�erent levels of anthropo-genic or natural degradation.
The index derived provides a semi-quantitative mea-surement of the degree of impact on soft-bottom mac-rofauna, which is re¯ected by changes in the qualitativeand quantitative community composition.
As the BI has been established on the basis of analysisof samples obtained from a monitoring network, with aprevalence of polluted sites, there are only two unpol-luted samples (BI� 0) which correspond to a `normal'community (sensu Grall and Gl�emarec, 1997). The di-versity results do not correspond to those expected fromthe aforementioned paradigm, because the richness is
very low. Conversely, samples with BI� 1 (also unpol-luted in the present proposal, corresponding to animpoverished community) or higher, BI� 2±6 (corre-sponding to slightly to heavily polluted sites) havewell-de®ned values of biological parameters; this is asmight be expected from the results of Pearson andRosenberg (1978).
Some biotic indices, or Coe�cients of Pollution (i.e.Bogdanos and Satsmadjis, 1985) do not appear to besuitable for application in some cases. This is due to thelack of sensitivity of these indices to intermediate pol-lution levels (MAFF, 1993), corresponding with slightlypolluted areas. Hily (1984) and Grall and Gl�emarec(1997) have described similar di�culties.
The above limitation appears to be due to a generalunder-estimation of the faunal abundance in compari-son with unpolluted areas. This is because faunalabundance will increase under slight to moderate pol-lution, but numbers of species can either stay constantor show only a slight increase. In the present proposal,this problem appears to be eliminated because the ap-proach has a high sensitivity at these levels, with well-de®ned values in the biological parameters.
Organic enrichment and muddy bottoms, associatedwith subsequent low redox potential and hypoxia, arerelated with opportunistic species (Majeed, 1987) in`heavily polluted' levels, according to the BI (BI� 5±7).Diaz and Rosenberg (1995) have suggested that benthicinfaunal mortality could be initiated when the oxygenconcentration falls below 2 ml lÿ1. Ritter and Montagna(1999) have recently proposed that 3 mg lÿ1 (� 2.14 mllÿ1) de®nes the breakpoint between normoxic and hy-poxic benthic communities. The mean oxygen concen-tration obtained for BI� 7 indicates that life could bevery limited in those sites. However, within BI� 6, there
Fig. 7 Percentage of samples of each biotic index that goes beyond theER-L (or E�ects Range-Low, representing concentrationsbelow which adverse e�ects are expected to occur rarely), forseven heavy metals and three organic compounds.
1107
Volume 40/Number 12/December 2000
are some situations of very low oxygen concentrationwhich explain the presence of species which are resistantto severe or moderate hypoxia. These species are clas-si®ed within ecological Groups IV and V.
Samples with BI� 6 and 7 are associated with sitesthat experience periodic hypoxia, consisting of repeatedbrief periods (days or weeks, in the case of BI� 6) orseasonal hypoxia (months, in the case of BI� 7), thatgenerate mass mortality or complete elimination of themacrofauna. Some of the samples with BI� 7 arelocated within the Bilbao estuary, for which S�aiz-Salinas(1997) and Gonz�alez-Oreja and S�aiz-Salinas (1998) havedemonstrated that the oxygen limitation represents thekey factor in the estuarine defaunation of samplingstations within the estuary.
Physico-chemical results related to the BI (see Fig. 4)have some unexpected results at the level of BI� 5 and6. The trend of increasing percentages of mud and or-ganic matter, together with decreasing redox potential,break-down at these particular levels. BI� 5 and 6correspond to high percentages of ecological Group V(with a mean of 77.5% of species in BI� 5, together with92.7% in BI� 6). These species are mainly deposit-feeders. As such, they could modify the proportion oforganic matter in the sediments on which they feed and,subsequently, modify the grain size composition of thesediments. The optimal grain size may be di�erent forthe settling larvae, juveniles and adults of a variety ofdeposit-feeders (Snelgrove and Butman, 1994), changingtheir physico-chemical properties. For example, Hall(1994) has stated that faecal pellets of benthic inverte-brates modify the grain size of the sur®cial sediments.
In spite of the fact that hypoxia seems to control thepresence of the groupings with BI� 7 and that organicmatter content is very important in ascribing samples tothe BI, ecotoxicological e�ects appear to play only a
secondary role in the analyses; however it may have hadan e�ect in the longer time, as cited by S�aiz-Salinas(1997) for the Bilbao Estuary.
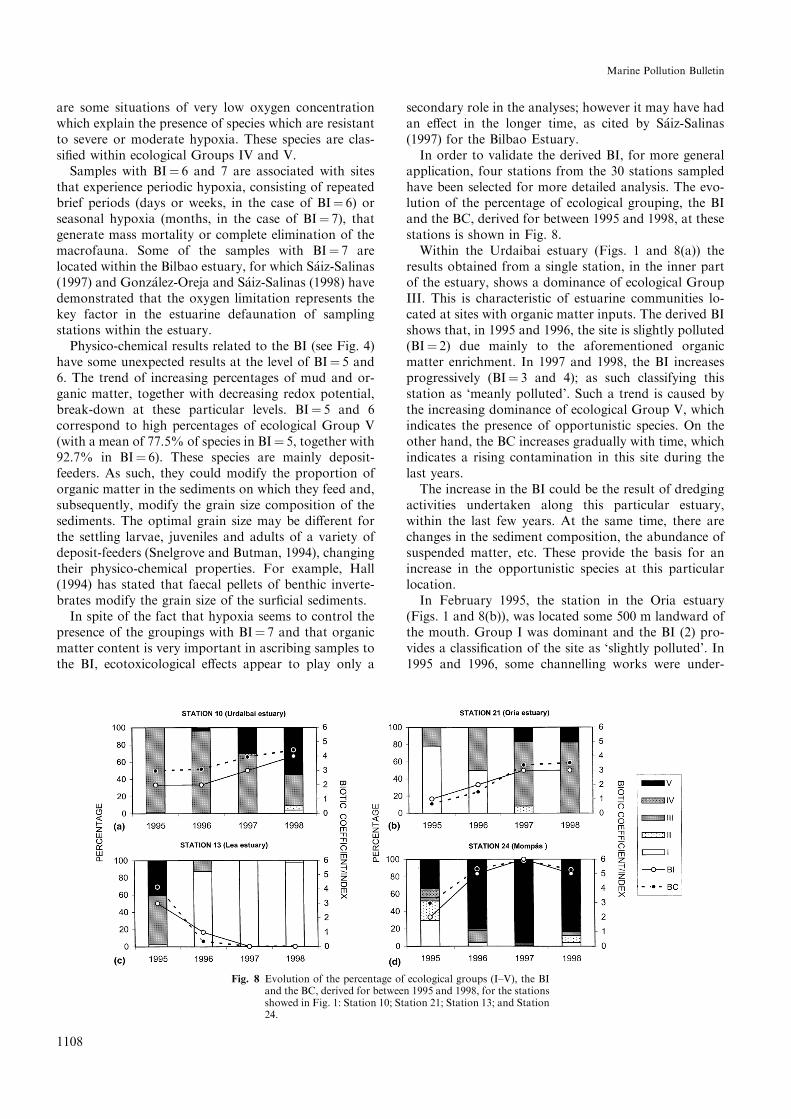
In order to validate the derived BI, for more generalapplication, four stations from the 30 stations sampledhave been selected for more detailed analysis. The evo-lution of the percentage of ecological grouping, the BIand the BC, derived for between 1995 and 1998, at thesestations is shown in Fig. 8.
Within the Urdaibai estuary (Figs. 1 and 8(a)) theresults obtained from a single station, in the inner partof the estuary, shows a dominance of ecological GroupIII. This is characteristic of estuarine communities lo-cated at sites with organic matter inputs. The derived BIshows that, in 1995 and 1996, the site is slightly polluted(BI� 2) due mainly to the aforementioned organicmatter enrichment. In 1997 and 1998, the BI increasesprogressively (BI� 3 and 4); as such classifying thisstation as `meanly polluted'. Such a trend is caused bythe increasing dominance of ecological Group V, whichindicates the presence of opportunistic species. On theother hand, the BC increases gradually with time, whichindicates a rising contamination in this site during thelast years.
The increase in the BI could be the result of dredgingactivities undertaken along this particular estuary,within the last few years. At the same time, there arechanges in the sediment composition, the abundance ofsuspended matter, etc. These provide the basis for anincrease in the opportunistic species at this particularlocation.
In February 1995, the station in the Oria estuary(Figs. 1 and 8(b)), was located some 500 m landward ofthe mouth. Group I was dominant and the BI (2) pro-vides a classi®cation of the site as `slightly polluted'. In1995 and 1996, some channelling works were under-
Fig. 8 Evolution of the percentage of ecological groups (I±V), the BIand the BC, derived for between 1995 and 1998, for the stationsshowed in Fig. 1: Station 10; Station 21; Station 13; and Station24.
1108
Marine Pollution Bulletin

taken in this estuary, extending the mouth of the estuarysome 500 m o�shore. This development has led to anincrease in the distance from the mouth of the estuary tothe sampling station, with a subsequent change in thephysico-chemical conditions (Borja et al., 1999a). Thischange resulted in an increase in the mud and organicmatter content, together with a decrease in dissolvedoxygen. This change in the physical setting provides anexplanation for the increase in the dominance of eco-logical Groups III and V (more characteristic at theinner part of the estuary), modifying the BI to `meanlypolluted' (3). The BC increased during this period, from1.4 to 3.5.
The Lea is a small estuary within the Basque Country(Figs. 1 and 8(c)) which, in the past 4 years, has beensubjected to a sewerage plan, eliminating urban andindustrial e�uent discharges into the estuarine waters.The estuary was dominated by the opportunistic GroupV in 1995, with a BI of 3 (meanly polluted). Followingthe introduction of the sewerage scheme, the ecologicalGroup I, composed of species that are sensitive to pol-lution, increased in its dominance. This represented, in1997 and 1998, nearly 100% of the community.Throughout these two last years, the BI is 0. The BCdecreases from 4.2 in 1995 to 0.4 in 1996 and near 0 in1997 and 1998. So, in the last two years this station canbe classi®ed as an unpolluted site.
Finally, within the coastal area of Momp�as, near SanSebasti�an (Figs. 1 and 8(d)), there is an importantchange in the ecological group composition between1995 and 1996. At the beginning of this period, there is aco-dominance of Groups V, I and II. However, there is aclear dominance of Group V from 1996 to 1998. At thesame time, the BI changes from 2 (slightly polluted) to5±6 (heavily polluted). The BC, which was 3.0 in 1995,increased to values between 5.3 and 5.9 during the lastthree years. This particular coastal area has receivedlarge amounts of domestic and industrial waste from theSan Sebasti�an area since the 1970s. Further, in 1995 and1996, some sewerage works were constructed and animportant volume of urban and industrial polluted wa-ters, derived from nearby areas such as Pasajes orTximistarri, were diverted to Momp�as. The waste in-cludes contaminants (heavy metals and organic com-pounds) and a high amount of organic matteroriginating from the paper manufacturers (Franco et al.,1999).
Conclusions
The BC, proposed here as a BI to establish the eco-logical quality of the soft-bottom benthos within theEuropean coastal environments, takes into account thefaunal composition. As such, it ascribes each species toan ecological grouping, according to their sensitivity toan increasing stress gradient.
The di�erent composition, in terms of the abundanceof the various ecological groups in these samples pro-
vides a continuous BC (with values between 0 and 6).This is referenced to a BI, representing quality of bot-tom conditions in a discreet range from 0 (unpolluted)to 7 (extremely polluted). This composition is governedby the physico-chemical factors within the sedimentsand the overlying water column in terms of: organicmatter content; percentage of mud within the sediments;dissolved oxygen content within the bottom waters; andthe concentration of pollutants.
Biological parameters (such abundance, richness,biomass or diversity) provide a useful (and morebroadly applicable) description of each level of the BI. Itis considered (as described by Dauer, 1993) that bio-logical criteria may complement toxicity and chemicalassessment methods, to serve as independent evaluationsof the ecological quality of marine and estuarine eco-systems.
Validation of the model developed shows that di�er-ent anthropogenically changes in the environment canbe detected through the use of the BI, including altera-tions to the natural system such as dredging, engineeringworks, sewerage plans and the dumping of pollutedwaters. On the other hand, the BC provides a moreaccurate view of the evolution of the ecological status ofa particular location. Further, the fact that this partic-ular coe�cient can derive continuous values makes itmore suitable for application to statistical analysis thanthe BI (i.e. temporal trend analysis).
The BI proposed here is relatively simple and can,meaningfully, be applied when attempting to determinethe ecological status of European coastlines. Althoughthis index has been developed in the Bay of Biscay, themethodology can be applied for other European coastalareas, only conditioned by the assignation of the speciesto the ecological groups described here. In fact, many ofthe species compiled in the Appendix A are present inNorth Sea and Mediterranean. So, the index may beimproved with the contributions of newly assignedspecies from these seas and further examples of its moregeneral application and validation.
Finally, this index facilitates the understanding ofcomplex benthic data, summarizing a considerableamount of ecological information into a single repre-sentative value.
This study was supported by di�erent contracts undertaken betweenthe Department of Land Action, Housing and Environment of theBasque Government and AZTI. One of the authors (V. P�erez) wassupported by a grant from the Department of Agriculture and Fishingof the Basque Government. We thank the sta� of the Department ofOceanography of AZTI for their assistance during the ®eld samplingand laboratory analyses and the INSUB Group that was charged ofthe taxonomical analysis. We wish to thank also Professor MichaelCollins (School of Ocean and Earth Science, University of South-ampton, UK) and an anonymous referee for kindly advising us onsome details of this paper.
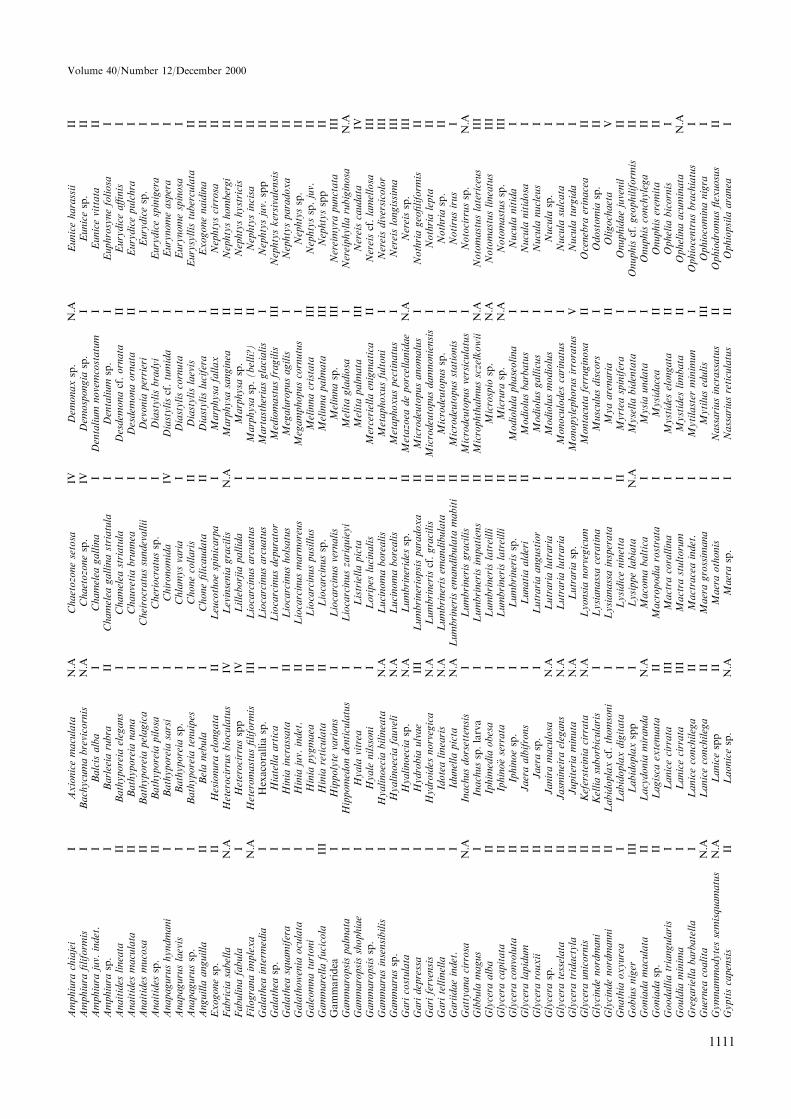
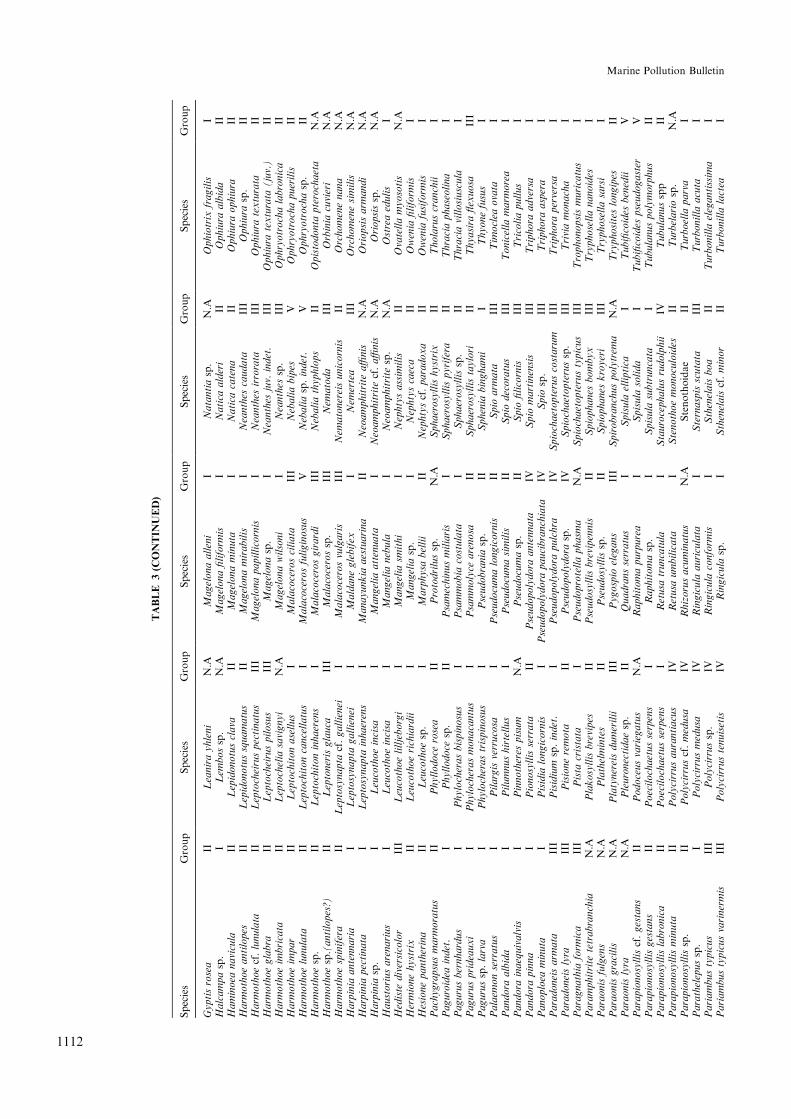
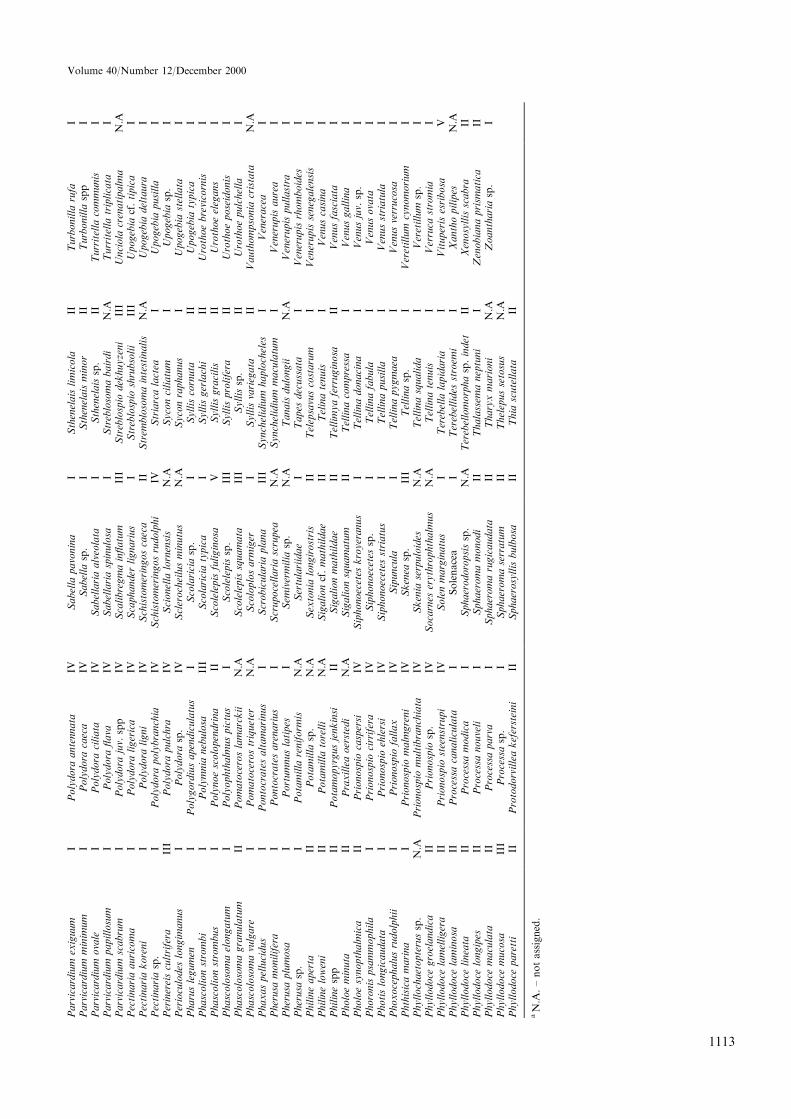
Appendix A
See Table 3.
1109
Volume 40/Number 12/December 2000
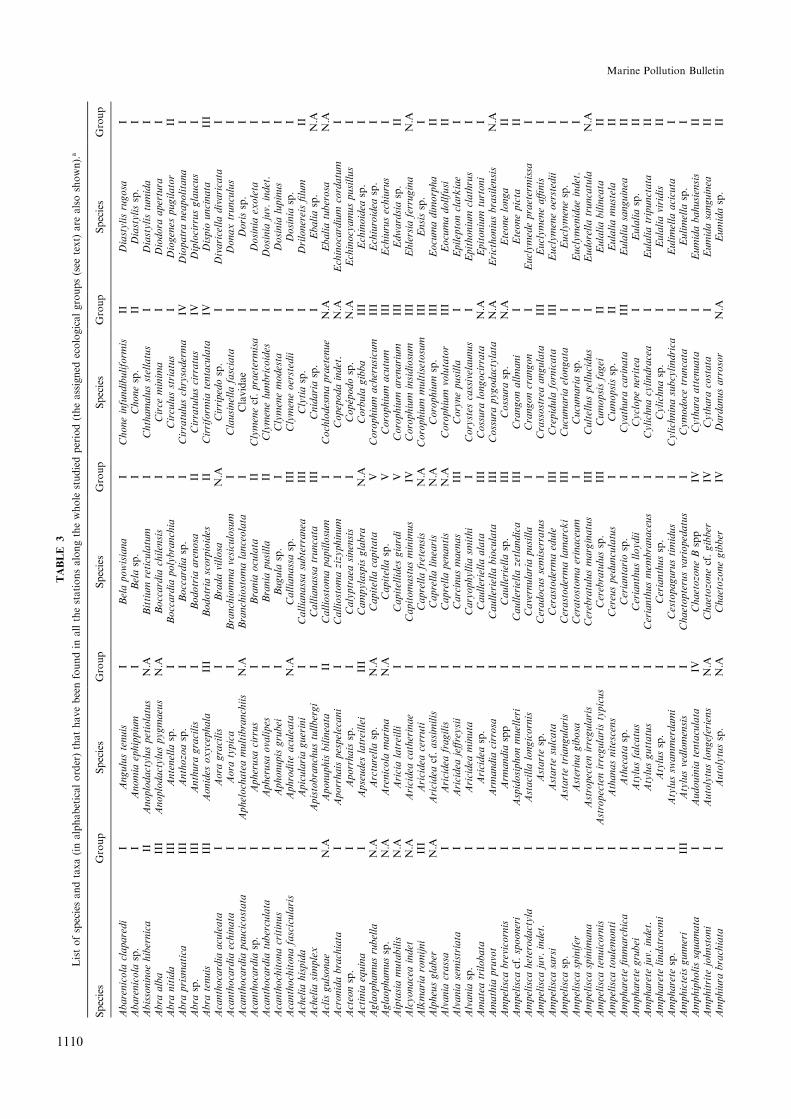
TABLE
3
Listofspeciesandtaxa(inalphabeticalorder)thathavebeenfoundin
allthestationsalongthewhole
studiedperiod(theassigned
ecologicalgroups(see
text)are
alsoshown).
a
Species
Group
Species
Group
Species
Group
Species
Group
Species
Group
Abarenicola
claparedi
IAngulustenuis
IBelapowisiana
IChoneinfundibuliform
isII
Diastylisrugosa
IAbarenicola
sp.
IAnomia
ephippium
IBelasp.
IChonesp.
IIDiastylissp.
IAbissoninoehibernica
IIAnoplodactyluspetiolatus
N.A
Bittium
reticulatum
IChthamalusstellatus
IDiastylistumida
IAbra
alba
III
Anoplodactyluspygmaeus
N.A
Boccardia
chilensis
ICirce
minim
aI
Diodora
apertura
IAbra
nitida
III
Antenella
sp.
IBoccardia
polybranchia
ICirculusstriatus
IDiogenes
pugilator
IIAbra
prism
atica
III
Anthozoasp.
IBoccardia
sp.
ICirratuluschrysoderma
IVDiopatraneapolitana
IAbra
sp.
III
Anthura
gracilis
IBodotria
arenosa
IICirratuluscirratus
IVDiplocirrusglaucus
IAbra
tenuis
III
Aonides
oxycephala
III
Bodotria
scorpioides
IICirriform
iatentaculata
IVDispio
uncinata
III
Acanthocardia
aculeata
IAora
gracilis
IBradavillosa
N.A
Cirripedosp.
IDivaricelladivaricata
IAcanthocardia
echinata
IAora
typica
IBranchiommavesiculosum
IClausinella
fasciata
IDonaxtrunculus
IAcanthocardia
paucicostata
IAphelochateamultibranchiis
N.A
Branchiostomalanceolata
IClavidae
IDorissp.
IAcanthocardia
sp.
IApherusa
cirrus
IBrania
oculata
IIClymenecf.praetermisa
IDosinia
exoleta
IAcanthocardia
tuberculata
IApherusa
ovalipes
IBrania
pusilla
IIClymenelumbricoides
IDosinia
juv.
indet.
IAcanthochitonacritinus
IAphonupisgrubei
IBugula
sp.
IClymenemodesta
IDosinia
lupinus
IAcanthochitonafascicularis
IAphroditeaculeata
N.A
Callianassasp.
III
Clymeneoerstedii
IDosinia
sp.
IAchelia
hispida
IApiculariaguerini
ICallianassasubterranea
III
Clytiasp.
IDrilonereis®lum
IIAchelia
simplex
IApistobranchustullbergi
ICallianassatruncata
III
Cnidariasp.
IEbaliasp.
N.A
Aclisgulsonae
N.A
Aponuphisbilineata
IICalliostomapapillosum
ICochlodesmapraetenue
N.A
Ebaliatuberosa
N.A
Acronidabrachiata
IAporrhaispespelecani
ICalliostomazizyphinum
ICopepodaindet.
N.A
Echinocardium
cordatum
IActeonsp.
IAporrhaissp.
ICalyptraea
sinensis
ICop� epodosp.
N.A
Echinocyamuspusillus
IActinia
equina
IApseudes
latreillei
III
Campylaspisglabra
N.A
Corbula
gibba
III
Echinoidea
sp.
IAglaophamusrubella
N.A
Arcturellasp.
N.A
Capitella
capitata
VCorophium
acherusicum
III
Echiuroidea
sp.
IAglaophamussp.
N.A
Arenicola
marina
N.A
Capitella
sp.
VCorophium
acutum
III
Echiurusechiurus
IAiptasiamutabilis
N.A
Aricialatreilli
ICapitellides
giardi
VCorophium
arenarium
III
Edwardsiasp.
IIAlcyonaceaindet
N.A
Aricidea
catherinae
ICapitomastusminim
us
IVCorophium
insidiosum
III
Ehlersia
ferrugina
N.A
Alkmariaromijni
III
Aricidea
cerruti
ICaprellafretensis
N.A
Corophium
multisetosum
III
Ensissp.
IAlpheusglaber
N.A
Aricidea
cf.assim
ilis
ICaprellalinearis
N.A
Corophium
sp.
III
Eocumadim
orpha
IIAlvania
crassa
IAricidea
fragilis
ICaprellapenantis
N.A
Corophium
volutator
III
Eocumadollfusi
IIAlvania
semistriata
IAricidea
je�reysii
ICarcinusmaenas
III
Corynepusilla
IEpileptonclarkiae
IAlvania
sp.
IAricidea
minuta
ICaryophyllia
smithi
ICorystes
cassivelaunus
IEpithonium
clathrus
IAmateatrilobata
IAricidea
sp.
ICaulleriellaalata
III
Cossura
longocirrata
N.A
Epitonium
turtoni
IAmathia
pruvot
IArm
andia
cirrosa
ICaulleriellabioculata
III
Cossura
pygodactylata
N.A
Ericthoniusbrasilensis
N.A
Ampelisca
brevicornis
IArm
andia
spp
ICaulleriellasp.
III
Cossura
sp.
N.A
Eteonelonga
IIAmpelisca
cf.spooneri
IAspidosiphonmuelleri
ICaulleriellazetlandica
III
Crangonallmani
IEteonepicta
IIAmpelisca
heterodactyla
IAstacillalongicornis
ICavernulariapusilla
ICrangoncrangon
IEuclymedepraetermissa
IAmpelisca
juv.
indet.
IAstartesp.
ICeradocussemiserratus
ICrassostreaangulata
III
Euclymenea�nis
IAmpelisca
sarsi
IAstartesulcata
ICerastodermaedule
III
Crepidula
fornicata
III
Euclymeneoerstedii
IAmpelisca
sp.
IAstartetriangularis
ICerastodermalamarcki
III
Cucumariaelongata
IEuclymenesp.
IAmpelisca
spinifer
IAsterinagibosa
ICeratostomaerinaceum
ICucumariasp.
IEuclymenidaeindet.
IAmpelisca
spinim
ana
IAstropectenirregularis
ICerebratulusmarginatus
III
Cultelluspellucidus
IEudorellatruncatula
N.A
Ampelisca
tenuicornis
IAstropectenirregularistypicus
ICerebratulussp.
III
Cumopsisfagei
IIEulaliabilineata
IIAmpelisca
toulemonti
IAthanasnitescens
ICereuspedunculatus
ICumopsissp.
IIEulaliamustela
IIAmpharete
®nmarchica
IAthecata
sp.
ICeriantariosp.
ICyathura
carinata
III
Eulaliasanguinea
IIAmpharete
grubei
IAtylusfalcatus
ICerianthuslloydii
ICyclopeneritea
IEulaliasp.
IIAmpharete
juv.
indet.
IAtylusguttatus
ICerianthusmem
branaceus
ICylichnacylindracea
IEulaliatripunctata
IIAmpharete
lindstroem
iI
Atylussp.
ICerianthussp.
ICylichnasp.
IEulaliaviridis
IIAmpharete
sp.
IAtylussw
ammerdami
ICestopagurustimidus
ICylichninasubcylindrica
IEulimella
acicuta
IAmphicteisgunneri
III
Atylusvedlomensis
IChaetopterusvariopedatus
ICymodoce
truncata
IEulimella
sp.
IAmphipholissquamata
IAudouinia
tentaculata
IVChaetozoneBspp
IVCythara
attenuata
IEumidabahusiensis
IIAmphitrite
johnstoni
IAutolytuslongeferiens
N.A
Chaetozonecf.gibber
IVCythara
costata
IEumidasanguinea
IIAmphiura
brachiata
IAutolytussp.
N.A
Chaetozonegibber
IVDardanusarrosor
N.A
Eumidasp.
II
1110
Marine Pollution Bulletin
Amphiura
chiajei
IAxionicemaculata
N.A
Chaetozonesetosa
IVDem
onaxsp.
N.A
Euniceharassii
IIAmphiura
®liform
isI
Bachycumabrevicornis
N.A
Chaetozonesp.
IVDem
ospongia
sp.
IEunicesp.
IIAmphiura
juv.
indet.
IBalcisalba
IChamelea
gallina
IDentalium
novemcostatum
IEunicevittata
IIAmphiura
sp.
IBarleeia
rubra
IIChamelea
gallinastriatula
IDentalium
sp.
IEuphrosynefoliosa
IAnaitides
lineata
IIBathyporeia
elegans
IChamelea
striatula
IDesdem
onacf.ornata
IIEurydicea�nis
IAnaitides
maculata
IIBathyporeia
nana
IChauvetiabrunnea
IDesdem
onaornata
IIEurydicepulchra
IAnaitides
mucosa
IIBathyporeia
pelagica
ICheirocratussundevallii
IDevonia
perrieri
IEurydicesp.
IAnaitides
sp.
IIBathyporeia
pilosa
ICheriocratussp.
IDiastylisbradyi
IEurydicespinigera
IAnapagurushyndmani
IBathyporeia
sarsi
IChironomida
IVDiastyliscf.tumida
IEurynomeaspera
IAnapaguruslaevis
IBathyporeia
sp.
IChlamysvaria
IDiastyliscornuta
IEurynomespinosa
IAnapagurussp.
IBathyporeia
tenuipes
IChonecollaris
IIDiastylislaevis
IEurysyllistuberculata
IIAnguilla
anguilla
IIBelanebula
IChone®licaudata
IIDiastylislucifera
IExogonenaidina
IIExogonesp.
IIHesionura
elongata
IILeucothoespinicarpa
IMarphysa
fallax
IINephtyscirrosa
IIFabriciasabella
N.A
Heterocirrusbioculatus
IVLevinsenia
gracilis
N.A
Marphysa
sanginea
IINephtyshombergi
IIFabulinafabula
IHeterocirrusspp
IVLilleborjia
pallida
IMarphysa
sp.
IINephtyshystricis
IIFilogranaim
plexa
N.A
Heteromastus®liform
isIII
Liocarcinusarcuatus
IMarphysa
sp.(belli?)
IINephtysincisa
IIGalathea
interm
edia
IHexacorallia
sp.
ILiocarcinusarcuatus
IMartastheriasglacialis
INephtysjuv.
spp
IIGalathea
sp.
IHiatellaartica
ILiocarcinusdepurator
IMediomastusfragilis
III
Nephtyskersivalensis
IIGalathea
squamifera
IHinia
incrassata
IILiocarcinusholsatus
IMegaluropusagilis
INephtysparadoxa
IIGalathowenia
oculata
IHinia
juv.
indet.
IILiocarcinusmarm
oreus
IMegamphopuscornutus
INephtyssp.
IIGaleomnaturtoni
IHinia
pygmaea
IILiocarcinuspusillus
IMelinnacristata
III
Nephtyssp.juv.
IIGammarellafucicola
III
Hinia
reticulata
IILiocarcinussp.
IMelinnapalm
ata
III
Nephtysspp
IIGammaridea
IHippolyte
varians
ILiocarcinusvernalis
IMelinnasp.
III
Nereimyra
punctata
III
Gammaropsispalm
ata
IHippomedondenticulatus
ILiocarcinuszariquieyi
IMelitagladiosa
INereiphyllarubiginosa
N.A
Gammaropsisshophiae
IHyala
vitrea
IListriellapicta
IMelitapalm
ata
III
Nereiscaudata
IVGammaropsissp.
IHyale
nilssoni
ILoripes
lucinalis
IMerceriella
enigmatica
IINereiscf.lamellosa
III
Gammarusinsensibilis
IHyalinoecia
bilineata
N.A
Lucinomaborealis
IMetaphoxusfultoni
INereisdiversicolor
III
Gammarussp.
IHyalinoecia
fauveli
N.A
Lucinomaborealis
IMetaphoxuspectinatus
INereislongissima
III
Garicostulata
IHyalinoecia
sp.
N.A
Lumbrinerides
sp.
IIMetazoea
deporcellanidae
N.A
Nereissp.
III
Garidepressa
IHydrobia
ulvae
III
Lumbrineriopsisparadoxa
IIMicrodeutopusanomalus
INothriageo®liform
isII
Garifervensis
IHydroides
norvegica
N.A
Lumbrineriscf.gracilis
IIMicrodeutopusdamnoniensis
INothrialepta
IIGaritellinella
IIdotealinearis
N.A
Lumbrinerisem
andibulata
IIMicrodeutopussp.
INothriasp.
IIGariidaeindet.
IIdunella
picta
N.A
Lumbrinerisem
andibulata
mabiti
IIMicrodeutopusstationis
INotirusirus
IGattyanacirrosa
N.A
Inachusdorsettensis
ILumbrinerisgracilis
IIMicrodeutopusversiculatus
INotocirrussp.
N.A
Gibbula
magus
IInachussp.larva
ILumbrinerisim
patiens
IIMicrophthalm
ussczelkowii
N.A
Notomastuslatericeus
III
Glycera
alba
IIIphim
edia
obesa
ILumbrinerislatreilli
IIMicrospio
sp.
N.A
Notomastuslineatus
III
Glycera
capitata
IIIphino� e
serrata
ILumbrinerislatreilli
IIMicrura
sp.
N.A
Notomastussp.
III
Glycera
convoluta
IIIphinoesp.
ILumbrinerissp.
IIModiolula
phaseolina
INucula
nitida
IGlycera
lapidum
IIJaeraalbifrons
ILunatiaalderi
IIModiolusbarbatus
INucula
nitidosa
IGlycera
rouxii
IIJaerasp.
ILutrariaangustior
IModiolusgallicus
INucula
nucleus
IGlycera
sp.
IIJaniramaculosa
N.A
Lutrarialutraria
IModiolusmodiolus
INucula
sp.
IGlycera
tesselata
IIJasm
ineira
elegans
N.A
Lutrarialutraria
IMonoculodes
carinatus
INucula
sulcata
IGlycera
tridactyla
IIJupiteria
minuta
N.A
Lutrariasp.
IMonopylephorusirroratus
VNucula
turgida
IGlycera
unicornis
IIKefersteinia
cirrata
N.A
Lyonsianorvegicum
IMontacuta
ferruginosa
IIOcenebra
erinacea
IIGlycindenordmani
IIKelliasuborbicularis
ILysianassaceratina
IMusculusdiscors
IOdostomia
sp.
IIGlycindenordmanni
IILabidoplaxcf.thomsoni
ILysianassainsperata
IMyaarenaria
IIOligochaeta
VGnathia
oxyurea
ILabidoplaxdigitata
ILysidiceninetta
IIMyrtea
spinifera
IOnuphidaejuvenil
IIGobiusniger
III
Labidoplaxspp
ILysippelabiata
N.A
Mysellabidentata
IOnuphiscf.geophiliform
isII
Goniadamaculata
IILacydonia
miranda
N.A
Macomabaltica
IMysiaundata
IOnuphisconchylega
IIGoniadasp.
IILagisca
extenuata
IIMacropodia
rostrata
IMysidacea
IIOnuphiserem
ita
IIGoodallia
triangularis
ILanicecirrata
III
Mactra
corallina
IMystides
elongata
IIOphelia
bicornis
IGouldia
minim
aI
Lanicecirrata
III
Mactra
stultorum
IMystides
limbata
IIOphelinaacuminata
N.A
Gregariella
barbatella
ILaniceconchilega
IIMactraceaindet.
IMytilaster
minim
un
IOphiocentrusbrachiatus
IGuernea
coalita
N.A
Laniceconchilega
IIMaeragrossim
ana
IMytilusedulis
III
Ophiocominanigra
IGymnammodytessemisquamatus
N.A
Lanicespp
IIMaeraothonis
INassariusincrassatus
IIOphiodromus¯exuosus
IIGyptiscapensis
IILaonicesp.
N.A
Maerasp.
INassariusreticulatus
IIOphiopsila
aranea
I
1111
Volume 40/Number 12/December 2000
TABLE
3(C
ONTIN
UED)
Species
Group
Species
Group
Species
Group
Species
Group
Species
Group
Gyptisrosea
IILeanirayhleni
N.A
Magelonaalleni
INatantiasp.
N.A
Ophiotrix
fragilis
IHalcampasp.
ILem
bossp.
N.A
Magelona®liform
isI
Natica
alderi
IIOphiura
albida
IIHaminoea
navicula
IILepidonotusclava
IIMagelonaminuta
INatica
catena
IIOphiura
ophiura
IIHarm
othoeantilopes
IILepidonotussquamatus
IIMagelonamirabilis
INeanthes
caudata
III
Ophiura
sp.
IIHarm
othoecf.lunulata
IILeptocheiruspectinatus
III
Magelonapapillicornis
INeanthes
irrorata
III
Ophiura
texturata
IIHarm
othoeglabra
IILeptocheiruspilosus
III
Magelonasp.
INeanthes
juv.
indet.
III
Ophiura
texturata
(juv.)
IIHarm
othoeim
bricata
IILeptochelia
savignyi
N.A
Magelonawilsoni
INeanthes
sp.
III
Ophryotrochalabronica
IIHarm
othoeim
par
IILeptochitonasellus
IMalacocerosciliata
III
Nebaliabipes
VOphryotrochapuerilis
IIHarm
othoelunulata
IILeptochitoncancellatus
IMalacocerosfuliginosus
VNebaliasp.indet.
VOphryotrochasp.
IIHarm
othoesp.
IILeptochitoninhaerens
IMalacocerosgirardi
III
Nebaliathyphlops
IIOpistodonta
pterochaeta
N.A
Harm
othoesp.(antilopes?)
IILeptonerisglauca
III
Malacocerossp.
III
Nem
atoda
III
Orbinia
cuvieri
N.A
Harm
othoespinifera
IILeptosynapta
cf.gallienei
IMalacocerosvulgaris
III
Nem
atonereisunicornis
IIOrchomenenana
N.A
Harpinia
antennaria
ILeptosynapta
gallienei
IMaldaneglebifex
INem
ertea
III
Orchomenesimilis
N.A
Harpinia
pectinata
ILeptosynapta
inhaerens
IManayunkia
aestuarina
IINeoamphitrite
a�nis
N.A
Oriopsisarm
andi
N.A
Harpinia
sp.
ILeucothoeincisa
IMangelia
attenuata
INeoamphitrite
cf.a�nis
N.A
Oriopsissp.
N.A
Haustoriusarenarius
ILeucothoeincisa
IMangelia
nebula
INeoamphitrite
sp.
N.A
Ostreaedulis
IHediste
diversicolor
III
Leucothoelilljeborgi
IMangelia
smithi
INephtysassim
ilis
IIOvatellamyosotis
N.A
Hermionehystrix
IILeucothoerichiardii
IMangelia
sp.
INephtyscaeca
IIOwenia
®liform
isI
Hesionepantherina
IILeucothoesp.
IMarphysa
bellii
IINephtyscf.paradoxa
IIOwenia
fusiform
isI
Pachygrapsusmarm
oratus
IIPhyllodoce
rosea
IIProtodrilussp.
N.A
Sphaerosyllishystrix
IITholaruscranchii
IPaguroidea
indet.
IPhyllodoce
sp.
IIPsamechinusmiliaris
ISphaerosyllispyrifera
IIThraciaphaseolina
IPagurusbernhardus
IPhylocherasbispinosus
IPsammobia
costulata
ISphaerosyllissp.
IIThraciavillosiuscula
IPagurusprideauxi
IPhylocherasmonacantus
IPsammolyce
arenosa
IISphaerosyllistaylori
IIThyasira
¯exuosa
III
Pagurussp.larva
IPhylocherastrispinosus
IPseudobrania
sp.
IISphenia
binghami
IThyonefusus
IPalaem
onserratus
IPilargisverrucosa
IPseudocumalongicornis
IISpio
arm
ata
III
Tim
oclea
ovata
IPandora
albida
IPilumnushirtellus
IPseudocumasimilis
IISpio
decoratus
III
Tonicella
marm
orea
IPandora
inaequivalvis
IPinnotheres
pisum
N.A
Pseudocumasp.
IISpio
®licornis
III
Tricoliapullus
IPandora
pinna
IPionosyllisserrata
IIPseudopolydora
antennata
IVSpio
martinensis
III
Triphora
adversa
IPanoploea
minuta
IPisidia
longicornis
IPseudopolydora
paucibranchiata
IVSpio
sp.
III
Triphora
aspera
IParadoneisarm
ata
III
Pisidium
sp.indet.
IPseudopolydora
pulchra
IVSpiochaetopteruscostarum
III
Triphora
perversa
IParadoneislyra
III
Pisioneremota
IIPseudopolydora
sp.
IVSpiochaetopterussp.
III
Triviamonacha
IParagnathia
form
ica
III
Pista
cristata
IPseudoprotellaphasm
aN.A
Spiochaetopterustypicus
III
Trophonopsismuricatus
IParamphitrite
tetrabranchia
N.A
Plakosyllisbrevipes
IIPseudosyllisbrevipennis
IISpiophanes
bombyx
III
Tryphosellananoides
IParaonisfulgens
N.A
Plathelmintes
IIPseudosyllissp.
IISpiophanes
kroyeri
III
Tryphosellasarsi
IParaonisgracilis
N.A
Platynereisdumerilii
III
Pygospio
elegans
III
Spirobranchuspolytrem
aN.A
Tryphositeslongipes
IIParaonislyra
N.A
Pleuronectidaesp.
IIQuadransserratus
ISpisula
elliptica
ITubi®coides
benedii
VParapionosylliscf.gestans
IIPodoceusvariegatus
N.A
Raphitomapurpurea
ISpisula
solida
ITubi®coides
pseudogaster
VParapionosyllisgestans
IIPoecilochaetusserpens
IRaphitomasp.
ISpisula
subtruncata
ITubulanuspolymorphus
IIParapionosyllislabronica
IIPoecilochaetusserpens
IRetusa
truncatula
IStaurocephalusrudolphii
IVTubulanusspp
IIParapionosyllisminuta
IIPolycirrusaurantiacus
IVRetusa
umbilicata
IStenothoemonoculoides
IITurbelariosp.
N.A
Parapionosyllissp.
IIPolycirruscf.medusa
IVRhizorusacuminatus
N.A
Stenothoidae
IITurboella
parva
IParathelepussp.
IPolycirrusmedusa
IVRingicula
auriculata
ISternaspisscutata
III
Turbonilla
acuta
IPariambustypicus
III
Polycirrussp.
IVRingicula
conform
isI
Sthenelaisboa
IITurbonilla
elegantissim
aI
Pariambustypicusvarinermis
III
Polycirrustenuisetis
IVRingicula
sp.
ISthenelaiscf.minor
IITurbonilla
lactea
I
1112
Marine Pollution Bulletin
Parvicardium
exiguum
IPolydora
antennata
IVSabella
pavonina
ISthenelaislimicola
IITurbonilla
rufa
IParvicardium
minim
um
IPolydora
caeca
IVSabella
sp.
ISthenelaisminor
IITurbonilla
spp
IParvicardium
ovale
IPolydora
ciliata
IVSabellariaalveolata
ISthenelaissp.
IITurritella
communis
IParvicardium
papillosum
IPolydora
¯ava
IVSabellariaspinulosa
IStreblosomabairdi
N.A
Turritella
triplicata
IParvicardium
scabrum
IPolydora
juv.
spp
IVScalibregmain¯atum
III
Streblospio
dekhuyzeni
III
Unciola
crenatipalm
aN.A
Pectinariaauricoma
IPolydora
ligerica
IVScaphander
lignarius
IStreblospio
shrubsolii
III
Upogebia
cf.tipica
IPectinariakoreni
IPolydora
ligni
IVSchistomeringoscaeca
IIStrem
blosomaintestinalis
N.A
Upogebia
deltaura
IPectinariasp.
IPolydora
polybranchia
IVSchistomeringosrudolphi
IVStriarcalactea
IUpogebia
pusilla
IPerinereiscultrifera
III
Polydora
pulchra
IVScionella
lornensis
N.A
Syconciliatum
IUpogebia
sp.
IPerioculodes
longim
anus
IPolydora
sp.
IVSclerocheilusminutus
N.A
Syconraphanus
IUpogebia
stellata
IPharuslegumen
IPolygordiusapendiculatus
IScolariciasp.
ISylliscornuta
IIUpogebia
typica
IPhascolionstrombi
IPolymnia
nebulosa
III
Scolariciatypica
ISyllisgerlachi
IIUrothoebrevicornis
IPhascolionstrombus
IPolynoescolopendrina
IIScolelepisfuliginosa
VSyllisgracilis
IIUrothoeelegans
IPhascolosomaelongatum
IPolyophthalm
uspictus
IScolelepissp.
III
Syllisprolifera
IIUrothoeposeidonis
IPhascolosomagranulatum
IIPomatoceroslamarckii
N.A
Scolelepissquamata
III
Syllissp.
IIUrothoepulchella
IPhascolosomavulgare
IPomatocerostriqueter
N.A
Scoloplosarm
iger
ISyllisvariegata
IIVauthompsonia
cristata
N.A
Phaxaspellucidus
IPontocratesaltamarinus
IScrobiculariaplana
III
Synchelidium
haplocheles
IVeneracea
IPherusa
monilifera
IPontocratesarenarius
IScrupocellariascrupea
N.A
Synchelidium
maculatum
IVenerupisaurea
IPherusa
plumosa
IPortumnuslatipes
ISem
ivermilia
sp.
N.A
Tanaisdulongii
N.A
Venerupispullastra
IPherusa
sp.
IPotamilla
reniform
isN.A
Sertulariidae
ITapes
decussata
IVenerupisrhomboides
IPhilineaperta
IIPotamilla
sp.
N.A
Sextonia
longirostris
IITelepsavuscostarum
IVenerupissenegalensis
IPhilineloweni
IIPotamilla
torelli
N.A
Sigalioncf.mathildae
IITelinatenuis
IVenuscasina
IPhilinespp
IIPotamopyrgusjenkinsi
IISigalionmathildae
IITellimyaferruginosa
IIVenusfasciata
IPholoeminuta
IIPraxilleaoerstedi
N.A
Sigalionsquamatum
IITellinacompressa
IVenusgallina
IPholoesynopthalm
ica
IIPrionospio
caspersi
IVSiphonoecetes
kroyeranus
ITellinadonacina
IVenusjuv.
sp.
IPhoronispsammophila
IPrionospio
cirrifera
IVSiphonoecetes
sp.
ITellinafabula
IVenusovata
IPhotislongicaudata
IPrionospio
ehlersi
IVSiphonoecetes
striatus
ITellinapusilla
IVenusstriatula
IPhoxocephalusrudolphii
IPrionospio
fallax
IVSipuncula
ITellinapygmaea
IVenusverrucosa
IPhthisicamarina
IPrionospio
malm
greni
IVSkenea
sp.
III
Tellinasp.
IVeretillum
cynomorium
IPhyllochaetopterussp.
N.A
Prionospio
multibranchiata
IVSkenia
serpuloides
N.A
Tellinasqualida
IVeretillum
sp.
IPhyllodoce
groelandica
IIPrionospio
sp.
IVSocarnes
erythrophthalm
us
N.A
Tellinatenuis
IVerruca
stromia
IPhyllodoce
lamelligera
IIPrionospio
steenstrupi
IVSolenmarginatus
ITerebella
lapidaria
IVituperisesribosa
VPhyllodoce
laminosa
IIProcessacanaliculata
ISolenacea
ITerebellides
stroem
iI
Xanthopilipes
N.A
Phyllodoce
lineata
IIProcessamodica
ISphaerodoropsissp.
N.A
Terebellomorphasp.indet
IIXenosyllisscabra
IIPhyllodoce
longipes
IIProcessanouveli
ISphaeromamonodi
IIThalassem
aneptuni
IZenobianaprism
atica
IIPhyllodoce
maculata
IIProcessaparva
ISphaeromarugicaudata
IITharyxmarioni
N.A
Zoanthariasp.
IPhyllodoce
mucosa
III
Processasp.
ISphaeromaserratum
IIThelepussetosus
N.A
Phyllodoce
paretti
IIProtodorvilleakefersteini
IISphaerosyllisbulbosa
IIThia
scutellata
II
aN.A
.±notassigned.
1113
Volume 40/Number 12/December 2000

Bogdanos, C. and Satsmadjis, J. (1985) Quantitative e�ect of sedimentcoarseness and depth on the macrobenthos of an unpolluted andclosed Mediterranean Gulf. Revue Internationale d' Oceanographiemedicale 77/78, 74±85.
Borja, A., Valencia, V., Garc�õa, L. and Arresti, A. (1995) Lascomunidades bent�onicas intermareales y submareales en SanSebasti�an-Pasajes (Guip�uzcoa, N de Espa~na). Actas IV ColoquioInternacional de Oceanograf�õa del Golfo de Vizcaya (Santander)165±181.
Borja, A., Franco, J., Belzunce, M. J. and Valencia, V. (1999a) Red deVigilancia y Control de la calidad de las aguas litorales del Pa�õsVasco (oto~no 1997±verano 1998). Departamento de Ordenaci�on delTerritorio, Vivienda y Medio Ambiente, Gobierno Vasco, 333pp+appendices.
Borja, A., Belzunce, M. J., Franco J. and Castro, R. (1999b)Seguimiento ambiental de los estuarios del Nervi�on, Barbad�un yButr�on durante 1998. Consorcio de Aguas Bilbao-Bizkaia, 228pp+appendices.
Cairns, J., Douglas, W. A., Busey, F. and Chaney, M. D. (1968) Thesequential comparison index ± a simpli®ed method for non-biologists to estimate relative di�erences in biological diversity instream pollution studies. Journal of Water Pollution Control. Fed 40,1607±1613.
Chandler, J. R. (1970) A biological approach to water qualitymanagement. Water Pollution Control 69, 415±422.
Clements, W. H., Cherry, D. S. and Van Hassel, J. H. (1992)Assessment of the impact of heavy metals on benthic communitiesat the Clinch River (Virginia): evaluation of an index of communitysensitivity. Canadian Journal of Fisheries and Aquatic Sciences 49,1686±1894.
Dauer, D. M. (1993) Biological criteria, environmental health andestuarine macrobenthic community structure. Marine PollutionBulletin 26 (5), 249±257.
Diaz, R. J. and Rosenberg, R. (1995) Marine benthic hypoxia: a reviewof its ecological e�ects and the behavioural responses of benthicmacrofauna. Oceanography and Marine Biology Annual Review 33,245±303.
Ferraro, S. P., Swartz, R. C., Cole, F. A. and Schults, D. W. (1991)Temporal changes in the benthos along a pollution gradient:discriminating the e�ects of natural phenomena from sewage-industrial wastewater e�ects. Estuarine, Coastal and Shelf Science33, 383±407.
Franco, J., Borja, A., Belzunce, M. J. Valencia, V. (1999) Campa~na demedici�on de variables biol�ogicas y f�õsico-qu�õmicas en el estuario del r�õoOiartzun y �area costera pr�oxima a cala Murgita. Departamento deObras Hidr�aulicas y Urbanismo de la Diputaci�on Foral deGipuzkoa, 197 p.+appendices.
Franklin, A. and Jones, J. (1994) Monitoring and surveillance of non-radiactive contaminants in the aquatic environment and activitiesregulating the disposal of wastes at sea, 1992. Aquatic EnvironmentMonitoring Report, MAFF 40, 1±83.
Gl�emarec, M. (1986) Ecological impact of an oil-spill: utilisation ofbiological indicators. IAWPRC-NERC Conference, July 1985.IAWPRC Journal 18, 203±211.
Gl�emarec, M. and Hily, C. (1981) Perturbations apport�ees �a lamacrofaune benthique de la baie de Concarneau par les e�uentsurbains et portuaires. Acta Oecologica Oecologia Applicata 2, 139±150.
Gonz�alez-Oreja, J. A. and S�aiz-Salinas, J. I. (1998) Exploring therelationships between abiotic variables and benthic communitystructure in a polluted estuarine system. Water Research 32 (12),3799±3807.
Grall, J. and Gl�emarec, M. (1997) Using biotic indices to estimatemacrobenthic community perturbations in the Bay of Brest.Estuarine, Coastal and Shelf Science 44 (suppl. A), 43±53.
Gray, J. S. (1979) Pollution-induced changes in populations. Philo-sophycal Transactions of the Royal Society of London. Series B, 286,545±561.
Hall, S. J. (1994) Physical disturbance and marine benthic communi-ties: life in unconsolidated sediments. Oceanography and MarineBiology Annual Review 32, 179±239.
Hily, C. (1984) Variabilit�e de la macrofaune benthique dans les milieuxhypertrophiques de la Rade de Brest. Th�ese de Doctorat dÕEtat,Univ. Bretagne Occidentale. Vol. 1, 359 pp; Vol. 2, 337 pp.
Hily, C., Le Bris, H. and Gl�emarec, M. (1986) Impacts biologiques des�emissaires urbains sur les �ecosyst�emes benthiques. Oceanis 12, 419±426.
Holme, N. A. and McIntyre, A.D. (1971) Methods for the Study ofMarine Benthos, p. 387. Blackwell, Oxford.
ISO-BMWP (1979) Assessment of the Biological Quality of Rivers by aMacroinvertebrate Score. ISO/TC147/SC5/WG6/N5, InternationalStandards Organisation, p. 18.
Kristensen, E. and Andersen, F. O. (1993) Determination of organiccarbon in marine sediments: a comparison of two CHN-analyzermethods. Journal of Experimental Marine Biology and Ecology 109,15±23.
Long, E. R., MacDonald, D. D., Smith, S. L. and Calder, F. D. (1995)Incidence of adverse biological e�ects within ranges of chemicalconcentrations in marine and estuarine sediments. EnvironmentalManagement 19, 81±97.
MAFF (1993) Analysis and interpretation of benthic community dataat sewage-sludge disposal sites. Aquatic Environmental MonitoringReport,MAFF Directorate of Fisheries Research, Lowestoft, Vol. 37,80 pp.
Majeed, S. A. (1987) Organic matter and biotic indices on the beachesof North Brittany. Marine Pollution Bulletin 18 (9), 490±495.
Mearns, A. J. and Word, J. Q. (1982) Forecasting e�ects ofsewage solids on marine benthic communities. In Ecological Stressand the New York Bight: Science and management ed. G. F. Mayer,pp. 495±512. Estuarine Research Federation, Columbia, SouthCarolina.
Mouthon, J. (1993) Un indice biologique lacustre bas�e sur lÕexamendes peuplements de mollusques. Bulletin Francßaise de la Peche et laPiscicul 331, 397±406.
OÕConnor, T. P. (1992) Recent trends in coastal environmental quality:results from the ®rst ®ve years of the NOAA Mussel Watch project.US Department of Commerce, NOAA, Rockville, 45 pp.
Pearson, T. and Rosenberg, R. (1978) Macrobenthic succession inrelation to organic enrichment and pollution of the marineenvironment. Oceanography and Marine Biology Annual Review16, 229±311.
Ritter, C. and Montagna, P. A. (1999) Seasonal hypoxia and model ofbenthic response in a Texas bay. Estuaries 22 (1), 7±20.
Roberts, R. D., Gregory, M. R. and Fosters, B. A. (1998) Developingan e�cient macrofauna monitoring index from an impact study ± Adredge spoil example. Marine Pollution Bulletin 36 (3), 231±235.
R.N.O. (1998) Surveillance du Milieu Marin. Travaux du R�eseauNational d'Observation de la Qualit�e du Milieu Marin. Edition1998. Ifremer et Minist�ere de lÕAm�enagement du Territoire et delÕEnvironnement, 52 pp.
S�aiz-Salinas, J. I. (1997) Evaluation of adverse biological e�ectsinduced by pollution in the Bilbao estuary. Environmental Pollution96 (3), 351±359.
Salen-Picard, C. (1983) Sch�emas dÕ�evolution dÕune bioc�enose macro-benthique du substrat meuble. Comptes Rendus de l'Academie desSciencies de Paris 296, 587±590.
Snelgrove, P. V. R. and Butman, C. A. (1994) Animal-sedimentrelationships revisited: cause versus e�ect. Oceanography andMarine Biology Annual Review 32, 111±177.
Stark, J. D. (1993) Performance of the macroinvertebrate communityindex: e�ects of sampling method, sample replication, water depth,current velocity and substratum on index values. New ZealandJournal of Marine and Freshwater Research 27, 463±478.
Washington, H. G. (1984) Diversity, biotic and similarity indices. Areview with special relevance to aquatic ecosystems.Water Research18, 653±694.
Weisberg, S. B., Ranasinghe, J. A., Dauer, D. M., Scha�ner, L. C.,Diaz, R. J. and Frithsen, J. B. (1997) An estuarine benthic indexof biotic integrity (B-IBI) for Chesapeake Bay. Estuaries 20 (1),149±158.
Woodiwiss, F. S. (1964). The biological system of stream classi®cationused by the Trent River Board. Chemistry Industries. 11, 443±447.
1114
Marine Pollution Bulletin