A Manitoba Success Story? Understanding Immigration through … · 2020-04-14 · A Manitoba...
33
A Manitoba Success Story? Understanding Immigration through Data and Evidence By: Lori Wilkinson, Jill Bucklaschuk , Jack (Yi) Shen, Iqbal Ahmed Chowdhury and Tamara Edkins Manitoba Immigration Summit Manitoba Immigrant and Refugee Settlement Service Agencies (MIRSSA) November 6 2014, Winnipeg
Transcript of A Manitoba Success Story? Understanding Immigration through … · 2020-04-14 · A Manitoba...
A Manitoba Success Story? Understanding Immigration through Data and Evidence By: Lori Wilkinson, Jill Bucklaschuk , Jack (Yi) Shen, Iqbal
Ahmed Chowdhury and Tamara Edkins
Manitoba Immigration Summit Manitoba Immigrant and Refugee Settlement Service Agencies (MIRSSA) November 6 2014, Winnipeg
Objectives of Today’s Presentation • PROJECT OBJECTIVES: to better understand the
settlement experiences of immigrants in western Canada and how they may compare to immigrants in other western provinces – Labour market, service use, social integration, language
• TODAY’S OBJECTIVES – Examine and compare various outcomes among immigrants in
Manitoba and the rest of Canada with special attention to: labour market, service use and sense of belonging
2
Datasets used • Pan Canadian Settlement Survey (N=20,818) and Western
Canadian Settlement Survey (N=3,006) • Random samples drawn from a CIC data file
– Telephone survey conducted in late 2012-early 2013 – Response rates: between 24.6% and 38.0%
• IMDB – Landings records (LIDS) combined with tax files for all immigrants
and refugees landing between 1980 and 2012 – Census of the population
• Longitudinal Survey of Immigrants to Canada (2004) – Followed 5,000 immigrants for their first two years in Canada (landing
between 2002-2004)
3
How representative are the surveys?
• Surprisingly good match between IMDB (Census of immigrants) and the other surveys
• Western Canada Settlement Survey – Under-represented female economic class dependents – Over-represented female economic class principal applicants – Under-represented male and female refugees
• Pan Canadian Settlement Survey – Under-represented men from BC – Over-represented women from SK and MB – Over-represented men from SK and MB
4
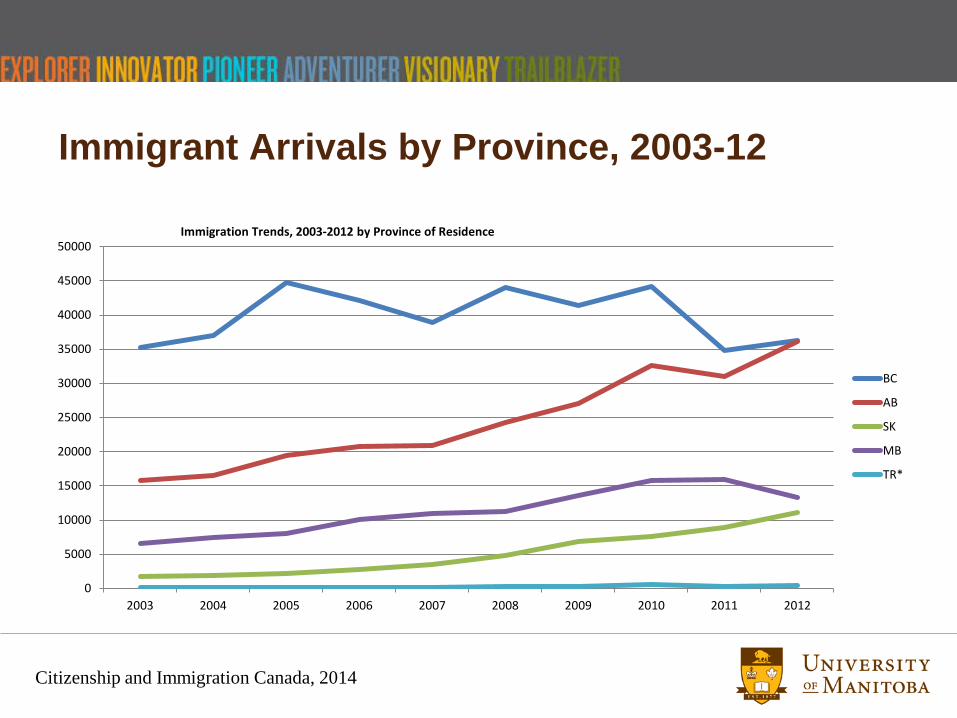
Immigrant Arrivals by Province, 2003-12
Citizenship and Immigration Canada, 2014
0
5000
10000
15000
20000
25000
30000
35000
40000
45000
50000
2003 2004 2005 2006 2007 2008 2009 2010 2011 2012
Immigration Trends, 2003-2012 by Province of Residence
BC
AB
SK
MB
TR*
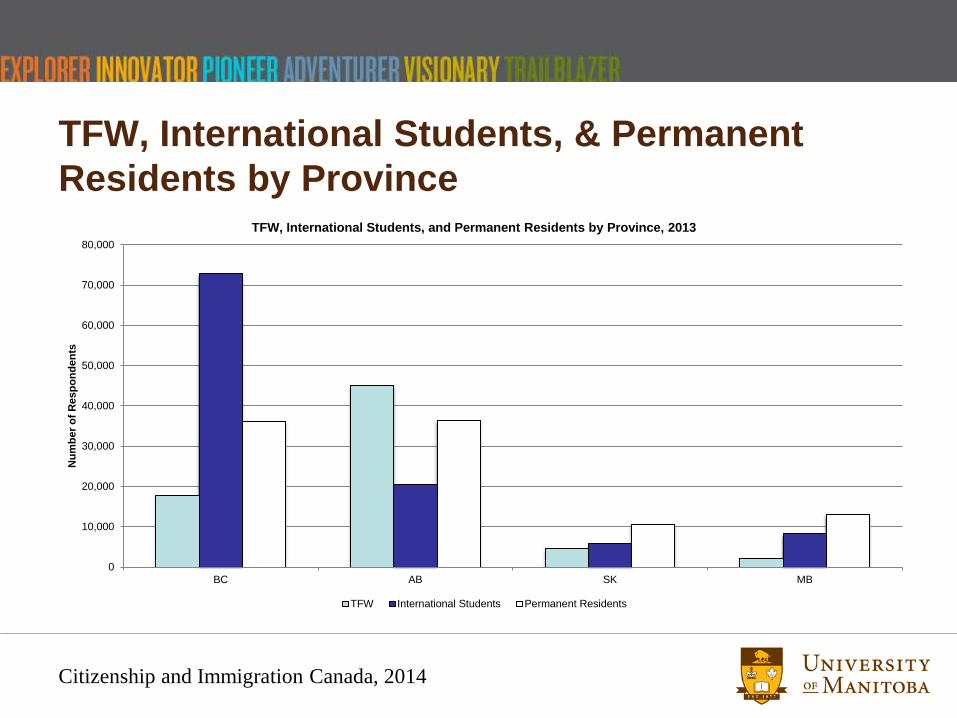
TFW, International Students, & Permanent Residents by Province
Citizenship and Immigration Canada, 2014
0
10,000
20,000
30,000
40,000
50,000
60,000
70,000
80,000
BC AB SK MB
Num
ber o
f Res
pond
ents
TFW, International Students, and Permanent Residents by Province, 2013
TFW International Students Permanent Residents
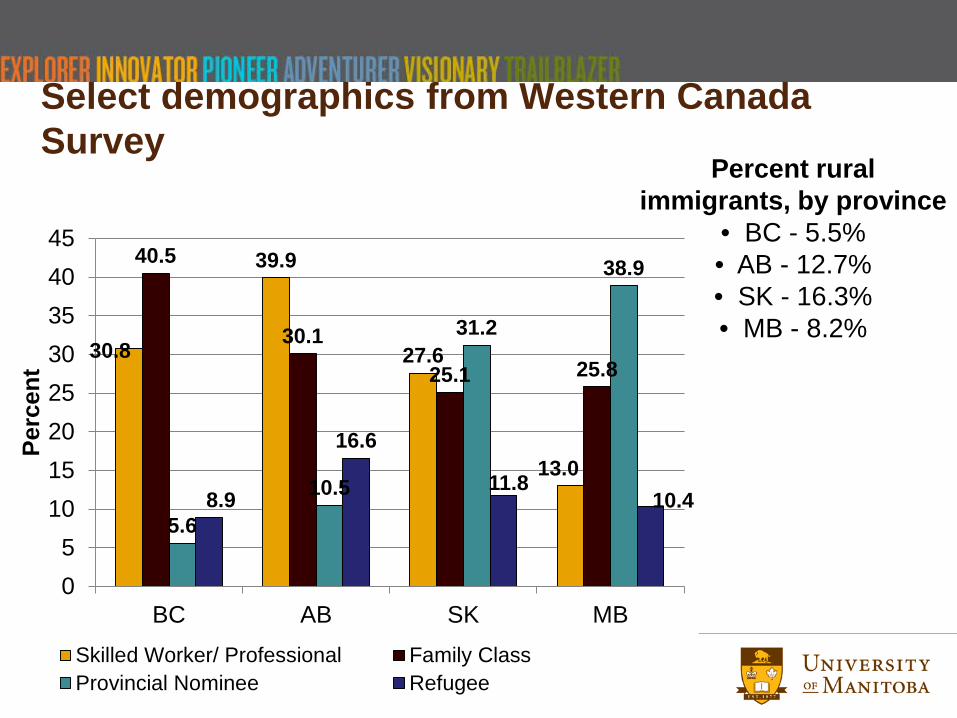
Select demographics from Western Canada Survey
7
Percent rural immigrants, by province
• BC - 5.5% • AB - 12.7% • SK - 16.3% • MB - 8.2%
30.8
39.9
27.6
13.0
40.5
30.1
25.1 25.8
5.6
10.5
31.2
38.9
8.9
16.6
11.8 10.4
05
1015202530354045
BC AB SK MB
Perc
ent
Skilled Worker/ Professional Family ClassProvincial Nominee Refugee

Labour Force Measurements
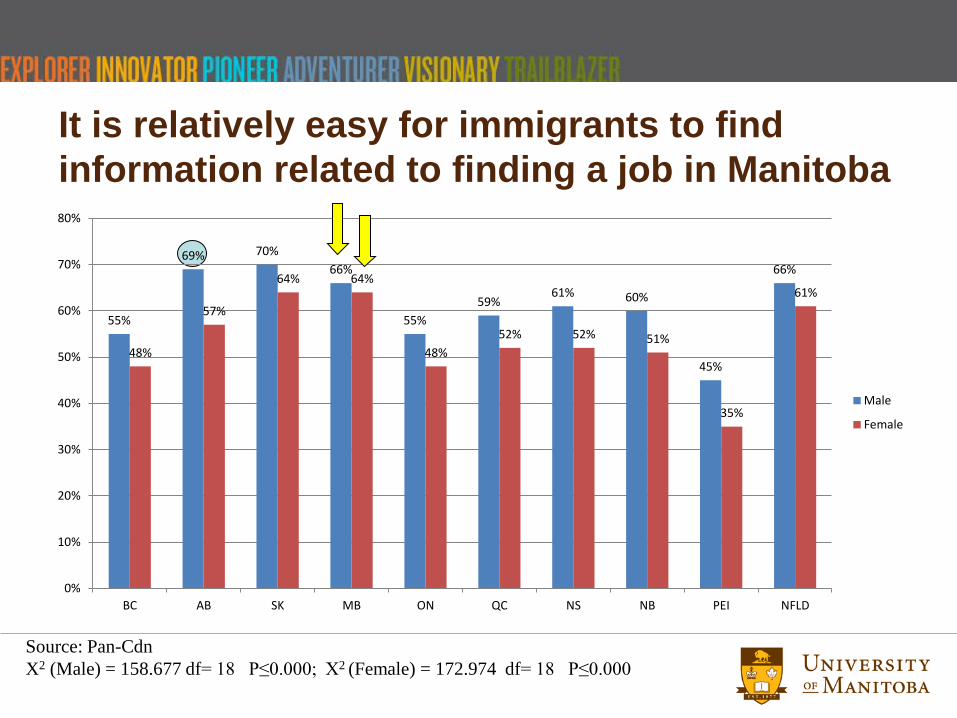
It is relatively easy for immigrants to find information related to finding a job in Manitoba
55%
69% 70% 66%
55% 59%
61% 60%
45%
66%
48%
57%
64% 64%
48% 52% 52% 51%
35%
61%
0%
10%
20%
30%
40%
50%
60%
70%
80%
BC AB SK MB ON QC NS NB PEI NFLD
Male
Female
Source: Pan-Cdn X2 (Male) = 158.677 df= 18 P≤0.000; X2 (Female) = 172.974 df= 18 P≤0.000
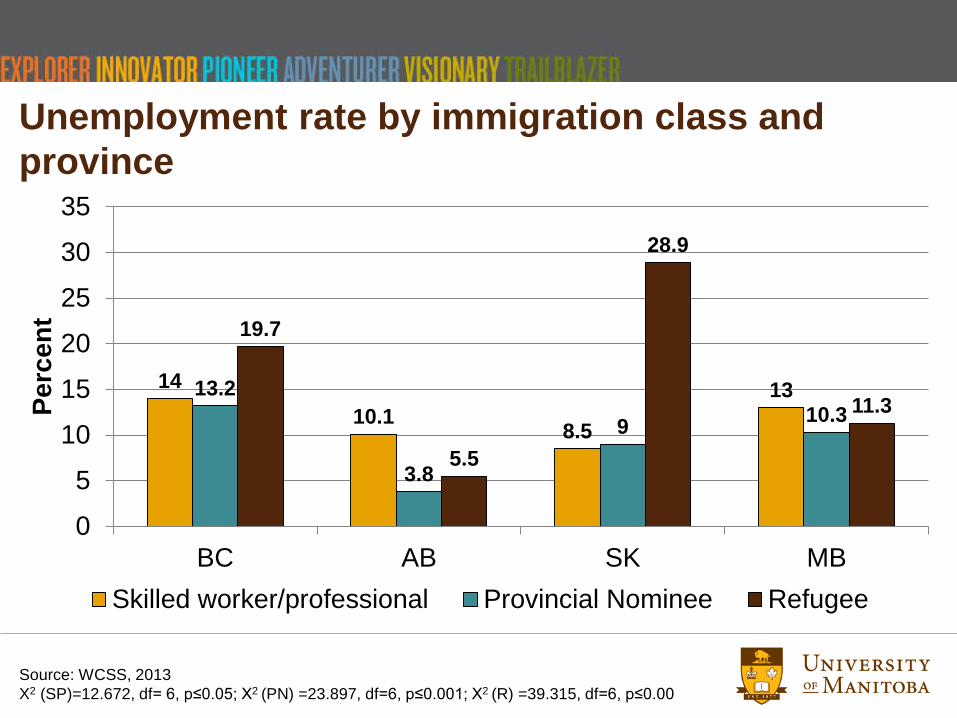
Unemployment rate by immigration class and province
Source: WCSS, 2013 X2 (SP)=12.672, df= 6, p≤0.05; X2 (PN) =23.897, df=6, p≤0.001; X2 (R) =39.315, df=6, p≤0.00
14 10.1 8.5
13 13.2
3.8
9 10.3
19.7
5.5
28.9
11.3
0
5
10
15
20
25
30
35
BC AB SK MB
Perc
ent
Skilled worker/professional Provincial Nominee Refugee
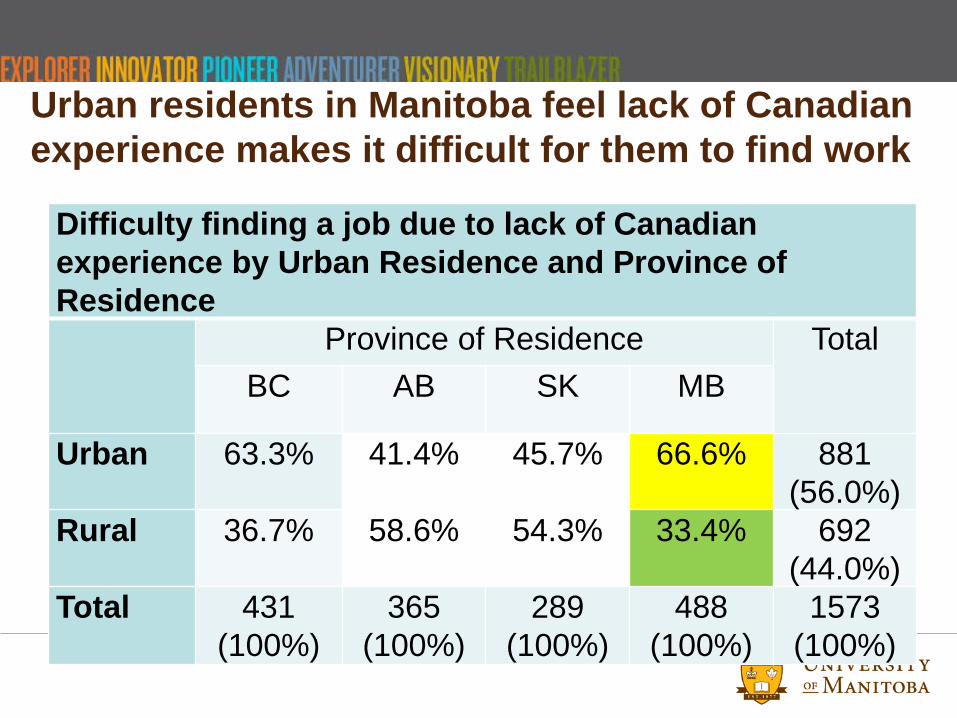
Urban residents in Manitoba feel lack of Canadian experience makes it difficult for them to find work
Difficulty finding a job due to lack of Canadian experience by Urban Residence and Province of Residence
Province of Residence Total BC AB SK MB
Urban 63.3% 41.4% 45.7% 66.6% 881 (56.0%)
Rural 36.7% 58.6% 54.3% 33.4% 692 (44.0%)
Total 431 (100%)
365 (100%)
289 (100%)
488 (100%)
1573 (100%)
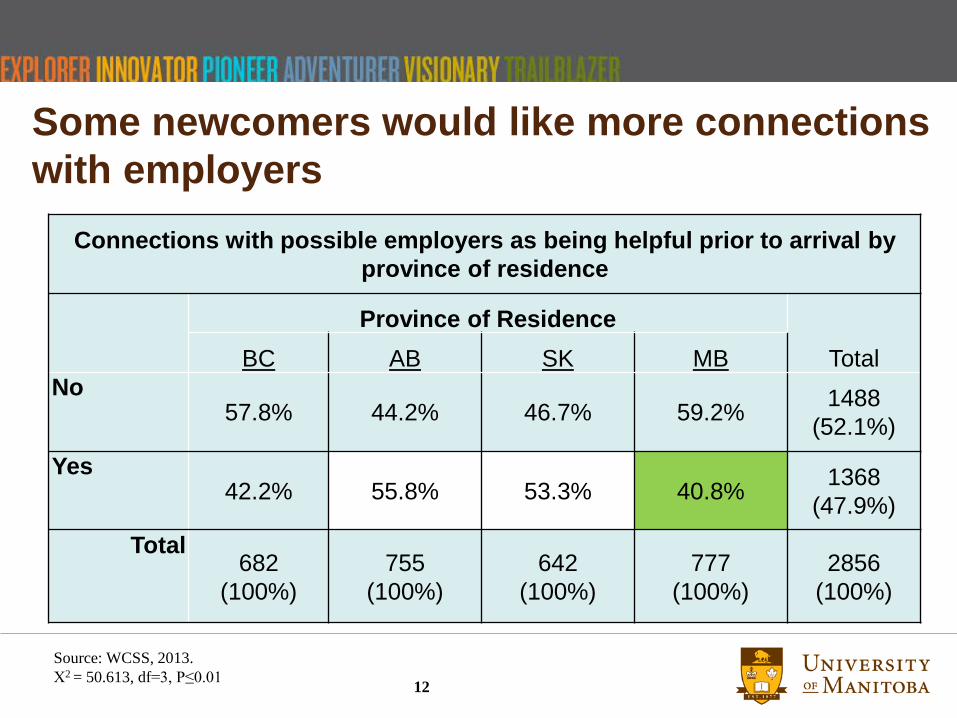
Some newcomers would like more connections with employers
Connections with possible employers as being helpful prior to arrival by province of residence
Province of Residence
Total BC AB SK MB No
57.8% 44.2% 46.7% 59.2% 1488 (52.1%)
Yes 42.2% 55.8% 53.3% 40.8% 1368
(47.9%) Total
682 (100%)
755 (100%)
642 (100%)
777 (100%)
2856 (100%)
Source: WCSS, 2013. Χ2 = 50.613, df=3, P≤0.01 12

Foreign Qualification Recognition
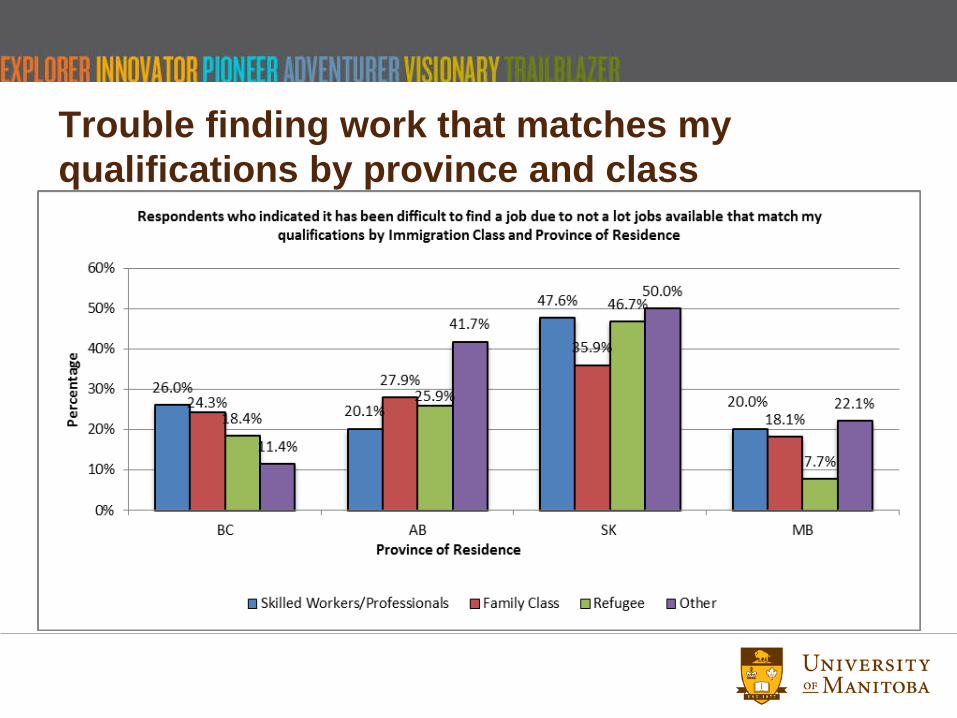
Trouble finding work that matches my qualifications by province and class
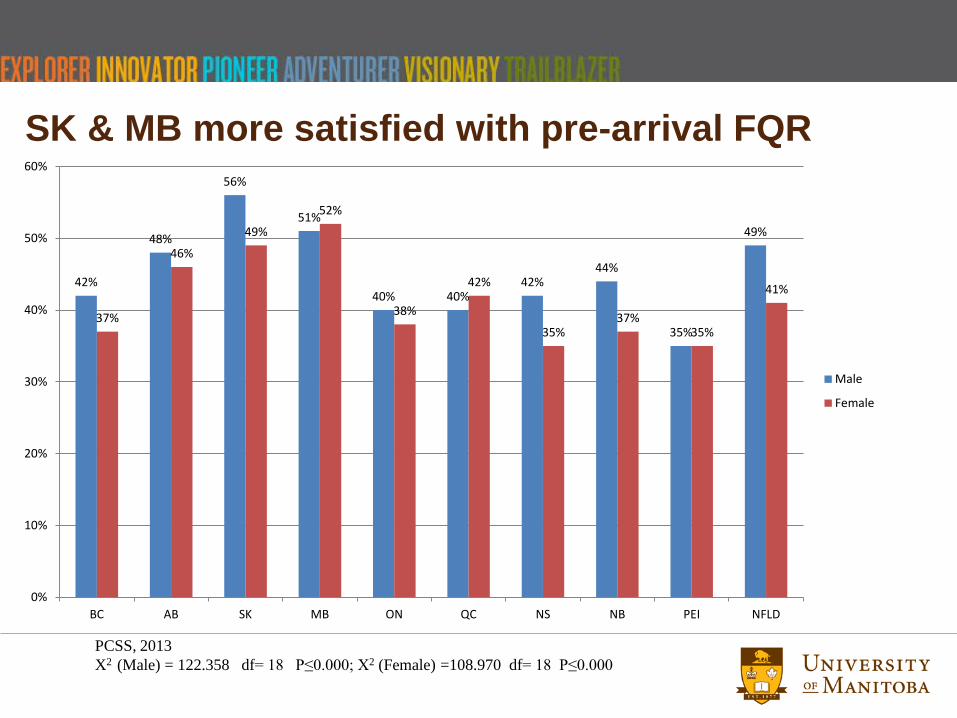
SK & MB more satisfied with pre-arrival FQR
42%
48%
56%
51%
40% 40% 42%
44%
35%
49%
37%
46%
49%
52%
38%
42%
35% 37%
35%
41%
0%
10%
20%
30%
40%
50%
60%
BC AB SK MB ON QC NS NB PEI NFLD
Male
Female
PCSS, 2013 X2 (Male) = 122.358 df= 18 P≤0.000; X2 (Female) =108.970 df= 18 P≤0.000
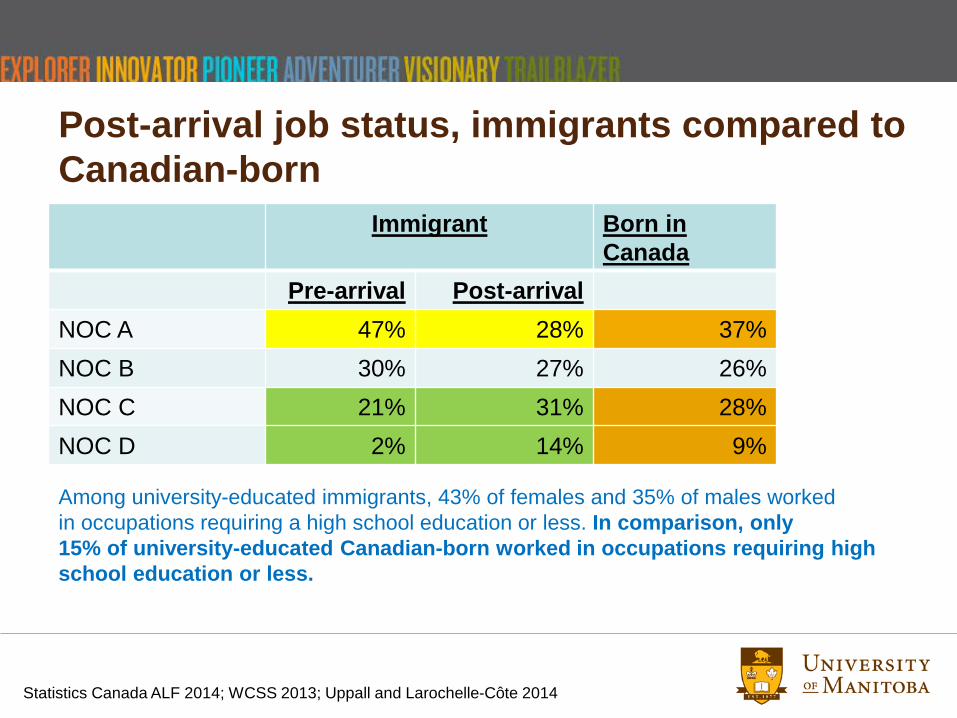
Post-arrival job status, immigrants compared to Canadian-born
Immigrant Born in Canada
Pre-arrival Post-arrival NOC A 47% 28% 37% NOC B 30% 27% 26% NOC C 21% 31% 28% NOC D 2% 14% 9%
Among university-educated immigrants, 43% of females and 35% of males worked in occupations requiring a high school education or less. In comparison, only 15% of university-educated Canadian-born worked in occupations requiring high school education or less.
Statistics Canada ALF 2014; WCSS 2013; Uppall and Larochelle-Côte 2014
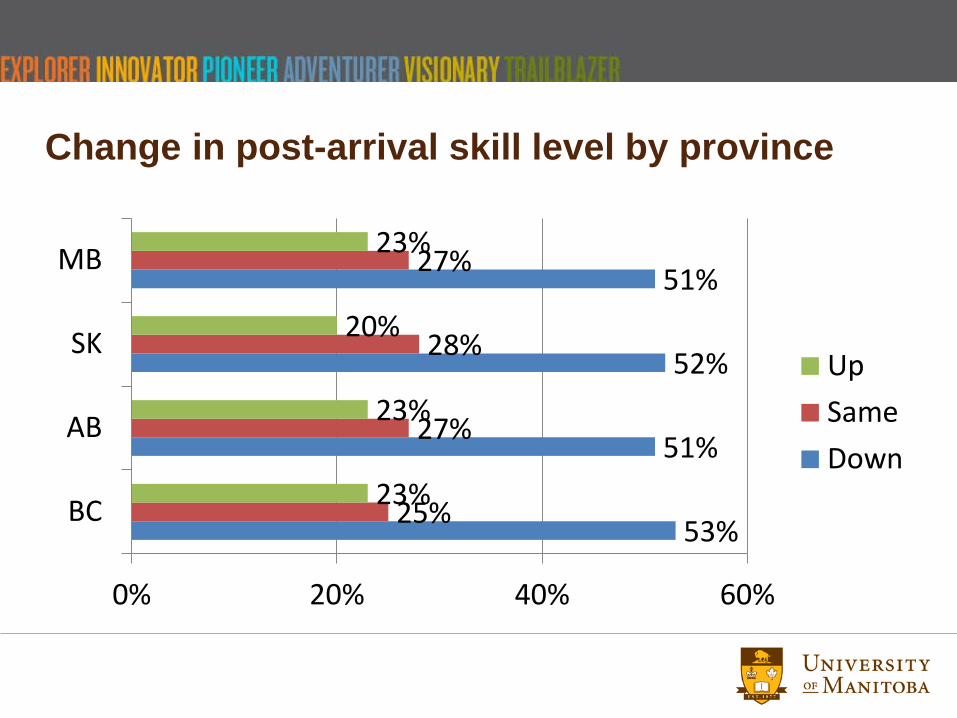
Change in post-arrival skill level by province
53%
51%
52%
51%
25%
27%
28%
27%
23%
23%
20%
23%
0% 20% 40% 60%
BC
AB
SK
MB
UpSameDown
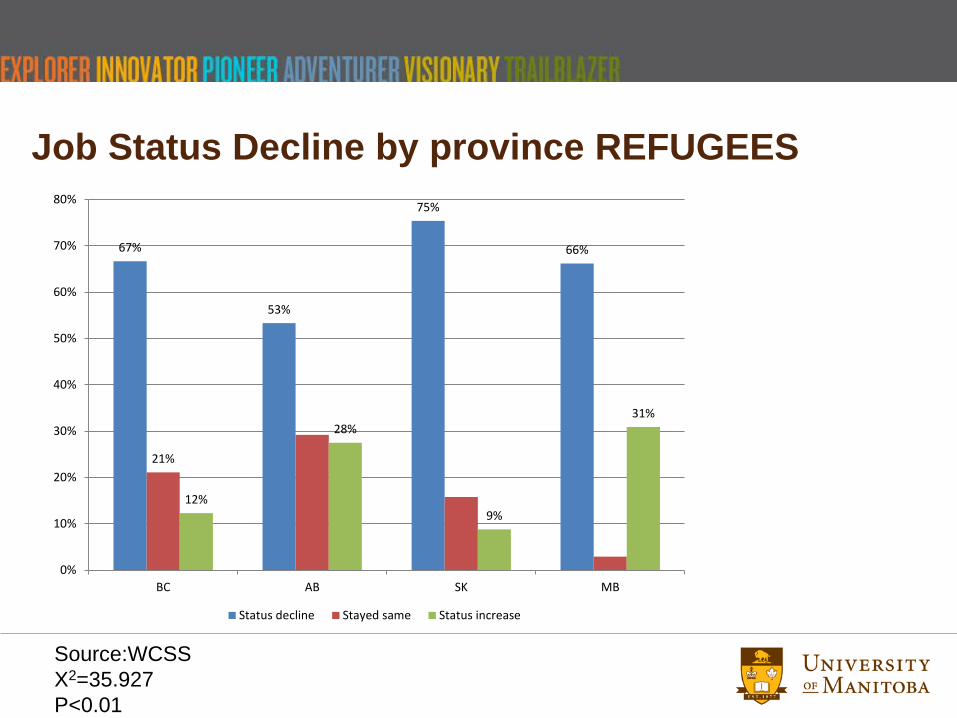
Job Status Decline by province REFUGEES
67%
53%
75%
66%
21%
12%
28%
9%
31%
0%
10%
20%
30%
40%
50%
60%
70%
80%
BC AB SK MB
Status decline Stayed same Status increase
Source:WCSS X2=35.927 P<0.01
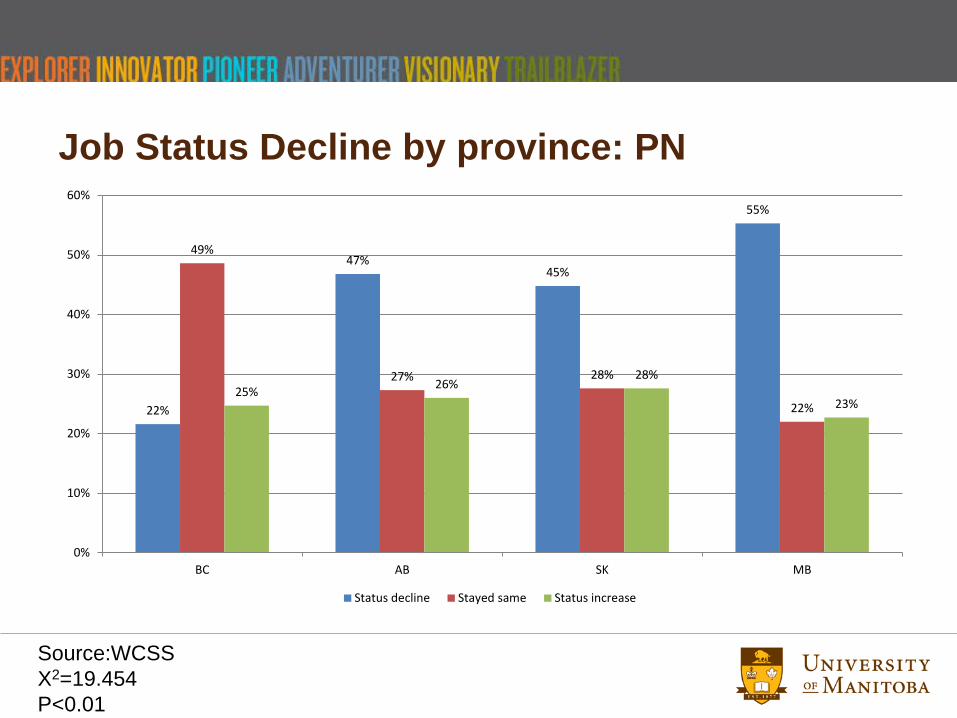
Job Status Decline by province: PN
Source:WCSS X2=19.454 P<0.01
22%
47% 45%
55%
49%
27% 28%
22% 25% 26%
28%
23%
0%
10%
20%
30%
40%
50%
60%
BC AB SK MB
Status decline Stayed same Status increase
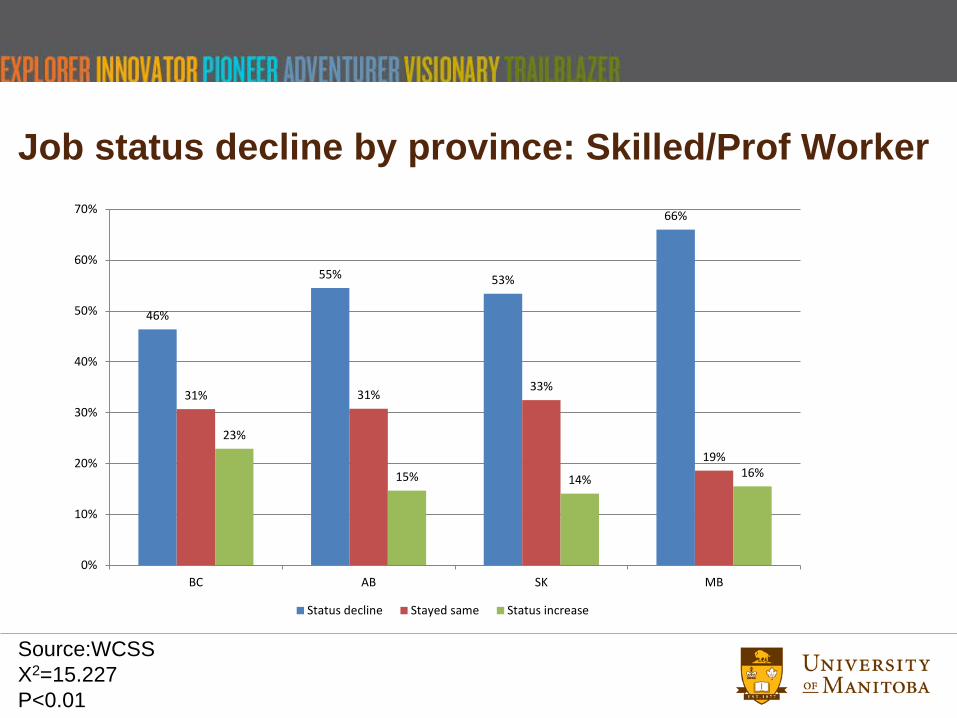
Job status decline by province: Skilled/Prof Worker
46%
55% 53%
66%
31% 31% 33%
19%
23%
15% 14% 16%
0%
10%
20%
30%
40%
50%
60%
70%
BC AB SK MB
Status decline Stayed same Status increase
Source:WCSS X2=15.227 P<0.01
Community Integration & Settlement Service Indicators
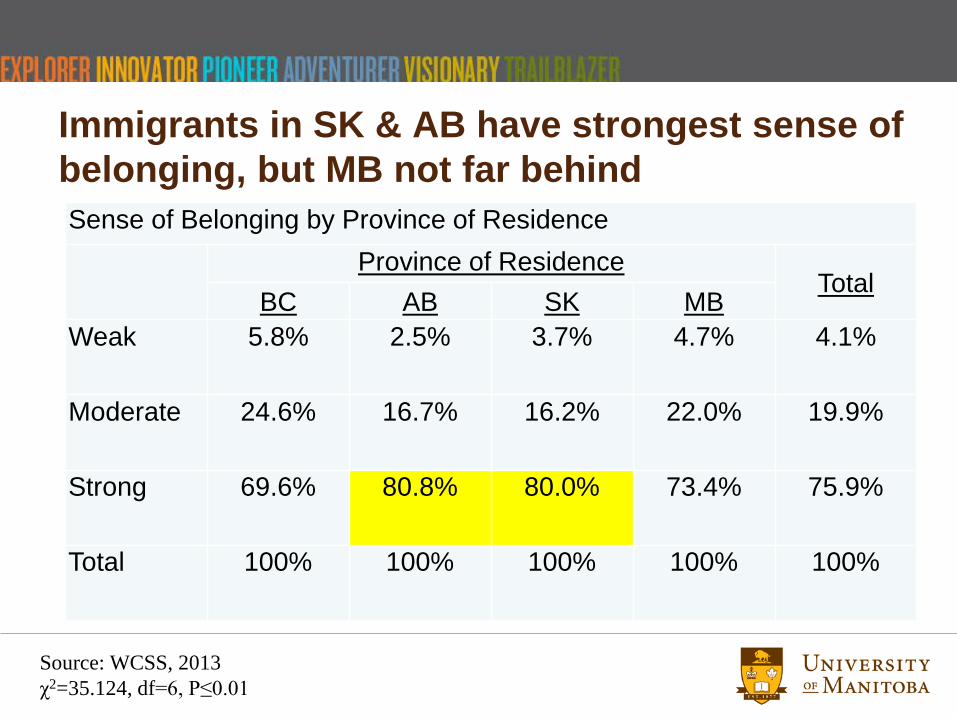
Immigrants in SK & AB have strongest sense of belonging, but MB not far behind Sense of Belonging by Province of Residence
Province of Residence
Total BC AB SK MB
Weak 5.8% 2.5% 3.7% 4.7% 4.1%
Moderate 24.6% 16.7% 16.2% 22.0% 19.9%
Strong 69.6% 80.8% 80.0% 73.4% 75.9%
Total 100% 100% 100% 100% 100%
Source: WCSS, 2013 χ2=35.124, df=6, P≤0.01
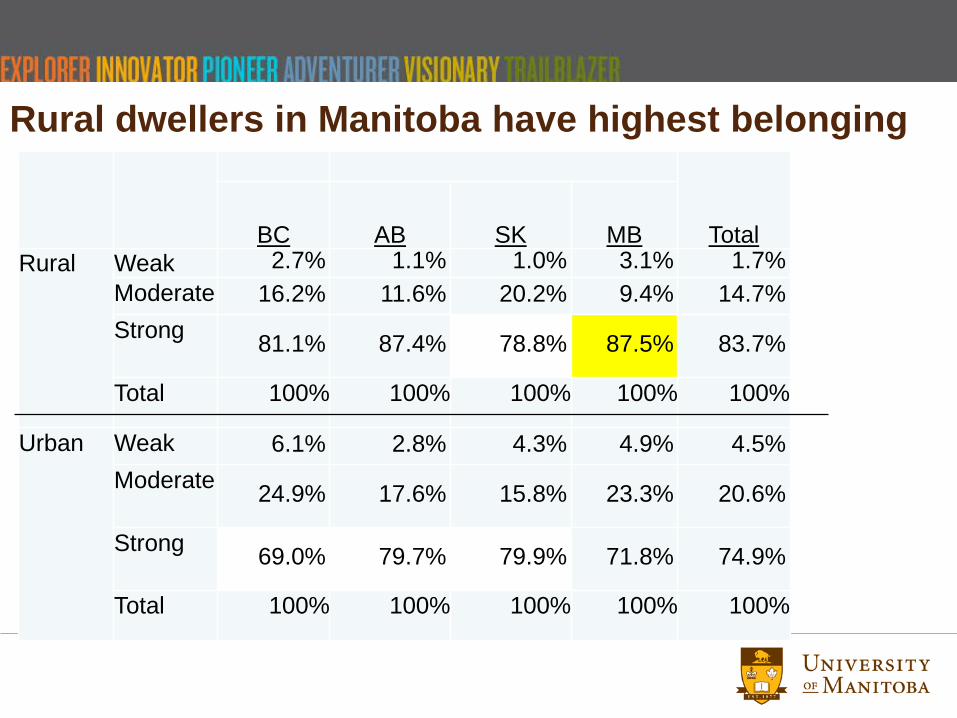
Rural dwellers in Manitoba have highest belonging
Total BC AB SK MB Rural Weak 2.7% 1.1% 1.0% 3.1% 1.7%
Moderate 16.2% 11.6% 20.2% 9.4% 14.7% Strong 81.1% 87.4% 78.8% 87.5% 83.7%
Total 100% 100% 100% 100% 100%
Urban Weak 6.1% 2.8% 4.3% 4.9% 4.5% Moderate 24.9% 17.6% 15.8% 23.3% 20.6%
Strong 69.0% 79.7% 79.9% 71.8% 74.9%
Total 100% 100% 100% 100% 100%
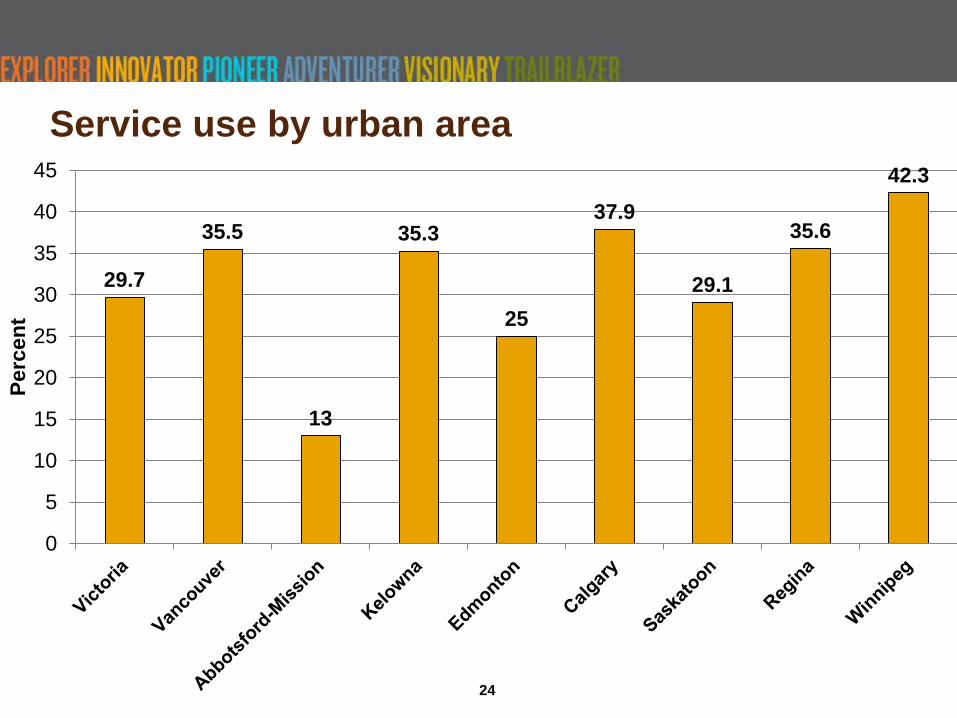
Service use by urban area
29.7
35.5
13
35.3
25
37.9
29.1
35.6
42.3
0
5
10
15
20
25
30
35
40
45
Perc
ent
24
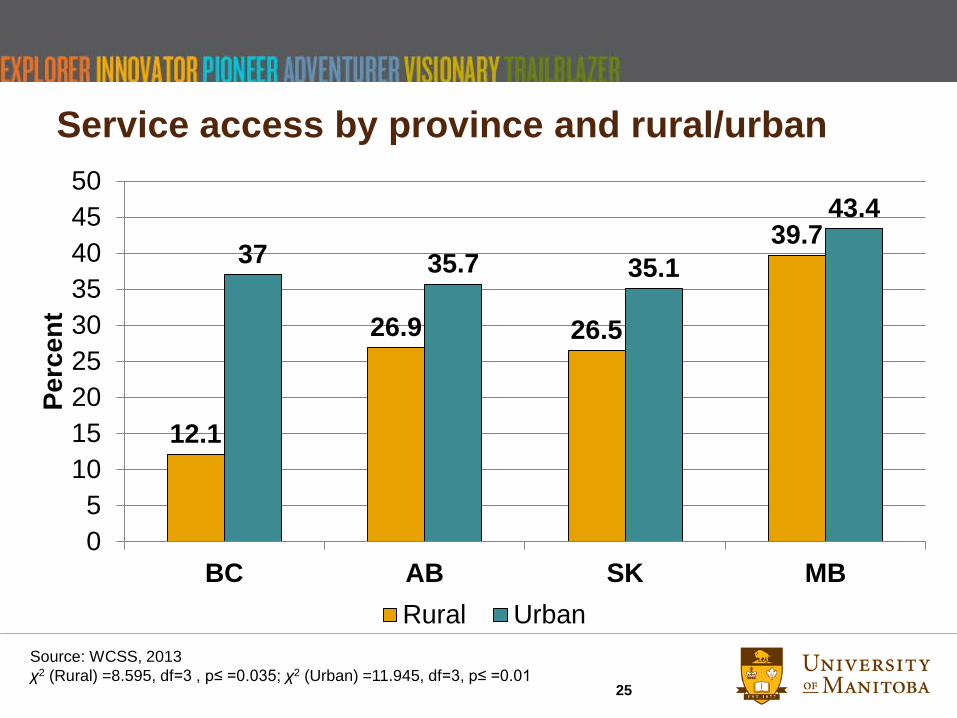
Service access by province and rural/urban
Source: WCSS, 2013 χ2 (Rural) =8.595, df=3 , p≤ =0.035; χ2 (Urban) =11.945, df=3, p≤ =0.01
12.1
26.9 26.5
39.7 37 35.7 35.1
43.4
05
101520253035404550
BC AB SK MB
Perc
ent
Rural Urban
25
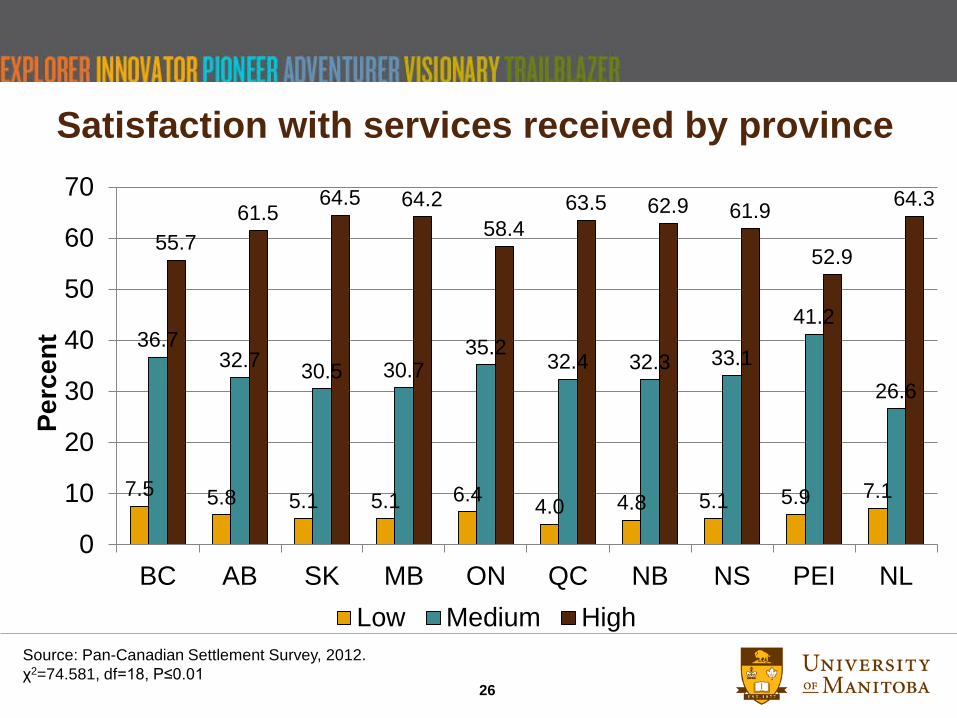
Satisfaction with services received by province
7.5 5.8 5.1 5.1 6.4 4.0 4.8 5.1 5.9 7.1
36.7 32.7 30.5 30.7
35.2 32.4 32.3 33.1
41.2
26.6
55.7 61.5
64.5 64.2 58.4
63.5 62.9 61.9
52.9
64.3
0
10
20
30
40
50
60
70
BC AB SK MB ON QC NB NS PEI NL
Perc
ent
Low Medium HighSource: Pan-Canadian Settlement Survey, 2012. χ2=74.581, df=18, P≤0.01 26
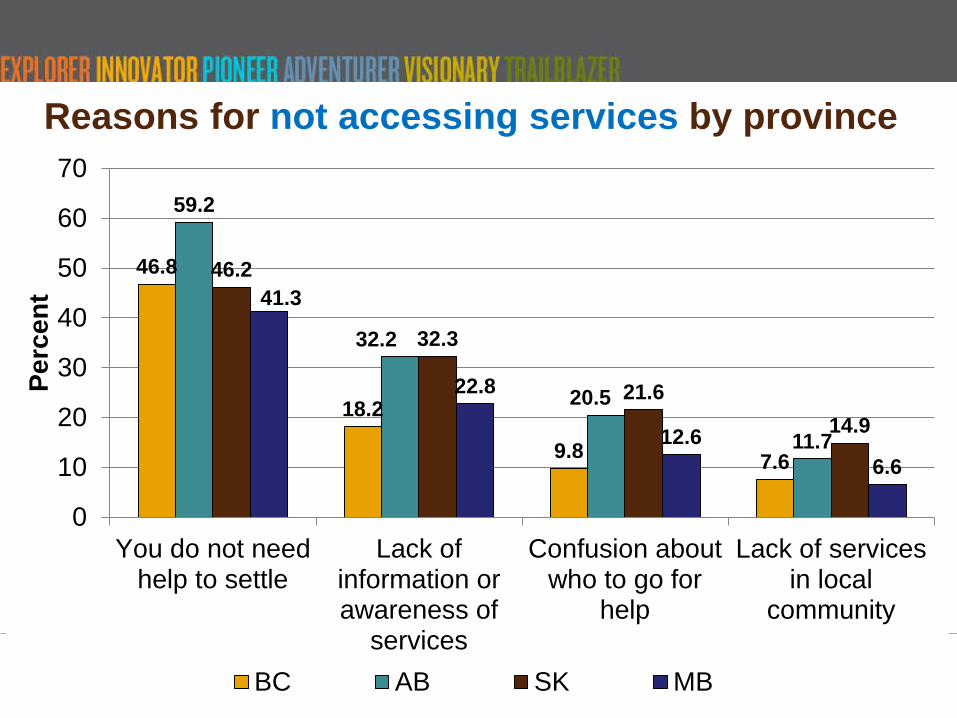
Reasons for not accessing services by province
46.8
18.2
9.8 7.6
59.2
32.2
20.5
11.7
46.2
32.3
21.6 14.9
41.3
22.8
12.6 6.6
0
10
20
30
40
50
60
70
You do not needhelp to settle
Lack ofinformation orawareness of
services
Confusion aboutwho to go for
help
Lack of servicesin local
community
Perc
ent
BC AB SK MB
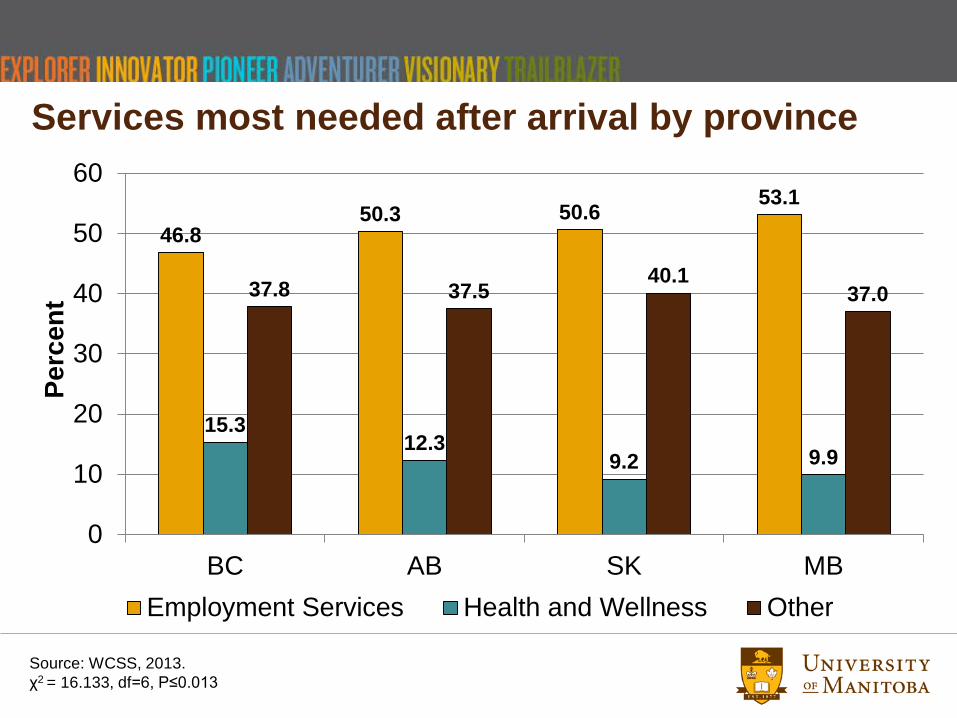
Services most needed after arrival by province
46.8 50.3 50.6
53.1
15.3 12.3
9.2 9.9
37.8 37.5 40.1
37.0
0
10
20
30
40
50
60
BC AB SK MB
Perc
ent
Employment Services Health and Wellness Other
Source: WCSS, 2013. χ2 = 16.133, df=6, P≤0.013
Why does province of residence matter? • Structure of immigration policy and settlement funding
– Changes to the funding and structure of settlement services (moving from a provincially-run to centralized control)
• Demographics are changing – More immigrants moving to Canada’s west than ever before – More immigrants living outside of Canada’s largest CMAs
• Labour markets are different – Alberta has been relying on TFWs for much longer than other
provinces (TFWs cannot access services) – Strong mismatch between skills and job, especially among those living
in rural areas
29
Additional Findings, Reports and Information
Immigration Research West 92 Dysart Road University of Manitoba Winnipeg, MB Canada R3T 3M5 Email: [email protected] [email protected] http://umanitoba.ca/about_RIW.html
30
Selected Data Sources • Alberta Labour. Immigrants in the Labour Force. Edmonton: Government of
Alberta, 2014 • Citizenship and Immigration Canada. Evidence from the Pan-Canadian
Settlement Outcomes Survey, 2012. Ottawa: CIC, January 2013. • Citizenship & Immigration Canada IMDB Microdata File. Ottawa: CIC 2013. • V. Esses, L. Hamilton, L. Wilkinson, L. Zong, J. Bucklaschuk and J.
Bramadat. Western Canada Settlement Outcomes Survey. Calgary: CIC Western Region Office, June 2013.
• Statistics Canada Longitudinal Survey of Immigrants to Canada. Ottawa: Statistics Canada, 2007.
• Statistics Canada Annual Labour Force Survey, Ottawa: Statistics Canada, 2014
• Statistics Canada National Household Survey, Ottawa: Statistics Canada, 2014
31
Acknowledgements • Immigration Research West • Citizenship and Immigration Canada, Western Region • Citizenship and Immigration Canada, National Headquarters • Western Settlement Survey University of Saskatchewan:
Martin Gaal, Joe Garcea and SSRL • Population Research Laboratory, University of Alberta • Western Settlement Survey researchers: Victoria Esses
(Western University), Leah Hamilton (Mount Royal University) and Li Zong (University of Saskatchewan)
• Research assistants: Janine Bramadat, Palak Dhiman, Kaitlyn Fraser, University of Manitoba
32