A Major Qualifying Project - Worcester Polytechnic Institute...Project Number: MQP-MQF 4901...
120
Project Number: MQP-MQF 4901 Point-of-Care Testing for Kidney Hemodialysis Treatment A Major Qualifying Project Submitted to the Faculty of the WORCESTER POLYTECHNIC INSTITUTE in partial fulfillment of the requirements for the degree of Bachelor of Science by Sean Fallon Erin LaBounty Biomedical Engineering Biomedical Engineering Brianna Parent Sarah Rogers Biomedical Engineering Biomedical Engineering Approved by: Professor Mustapha S. Fofana, PhD, Advisor
Transcript of A Major Qualifying Project - Worcester Polytechnic Institute...Project Number: MQP-MQF 4901...

Project Number: MQP-MQF 4901
Point-of-Care Testing for Kidney Hemodialysis
Treatment
A Major Qualifying Project
Submitted to the Faculty of the
WORCESTER POLYTECHNIC INSTITUTE
in partial fulfillment of the requirements for the degree of
Bachelor of Science
by
Sean Fallon Erin LaBounty
Biomedical Engineering Biomedical Engineering
Brianna Parent Sarah Rogers
Biomedical Engineering Biomedical Engineering
Approved by:
Professor Mustapha S. Fofana, PhD, Advisor

i
Abstract
Over two million people worldwide currently suffer from some form of kidney failure. Many
receive treatment through dialysis while others are fortunate enough to receive a kidney transplant.
Vital signs, such as blood pressure, heart rate, temperature and dry weight, are recorded during the
hemodialysis treatment process. Currently, there are no devices implemented in dialysis clinics
that can simultaneously record vital signs for continuous monitoring. In order to expedite the
hemodialysis treatment process, a point-of-care device is developed for continuous monitoring of
heart rate and body temperature. The device called the VitalRing, utilizes two types of sensors to
collect physiological data from the distal phalanx of the index and middle fingers. The first sensor
is an infrared (IR) pulse sensor made up of a light emitting diode (LED) and photodiode, while the
second sensor uses a Negative Temperature Coefficient (NTC) thermistor. The sensor outputs
signals are wired to an Arduino Uno board. The board is powered by a USB cable connection that
allows communication between the board and virtual comport of a PC. Validation of the VitalRing
device is accomplished through experiments performed using the proposed device as well as the
“gold standard” devices on four volunteer subjects. The data collected are statistically analyzed
using Matlab to obtain p-values through T-tests and Kolmogorov-Smirnov tests. The results
indicate that the VitalRing device is capable of measuring and displaying both heart rate and body
temperature over the course of a dialysis treatment. The temperature and heart rate results are both
comparable to the referenced data. Based on the statistical results from Matlab, at least one of the
p-values for heart rate measurement is larger than 0.05, meaning that the VitalRing device is
capable of measuring heart rate accurately against the referenced data. For the other subjects, the
p-values are slightly smaller than 0.05. However these p-values could be improved based on
change in sensor location or further calibration of the VitalRing. None of the p-values for
temperature are greater than 0.05, which means that the temperature data are statistically different
from the referenced data. Further calibration is necessary to increase the accuracy of the
measurements. The addition of other vital sign measurements, such as blood pressure, pulse
oximetry and physiological makers, will increase the efficiency of dialysis treatment.

ii
Table of Contents
Abstract ........................................................................................................................................... i
Table of Contents .......................................................................................................................... ii
List of Figures ................................................................................................................................ v
List of Tables ............................................................................................................................... vii
Chapter 1. Introduction ............................................................................................................... 1
Chapter 2: Kidney Dialysis .......................................................................................................... 3
2. Introduction ............................................................................................................................... 3
2.1. The Human Kidneys .......................................................................................................... 3
2.2.1. Kidney Anatomy .......................................................................................................... 3
2.1.2 Kidney Functions .......................................................................................................... 4
2.1.3 Kidney Modes of Failure .............................................................................................. 7
2.1.4 Rate of Failure of the Kidney ...................................................................................... 8
2.2 Treatment Process for Kidney Disease............................................................................ 11
2.2.1 Evolution of Dialysis ................................................................................................... 11
2.2.1 Hemodialysis Parameters........................................................................................... 12
2.2.3 Hemodialysis Treatment Process .............................................................................. 15
2.2.4 Peritoneal Dialysis Treatment ................................................................................... 17
2.2.5 Patient Care in Dialysis Clinics ................................................................................. 20
2.2.6 International Studies on Hemodialysis ..................................................................... 22
2.3 Vital Sign Monitoring in Hemodialysis ........................................................................... 27
2.3.1 Blood Pressure ............................................................................................................ 28
2.3.2 Heart Rate ................................................................................................................... 29
2.3.3 Body Temperature ...................................................................................................... 31
2.3.4 SpO2 and Hematocrit ................................................................................................. 32
2.4 Electrical Components for Heart Rate and Body Temperature ................................... 32
2.4.1 Infrared Sensor ........................................................................................................... 32
2.4.2 Negative Temperature Coefficient Thermistor ....................................................... 34
2.4.3 Arduino Board ............................................................................................................ 34

iii
Chapter 3: Project Strategy ....................................................................................................... 36
3. Introduction ............................................................................................................................. 36
3.1 Initial and Revised Client Statement ............................................................................... 36
3.2 Design Requirements for the Deliverable .................................................................... 37
3.2.1 Design Objectives ........................................................................................................ 37
3.2.2 Constraints of the VitalRing Device.......................................................................... 38
3.2.3 Functions of the VitalRing Device ............................................................................. 38
3.2.4 Physiological and Engineering Specifications .......................................................... 38
3.3 Medical Device Design Requirements ............................................................................. 40
3.4 Management Approach .................................................................................................... 41
3.4.1 Conceptual Alternative Designs ................................................................................ 42
3.4.2 Evaluation of Conceptual Alternative Designs ........................................................ 43
3.4.3 Plan for Final Design Selection.................................................................................. 43
3.4.4 Plan for Final Design Testing and Evaluation ......................................................... 43
3.4.5 Reporting on the Final Design ................................................................................... 44
Chapter 4: Design Process of VitalRing Device ....................................................................... 45
4. Introduction ............................................................................................................................. 45
4.1 Needs Analysis ................................................................................................................... 45
4.2 Concept Formation: Existing Technologies .................................................................... 46
4.2.1 i-STAT Handheld Blood Analyzer ............................................................................ 46
4.2.2 U.S. Patent ................................................................................................................... 47
4.2.3 Feasibility .................................................................................................................... 48
4.3 Alternative Designs ........................................................................................................... 48
4.3.1 Vest Design .................................................................................................................. 48
4.3.2 Arm Sleeve Design ...................................................................................................... 49
4.3.3 Finger Clip Design ...................................................................................................... 50
4.4: Final Design Selection ...................................................................................................... 51
Chapter 5: Design Verification .................................................................................................. 57
5. Introduction ............................................................................................................................. 57

iv
5.1 ECG Testing....................................................................................................................... 57
5.2 Temperature Testing......................................................................................................... 62
5.3 VitalRing Testing............................................................................................................... 63
5.4 Statistical Analysis............................................................................................................. 75
Chapter 6: Final Design and Validation ................................................................................... 77
6. Introduction ............................................................................................................................. 77
6.1 Feedback on Final Design ................................................................................................. 77
6.2 Economics .......................................................................................................................... 77
6.3 Environmental Impact ...................................................................................................... 78
6.4 Societal Influence............................................................................................................... 78
6.5 Political Ramifications ...................................................................................................... 78
6.6 Ethical Concerns ............................................................................................................... 79
6.7 Health and Safety Issues ................................................................................................... 79
6.8 Manufacturability ............................................................................................................. 79
Chapter 7: Discussion ................................................................................................................. 80
Chapter 8: Conclusions and Recommendations ...................................................................... 82
References .................................................................................................................................... 84
Appendix A: Step-by-Step Process of a Dialysis Patient’s Plan ............................................. 88
Appendix B: Acute and Chronic Order Forms ........................................................................ 89
Appendix C: Hemodialysis Laboratory Tests Performed for Different Time Periods ........ 91
Appendix D: Block Diagram of Hemodialysis Treatment ...................................................... 92
Appendix E: ISO Standards ...................................................................................................... 93
Appendix F: List of Materials of VitalRing .............................................................................. 95
Appendix F: VitalRing and Arduino Interface ........................................................................ 96
Appendix G: Matlab Code for VitalRing ................................................................................. 99
v
List of Figures Figure 1. The Structure of the Kidney ............................................................................................ 4
Figure 2. The Major Blood Vessels of the Kidney ......................................................................... 5
Figure 3. The Nephron Tubules and Associated Blood Vessels ..................................................... 6
Figure 4. CDC Chronic Kidney Disease Prevalence by Age .......................................................... 9
Figure 5. CDC Chronic Kidney Disease Prevalence by Gender .................................................. 10
Figure 6. CDC Chronic Kidney Disease Prevalence by Ethnicity ................................................ 10
Figure 7. CDC Chronic Kidney Disease Prevalence by Diabetes ................................................ 11
Figure 8. Dialyzer and Dialysis Machine ..................................................................................... 14
Figure 9. Hemodialysis Process during Treatment ....................................................................... 16
Figure 10. Process of Peritoneal Dialysis ..................................................................................... 17
Figure 11. Continuous Ambulatory Peritoneal Dialysis (CAPD) ................................................. 19
Figure 12. Continuous Cycling Peritoneal Dialysis (CCPD)........................................................ 19
Figure 13. Comparison of Grades Received by States in 2009 and 2014 ..................................... 20
Figure 14. Overall State Grades for Emergency Medicine ........................................................... 21
Figure 15. International Dialysis Breakdown ............................................................................... 23
Figure 16. Mortality Rate of Dialysis Patients.............................................................................. 25
Figure 17. Blood Pressure Cuff .................................................................................................... 29
Figure 18. ECG Electrode Placement ........................................................................................... 30
Figure 19. ECG Equipment........................................................................................................... 30
Figure 20. Digital Infrared Forehead Thermometer ..................................................................... 31
Figure 21. LED PN Junction and Photon Generation ................................................................... 33
Figure 22. Arduino Uno Board ..................................................................................................... 35
Figure 23. Gantt Chart for Completion of Project ........................................................................ 41
Figure 24. Work Breakdown Structure ......................................................................................... 42
Figure 25. i-STAT Handheld Blood Analyzer .............................................................................. 47
Figure 26. Vest Design for Measuring Heart Rate and Temperature ........................................... 49
Figure 27. Arm Sleeve Design for Measuring Vital Signs ........................................................... 50
Figure 28. Finger Clip Design for Measuring Vital Signs ............................................................ 50
Figure 29. Full Circuit Schematic of VitalRing ............................................................................ 53
Figure 30. Full Solidworks Design of the Housing Unit .............................................................. 54
Figure 31. SolidWorks Finger Ring Image ................................................................................... 54
Figure 32. Final VitalRing Design ................................................................................................ 55
Figure 33. Diagram of all VitalRing Components ........................................................................ 56
Figure 34. ECG Experimental Setup ............................................................................................ 57
Figure 35. ECG Reference Data Plot for Subject 1 ...................................................................... 58
Figure 36. ECG Reference Data Plot for Subject 2 ...................................................................... 59
Figure 37. ECG Reference Data Plot for Subject 3 ...................................................................... 60

vi
Figure 38. ECG Reference Data Plot for Subject 4 ...................................................................... 61
Figure 39. Temperature Thermometer Placement ........................................................................ 62
Figure 40. VitalRing Experimental Setup ..................................................................................... 64
Figure 41. Absorbance Plot for Subject 1 ..................................................................................... 65
Figure 42. Temperature Plot for Subject 1.................................................................................... 66
Figure 43. Absorbance Plot for Subject 2 ..................................................................................... 67
Figure 44. Temperature Plot for Subject 2.................................................................................... 68
Figure 45. Absorbance Plot for Subject 3 ..................................................................................... 69
Figure 46. Temperature Plot for Subject 3.................................................................................... 70
Figure 47. Absorbance Plot for Subject 4 ..................................................................................... 71
Figure 48. Temperature Plot for Subject 4.................................................................................... 72
Figure 49. Reference and VitalRing Heart Rate Data for Each Subject ....................................... 74
Figure 50. Reference and VitalRing Temperature Data for Each Subject .................................... 75

vii
List of Tables Table 1. The Glomerular Filtration Rate Relation to Kidney Function 8
Table 2. Average Treatment Time (TT) and Ultrafiltration Rate (UFR) by Region 26
Table 3. Vital Signs Measured during Hemodialysis and Acceptable Ranges 27
Table 4. Pairwise Comparison Chart of Design Objectives 37
Table 5. Specifications of the Final Device 40
Table 7. i-STAT Strengths and Weaknesses Comparison 46
Table 8. Strengths and Weaknesses Based on Sensor Location 48
Table 9. Reference ECG Data for Each Subject 62
Table 10. Reference Temperature Data for Each Subject 63
Table 11. Heart Rate Results for Each Subject Using the Device 73
Table 12. Body Temperature Results for Each Subject Using the Device 73
Table 13. Statistical Results for Heart Rate Data 76
Table 14. Statistical Results for Body Temperature Data 76

1
Chapter 1. Introduction According to the National Kidney Foundation, over 661,000 Americans were diagnosed with
kidney failure in 2015 and of these, 468,000 individuals began dialysis treatment. Approximately
thirty one billion dollars of Medicare spending in the United States goes towards kidney failure
annually. Dialysis is simply a short-term solution to kidney failure, and kidney replacement
serves as the gold standard for long term treatment. However, the lack of availability for kidneys
is a major problem as thirteen people die daily while waiting for a kidney donor [1]. This occurs
due to the fact that dialysis treatments are only effective for a period of time. The average life
expectancy on dialysis treatment is five to ten years, in which the patient has to receive dialysis
treatments at least three times per week for the rest of their life or until a kidney is available for
transplantation. The most common type of kidney dialysis treatment is hemodialysis.
Hemodialysis requires the patient to go to the dialysis clinic three times a week for three to five
hours each visit. During a hemodialysis treatment, a medical device called a dialyzer is used as
an artificial kidney to filter the patient’s blood and to remove excess fluid and toxins. The blood
leaves the body through a tube attached to a fistula or catheter typically located in the arm of the
patient, and flows into the dialyzer where it is cleaned. After the blood is cleaned, the blood
returns to the body. This treatment is very time consuming and very few activities can be done
while receiving dialysis treatment. The patient required to have minimal movement so they are
only allowed to do activities such as reading, talking, sleeping or watching television [2]. Vital
signs measured during hemodialysis treatment are blood pressure, heart rate, temperature, dry
weight, volume of fluid removed from the blood, flowrate and pressure of arteries and veins.
There is currently no device implemented in dialysis clinics that can simultaneously and
continuously monitors these vital signs.
The goal of this project is to improve the quality of dialysis treatment by designing a point-
of-care, user-friendly instrument that continuously monitors body temperature, heart rate, and
body weight. The primary objectives of the project are to continuously monitor body temperature
and heart rate during hemodialysis treatment. Safety, accuracy, and reproducibility of the
VitalRing device are incorporated into the designed process. The VitalRing device needs to

2
record a broader scope of vital signs to provide more accurate measurements and to ensure that
medical records of the patient are not altered and the treatment prescription is now skewed.
Finally, the VitalRing device needs to be reproducible, such that it can easily be implemented in
dialysis clinics and hospitals. Several design iterations were researched and discussed before the
team rendered a conclusion. One of the first parameters discussed was the location of vital sign
measurement. Once the brainstorming process was completed, the three design iterations
included a vest, a sleeve, and a finger clip were considered for the measurement of body
temperature and heart rate. However, these ideas were not pursued due to existing technological
limitations. These limitations included invasiveness, contaminant risk, and sensor location. The
team established the final design to be a point-of-care device. The UMass library, DaVita
Dialysis Center in Worcester, Massachusetts, and dialysis machine in Goddard Hall were all
resources available to help aid the team with the completion of the project.
The final design was able to noninvasively measure both heart rate and body temperature
through the construction of two separate circuits, integrated through an Arduino Uno. Once the
data were gathered from different test subjects, Matlab was used to analyze the data, plot the
results and remove extraneous noise from the data. The circuits were housed in a unit printed by
a Markforged Mark 2 3-Dimensional Printer provided by the Rapid Prototyping Department of
WPI. Once completely tested, the data gathered from the device was compared to reference data
determined through experimental testing of each subject. Factors such as safety, cost, ethics,
manufacturability, and reproducibility were considered with the development of the final
product. Chapter 2 contains the background on relevant devices for measuring vital signs during
dialysis treatment. The machine and equipment for dialysis treatment are also described in this
Chapter. Chapter 3 discusses the project plan, while in Chapter 4 the alternative designs and final
design selections are discussed. Chapter 5 contains device testing and verification. Chapter 6
elaborates on the potential impacts of the VitalRing, and Chapters 7 and 8 will include Discussion
and Conclusions/Recommendations.

3
Chapter 2: Kidney Dialysis
2. Introduction
This chapter focuses on the anatomical role of the human kidney and treatments for kidney
disease, such as Hemodialysis and Peritoneal Dialysis. Vital signs monitoring, specifically in
Hemodialysis are also mentioned throughout this section and along with the electrical
components for heart rate and temperature sensors.
2.1. The Human Kidneys
A human being has a pair of organs located on either side of the vertebral column below the
diaphragm and liver, called the kidneys [3]. The kidneys are specifically located from the 12th
thoracic vertebrae and extend to the 3rd lumbar vertebrae. The right kidney is positioned slightly
inferior to the left kidney and the left kidney is slightly larger than the right kidney. The average
adult kidney is approximately 11 to 12 inches long, 5 to 7 inches wide, and 2.5 to 3 inches thick,
which is comparable to the size of a human fist [4]. The kidneys weigh approximately 5 ounces
each, and are protected by a layer of fat in the renal capsule.
2.2.1. Kidney Anatomy
The outer cortex is reddish brown due to its many capillaries. The medulla is located in the
deeper region on the coronal section, and is striped due to the tubules and blood vessels. The
cavity of the kidney contains calyces, which collects the urine and transports it to the bladder.
The kidneys work with several different parts of the body to perform each of its functions [4].
Figure 1 shows different sections of the kidney.

4
Figure 1. The Structure of the Kidney
2.1.2 Kidney Functions
The primary function of the kidney is to regulate the plasma and interstitial fluid in the body
[4]. This regulation leads to the formation of urine. In the process of regulating the urine, the
kidneys also regulate the following: the volume of blood plasma, the concentration of waste
products in the plasma, the pH of the plasma, and the concentration of electrolytes in the plasma.
The principal function of the kidney is not excretion, but regulation [5].
There are several mechanisms that aid the kidney with the completion of its functions. The
brain detects the overall concentration of dissolved substances within the blood, and sends
hormones to modify the final amount of water, which is removed in final formation of the urine.
The major blood vessels of the kidney are displayed in Figure 2. There are volume receptors
within the blood circulation system. These receptors jump-start the production of the hormone

5
atriopeptin, or ANP. This hormone works in correlation with the kidney to produce less sodium
[4].
Figure 2. The Major Blood Vessels of the Kidney
The nephron is responsible for the formation of urine. The kidneys contain more than a million
nephrons, which encompass thousands of tiny tubules that empty into a cavity drained by the
ureter. The nephron number is important in the indication of chronic kidney failure and
hypertension. The number of nephrons a human has is directly related to his or her birth weight
and age [4]. Nephron number does not have any correlation with race or sex. There are three
different types of nephrons within the kidney: superficial, juxtamedullary, and midcortical. The
superficial nephrons are located within the outer cortex and are responsible for sending arterioles
to the subcapsular regions. The juxtamedullary nephrons are deeply positioned in the
corticomedullary junction and are responsible for sending arterioles to the medulla. The
midcortical nephrons are located between these two nephrons.

6
Figure 3. The Nephron Tubules and Associated Blood Vessels
The nephron consists of two main parts: the glomerulus and the tubule. These can be seen in
Figure 3. The glomerulus is a capillary bed that filtrates blood to each of the tubules. As the
filtrate passes through the different sections of the tubule, the filtrate is transformed into urine.
The tubule is shaped in a downward loop. Urine will begin to form from individual nephrons and
will be collected by the calyces, which are the collecting tracts [3].
Within the nephron, the glomerulus works to filter approximately one-fifth of the water from
the blood it receives. The glomerulus does not allow cells or large molecules, such as proteins,
to enter the Bowman’s capsule. In normal healthy urine, no cells or proteins are detected. Testing

7
the urine of a patient can help determine whether their kidneys are filtering and regulating
effectively, or if there is a damage of the kidney present. On average, healthy kidneys filter 50
gallons every 24 hours. The average adult can hold a maximum of 12 gallons of water at a time
of which the kidneys filter through four times a day [5].
2.1.3 Kidney Modes of Failure
Symptoms and signs of kidney failure are often overlooked because a person can comfortably
survive with only 10% of kidney functions. Urine is the number one indicator of kidney failure.
On average, one will pass a minimum of one pint to a maximum of four to five pints daily [5].
As mentioned earlier, a sign of kidney failure is when large cells or proteins are present within
the urine. Kidney failure results in the increase of urine volume. A common indicator of kidney
failure is the frequent passing of urine at night. Cautionary signs to look for in problematic
kidneys would be foul smell or bloody urine. The most common pain related to kidney disease
is pain experienced during urination. The following are non-specific symptoms related to kidney
failure: increased tiredness, decreased physical performance, browner skin appearance, aches,
cramps, and larger course jerking movements of the limbs [5].
There are several examinations one can perform to investigate and test the functions of the
kidneys. First, simple blood and urine tests can be performed. This test requires paper strips to
be dipped into urine and a color will appear on the strip to be compared to the chart on the bottle
[5]. The presence of protein, blood, glucose and bile can be detected from such as a test. The
kidneys two most important waste products are urea and creatinine, and both of which can be
tested in the blood. These waste products contain nitrogen and are both important markers of
kidney functions [5]. The creatinine level can be tested by measuring the glomerular filtration
rate (GFR). The GFR levels for a patient with kidney failure is shown in Table 1.

8
Table 1. The Glomerular Filtration Rate Relation to Kidney Function
Table 1 shows the five stages of kidney functions and their relation to glomerular filtration
rate. The healthier the kidney is, the faster the glomerular filtration rate will be. For Stage 1 of
kidney functions, the GFR will be more than 90 mL/min/1.73m2. The GFR is normal or
increased, and there is a slight kidney damage during this stage. In Stage 2 of kidney functions,
the GFR reduces, and thus there is a mild decrease in kidney function. As the kidney functions
decrease, the GFR also decreases. By Stage 5 of kidney functions, the GFR is less than 15
mL/min/1.73m2 and the kidney is in an end-stage failure.
2.1.4 Rate of Failure of the Kidney
There are several common and almost 100 rare diseases, which may lead to the destruction
of the kidney functions. High blood pressure is most commonly associated with kidney failure.
Blood pressure takes into account the force of the heart contraction, the resistance of blood
vessels and the blood volume. An average blood pressure is 120/80. There is a direct correlation
between progressive kidney damage and steadily rising blood pressure. Elevated blood pressure
can lead to increased shear stress on the vessels, which perpetuates the cellular injury and
destruction of the organ. Another disease that can lead to kidney failure is diabetes. According
to Bakris, diabetes afflicts over 16 million Americans, and 5 million are not aware that they have
the disease [6]. By 2020, it is predicted that over 250 million people will have this disease
worldwide [6]. Diabetes is the most common cause of end-stage renal disease in all-ethnic

9
groups. There is a higher incidence of diabetes among minorities, specifically African
Americans, Hispanics, and Native Americans.
The NHANES (National Health and Nutrition Examination Survey) is a nationally
representative, cross-sectional survey that is currently conducted every two years by the National
Center for Health Statistics to examine disease prevalence and trends over time in
noninstitutionalized U.S. civilian residents [7]. This survey encompasses data from the years of
1999 to 2012. The Figures 4 through 7 show the prevalence of chronic kidney failure by age,
gender, ethnicity and diabetes. The Center for Disease Control (CDC) and Prevention distributed
the NHANES survey. As shown in Figure 4, the prevalence in people aged 70 years or older was
49.4% in 1999 to 2012 but only 6.44% in people aged 20 to 39 years.
Figure 4. CDC Chronic Kidney Disease Prevalence by Age
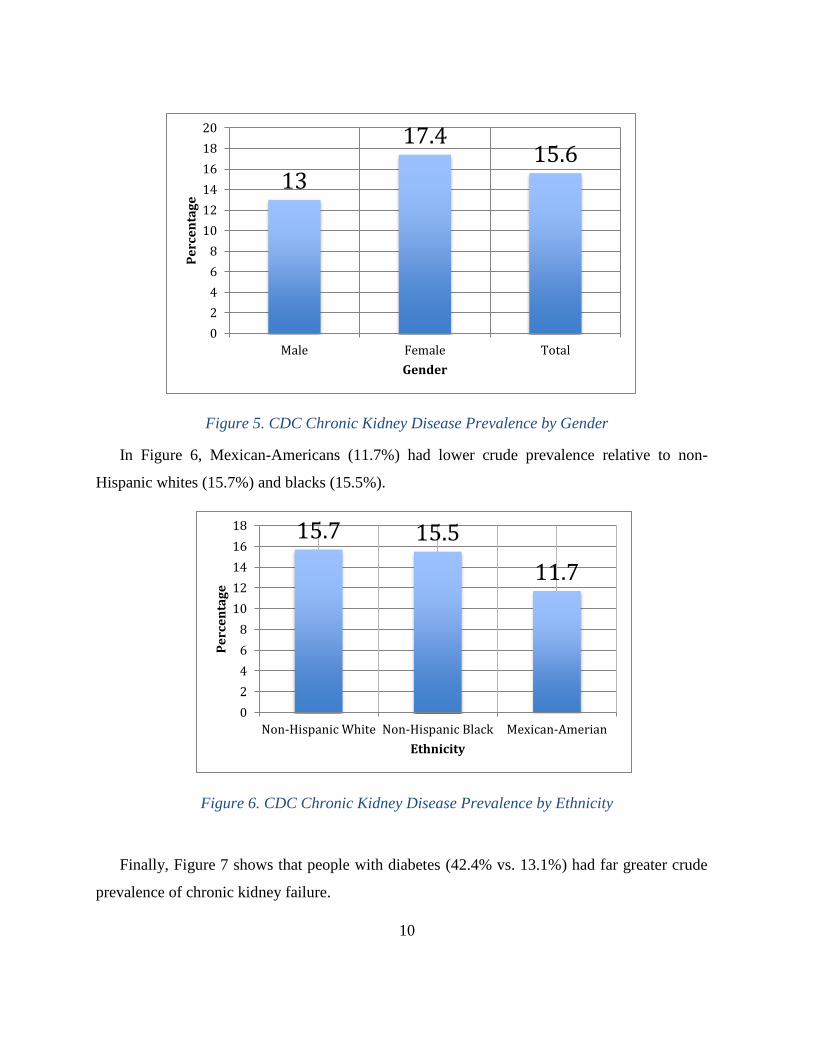
In Figure 5, females (17.4%) had higher crude prevalence of CKD than males (13.0%).
6.411
23.2
49.4
0
10
20
30
40
50
60
20-39 40-59 60-69 70+
Pe
rce
nta
ge
Age
10
Figure 5. CDC Chronic Kidney Disease Prevalence by Gender
In Figure 6, Mexican-Americans (11.7%) had lower crude prevalence relative to non-
Hispanic whites (15.7%) and blacks (15.5%).
Figure 6. CDC Chronic Kidney Disease Prevalence by Ethnicity
Finally, Figure 7 shows that people with diabetes (42.4% vs. 13.1%) had far greater crude
prevalence of chronic kidney failure.
13
17.415.6
0
2
4
6
8
10
12
14
16
18
20
Male Female Total
Pe
rce
nta
ge
Gender
15.7 15.5
11.7
0
2
4
6
8
10
12
14
16
18
Non-Hispanic White Non-Hispanic Black Mexican-Amerian
Pe
rce
nta
ge
Ethnicity

11
Figure 7. CDC Chronic Kidney Disease Prevalence by Diabetes
Diabetes affects the small blood vessels in the body. When the blood vessels within the
kidney are damaged, the kidneys cannot properly filter the blood. This will cause the body to
retain more water and salt. Diabetes also damages the nerves in the body and can damage the
nerves which sense the pressure of the bladder. This could damage the kidneys by backing up
the bladder. Patients with kidney failure must either have a kidney replacement or begins kidney
dialysis treatment.
2.2 Treatment Process for Kidney Disease
2.2.1 Evolution of Dialysis
In the early 1940’s, Dr. Willem Kolff developed the first dialyzer, also known as the artificial
kidney. This machine treated a handful of patients, but had little success. Kolff’s ideas were
brought to George Thorn, which led to the manufacturing of the stainless steel kidney. The first
kidney transplant wasn’t until 1954 [8]. Next was the creation of the Scribner Shunt by Dr.
Belding Scribner, which was a small u-shaped tool that pushed blood from the tube in the artery
to the tube in the vein. This device was made with Teflon material because it did not stick, and
thereby negated the chance of clotting. The shunt was the first attempt at improving access to the
circulatory system and increase the survival rate of end-stage renal disease (ESRD) patients. In
the 1960’s Scribner opened the world’s first outpatient dialysis facility. After the 1960’s, more
42.4
13.1 15.6
0
5
10
15
20
25
30
35
40
45
Yes No Total
Pe
rce
nta
ge
Diabetes

12
dialysis machines were developed to obtain more control of fluid removal and dialyzers were
designed to operate more efficiently [8]. Throughout the evolution of dialysis treatment and
machines, the lives of ESRD patients have improved immensely.
2.2.1 Hemodialysis Parameters
Hemodialysis is the most common form of dialysis treatment. Worldwide, approximately
85% of dialysis patients use hemodialysis as their form of treatment while the other 15% use
peritoneal dialysis. In the United States, 93% of dialysis patients use hemodialysis as their form
of treatment, while 7% use peritoneal dialysis [9]. Hemodialysis treatment was first introduced
in the 1960s in which it was the physician that prepared the equipment, initiated the treatment,
monitored the patient and terminated the treatment. In subsequent decades, there was a shift so
that most of the responsibilities in a hemodialysis clinic were taken care of by nurses instead of
physicians. Today, nurses carryout approximately 20% of the tasks and the other 80% of
responsibilities are performed by technical healthcare staff members [10]. Hemodialysis patients
are evaluated by an interdisciplinary team for their treatment parameters. This team consists of a
physician, dietician, social worker, healthcare technician, nurse and financial counselor. The
physician then takes into consideration all the opinions of the members of the team to produce a
final care plan for the patient. The nurse to technician ratio in the U.S. typically ranges from 1:1
to 1:5. Many facilities cannot afford to staff as many nurses as technicians (100% ratio) due to
constraints of the composite reimbursement rate [10].
Orders for ESRD patients on hemodialysis treatment are very details and include important
specifications such as hemodialyzer type, dialysis flowrate, frequency and duration of treatment,
and laboratory tests. These orders are typically for patients with acute and chronic renal failure
undergoing hemodialysis treatment. A full list of a dialysis patient’s plan can be found in
Appendix A as well as chronic and acute hemodialysis treatment order forms in Appendix B.
The patient must be reevaluated before every dialysis treatment and new orders are written as
necessary for their dialysis treatment plan. For patients with chronic renal failure, their orders
are reviewed and evaluated on a regular basis by the interdisciplinary team. This is not done prior
to every dialysis treatment like in acute hemodialysis [10]. One major parameter of the treatment
is the length of dialysis and it is specific to each patient. The length of treatment is determined

13
and prescribed based on urea kinetic modeling. In the United States, the length of dialysis
treatment is typically three to five hours, three times a week. However, the United States also
has the highest mortality rate associated with hemodialysis treatment. This is most likely due to
the delivery dose of treatment and the nutritional status of the patient. There is a direct relation
between the lower mortality rates and longer dialysis treatment time [10]. There are lower
mortality rates in other parts of the world in which patients’ dialysis treatment is longer and there
is a higher delivered Kt/V. The ratio Kt/V is a dimensionless quantity that determines the
efficiency of the dialysis dose, where K represents the flowrate of the blood through a dialyzer,
t is the treatment time and V represents the volume of water in the body (roughly 60% of body
mass). A value of 1.2 is the accepted value for clinicians and doctors.
Another parameter that is important is the patient’s dry weight. Dry weight is the weight of
the patient when he or she is normotensive and free of edema. This weight is adjusted depending
on when the patient gains or loses true body weight, which does not include weight associated
with the buildup of fluid from renal failure between dialysis treatments. End stage renal failure
patients do not gain muscle easily, and therefore, any gain in weight that is greater than 0.5 kg in
one day is due to the fluid buildup. Dieticians are an important part of the interdisciplinary team
in this aspect so they can help the patients control their weight and avoid exceeding a weight gain
of 3% of their body weight per day between treatments [10]. Laboratory testing is crucial in
evaluating the effectiveness of treatment. Based on these results, the interdisciplinary team can
make adjustments to the patient’s care plan. There are different tests that need to be taken at
different times of overall treatment of the patient. For example, every month electrolytes and
blood urea nitrogen levels need to be tested, every six months iron and ferritin levels need to be
tested, and every year platelet counts and growth hormone levels need to be tested. A table of
all the tests and when they are performed is shown in Appendix C.
Monitoring is a largely important component of the overall hemodialysis treatment.
Treatment involves removing blood from the body, filtering and then returning it to the body.
There are many biological values that have to be observed to avoid injury to the patient. Figure
8 shows the dialyzer and dialysis machine typically found in dialysis clinics. Staff in the dialysis
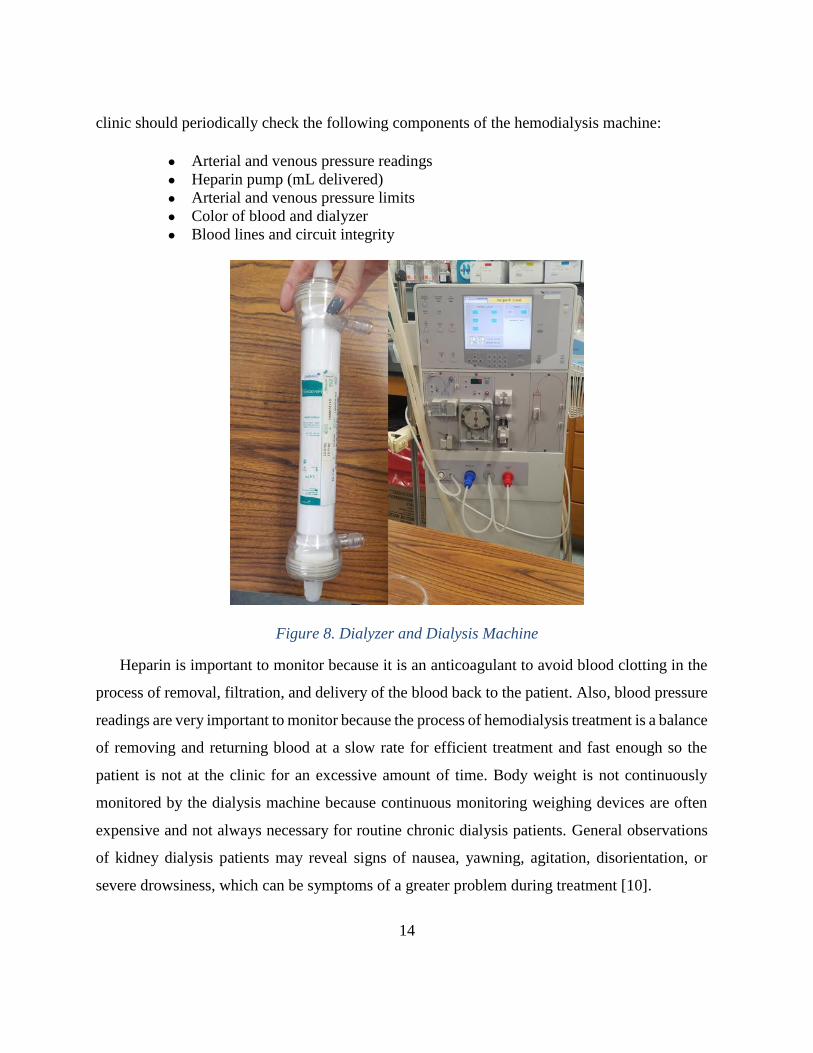
14
clinic should periodically check the following components of the hemodialysis machine:
● Arterial and venous pressure readings
● Heparin pump (mL delivered)
● Arterial and venous pressure limits
● Color of blood and dialyzer
● Blood lines and circuit integrity
Figure 8. Dialyzer and Dialysis Machine
Heparin is important to monitor because it is an anticoagulant to avoid blood clotting in the
process of removal, filtration, and delivery of the blood back to the patient. Also, blood pressure
readings are very important to monitor because the process of hemodialysis treatment is a balance
of removing and returning blood at a slow rate for efficient treatment and fast enough so the
patient is not at the clinic for an excessive amount of time. Body weight is not continuously
monitored by the dialysis machine because continuous monitoring weighing devices are often
expensive and not always necessary for routine chronic dialysis patients. General observations
of kidney dialysis patients may reveal signs of nausea, yawning, agitation, disorientation, or
severe drowsiness, which can be symptoms of a greater problem during treatment [10].

15
Mortality due to hemodialysis treatments could be due to a number of factors, including
duration of treatment, age, dose of dialysis (Kt/V), Urea Reduction Ration and nutrition. A
patient should achieve a total of 3.6 per week, which translates to 1.2 per treatment if the patient
has three visits per week [11]. The United States has the highest mortality rate at over 20% of
dialysis patients per year. Some major different strategies the United States uses for dialysis
treatment compared to other countries are patient selection, dialysis techniques, and the
reimbursement policies. In the United States, Federal regulations provide reimbursement per
treatment rather than per hour so dialysis administrators are influenced by these regulations.
Patients often request shorter treatments for convenience, which can be detrimental to their
overall health. However, individuals on dialysis treatment have maintained the standard
treatment of three times per week for over 25 years. Factors including patient selection and
clinical variables also known to contribute to this high mortality rate in the United States [12].
2.2.3 Hemodialysis Treatment Process
Dialysis treatment is a long and careful process of connecting needles and monitoring
pressures as blood is removed from the patient, filtered of the excess fluid, and then returned to
the patient. It is important that the clinician or the nurse keeps themselves and the area clean
because of the risk of infection. The needles and lines are situated cautiously to ensure safety to
the patient and maintain a treatment free of errors. Vital signs are checked and charted before the
lines and needles are placed and secured. The machine alarms, power systems and calibrations
are also checked. The heparin pump and other flowrate sensors are checked. A block diagram of
these steps is shown in Appendix D. A diagram of all the connections from the hemodialysis
machine to the patient as well as the direction of blood flow is shown in Figure 9.

16
Figure 9. Hemodialysis Process during Treatment
Once the treatment process begins, blood leaves the patient’s body through a needle at
the access point of the fistula, graft or catheter in the arm. The blood is pumped through the
machine where heparin is added to avoid clotting (coagulation) [12]. In the dialyzer, which is a
filter in the machine, removes excess fluid from the blood and the clean blood is then returned
to the patient’s body. This is done by a dialysis fluid called dialysate. Dialysate contains water,
electrolytes, and salts which works to remove toxins and excess fluid from the blood. The
dialyzer is the only component that filters the blood. The dialysis machine simply works as a
pump and controls the whole process by tracking blood flowrate and blood pressure of the
patient. This process takes approximately three to five hours but varies from patient to patient
[13].
After the three to five hours that is prescribed to each patient specifically, the termination of
treatment process begins. This starts with the preparation and sterilization of the area. The
monitor gauges are then set to wider ranges and the blood pump is stopped. The arterial needle

17
and line are clamped and after it is verified that the negative pressure is off and there are no
bubbles in the line, the arterial needle is then removed. The blood pump is turned on and the
arterial line is unclamped so air can clear the line up to the junction with the saline infusion line.
The arterial line is re-clamped and the saline line is unclamped and the line is reinfused with the
prescribed saline and/or air. The block diagram of these steps is shown in Appendix D. These
steps are consistent with hemodialysis treatment plans.
2.2.4 Peritoneal Dialysis Treatment
Peritoneal dialysis is another treatment option for individuals with end stage renal failure.
This form of dialysis treatment is much less common than hemodialysis due to the large amount
of responsibility put on the patient for effective treatment. It utilizes the peritoneum for dialysis.
The peritoneum is a membrane that lines the inner surface of the pelvic and abdominal walls and
covers the visceral organs. The peritoneum normally has typically less than 100 mL of fluid in it
and is nearly collapsed but the space can be filled with two or more liters of fluid without causing
discomfort. The peritoneum serves as a smooth surface of contact between the abdominal wall
and the intra-abdominal organs. Fluid in the body is filtered constantly into this peritoneal cavity
from capillaries and is then absorbed. This usually happens at approximately one liter per day.
The process of peritoneal dialysis is visually represented in Figure 10.
Figure 10. Process of Peritoneal Dialysis

18
The peritoneum functions well for dialysis treatment because a peritoneal dialysis solution,
called dialysate, can be injected into the intraperitoneal space. This solution is then kept in this
space for a specified amount of time and then the peritoneal dialysis machine drains it out, and
new dialysate is injected into the peritoneum [14]. This does not affect the lubricating function
of the peritoneum but can affect the immune system and the absorptive functions [15].
All that is necessary to convert the lubricating function of the peritoneum to an excretory
function is a device for access and a salt solution. The access device is a peritoneal catheter and
the salt solution must be sterile and balanced. The flowrate is dependent on viscosity of the
dialysate, pressure gradients, and hydraulic resistance of the pathway. Often the flowrate is
higher for outflow than it is for inflow depending on the catheter used. There are many
complications associated with the catheters as well. There can be inflow pain, intraperitoneal
bleeding, pericatheter leak, outflow failure, infection, and pericatheter hernias [15].
Continuous peritoneal dialysis works with the use of two catheters. One is in the upper
abdomen for continuous fluid infusion. The other catheter is placed in the lower pelvis for
drainage of the fluid. Intermittent peritoneal dialysis only uses one catheter in the lowest part of
the abdominal cavity. It is also more preferred than the other treatment methods because of the
decreased opportunity for leakage and infection [15]. There are two forms of peritoneal dialysis
in regards to the time the process is done. Continuous ambulatory peritoneal dialysis (CAPD),
shown in Figure 11, is done without a machine in which the dialysate is injected into the abdomen
and gravity drains the fluid from the patient [16]. This process of infusing dialysate into the
peritoneum, letting it sit there, and then draining it must be repeated three to four times daily.
Continuous cycling peritoneal dialysis (CCPD), shown in Figure 12, is done typically while the
patient sleeps and a machine is used to automatically fill the peritoneum with dialysate, allows it
to dwell, and then subsequently drains it. The machine performs this process three to five times
as the patient is connected to the machine for ten to twelve hours [17].

19
Figure 11. Continuous Ambulatory Peritoneal Dialysis (CAPD)
Figure 12. Continuous Cycling Peritoneal Dialysis (CCPD)
Benefits of peritoneal dialysis include needle free treatments, flexible scheduling, at home
treatment, fewer dietary restrictions, more continuous therapy comparable to natural kidneys,
and overall fewer side effects such as nausea and weight gain which are associated with
hemodialysis treatment [14]. Complications include an inability to achieve the target clearance
during peritoneal dialysis and patient errors. Since peritoneal dialysis is not performed in a

20
clinical setting, patients and their families must be well educated on the treatment process and
must be diligent with scheduling dialysis treatment into their daily life [12]. Also, peritoneal
dialysis requires the patient to have a permanent catheter outside the body unlike hemodialysis
treatment, which can have a catheter inside the body that is accessed with needles. Patients using
the peritoneal dialysis route for end stage renal failure treatment must also be very careful in
keeping their environment sterilized to avoid the possible exposure to infection [14].
2.2.5 Patient Care in Dialysis Clinics
According to the American College of Emergency Physicians (ACEP), the America’s
Emergency Care Environment 2014 Report Card stated that the United States as a whole received
a D+ grade average. The grading was based on access to emergency care, quality/patient safety,
medical liability, public health/injury prevention, and disaster preparedness. Since 2009, the
grades have worsened in each category, shown in Figure 13. The categories graded are Access
to Emergency Care, Disaster Preparedness, Quality and Patient Safety Environment, Public
Health and Injury Prevention, and Medical Liability Environment.
Figure 13. Comparison of Grades Received by States in 2009 and 2014

21
Massachusetts was one of the four few States to receive a B grade overall. Compared to the
other States in the Nation, Massachusetts was ranked first in Public Health and Injury Prevention,
fifth in Quality and Patient Safety Environment, and second overall. Figure 14 shows the
individual State’s grades on the Nation’s map [18].
Figure 14. Overall State Grades for Emergency Medicine
America’s Emergency Care Environment experienced its first F overall in Wyoming, along
with most States falling below the average and receiving D grades overall. ACEP noted that if
improvements are not made, then grades will continue to decline. Worsening conditions affect
all aspects of emergency care including dialysis patients. Dialysis patients need constant care,
especially in an emergency situation, and if they cannot be taken care of properly, then they are
at risk of death. The greater the healthcare system can be improved, the better the quality of life
of a dialysis patient can be guaranteed.

22
The physician, also known as a nephrologist, is the head of the team, who assesses the
patient’s well-being and when it is appropriate to start hemodialysis treatment. They are
responsible for determining the treatment time, flowrate, which dialyzer to use, and how
frequently the patient should be receiving treatment [10]. Under the physician is a nurse who
ensures that the patient is being taken care of properly. Usually one nurse will be assigned to a
patient and their family to prevent inconsistencies in caretaking. They will perform assessments
of the patient and be there to answer any questions or concerns. Alongside the nurse are
technicians and biomedical engineering staff, who are tasked with maintaining the equipment as
well as the assembly of the equipment. Under nurse supervision, technicians will also take care
of the patient needs [10]. A renal dietitian is assigned to the patient who helps to devise a special
diet that wouldn’t alter nor restrict the treatment process. Being on a diet would be beneficial in
improving the dialysis treatment, reducing the risk of complications, and improving the patient's
quality of life [10]. Keeping track of the patient’s nutritional habits allows for alteration in their
treatment procedures and thereby gain a more successful outcome. Finally, a social worker is
assigned to the patient’s team to keep them well informed about hemodialysis treatment,
potential side effects, and action health plans if a problem is to occur. Since the patient’s life is
completely consumed by this kidney disease and the timeliness of the treatment, there is a chance
of developing depression or other psychosocial challenges, which may affect their quality of life.
This is where the social worker can initiate an intervention to help the patient works through their
challenges so as to increase the quality of life [10].
2.2.6 International Studies on Hemodialysis
According to the European Renal Care Providers Association report published in 2016, the
United States, Japan, and the European Union account for 45% of all dialysis patients [19]. In
2013, 3.2 million people worldwide were being treated for end stage renal disease, which
accounts for patients treated through dialysis and kidney transplants. In the European Union, on
average there are 1,090 patients with ESRD per million inhabitants. Figure 15 presents an
international breakdown of kidney dialysis patients in the United States, the European Union,
and Japan.

23
Figure 15. International Dialysis Breakdown
The specific countries with the highest prevalence of ESRD are Portugal, Germany, Cyprus, Italy
and Spain. Hemodialysis is the most common form of treatment with approximately 312,000
ESRD patients in the European Union using this form of treatment in 2013. The Renal
Association is a group in the United Kingdom of renal physicians and scientists whose members
have set up a list of guidelines and regulations regarding hemodialysis treatment in the United
Kingdom [20]. The regulations recommend that hemodialysis patients receive treatment at least
three times per week. This is because the most powerful determinant of solute removal in the
blood is frequency and not duration, and that two times weekly dialysis treatments are no longer
considered adequate. Two times per weekly dialysis treatments are an option for patients who
live a far from the dialysis clinic. Patients receiving three hemodialysis treatments a week should
have a consistent urea reduction ratio greater than 65% or an equilibrated Kt/V value of greater
than 1.2. The Kt/V value is calculated from urea values of pre- and post- dialysis treatment as
well as the duration of treatment and the weight loss during the treatment. In this equation, the
K stands for the clearance of blood from the body. This value is between 300-500 mL for an
adult. The t stands for the time of the dialysis treatment, and the V stands for the volume of
water in the body. This value is normally 60% of a patient’s total weight [11]. It is also
recommended that adult patients with minimal residual renal function should have a
hemodialysis treatment of no less than four hours unless there is careful consideration by the
clinician. In 1981, the National Cooperative Dialysis study was published and showed that
19%
13%
13%
55%
United States
EU
Japan
Other

24
patients with a longer dialysis treatment (4.5-5 hours per visit) had better outcomes of their
treatment than patients who received shorter dialysis treatments (2.5-3.5 hours per visit). The
reason for average duration of dialysis sessions worldwide being shorter is because of patient
tolerance, higher efficiency of hemodialysis treatment, economic constraints, and patient
preference [21].
In Japan, the amount of patients diagnosed with chronic dialysis increases each year. The
Japanese “golden target” is quality over quantity when referring to kidney dialysis treatment
process. They want to extend the survival rate and better improve the quality of life of the patient.
Common complaints by patients are discomfort and irritability, which can directly affect their
quality of life. Patient-oriented dialysis treatment is a concept that the Japanese use to ensure
good dialysis treatment outcomes. This therapeutic treatment includes monitoring body mass,
emotions towards dialysis treatment, as well as a synopsis of their daily routines. This
information is collected through the malnutrition inflammation score (MIS). Concerns that
accumulate on either or both tests are then analyzed to adjust the dialysis treatment and increase
the chances of achieving better quality dialysis [22].
The Dialysis Outcomes and Practice Patterns Study (DOPPS) is used to quantify associations
between practice pattern and patient outcomes. According to the DOPPS reported that was
published in 2003, the United States had one of the highest percentages in dialysis patient deaths
compared to other countries [23]. Although hard to confirm, Foley and Hakim stated that
variability in demographic and comorbid conditions at dialysis inception explained only part of
the variances in mortality between countries. Mortality percentages for the year of 2003 in the
U.S., Europe, and Japan are presented in Figure 16.

25
Figure 16. Mortality Rate of Dialysis Patients
Japan has the longest treatment time, approximately 20 minutes greater than the U.S. The DOPPS
recorded that less than 1% of patients in Japan miss a dialysis session in a month, while in the
U.S. about 8% of sessions are missed by patients. Both the shortened time and missed treatment
days may contribute to the increased mortality rate in the U.S. compared to other countries [23].
A requirement in Japan is that a physician must be present at each dialysis clinic while patients
are undergoing hemodialysis treatment. Whereas in the U.S., a physician only has to check in
with their patients once within a three month period, either at the clinic or office. It is still under
hypothesis whether staffing (size and skilled levels) and physician presence affects the value of
dialysis treatment and mortality rate of patients [23, 25]. Japanese reimbursement policy prefers
treatment time of more than four hours per visit for most patients due to the correlation of certain
treatment times and survival rate. Patients had better survival rates and less hospitalizations when
treated three times per week at four to eight hour intervals [24]. Table 2 shows treatment times
(TT) and ultrafiltration rates (UFR) for Japan, Europe, and the United States.

26
Table 2. Average Treatment Time (TT) and Ultrafiltration Rate (UFR) by Region
DOPPS I DOPPS II
Region n Mean n Mean
TT (min)
Europe 2590 232 ± 41 2856 235 ± 38
Japan 2169 244 ± 32 1805 240 ± 33
U.S. 3856 211 ± 32 2260 221 ± 33
UFR (ML/h/kg)
Europe 2590 8.3 ± 3.6 2856 8.4 ± 3.5
Japan 2169 8.2 ± 3.5 1805 9.9 ± 3.6
U.S. 3856 9.2 ± 3.9 2260 9.8 ± 3.7
Another parameter that is significant in high quality dialysis is the cleanliness of the dialysate
water. Japan follows strict standards for their dialysate, which does not allow endotoxin (ET)
levels to exceed 0.05 EU/mL. In the U.S., the Advancement of Medical Instrumentation (AAMI)
suggests that there should be an action level (1.00 EU/mL) and limit level (2 EU/mL) for ET
levels. More than 18% of the U.S. providers follow such guidelines. Based on the findings from
the Japanese Society of Dialysis Therapy in 2007, about 94% of their dialysis clinics maintained
their ET levels at or below 0.05 EU/mL. Therefore, it has been suggested that the excellent water
quality might have partly contributed to the better hemodialysis patient survival in Japan than in
the United States [25].
Improving practice patterns such as lengthened treatment time, dialysate ET levels, and
increased physician presence in the dialysis patient’s life could be a possible solution in reducing
the mortality rate in the U.S. and better improve the quality of the dialysis treatment to ensure
greater patient outcomes [25].
27
2.3 Vital Sign Monitoring in Hemodialysis
Throughout the process of hemodialysis treatment, it is necessary to monitor various vital
signs, both for safety and efficiency purposes. Many vital signs can determine the safety of the
treatment, thereby ensuring patient safety as their blood is being filtered externally. Additionally,
a measurement such as weight can also determine when the dialysis treatment is completed,
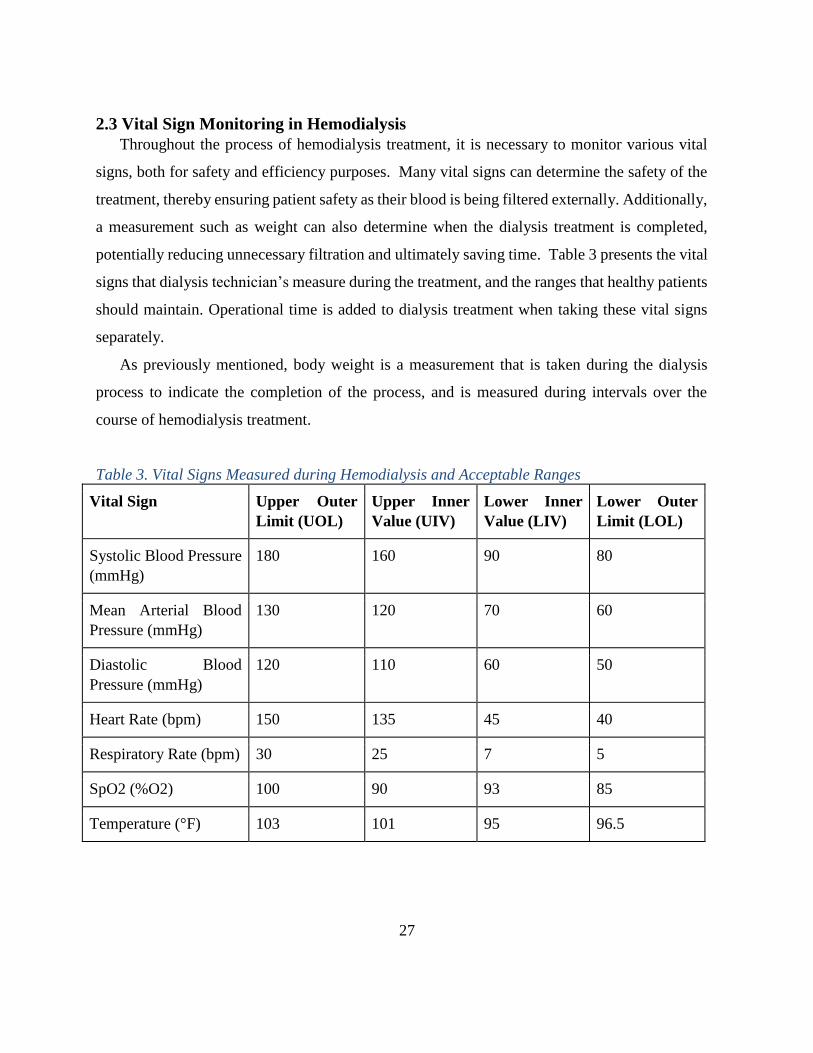
potentially reducing unnecessary filtration and ultimately saving time. Table 3 presents the vital
signs that dialysis technician’s measure during the treatment, and the ranges that healthy patients
should maintain. Operational time is added to dialysis treatment when taking these vital signs
separately.
As previously mentioned, body weight is a measurement that is taken during the dialysis
process to indicate the completion of the process, and is measured during intervals over the
course of hemodialysis treatment.
Table 3. Vital Signs Measured during Hemodialysis and Acceptable Ranges
Vital Sign Upper Outer
Limit (UOL)
Upper Inner
Value (UIV)
Lower Inner
Value (LIV)
Lower Outer
Limit (LOL)
Systolic Blood Pressure
(mmHg)
180 160 90 80
Mean Arterial Blood
Pressure (mmHg)
130 120 70 60
Diastolic Blood
Pressure (mmHg)
120 110 60 50
Heart Rate (bpm) 150 135 45 40
Respiratory Rate (bpm) 30 25 7 5
SpO2 (%O2) 100 90 93 85
Temperature (°F) 103 101 95 96.5

28
The above table represents the vital signs that dialysis technicians and physicians record
throughout the dialysis treatment. Currently, these vital signs are taken separately and in an
isolated manner. Because of this, it is difficult to determine trends in the overall health of the
patient, and requires multiple different records to keep the health information organized. The
values in the table represent the vital sign measurements that are referenced in a standard dialysis
treatment. Although each kidney dialysis patient is different, and vital signs are volatile within
hemodialysis patients, these values represent the acceptable limits of a patient undergoing
dialysis treatment.
2.3.1 Blood Pressure
Throughout the process of hemodialysis, blood pressure is one of the most important vital
signs for measurement, as it serves as a safety indicator regarding the flow rate of blood to be
filtered. Blood pressure determines the fluid concentration within the body, as a high
concentration of excess fluid results in an increased blood pressure, due to increased pressure
exerted by this fluid on the blood vessels [26]. This increase in blood pressure is detrimental to
patients, as dialysis patients often suffer with hypertension [26]. Abnormally high blood pressure
results in hypertension, which can lead to heart disease if untreated. Once this excess fluid is
removed, blood pressure decreases. However, the dialysis technician must be aware of the
flowrate, as removing blood too quickly will result in blood pressure drop to an unsafe level [27].
This flowrate is set according to the physiological capabilities of each patient and their respective
fistula/catheter. Potential technical errors that may cause the flowrate to be outside of the
recommended range would result in blood pressure fluctuations.

29
Figure 17. Blood Pressure Cuff
Blood pressure cuffs similar to the one depicted above in Figure 17 allow for clinicians to
monitor the blood pressure of the patients undergoing hemodialysis treatment [28]. Additionally,
there are electronic monitors that can record the blood pressure in a similar yet automated
manner.
2.3.2 Heart Rate
Heart rate is another vital sign that must be measured during the dialysis process, and is tied
closely to blood pressure measurements. As blood pressure changes within the body, the heart
rate will also adjust. As previously mentioned, if blood is removed too quickly from the body,
blood pressure will drop, potentially to unsafe levels. When this occurs, tachycardia can be
noticed by monitoring the heart rate of the patient [29]. Additionally, by measuring both the
blood pressure and heart rate, one can determine if there are any external problems with the heart
during the dialysis treatment. Abnormal heart rates can demonstrate other health problems
within the patient, which are very important to monitor during the dialysis treatment process.
Heart rate can be measured using a stethoscope or an ECG machine. Figures 18 and 19 show the
way heart rate is monitored using ECG electrodes [30, 31].

30
Figure 18. ECG Electrode Placement
Figure 19. ECG Equipment
Placement of ECG electrodes can be used within a dialysis clinic to monitor a patient’s heart
rate while undergoing hemodialysis treatment. The ECG measures the electrical activity of the
heartbeat, producing a PQRS waveform. P represents the upper chambers of the heart and the
QRS complex represents the heart’s bottom chambers. This waveform allows for a clinician to

31
visually see the timing of the waveform so as to better understand the functionality of the
patient’s heart [32].
2.3.3 Body Temperature
Many dialysis patients have a body temperature below the normal average of 37°C, which
must be confirmed before the beginning of the dialysis treatment. Kidney failure results in an
altered homeostasis. Therefore, it is necessary to determine the normal body temperatures for
different patients and monitor the temperature throughout the treatment process [27]. If this
value is different from the normal value, dialysis treatment could be less efficient or unsafe to
perform. Additionally, the body temperature is important in terms of setting the temperature of
the dialysate solutions. One must regulate the temperature of the dialysate solutions, as a
temperature equal to or greater than the body temperature can lead to an increased overall body
temperature. This can lead to cardiovascular issues for the patient, which can then lead to
hypotension [33].
Figure 20. Digital Infrared Forehead Thermometer
A thermometer is considered a “gold standard” for measuring temperature [34]. One type of
thermometer is an infrared medical forehead and ear thermometer depicted in Figure 20. Body
temperature is important regarding the temperature of the dialysate.

32
2.3.4 SpO2 and Hematocrit
Blood oxygen concentration is another essential vital sign to measure, as hemodialysis
treatment is a process that utilizes a great deal of oxygen from the body. During hemodialysis
treatment, blood oxygen levels can drop anywhere between 5% and 23%, and can often go
unnoticed in the patient [35]. This is due to the fact that the body is utilizing this oxygen
throughout the dialysis treatment process, due to the fact that the body is performing work. When
oxygen levels become too low, conditions such as Tissue Hypoxia occur, where lactic acid is
released from tissues due to the lack of oxygen [35]. This can lead to or worsen chronic acidosis
within a kidney dialysis patient. Tissue hypoxia can also lead to reduced blood pressure, as the
chemical adenosine is released from the tissues, which in turn blocks the production of the
chemical norepinephrine [35]. This causes blood vessels to dilate, and thereby decreases the
blood pressure in the kidney dialysis patient. Measurements of blood oxygen can be done in a
multitude of ways, specifically through pulse oximetry measurements (percentage of oxygen
saturation in the body) or hematocrit measurements (percentage of hemoglobin in the blood)
[36]. Hematocrit concentrations are important because they also demonstrate the ratio of red
blood cells to total blood volume in the body, which also accounts for excess fluid in the blood
stream as well as oxygen concentration.
2.4 Electrical Components for Heart Rate and Body Temperature
2.4.1 Infrared Sensor
Light Emitting Diodes (LEDs) and photodiodes are two electrical components that are
typically used together in a variety of applications that require some light source and detection.
LEDs are semiconductors that only allow current to flow in one direction by bringing two slightly
different materials together to form a positive-negative (PN) junction [37]. Common types of
materials used for LEDs are gallium arsenide, gallium phosphide, or gallium arsenide phosphide
[35]. This junction is important because the positive side contains “holes” where there is an
absence of electrons and the negative side contains excess electrons. When voltage is applied in
the correct direction above a certain threshold for the diode, the diode turns on and electrons flow
in the negative side closer to the junction and holes move in the positive side toward the junction.
At the junction of the two materials, electrons combine with the holes to releases energy in the

33
form of light, and hence the diode emits light [38]. A diagram of the PN junction and the electron
movement is shown in Figure 21.
Figure 21. LED PN Junction and Photon Generation
Photodiodes are diodes that convert the light they sense into current by the flow of electrons. They
work in reverse bias so when they are not detecting light, the current generated is small and when
they are detecting light, the current generated is larger [39]. Instead of emitting light, they detect
it and receive it as an input. They also have a PN junction and photodiodes which are designed to
collect and focus light close to the junction [40]. When the photodiode detects light, it reverses
current flows through the photodiode. When photons hit the photodiode, electron-hole pairs are
created and the lower the photon energy is, the more photon absorption there is [41]. When it
occurs at the depletion region, the pairs are separated and move away from the junction. Electrons
move back to the N-type side and a current is formed [42].
When the photodiode and LED are placed next to each other in a circuit, the photodiode will
directly measure what the LED is outputting. However, the LED emits the light up so the only way
for the photodiode to detect it is if the photons reflect off of a material. When blood volume
increases in the finger with heart rate, more photons from the LED are reflected and the current
increases due to the photodiode detecting the photons. When blood volume decreases, the photons
escape through the finger and fewer reflect back, thereby resulting in a smaller current generated.
34
2.4.2 Negative Temperature Coefficient Thermistor
A Negative Temperature Coefficient (NTC) thermistor is made up of mixtures of ceramic
materials, which can include Mn, Ni, Co, and Fe-oxides. Such thermistor is considered a variable
resistor for which the resistance changes with the change in temperature. These specific
thermistors are typically chosen to be used for control, measurement, and compensation of
temperature due to its precise and accurate nature [43].
The NTC uses either a bridge or voltage divider configuration. The voltage divider equation
can be used to compute the value for the thermistor resistance.
𝑣𝑜𝑢𝑡 = 𝑣𝑖𝑛 (𝑅2
𝑅1+ 𝑅2) (1)
The parameter vout is the voltage between the known resistor (R1) and the thermal resistance (R2).
The parameter vin is the supplied voltage to the circuit. Such equation can be reconfigured to solve
for the resistor R2 [44]. Another equation known as the Steinhart-Hart equation converts the
resistance R2 that is calculated from equation (1) to a temperature reading in Kelvins (K) as
1
𝑇= 𝐴 + 𝐵𝑙𝑛(𝑅2) + 𝐶𝑙𝑛(𝑅2)3 (2)
The variable T represents the temperature and R2 is the resistance at such value of the temperature
T. The letters A, B, and C are the Steinhart-Hart coefficients. The values of these coefficients are
dependent on the type of NTC thermistor used within the circuit [44].
2.4.3 Arduino Board
The Arduino Uno is a microcontroller board based on the ATmega328P. The board can be
powered by connecting it to a USB cable, an AC-DC battery, or adaptor. There are 14 digital pins,
all having either input or output pins. The voltages of digital pins are 5V and they can deliver a
current maximum of 40mA. There are six analog inputs. The voltage measurement range is from
ground to 5V and analog-to-digital convert is 10 bits. The resolution this provides is 1024 different
values. The smallest detectable voltage difference is from ground to 5V.
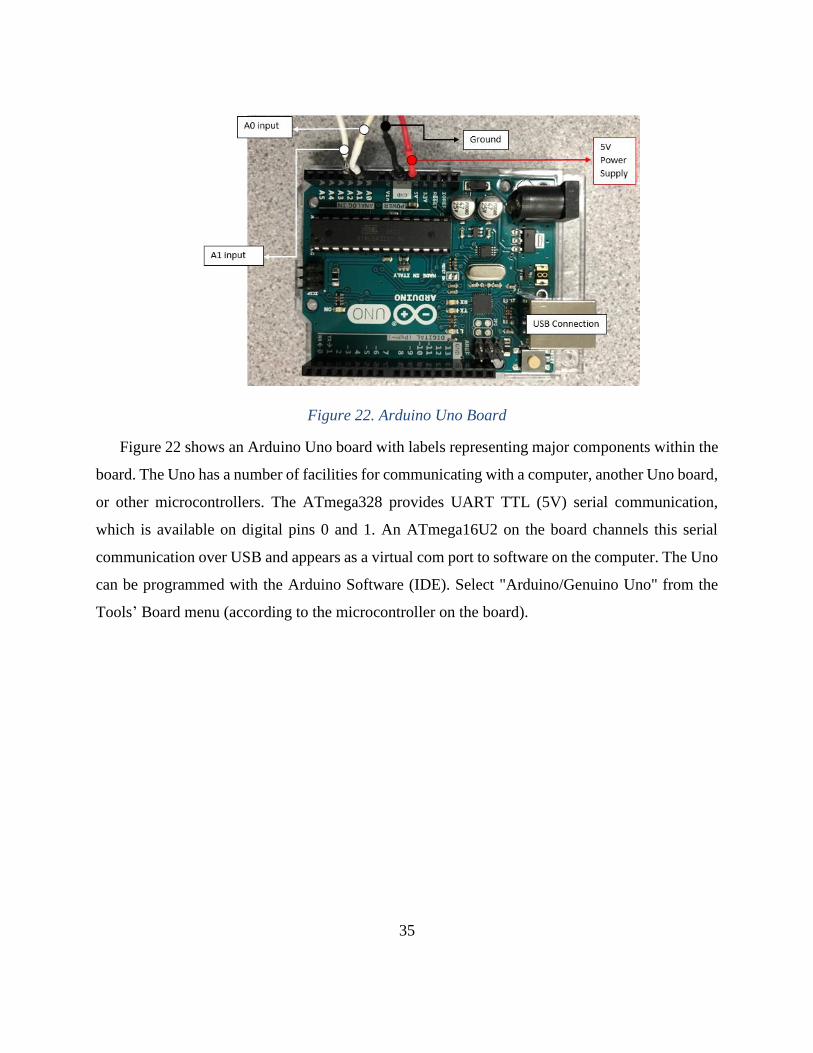
35
Figure 22. Arduino Uno Board
Figure 22 shows an Arduino Uno board with labels representing major components within the
board. The Uno has a number of facilities for communicating with a computer, another Uno board,
or other microcontrollers. The ATmega328 provides UART TTL (5V) serial communication,
which is available on digital pins 0 and 1. An ATmega16U2 on the board channels this serial
communication over USB and appears as a virtual com port to software on the computer. The Uno
can be programmed with the Arduino Software (IDE). Select "Arduino/Genuino Uno" from the
Tools’ Board menu (according to the microcontroller on the board).

36
Chapter 3: Project Strategy
3. Introduction
After background research on the kidney, the process of hemodialysis treatment, and the vital
sign measurements were evaluated by the team to identify ways to improve kidney hemodialysis
treatment through vital sign monitoring. To do this, the initial client statement had to be revised
based on the background research done. Once this was done, the project objectives, constraints,
functions, and specifications were defined. The project has to follow standards for design
requirements as well. Finally, a management approach was developed for the continuation of the
project throughout the year to develop various designs before a final design was chosen. The
testing criteria and evaluation were defined to validate the final design. All of these sections in
this Chapter described the design process of the VitalRing device.
3.1 Initial and Revised Client Statement
The client is searching for the design of an independent instrument to facilitate the process
of kidney dialysis, mainly through the display of vital signs and other bodily information in a
point-of-care environment. With this information, administrators of kidney dialysis treatment
can more quickly determine the completion of treatment and expedite the often-lengthy process.
The scope of the project changed substantially over the course of the academic year. The original
goal for the group was to develop a medical device to monitor vital signs, with the goal of
reducing treatment delays in kidney dialysis as well as shorten the length of treatment through
this measurement. After conducting considerable research into client needs and background
information, the new client statement is to create a medical device to monitor vital signs, in order
to better the quality of life for a patient undergoing hemodialysis treatment, as well as improving
the efficiency of the dialysis treatment process. The client statement was revised after consulting
with the advisor and from feedback received in the BME 4300 MQP Capstone course.

37
The client - in an effort to increase the quality of life for a patient suffering from kidney
disease, requests the continuous monitoring of various vital signs during the entire dialysis
treatment. By doing so, the dialysis treatment will be safer and treatment time will be optimized.
3.2 Design Requirements for the Deliverable
3.2.1 Design Objectives
Based on the client statement, the team has developed three design objectives for the project.
Each objective is ranked in order of importance to determine how each objective affects the
project outcomes. The rankings are calculated using a Pairwise comparison chart that is shown
in Table 4.
Table 4. Pairwise Comparison Chart of Design Objectives
Objectives Safe Accurate Reproducible Total
Safe X 1.0 1.0 2.0
Accurate 1.0 X 0.5 1.5
Reproducible 0.5 0.5 X 1.0
The pairwise comparison chart prioritize the design objectives using a rating system of 0.5,
and 1, where 0.5 rates the need of the design objective as somewhat important, and 1 ranks it as
very important. Based on the chart above, the primary design objective is for the device, also
known as the VitalRing, to be safe. Additionally, the device needs to be lightweight and
noninvasive to ensure a more comfortable treatment process. The VitalRing device will improve
the quality of the patient’s life by enabling the patients to sustain shorter kidney dialysis
treatments and allowing them to possess some normalcy in their lives.
The secondary design objectives are accuracy and reproducibility. The VitalRing needs to be
user-friendly and easy to work with. The VitalRing needs to be adaptable for a clinical
environment, which includes having the device be cost-effective and having an adjustable visual
display due to the minimal amount of space provided in each clinic. All of these functions are
directly affected by the accuracy and reproducibility of the VitalRing.

38
3.2.2 Constraints of the VitalRing Device
A list of parameters were created to confine the design of the VitalRing. First and foremost,
safety is important for both the patient and the clinician since they will both be in contact with
the device. Hence, the VitalRing cannot pose any harm to either user. Although the device is
non-invasive, there are electrical components of the device to consider for which proper
biocompatible material will be used to secure the device. The materials will also be used to
measure vital signs reliably and quickly. Another constraint is the complexity of the VitalRing
device. It is critical that the device is user-friendly such that it would not cause complications
during treatment. There are several standards and regulations (such as FDA, ISO, and IEEE) that
must be met. The time frame of this project is eight months. The team needs to create, test, and
validate a design within the project scope. Finally, the team will aim to create a product that is
both inexpensive yet reliable and feasible in a dialysis clinic.
3.2.3 Functions of the VitalRing Device
The primary function of the VitalRing device is that it needs to be minimally invasive.
Hemodialysis treatment is already invasive due to the needle insertion of the fistula, and in order
to improve the quality of dialysis, the device needs to be as comfortable as possible for the
patient. Another function of the device is that it needs to be sterilized to prevent further infections
at the incision site, in the patient blood flow, or in the kidneys. Finally, the VitalRing device
needs to function in a clinical environment. The device needs to be portable and compact.
3.2.4 Physiological and Engineering Specifications
There are several essential vital signs that need to be measured before, during, and after the
kidney dialysis treatment. Many signs are measured at different intervals, while only a few of
them are measured continuously. Currently, dialysis clinics are monitoring and charting the
following vital signs: blood pressure, heart rate, weight, and body temperature. These are
checked every hour of treatment but not continuously. During this process, normal heart rate (60
to 70 beats per minute) and blood pressure (120/80) must be maintained. Any extreme values
indicate that the blood flowrate of the dialyzer is pumping the blood too fast. Body temperature
is taken to ensure that the patient doesn't have a fever, which could indicate the presence of an
infection and alteration of the rate of blood filtration. Finally, weight is one of the gold standards

39
in determining the completion of kidney dialysis. The ratios of dry and fluid weight are difficult
to determine. They can show the amount of waste removed by the body. The amount of weight
removed and fluid waste that is retained by the individual are specific to each patient.
The group wants to expand the scope of vital signs that are recorded throughout this process
to ensure safety as well as optimize treatment time. Measurements such as blood pressure, heart
rate, temperature, oxygen concentration, and weight can be continuously monitored to achieve
these goals. Currently during dialysis treatment, these are checked periodically but not
continuously. By continuously monitoring the specific vital signs, the clinician can read the
information recorded by the microcontroller and communicated to the virtual instrument. This
continual monitoring will allow clinicians to see patterns and changes in the dialysis treatment
process to identify any complications. Also, it will save the clinician time when they have to
chart the patient’s vital signs because they will be available for viewing on the display. The
specifications of the proposed device are to meet the criteria shown in Table 5.
This device is made to be used in a point of care setting in a dialysis clinic. This means that
it is portable and the results are displayed in real-time. To achieve this, the device has sensors
that monitor blood pressure, heart rate, temperature, and oxygen concentration. A separate chair
will also be connected that continuously monitors the patient’s weight. The weight of the device
should be less than or equal to five pounds. The project also has a budget so the device should
be no more than 1000 dollars in value. The more inexpensive the device is, the more desirable it
will be to the hemodialysis clinics. Finally, the device should be easy to use and not lengthen the
time of treatment. To be marketable, the device must also comply with the standards and
requirements set by the Food and Drug Administration.
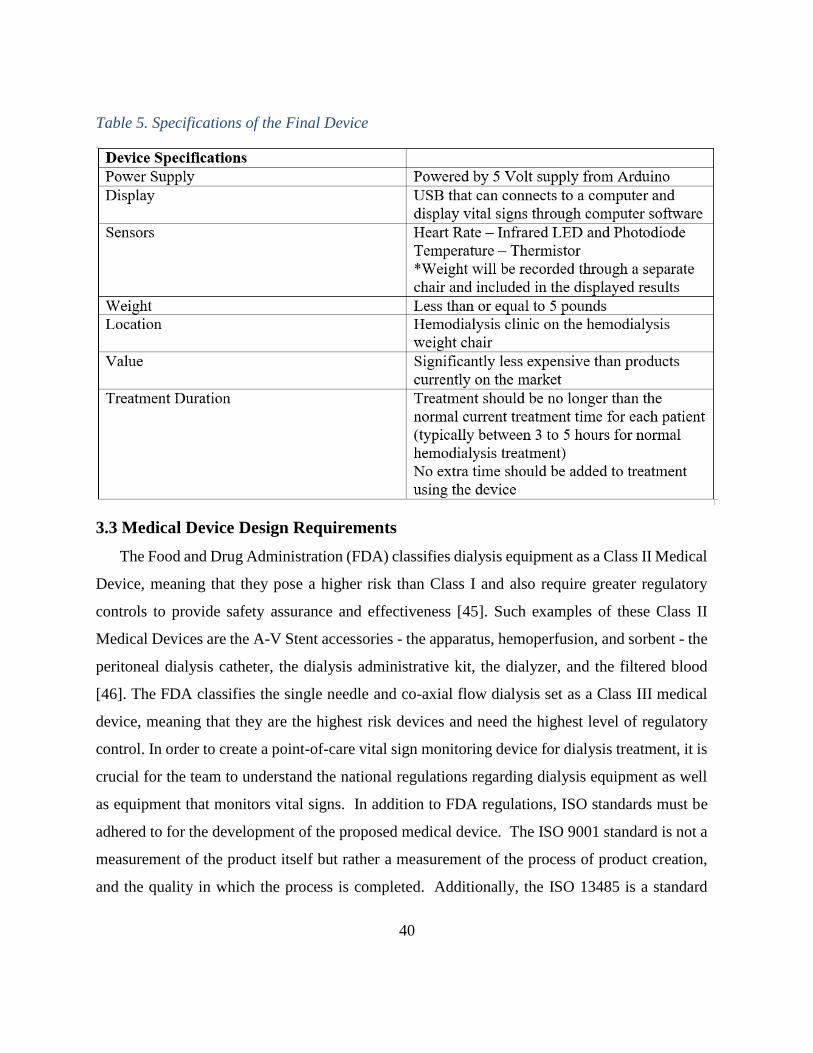
40
Table 5. Specifications of the Final Device
3.3 Medical Device Design Requirements
The Food and Drug Administration (FDA) classifies dialysis equipment as a Class II Medical
Device, meaning that they pose a higher risk than Class I and also require greater regulatory
controls to provide safety assurance and effectiveness [45]. Such examples of these Class II
Medical Devices are the A-V Stent accessories - the apparatus, hemoperfusion, and sorbent - the
peritoneal dialysis catheter, the dialysis administrative kit, the dialyzer, and the filtered blood
[46]. The FDA classifies the single needle and co-axial flow dialysis set as a Class III medical
device, meaning that they are the highest risk devices and need the highest level of regulatory
control. In order to create a point-of-care vital sign monitoring device for dialysis treatment, it is
crucial for the team to understand the national regulations regarding dialysis equipment as well
as equipment that monitors vital signs. In addition to FDA regulations, ISO standards must be
adhered to for the development of the proposed medical device. The ISO 9001 standard is not a
measurement of the product itself but rather a measurement of the process of product creation,
and the quality in which the process is completed. Additionally, the ISO 13485 is a standard

41
specifically for medical devices, specifically regulating the quality of the production of the
medical instrument [47]. ISO 14001 has a lesser impact on the project, as it concerns the impact
of the process on the environment, but must be adhered to. A full list of ISO Standards relating
to kidney dialysis treatment can be found in Appendix E.
3.4 Management Approach
By May 2017, the team needs to have a working deliverable and report to present. The
importance of being punctual with tasks and due dates is important to reach the team’s final
outcome. To achieve this, the team developed a preliminary Gantt chart and work breakdown
structure to use as a management tool, hold each other accountable and to remain on track. The
Gantt chart is seen in Figure 23.
Figure 23. Gantt Chart for Completion of Project

42
Figure 23 shows each step of the project and when it is going to be completed over the course
of the academic year. Next, each major component of the project is elaborated in the work
breakdown structure as seen in Figure 24. This includes understand the client needs, generate
preliminary designs, evaluate designs, and final design selection.
Figure 24. Work Breakdown Structure
3.4.1 Conceptual Alternative Designs
Throughout the early stages of the project, many iterations of design possibilities are examined.
When monitoring vital signs, there are many possible ways to achieve accurate results; therefore,
the team considered the most efficient and effective way to measure the desired vital signs in a
point-of-care setting. Additionally, patient safety and comfort are considered in the design of the

43
proposed VitalRing device as the hemodialysis treatment process takes place between 3-5 hours.
A design that is not user-friendly will not be implemented in the medical field. The team kept an
open mind when evaluating these alternative designs which are obtained from early research work.
Sketches were made of the designs, and feasible design iterations were modeled using Solidworks
software.
3.4.2 Evaluation of Conceptual Alternative Designs
As previously mentioned, there are numerous ways to record vital signs accurately; therefore,
design selection criteria must be based on feasibility and usability. By exploring constraints such
as cost, location of measurement and complexity, designs were selected. Additionally,
consultations with professionals in the field as well as professors in academia will be essential for
the decision on a final design. Once a preliminary design is selected, factors such as regulatory
requirements, materials and cost are further evaluated in terms of the project objectives. By doing
this, the team plans to address any future issues which may arise during construction or evaluation
of the proposed VitalRing device.
3.4.3 Plan for Final Design Selection
The team will utilize the selection methods described earlier to identify the final design. By
utilizing the Pairwise Comparison Chart in Table 4 as well as other design criteria, the team can
select a design that can be constructed and tested successfully within the timeframe. The team will
then proceed with the construction of the final design, including the construction of circuits, rapid
prototyping, and implementation of computer programs necessary for data analysis. The team will
continue to consider alternatives as the project progresses, in order to have a contingency plan if
unforeseen circumstances are to arise. Constant communication with the project advisor will also
be maintained, as his feedback will be useful in selecting the final design for the VitalRing device.
3.4.4 Plan for Final Design Testing and Evaluation
Upon completion of the design construction, testing will be done to determine the effectiveness
of the proposed medical device. Testing will be performed for accuracy and efficiency during
hemodialysis treatment process. This will be done by comparing the final design to the current
“gold standards” in industry. The accuracy of the vital sign measurements and the time it takes to

44
record the aforementioned vital signs are compared to the measurements of the gold standards.
Testing will take place over the course of multiple hours to simulate the dialysis treatment process.
Statistical analysis will also be performed on the collected data.
3.4.5 Reporting on the Final Design
After the proposed medical device is completed and tested, the team will present the design
and the findings to a panel of judges from both industry and academia. The MQP report will also
be completed and submitted by the deadline.

45
Chapter 4: Design Process of VitalRing Device
4. Introduction
After the project strategy is defined, the design process began. This include analyzing the
needs that the proposed device must fulfill, evaluating current on-the-market devices that meet
the project objectives, and developing alternative designs. Once the alternative designs are
determined and assessed, a final design for the device that meets the objectives is chosen. In this
Chapter, each step of the design process is explained before a final design is verified through
testing.
4.1 Needs Analysis
The need of this MQP required a point-of-care testing device that monitors vital signs
continuously, thereby improving the quality of hemodialysis treatment and reducing the length of
time to measure each vital sign. Hemodialysis patients are scheduled to have hemodialysis
treatment a minimum of 3 days a week for 3-5 hours per visit. Patients are prepared prior to
treatment by taking their necessary vital signs and dry weight. Since the treatment entails blood
being drawn out, filtered and put back into the body, monitoring the patient is highly necessary to
prevent health complications. In addition, the implementation of the proposed device would allow
nurses and physicians to access the electronic dialysis data remotely. As a result, the nurses and
physicians would not have to physically check the patient as often. This would address the staffing
issue in the United States, and increase the amount of patients a physician or nurse could care for.
Currently, there is no medical device in the market that measures multiple vital signs
simultaneously and continuously. Since the purpose of this device was for hospital/clinic setting,
certain specifications were required in order for it to function properly, without posing risk to
dialysis patients. For the device to be implemented in the clinical setting, it requires accuracy and
precision when measuring the heart rate and body temperature. The proposed device is needed not
to pose any harm to the patient nor interfere with the treatment process. The device is needed to
meet international and national industry standards such as ISO 11737-2:2009 for sterility and ISO
10993-1 for biocompatibility. Since the device includes electrical components, it needed to meet
guidelines under the Institute of Electrical and Electronics Engineers (IEEE), such as 2700-2014
for sensor performance parameter definitions. The device also posed desired needs that are not as

46
critical. These desired needs include being lightweight, portable, inexpensive, and have an
attachment of the device to the arm of the weight chair. This also included having material for the
finger holster that is easily sterilized, to avoid any potential contaminant. Another desired need
was that the device has proper connections to an Arduino board that provides a power supply of
5V to the circuit portion of the device. Finally, the device needed to be able to communicate with
a PC to visually display vital sign measurements on one screen through the use of a virtual
instrument software.
4.2 Concept Formation: Existing Technologies
Once the needs analysis was completed, the team researched current vital sign measurement
devices in the market. By performing this research, the team sought to discover information
regarding current practices, and the applicability to hemodialysis. Furthermore, the team examined
methods and technologies that are currently implemented, with the hope that they could utilize
these methods in their novel device. Finally, the team ensured that the methods they utilize do not
infringe upon patented or copyrighted techniques or information of existing vital sign devices.
4.2.1 i-STAT Handheld Blood Analyzer
Through primary research, the team first came upon the i-STAT Handheld Blood Analyzer,
designed by Abbott Laboratories. This device is utilized to provide a quick and comprehensive test
regarding blood composition. The device had many strengths and weakness, as outlined in Table
7.
Table 6. i-STAT Strengths and Weaknesses Comparison
Strengths Weaknesses
Integrated analysis system Invasive
Fast testing time Expensive
Accurate test results Lacks pertinent vital sign information
Point-of-Care friendly Contains extraneous information

47
As was highlighted above, there were many strengths and weaknesses regarding this
technology, providing pertinent information regarding the team’s concept development. The
advanced analysis system that the company provided was a major strength demonstrated by the
device, as the team became aware of the need to process the gathered information in a user-friendly
format. Additionally, the rapid turnaround regarding test results and the portability offered by the
device were ideal for point-of-care testing environments. However, there were significant
weaknesses that this technology demonstrated. The i-STAT requires a blood sample, which makes
the device invasive and thus opposes one of our project requirements. Furthermore, the device was
comprehensive regarding blood composition. However, the device did not read many of the vital
signs required for hemodialysis, and did not do so in a continuous format. A picture of the device
can be seen in Figure 25.
Figure 25. i-STAT Handheld Blood Analyzer
4.2.2 U.S. Patent
Additionally, the team frequently referenced an existing patent, which provided the basis for a
team concept. This design was similar to that of a pulse oximeter, where a finger clip would
noninvasively measure multiple different vital signs based upon reflection and refraction of

48
different wavelengths of infrared lights. However, this device could not be found in the market.
Therefore, minimal information could be found regarding implementation and data analysis.
4.2.3 Feasibility
Additionally, the team frequently referenced an existing patent, which provided the basis for a
team concept. This design was similar to that of a pulse oximeter, where a finger clip would
noninvasively measure multiple different vital signs based upon reflection and refraction of
different wavelengths of infrared lights. However, this device could not be found in the market.
Therefore, minimal information could be found regarding implementation and data analysis.
Table 7. Strengths and Weaknesses Based on Sensor Location
Sensor Location Strengths Weaknesses
Chest Most accurate vital sign
information for heart rate
Cumbersome to take data,
size variation with patients
Arm Most accurate vital sign
information for blood
pressure
Intrusive, required to be
opposite arm from
fistula/catheter
Finger/Hand Easily accessible,
noninvasive/nonintrusive,
minimal size variations
More variation in
measurements
4.3 Alternative Designs
In the design process, multiple design ideas were explored in the making of the device. They
were mainly focused around sensor placement to get the most accurate vital sign readings. There
are many places heart rate and temperature can be measured but those locations are not necessarily
in the same area on the body. This section explores three of the major other designs the team
considered before deciding to pursue the finger casing design.
4.3.1 Vest Design
The first option the group considered for the point-of-care vital sign testing device was a vest
that could be strapped to the patient with various sensors attached. This vest would be effective in
measuring heart rate, as most hospitals measure heart rate with electrodes on the chest, similar to

49
the vest concept. A Solidworks image of the vest are shown below in Figure 26.
Figure 26. Vest Design for Measuring Heart Rate and Temperature
This design reflected a vest that would strap on to the patient with the electrodes and sensors
positioned at the interior of the vest. The problem with this design is that it would introduce more
time delays in the dialysis process should the clinician need to strap the vest to the patient and
place all the electrodes in the appropriate locations before treatment begins. The vest would be
composed of a cloth/spandex material to ensure proper electrode placement. Additionally, it would
introduce complications in the sterilization process if the vest needed to be cleaned after every use.
The vest could be personalized per patient but that could also cause treatment costs to increase.
4.3.2 Arm Sleeve Design
The next option the team designed was an arm sleeve. This would provide the clinician with a
more easily accessible part of the body as opposed to the chest. This design would involve a sleeve
that would fit over the arm – an easier attachment site than the vest. A Solidworks image for the
arm sleeve are shown below in Figure 27.

50
Figure 27. Arm Sleeve Design for Measuring Vital Signs
The sleeve is cylindrically shaped, and would be a cloth/spandex material to wrap around the
patient’s arm, containing sensors and electrodes interiorly. The group did not continue with this
design because there were few locations on the arm where it would be efficient or accurate to
measure heart rate or temperature in the same area. Also, there were continued concerns with
sterilization of this device, because it would be made of a cloth material that would pose difficulty
for sanitation due to the electronics. Again, if the sleeve was made to be reusable and given to each
patient personally, that could increase the dialysis treatment cost per patient.
4.3.3 Finger Clip Design
A finger clip is a noninvasive and convenient method to measure many vital signs in a single
area on the body. The finger fills with blood each time the heart beats, making it possible to
measure heart rate with the use of LEDs and photodiodes. Also, skin temperature can be measured
in the same location, as long as the sensors are isolated to measure solely the skin temperature and
not the ambient air. A Solidworks image for the finger clip are shown below in Figure 28.
Figure 28. Finger Clip Design for Measuring Vital Signs

51
The finger clip itself would be composed of a 3-D printed piece of plastic, with multiple
components created in an assembly. A photodiode sensor would be located in an area that is easily
accessible to the finger, as is the case with pulse oximeters. Different frequencies would be emitted
to record heart rate, while body temperature could be measured through contact temperature. By
having this device made out of a thermoplastic, it would make sterilization of the device much
more feasible. However, a coating may be necessary due to the potential for contaminant exposure.
This design was not chosen because of the complexity of integrating multiple vital sign
measurements into a single photodiode. Also, the team wanted the design to be incorporated with
the weight chair, so the patient could sit down and slide their hand into the device. This design
would not fulfill those needs for the project, and thus lead to the development of another design
utilizing the finger as the measurement location.
4.4: Final Design Selection
There were several different decisions made concerning the number of vital signs that the team
would measure with the device. At first, vital signs such as hematocrit concentration, blood
pressure, weight, temperature, and pulse oximetry were all considered.
The hematocrit concentration could be measured through the finger by determining the change
in ultrasound wave velocity across the plasma. However, incorporation into an integrated circuit
would pose too much of a challenge. The alternative required a blood sample. Therefore,
hematocrit concentration was quickly eliminated due to the complexity and/or the invasive nature
of measurement.
Blood pressure is measured with a cuff located on the upper arm or wrist. However, the
measurement is more accurate when taken from the upper arm. The team sought to construct a
device that would be located on the hand due to the possibility of recording multiple vital signs in
that location. Furthermore, the team investigated how blood pressure could be measured non-
invasively in that area. A cuff could be placed on the finger using a light source and detector, in
which the arterial blood pressure could be measured. As the systole-blood volume increased in the
finger, the control system would increase the cuff pressure until excess blood volume is cut off.
As the diastole-blood volume in the finger decreased, the cuff pressure would be lowered and the

52
overall blood volume remain constant. The light signal would be held constant over time so intra-
arterial pressure equaled the cuff pressure. After reviewing the details to construct a finger clip
that measures blood pressure as a vital sign, we further evaluated the literature dealing with vital
sign devices in terms of the project objectives. This led the team to pursue body weight, heart rate,
and body temperature measurements as the final vital signs to be included in the device, and named
the device the VitalRing. With the help from the project advisor, a meeting was setup with a
representative of SECA, a medical measuring systems and scales company. The representative
was able to give the team a power cord for the weight chair to ensure proper weight measurements.
He also gave a detailed background of the company and an introduction to a similar medical
device.
Heart rate was another finalized vital sign that the team intended to implement in the design.
With the use of an Arduino board and a pulse sensor, the heart rate can be determined. The Arduino
board is a way to take an analog signal and convert it to digital sensors. The IR pulse sensor
included several materials, which can be seen in Appendix F.
The last vital sign to be included within the device is body temperature. Although temperature
is typically measured in the ear or forehead, it can also be measured on the finger. The temperature
will be measured with a thermistor, which will also be connected to the Arduino board. The
Arduino board will help the team get discrete values. A full circuit schematic of the IR pulse sensor
as well as the thermistor circuit with connections to the Arduino is shown in Figure 29.

53
Figure 29. Full Circuit Schematic of VitalRing
In the first block of the schematic diagram, the sensors for heart rate are situated so that when
the finger is placed on the IR LED and photodiode, the photons are reflected in accordance to the
corresponding heart beats. This creates and input signal for the circuit. In the second and third
blocks of the schematic, the signal was filtered so there is no high frequency noise or artifacts that
could distort it. In the fourth block, the filtered signal is outputted to the Arduino board. The signal
is the absorbance of photons as measured by the photodiode. In the fifth block, the thermistor and
resistor form a voltage divider and this outputs a signal to the Arduino which is then converted to
a temperature reading using Arduino software. The whole circuit is powered by the 5 volts power
supply on the Arduino and is also grounded using the Arduino.
The housing unit for the device and the finger casings were created using a 3D printer provided
by WPI Mechanical Engineering Department. The device housing dimensions are 150x100x25
mm. The printer the team chose was the MarkForged Mark Two printer. The model material for
the Mark Two printer is nylon. The benefits of using this printer are that it has high strength to
weight ratio, it is a smooth, scratch free material, and it is the most cost effective. Solidworks
1 2
1
3 4
1
5

54
designs and drawings for the full housing unit and finger casings are shown in Figures 30 and 31.
Figure 30. Full Solidworks Design of the Housing Unit
Figure 31. SolidWorks Finger Ring Image
L = 150mm W = 100mm H = 25mm
Thermoplastic

55
The final VitalRing includes the circuit with sensors, which is placed inside the housing unit,
and finger rings are attached on top of the sensors, shown in Figure 32.
Figure 32. Final VitalRing Design
The VitalRing also includes the Arduino to convert the analog signal into discrete values, the
connection to a computer where the data is imported, and finally into a computer program for the
vital signs to be displayed. A diagram of these connections are shown in Figure 33.

56
Figure 33. Diagram of all VitalRing Components
The process starts by the sensors measuring the heart rate, temperature, and weight. This is
then connected to the Arduino board. The Arduino board is connected to a computer through a
USB connection. Using the computer program Matlab, the data from the VitalRing is displayed
and analyzed. Finally, clinicians in the dialysis clinic can view this information to potentially
improve the overall treatment process of hemodialysis.

57
Chapter 5: Design Verification
5. Introduction
The goal of this MQP is to develop a point-of-care testing medical device that can be
implemented in a Dialysis clinic to monitor patient vital signs continuously and simultaneously.
This Chapter focuses on the results of the various experiments performed throughout the design
verification process of the VitalRing device. Other devices on the market for monitoring vital signs
in order are also examined to determine the overall functionality of the proposed device.
5.1 ECG Testing
Electrocardiograph testing was performed on each subject prior to testing the VitalRing device
in order to provide reference data for verifying the performance of the final design. Three ECG
electrodes were placed on the subject’s body: the left arm (black lead), the right arm (green lead),
and the left side of their abdomen (red lead), as shown in Figure 39. These electrodes were wired
to Vernier software where the ECG waveform were directly observed.
Figure 34. ECG Experimental Setup

58
The data from LoggerPro was downloaded as a text file and imported into Matlab. Here it was
analyzed to get the average heart rate of different segments of the total testing time. A plot of a
minute of testing is shown below in Figure 35 through Figure 38 for each subject.
Figure 35. ECG Reference Data Plot for Subject 1

59
Figure 36. ECG Reference Data Plot for Subject 2

60
Figure 37. ECG Reference Data Plot for Subject 3

61
Figure 38. ECG Reference Data Plot for Subject 4
For each subject, the ECG data remains constant because the subject was instructed not to move.
However, because electrodes are used to measure heart rate and these electrodes are very sensitive
to noise and motion artifacts, even a slight movement could disrupt the reading. The noise
measured is the electrical activity of the muscles under the electrode contracting rather than the
electrical activity of the heart. A summary of the reference ECG results are shown below in Table
9.

62
Table 8. Reference ECG Data for Each Subject
5.2 Temperature Testing
Another set of reference tests were conducted on the subjects during the VitalRing experiments
explained in the next section. An FDA approved medical forehead thermometer was used to
measure the skin temperature of each subject (Figure 44). The temperature was taken and recorded
every 15 minutes throughout the three hour time span of the VitalRing experiment. The data was
then used to compare and verify with the temperature collected from the NTC thermistor
component of the VitalRing device.
Figure 39. Temperature Thermometer Placement

63
A summary of the reference temperature data is shown below in Table 10.
Table 9. Reference Temperature Data for Each Subject
5.3 VitalRing Testing
In order to validate all the components within the final design, experiments were performed
using the VitalRing on four separate subjects. Each individual experiment lasted a duration of three
hours to mimic the time required for dialysis treatment. The subject sat in an upright position in a
chair with their hand resting on a flat surface. The left hand was used during the experiment for all
subjects, where they placed their middle distal phalanx in the infrared sensor finger ring and place
their index distal phalanx in the NTC thermistor sensor finger ring, confirming contact with each
sensor. The complete setup of the VitalRing experiment is shown below in Figure 40.

64
Figure 40. VitalRing Experimental Setup
The data from the Arduino was saved as a text file and imported into Matlab. The full Device
code can be found in Appendix F. The data was then plotted and the heart rates and temperatures
at different sections were computed. The code for this can be found in Appendix G. For each
subject, the absorbance was used to measure heart rate because peaks in absorbance values
correspond with each heartbeat. The absorbance and temperature plots for each subject can be seen
in Figure 41 through Figure 48. The absorbance plot is shown for the first minute and the
temperature plot is shown for the full length of testing.

65
Figure 41. Absorbance Plot for Subject 1

66
Figure 42. Temperature Plot for Subject 1

67
Figure 43. Absorbance Plot for Subject 2

68
Figure 44. Temperature Plot for Subject 2

69
Figure 45. Absorbance Plot for Subject 3

70
Figure 46. Temperature Plot for Subject 3

71
Figure 47. Absorbance Plot for Subject 4

72
Figure 48. Temperature Plot for Subject 4
The device data was decomposed into the same intervals as the reference data was. At each
interval, the average heart rate and temperature was computed. A summary of the heart rate results
is shown for each subject in Table 11 and a summary of the temperature results is shown for each
subject in Table 12.

73
Table 10. Heart Rate Results for Each Subject Using the Device
Table 11. Body Temperature Results for Each Subject Using the Device

74
Next, the data subject-to-subject was compared for reference and VitalRing results. Figure 49
shows a bar chart of the heart rate data for the reference tests and the VitalRings tests. Figure 50
shows a bar chart of the temperature data for the reference tests and the VitalRing tests. Here, the
overall values between test types are illustrated and visually compare each subjects results to the
other subjects. The bars on the graph show standard deviations in the data set.
Figure 49. Reference and VitalRing Heart Rate Data for Each Subject

75
Figure 50. Reference and VitalRing Temperature Data for Each Subject
5.4 Statistical Analysis
The averages of reference and device data for each subject was compared using statistical tests,
such as the T-tests and Kolmogorov-Smirnov (KS) tests. Using the lillietest function in Matlab, it
can be determined if the data for a specific set follows a normal distribution. If both the reference
and device data for a subject follows a normal distribution, then the T-test function can be used. If
one of them or both of them do not follow a normal distribution, the KS-test function is used. The
KS-test is less sensitive than the T-test because it is nonparametric so there are no assumptions
about the distribution of the data [48]. These functions output a p-value in Matlab. If the p-value
is less than 0.05, then the data sets are statistically different. The summary of the heart rate results
and the p-values are shown below in Table 13 and the summary of the temperature results and the
p-values are shown below in Table 14.

76
Table 12. Statistical Results for Heart Rate Data
Table 13. Statistical Results for Body Temperature Data

77
Chapter 6: Final Design and Validation
6. Introduction
Once testing was completed and the final design results were analyzed, the VitalRing device
was evaluated and validated based on various socioeconomic groups. These groups include:
economics, environmental, societal, political, and ethical. Impacts our project had on each of these
groups were considered and explained. Other areas that the team considered in the final device
validation were health and safety, manufacturability, and sustainability. This Chapter describes
each of these criteria to validate that the VitalRing met the standards in each group as well as the
overall feedback received on the device through the design process.
6.1 Feedback on Final Design
Throughout the design process, the team worked with several professors and advisors at WPI
to gain insight on each design iteration. This insight helped the team decide upon the final design.
According to our project advisor, the device was easy to use and safe, however, he suggested that
more vital signs should be added to this device. Our advisor also suggested that the group find a
material that can be adjusted depending on the patient’s finger size. This would be the device easier
to use and more patient-specific. Throughout this process, the feedback reported to the team
considerably helped with the direction of the project.
6.2 Economics
The economic impact of this device will principally affect two groups: patients and kidney
dialysis treatment clinics. The use of the proposed device will eliminate the need for frequent vital
sign examinations by the staff, thereby allowing the staff to monitor dialysis patients in a timely
manner. The dialysis patients could potentially save money in the following categories: time spent
in the clinic and staff reduction. The simplistic design of the VitalRing device allows for patients
to easily use it and the staff as well. Without the need for several examinations, dialysis staff
members can focus their attention on the output of these vital signs, and thereby ensuring the
patients’ safety and quality of health.

78
6.3 Environmental Impact
The device and its components are intended for multiple uses. The finger casings can be
sterilized in an autoclave after use, and be reused on the next patient. The device is intended for
several uses which reduces the waste that could be produced. A computer powers the Arduino
board. The computer needs to be plugged into an outlet for the Arduino board to work. The
MarkForged Mark Two printer at WPI Mechanical Engineering Department was used to print the
finger casings. This printer used Nylon to print the casings, which should be recycled. The
proposed VitalRing device is environmentally friendly, and will not produce a significant amount
of waste.
6.4 Societal Influence
The target audience of this device is patients with kidney disease who have lost 85% to 90%
of kidney functions. Although the device is intended for this population, the influence could
expand beyond this intended group. The device is designed to improve the quality and experience
of kidney dialysis patients. If successful in a dialysis clinic, this device can even be used by patients
performing dialysis in their own home setting. This device could positively affect the lives of many
individuals of all different ages.
6.5 Political Ramifications
The VitalRing device would pose no immediate political concerns, as the device records
information that can be determined through other medical instruments. However, the low cost of
manufacturing the device would potentially influence the global market, as many similar products
on the market cost significantly more than the VitalRing. Furthermore, this low cost device could
aid to improve dialysis treatments in the developing countries, improving the conditions and
efficiency of dialysis clinics worldwide. The noninvasive nature of the product ensures that there
will be little conflict in application than the invasive testing measures which are not welcomed by
some developing countries.

79
6.6 Ethical Concerns
The VitalRing device poses no immediate ethical concerns, and should widely alleviate
difficulties that exist within the field of hemodialysis. By simultaneously monitoring the heart
rate, body temperature, and body weight of a patient, the device will assist in the efficiency and
accuracy of a hemodialysis treatment. However, it is essential that the information displayed
through the device remain confidential and accurate, to maintain the patient’s safety and privacy.
6.7 Health and Safety Issues
The VitalRing device will increase the efficiency and accuracy of hemodialysis patients, by
providing continuous and integrated measurements of heart rate, body temperature, and body
weight. This integration will allow for dialysis clinicians and doctors to correlate the vital sign
measurements, and determine the efficiency of the treatment. The device does not possess any
safety concerns, besides those assumed when running current through a circuit. Additionally, the
risk for contaminant exposure is present due to the device’s proximity to the fistula/catheter site.
6.8 Manufacturability
The manufacturability is an important component when designing the device. The materials to
build the device were all easily found and purchased. The materials can be bought and prepared in
bulk as shown in Appendix F. The finger casings and device case can be 3D printed from the
existing designs (Figures 32-35). The method of 3D printing has become very popular due to the
low cost and reproducibility. The Arduino board is compatible with every computer once the
software is downloaded.

80
Chapter 7: Discussion
Overall, the VitalRing is capable of measuring and displaying both heart rate and body
temperature over the course of hemodialysis treatment process. The device is successful in
meeting the following design objectives: safety and reproducibility. The VitalRing device poses
no harm to patients or healthcare providers with the proper use of the casing. All the components
of the device can be found in bulk and easily constructed. The device did not fully meet the
design objective of accuracy. The output data of the device was not as accurate as the reference
data.
The VitalRing device was designed to be used at the fingertip for the easily accessible point
of vital sign measuring as well as the compatibility with the dialysis treatment. Patients that
undergo dialysis treatment have limited access points for monitoring vital signs due to the
placement of the fistula as well as other external connections. The design was created with the
intention of having it fit all suitable ages and genders, utilizing measurements of an average adult
male. To assist dialysis treatment, the VitalRing device can be mechanically attached to the arm
of the SECA chair. The device is compatible with most Arduino boards and Arduino software
through the USB connection in order to analyze the data with a graphical software, such as
Matlab.
The temperature results obtained from the device were comparable to the reference data. The
average standard deviation recorded from the VitalRing for the four subjects was 3.6105. The
average reference standard deviation was 0.2650. The VitalRing recorded temperature from the
finger; whereas, the reference device recorded temperature from the forehead. Thus, the
temperature recorded at the finger is a few degrees lower than core body temperature due to the
fact that extremities are located further away from the heart. .
The heart rate results obtained from the device were also comparable to the reference data.
The device measures peaks in absorbance detected by the photodiode which correspond to
heartbeats. The reference data measures the electrical activity of the heart from ECG electrodes
placed on the arms and lower abdomen. The average standard deviation recorded from the
VitalRing device for the four subjects was 0.5508. The average reference standard deviation was

81
5.9275. Electrical activity measured by the heart is more sensitive than blood volume
measurements, and result in more accurate values, but with larger standard deviations. The
VitalRing device has smaller standard deviation, which confirms its precision.
The data collected by the device was statistically analyzed using MATLAB software to
obtain p-values through T-tests and KS-tests depending on whether the data followed a normal
distribution or not. If the p-value was less than 0.05, then the device data was statistically
different from the reference data. If the p-value was greater than 0.05, then the device data was
statistically the same as the reference data. The VitalRing device should output values that agree
with reference data therefore the p-values should all be greater than 0.05. Based on the results
from MATLAB, at least one of the p-values for heart rate was larger than 0.05 which means the
device is capable of measuring heart rate accurately against the reference data. For the rest of the
subjects, the p-values were slightly smaller than 0.05 however these could be improved based on
change in sensor location or further calibration. None of the p-values for temperature were
greater than 0.05 which means the temperature data was statistically different from the reference
data. Again, further calibration is necessary to improve these results.

82
Chapter 8: Conclusions and Recommendations
The VitalRing is capable of continuously measuring both heart rate and body temperature,
and when paired with the SECA chair, provides a mechanically integrated system to record and
monitor these measurements. By noninvasively measuring both heart rate and body temperature
at the finger, vital signs can be continuously monitored in a manner that does not hinder the
dialysis treatment. Additionally, dialysis efficiency is increased by concurrently recording these
vital signs, removing the need for multiple different tests and subsequent equipment. The number
of clinicians needed would decrease because a single clinician could monitor several patients.
The healthcare providers will be able to view these results continuously in a simple format, rather
than referencing multiple different instruments at defined time increments. Finally, the providers
will be able to make informed decisions in a timely manner from the continuous readings by the
device.
By incorporating a thermistor circuit for body temperature and an infrared pulse sensor for
heart rate, the VitalRing device continuously records data and transmits the information as a text
file via an Arduino Uno. This data can then be analyzed through Matlab to filter out extraneous
noise and provide more accurate data. Simultaneously, the SECA chair records the body weight
of the dialysis patient, providing pertinent information that correlates with the heart rate and body
temperature information.
Currently, the VitalRing device has the potential to replace the gold standard of treatment,
due to the combination of continuous measurements and the cost of manufacturing. Utilizing the
Markforged Mark 2 3-Dimensional printer, as well as the other circuit components, the cost of a
VitaRing device is less than 40 dollars, with comparable devices on the market costing near 4,000
dollars. Furthermore, the simultaneous recording of body temperature, heart rate, and body
weight is more efficient than recording each measurement separately, and more efficient than
recording this information incrementally. Additionally, by monitoring the patient continuously
for three or more hours, the clinicians will have access to more patient data and can track trends
in this data to better the treatment process.
Moving forward, further calibration is necessary to increase the accuracy and precision of

83
the measurements. This can be done by testing more subjects and establishing more accurate
reference information. By doing so, there will be a smaller discrepancy between testing and
reference standards. This is especially relevant regarding body temperature, as the temperature
measured at the finger can vary from core body temperature. Additionally, minimizing the risk
of contaminant exposure is another future consideration. Due to the nature of hemodialysis
treatment, there is a risk of blood exposure to both the patient and the dialysis technician. This
can lead to the introduction of blood borne illnesses, such as Hepatitis-C. By introducing a
coating to the housing unit of the VitalRing, this risk is minimized due to the ability for the
instrument to be effectively cleaned. Furthermore, making the finger rings adjustable will allow
for customization as well as increased accuracy in results. By making the finger circumference
adjustable, each patient can have a secure fit to their finger, increasing patient compatibility.
Creating this secure fit can also assist with accuracy, eliminating the possibility for ambient air
to interfere with the temperature readings. This interference can decrease the readings for body
temperature, as was seen in the testing results.
Further, the addition of other vital sign measurements will increase the efficiency of
treatment, such as measuring blood pressure or pulse oximetry. With these vital signs, more
correlations can be made regarding the efficiency of the dialysis treatment, providing pertinent
information to clinicians and doctors. Additionally, incorporating a Bluetooth or wireless
component to the VitalRing device will increase portability and ease of use for both the clinicians
and doctors.

84
References
[1] National Kidney Foundation. (2015). Dialysis. Retrieved from
https://www.kidney.org/atoz/content/dialysisinfo
[2] American Alliance Dialysis. (2012). Hemodialysis. Retrieved from
http://americanalliancedialysis.com/hemodialysis.php
[3] Fox, S. I. (2011). Human Physiology. New York, NY: McGraw-Hill Companies, Inc.
[4] Jennette, J. C., Olson J. L., Schwartz M. M. & Silva F. G. (Eds). (2007). Heptinstall’s
Pathology of the Kidney. Philadelphia, PA: Lippincott Williams & Wilkins.
[5] Cameron, S. (1996). Kidney Failure: The Facts. New York, NY: Oxford Medical Publications.
[6] Bakris, G. L. (2004). The Kidney and Hypertension. Lane, London: Martin Dunitz.
[7] Whaley-Connell, A. T., Sowers, J. R., Stevens, L. A., McFarlane, S. I., Shlipak, M. G., Norris,
K. C., ... & Vassalotti, J. A. (2008). CKD in the United States: kidney early evaluation
program (KEEP) and National Health and Nutrition Examination Survey (NHANES) 1999-
2004. American journal of kidney diseases, 51(4), S13-S20.
[8] The History of Dialysis. Retrieved December 04, 2016, from https://www.davita.com/kidney-
disease/dialysis/motivational/the-history-of-dialysis/e/197
[9] DaVita Dialysis. (2016). Choosing the Right Dialysis Treatment Option DaVita. Retrieved
from https://www.davita.com/treatment-options/choosing-the-right-treatment/majority-of-
nephrology-professionals-prefer-home-dialysis/t/7584
[10] Nissenson, A. R., Fine, R. N., & Gentile, D. E. (1995). The Hemodialysis Procedure. In A. L.
Corea (Ed.), Clinical Dialysis (Third ed.): Appleton & Lange.
[11] Yeun, J. Y., & Depner, T. A. (2000). Complications Related to Inadequate Dose: Recognition
and Management in Acute and Chronic Dialysis. Complications of Dialysis, 89-115.
[12] Roy, A., & Kalra, V. (2012). Anticoagulation in Haemodialysis25(2), 107-109. Retrieved
from http://medind.nic.in/jav/t12/i2/javt12i2p107.pdf
[13] DaVita Dialysis. What is hemodialysis? Retrieved from https://www.davita.com/kidney-
disease/dialysis/treatment/what-is-hemodialysis?/e/1350
[14] Nephcure Kidney International. (2016). Peritoneal Dialysis. Retrieved from
http://nephcure.org/peritoneal-dialysis/
[15] Peritoneal Dialysis. (1981). (K. D. Nolph Ed.): Martinus Nijhoff Publishers.
[16] Peritoneal Dialysis | NIDDK. Retrieved April 24, 2017, from
https://www.niddk.nih.gov/health-information/kidney-disease/kidney-failure/peritoneal-dialysis

85
[17] The Continuous Cycling Peritoneal Dialysis (CCPD). Retrieved April 24, 2017, from
https://rachon.info/free/continuous-cycling-peritoneal-dialysis.asp
[18] ACEP 2014 EM Report Card. Retrieved December 13, 2016, from
http://www.emreportcard.org/
[19] European Renal Care Providers Association. (2016). Facts & Figures. Retrieved from
ercpa.eu/facts-figures/
[20] The Renal Association. (2013). About the Renal Association. Retrieved from
http://www.renal.org/about-us/about-the-renal-association#sthash.RGxaSOtk.dpbs
[21] Mactier, R., Hoenich, N., & Breen, C. (2009). Haemodialysis Guidelines. Retrieved from
http://www.renal.org/guidelines/modules/haemodialysis
[22] Masakane, I. (2010, February 22). High-quality dialysis: A lesson from the Japanese
experience. Retrieved December 04, 2016, from
http://ckj.oxfordjournals.org/content/3/suppl_1/i28.full
[23] Foley, R. N., & Hakim, R. M. (2009, May 14). Why is the Mortality of Dialysis Patients in
the United States Much Higher than the Rest of the World? Retrieved December 04, 2016,
from http://jasn.asnjournals.org/content/20/7/1432.full
[24] Lacson, E., Jr., & Brunelli, S. M. (2011, September). Hemodialysis Treatment Time: A Fresh
Perspective. Retrieved December 04, 2016, from
http://cjasn.asnjournals.org/content/6/10/2522.full
[25] Ing, T. S., Rahman, M. A., & Kjellstrand, C. M. (2012). Dialysis: History, development, and
promise. Retrieved December 4, 2016, from
https://books.google.com/books?id=nv3R3U3kwO8C&pg=PA654&lpg=PA654&dq=hemo
dialysis practice in
japan&source=bl&ots=hzR6FrXjXa&sig=xxxqteVPSxHBCoHMbYPWJFnIGkQ&hl=en&
sa=X&ved=0ahUKEwiujM-
L7YPQAhUB7iYKHfB_CfIQ6AEIXTAJ#v=onepage&q=hemodialysis practice in
japan&f=false
[26] Barnas, Michel G. W., Boer, Walther H., and Koomans, Hein A. (1999). Hemodynamic
Patterns and Spectral Analysis of Heart Rate Variability during Dialysis Hypotension.
Journal of the American Society of Nephrology. Retrieved from
http://www.jasn.asnjournals.org
[27] Vital Signs and the Different Numbers that a Dialysis Technician Records. (2016). Retrieved
from http://dialysistechniciantraininghub.net/2014/11/04/vital-signs-dialysis-technician/

86
[28] Necessity of a Stethoscope and Blood Pressure Cuff. (2015, August 28). Retrieved from
http://www.talkdress.net/tag/stethoscope-and-blood-pressure-cuff
[29] Mallamaci, F., Panuccio, V., Zocalli, C. (1997). The Heart Rate Response Pattern to Dialysis
Hypotension in Haemodialysis Patients. Retrieved from
http://ndt.oxfordjournals.org/content/12/3/519
[30] 12 Lead ECG – Lead Placement Diagrams. Retrieved April 24, 2017, from
http://www.ems12lead.com/2008/10/17/12-lead-ecg-lead-placement-diagrams/
[31] Medical Equipment | Spirometers | Blood Pressure Monitors ECG Machines. Retrieved
April 24, 2017, from http://www.sealmedical.com/ecg-machines.html
[32] Electrocardiogram (ECG or EKG). (2015, July). Retrieved April 24, 2017, from
http://www.heart.org/HEARTORG/Conditions/HeartAttack/DiagnosingaHeartAttack/Electrocar
diogram-ECG-or-EKG_UCM_309050_Article.jsp#.WP6ySvnyuM8
[33] Habiba, N.M., Johnson, J.M., Pergola, P.E. (2004). Body Temperature Regulation During
Hemodialysis in Long-Term Patients: Is it Time to Change Dialysate Temperature
[34] Medical Forehead Ear Thermometer Revolutionized. Retrieved April 24, 2017, from
https://www.amazon.com/Medical-Forehead-Ear-Thermometer-
Revolutionized/dp/B00UXGHC8Y
[35] Diroll, Anne (2016). The Importance of Oxygen During Hemodialysis. Retrieved from
http://www.rsnhope.org
[36] Leiden, Jeffery, Khalil, … Xiaomao Wu, Ronald Hohs. “Method and Apparatus for
Determining Blood Parameters and Vital Signs of a Patient.” US Patent 20030212316. Issued
Nov, 13, 2003.
[37] Schubert, E. F. (2006). Light-Emitting Diodes (Second ed.): Cambridge University.
[38] National Lighting Product Information Program. What is an LED? Retrieved from
http://www.lrc.rpi.edu/programs/nlpip/lightinganswers/led/whatisanled.asp
[39] Photodiode - Oxford Reference. (2017). Retrieved from
http://www.oxfordreference.com.ezproxy.wpi.edu/view/10.1093/acref/9780198714743.0
01.0001/acref-9780198714743-e-2291
[40] Sittner, W. R. (2014). Photodiode. Electro Medical Systems, Inc.
doi:https://doi.org.ezproxy.wpi.edu/10.1036/1097-8542.509600

87
[41] Photodiode Theory of Operation. (2017). Retrieved from
https://www.aptechnologies.co.uk/support/photodiodes/photodiode-theory-of-operation
[42] Photodiode - Working Principle and Applications. (2014, 2014-03-13). Retrieved from
http://www.azooptics.com/Article.aspx?ArticleID=809
[43] Menicanin, A. B., Aleksic, O. S., Nikolic, M. V., Savic, S. M., & Radojcic, B. M. (2008,
May). Novel uniaxial anemometer containing NTC thick film segmented thermistors. In
Microelectronics, 2008. MIEL 2008. 26th International Conference on (pp. 349-352). IEEE.
[44] Make an Arduino Temperature Sensor (Thermistor Tutorial). (2017, March 18). Retrieved
April 03, 2017, from http://www.circuitbasics.com/Arduino-thermistor-temperature-sensor-
tutorial/
[45] Food and Drug Administration. (2015). What does it mean for FDA to classify a medical
device. Retrieved from
http://www.fda.gov/AboutFDA/Transparency/Basics/ucm194438.htm
[46] Food and Drug Administration. (2016). Product Classification. Retrieved from
http://www.accessdata.fda.gov/scripts/cdrh/cfdocs/cfpcd/classification.cfm?start_search=1
6&Submission_Type_ID=&DeviceName=dialysis&ProductCode=&DeviceClass=&ThirdP
arty=&Panel=&RegulationNumber=&Implant_Flag=&Life_Sustain_Support_Flag=&PAG
ENUM=5&SortColumn=DeviceName
[47] ISO. (2016). Standards. Retrieved from http://www.iso.org/iso/home/standards.htm
[48] CBSJU. (2017). Kolmogorov-Smirnov Test. Retrieved from
http://www.physics.csbsju.edu/stats/KS-test.html

88
Appendix A: Step-by-Step Process of a Dialysis Patient’s Plan
Orders for a dialysis patient’s care plan include the following:
1. Hemodialysis delivery system
a. Single pass, REDY, sorbent, other
2. Hemodialyzer
a. Brand, model, size
3. Blood flow rate
4. Dialysate composition
5. High or variable sodium, potassium, calcium, glucose, buffer base
6. Dialysate flow rate
7. Frequency and duration of the treatment
8. Ideal or dry weight
9. Amount of weight to remove
10. Type and amount of fluid to support blood pressure
11. Heparin doses including the target activated clotting time (ACT)
12. Laboratory tests
a. Initial, monthly, quarterly, biyearly, yearly
13. Nutritional management
14. Intradialytic medications
15. Method for monitoring nutritional and adequacy of dialysis status
a. Urea, kinetic modeling (KT/V), urea reduction ratio (URR), and/or protein
catabolic rate (PCR)
Any special instruction that may be required to complete the dialysis as prescribed

89
Appendix B: Acute and Chronic Order Forms

90

91
Appendix C: Hemodialysis Laboratory Tests Performed for Different Time
Periods
Every Month Every 3 Months
(Quarterly)
Every 6 to 12 Months
(Biyearly and Yearly)
- Electrolytes
- Blood Urea Nitrogen (BUN)
● Pre and post dialysis to calculate
URR
- Creatinine
- Calcium
- Alkaline phosphatase
- Albumin
- Glucose
- Bilirubin total
- Alanine and aspartate aminotransferase
(SGOT and SGPT)
- Complete blood count
● Hepatitis screening Including
SGPT and HbsAg
- Iron and iron
binding capacity
- Ferritin
- Parathyroid hormone (PTH)
- Platelet count
- Differential
- Growth hormone
● For pediatric patients
- Triglycerides (fasting)
- Metabolic bone survey
- Chest x-ray
- ECG
- X-ray for bone age
● For pediatric patients

92
Appendix D: Block Diagram of Hemodialysis Treatment
Initiation
Termination

93
Appendix E: ISO Standards
ISO 11663:2014 specifies minimum quality requirements for dialysis fluids used in
haemodialysis and related therapies.
ISO 11663:2014 includes dialysis fluids used for haemodialysis and haemodiafiltration,
including substitution fluid for haemodiafiltration and haemofiltration.
EC/TR 62653:2012(E) which is a technical report, describes the technical requirements for use
of equipment in haemodialysis, haemofiltration and haemodiafiltration. These principles should
be complied with to ensure safe, permissible and proper application. The physician is responsible
for the haemodialysis treatment prescription. However, the organization administering the
treatment is responsible for all resources, structures and processes used in connection with the
treatment.
ISO 13958:2014 specifies minimum requirements for concentrates used for haemodialysis and
related therapies. For the purpose of ISO 13958:2014, "concentrates" are a mixture of chemicals
and water, or chemicals in the form of dry powder or other highly concentrated media that are
delivered to the end user to make dialysis fluid used to perform haemodialysis and related
therapies. ISO 13958:2014 is addressed to the manufacturer of such concentrates.
ISO 13959:2014 specifies minimum requirements for water to be used in haemodialysis and
related therapies.
ISO 13959:2014 includes water to be used in the preparation of concentrates, dialysis fluids for
haemodialysis, haemodiafiltration and haemofiltration, and for the reprocessing of
haemodialysers.
ISO 23500:2014 provides dialysis practitioners with guidance on the preparation of dialysis fluid
for haemodialysis and related therapies and substitution fluid for use in online therapies, such as
haemodiafiltration and haemofiltration. As such, ISO 23500:2014 functions as a recommended
practice.
ISO 23500:2014 addresses the user's responsibility for the dialysis fluid once the equipment used
in its preparation has been delivered and installed. For the purposes of ISO 23500:2014, the
dialysis fluid includes dialysis water used for the preparation of dialysis fluid and substitution
fluid, dialysis water used for the preparation of concentrates at the user's facility, as well as
concentrates and the final dialysis fluid and substitution fluid.
ISO 11737-2:2009 specifies the general criteria for tests of sterility on medical devices that have
been exposed to a treatment with the sterilizing agent reduced relative to that anticipated to be

94
used in routine sterilization processing. These tests are intended to be performed when defining,
validating or maintaining a sterilization process.
ISO 10993-1 describes:
● the general principles governing the biological evaluation of medical devices within a
risk management process;
● the general categorization of devices based on the nature and duration of their contact
with the body;
● the evaluation of existing relevant data from all sources;
● the identification of gaps in the available data set on the basis of a risk analysis;
● the identification of additional data sets necessary to analyze the biological safety of the
medical device;
● the assessment of the biological safety of the medical device.
IEEE 2700-2014 A common framework for sensor performance specification terminology,
units, conditions and limits is provided. Specifically, the accelerometer, magnetometer,
gyrometer/gyroscope, barometer/pressure sensors, hygrometer/humidity sensors, temperature
sensors, ambient light sensors, and proximity sensors are discussed.

95
Appendix F: List of Materials of VitalRing
Item Item # Manufacturer Quantity
Price
per
unit
24AWG Solid Conductor Intercom
Wire, 1M T1288-1-ND digikey 1 1.53
MagicW 10 Pieces IC LM324N LM324
DIP14 Op AMp E248FE1003024 Amazon 1 5.9
Uxcell a11102000ux0369 2N3904
Through Hole Three Terminal NPN
Transistors, 20 Piece a11102000ux0369 Amazon 1 4.53
AmazonBasics USB 2.0 Cable - A-
Male to B-Male - 6 Feet (1.8 Meters) N/A Amazon 1 4.99
Multipurpose PC Board with 417 holes 276150 Radioshack 4 3.24
1.0uF Tantalum Capacitor, 35V 20% 2721434 Radioshack 4 2.59
Infrared LED Emitter and Detector 276142 Radioshack 2 5.19
Arduino Uno Rev3 A000066 A000066 Amazon 1 16.75
Carbon film risistors, 1/8W, from
assortment:
470K
CF18JT470KCT-
ND digikey 5 0.1
68K
CF18JT68K0CT-
ND digikey 10 0.2
39K
CF18JT39K0CT-
ND digikey 5 0.1
8.2K
CF18JT8K20CT-
ND digikey 5 0.1
1.8K
CF18JT1K80CT-
ND digikey 5 0.1
1K
CF18JT1K00CT-
ND digikey 5 0.1
220
CF18JT220RCT-
ND digikey 5 0.1

96
Appendix F: VitalRing and Arduino Interface
C.1 Arduino Code
//From heart.ino
#include <FreqMeasure.h>
const int sensorPin = A0;
int sensorVal;
float frequency;
float BMP;
//From Tempreader_F
int ThermistorPin = 1;//Should it be A1?
int Vo;
float R1 = 10000;
float logR2, R2, T;
float c1 = 1.009249522e-03, c2 = 2.378405444e-04, c3 = 2.019202697e-07;
void setup() {
// put your setup code here, to run once:
Serial.begin(9600);
FreqMeasure.begin();
}
//From heart.ino
double sum=0;
int count=0;
void loop() {
// put your main code here, to run repeatedly:
//From heart.ino:
//creates a timer variable to keep track of time
unsigned long timer = millis();
if (FreqMeasure.available()) {
sum = sum + FreqMeasure.read();
count = count + 1;
if (count >= 10) {
frequency = FreqMeasure.countToFrequency(sum / count);
BMP = (frequency*60);
sum = 0;
count = 0;
}
}
sensorVal = analogRead(sensorPin);

97
double voltage = convertToVoltage(sensorVal);
double absorbance = calculateAbsorbance(voltage);
//small delay to change our sampling rate
//and stabilize our signal
delay(25);
// From Tempreader_F:
Vo = analogRead(ThermistorPin);
R2 = R1 * (1023.0 / (float)Vo - 1.0);
logR2 = log(R2);
T = (1.0 / (c1 + c2*logR2 + c3*logR2*logR2*logR2));
T = T - 273.15;
T = (T * 9.0)/ 5.0 + 32.0;
displayPulseInLabVIEW(absorbance, BMP, T);
delay(500);
}
void displayPulseInLabVIEW(double absorbance, float BMP, float T)
{
Serial.print(absorbance,5);
Serial.print("\t");
Serial.print(BMP,2);
Serial.print("\t");
Serial.print(T,2);
Serial.println();
}
double convertToVoltage(double ADC_Val)
{
double volt = 0;
volt = 5*(ADC_Val/1023);
return volt;
}
double calculateAbsorbance(double volt)
{
double absorbance = 0;
absorbance = log10(5/volt);
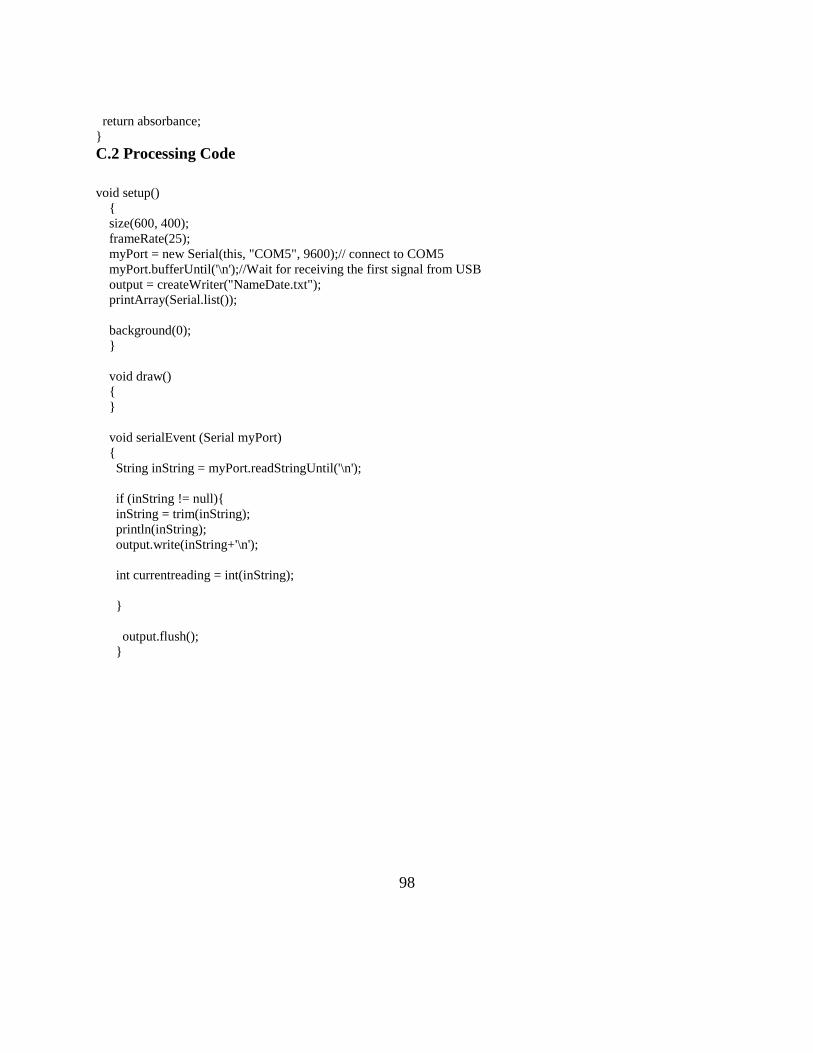
98
return absorbance;
}
C.2 Processing Code
void setup()
{
size(600, 400);
frameRate(25);
myPort = new Serial(this, "COM5", 9600);// connect to COM5
myPort.bufferUntil('\n');//Wait for receiving the first signal from USB
output = createWriter("NameDate.txt");
printArray(Serial.list());
background(0);
}
void draw()
{
}
void serialEvent (Serial myPort)
{
String inString = myPort.readStringUntil('\n');
if (inString != null){
inString = trim(inString);
println(inString);
output.write(inString+'\n');
int currentreading = int(inString);
}
output.flush();
}

99
Appendix G: Matlab Code for VitalRing
D.1 ref_s1.m
%% Import Data s1_ecg = importdata('sean_ecg2.txt'); ecg1 = s1_ecg(:,2); time_ecg = s1_ecg(:,1); samples = 1:3001; %60 seconds %% Plot Reference Heart Rate figure(1) plot(time_ecg(samples),ecg1(samples)) title('Reference ECG Data from Electrodes for Subject 1') xlabel('Time (seconds)') ylabel('Voltage(mV)') %% sample1 = 1:2000; sample2 = 2001:4000; sample3 = 4001:6000; sample4 = 6001:8000; sample5 = 8000:length(s1_ecg); %plot(time_ecg(sample5),ecg1(sample5)) pks1 = findpeaks(ecg1(sample1), 'MinPeakHeight',0.8); numpks1 = length(pks1)*1.5; pks2 = findpeaks(ecg1(sample2), 'MinPeakHeight',0.8); numpks2 = length(pks2)*1.5; pks3 = findpeaks(ecg1(sample3), 'MinPeakHeight',0.8); numpks3 = length(pks3)*1.5; pks4 = findpeaks(ecg1(sample4), 'MinPeakHeight',0.8); numpks4 = length(pks4)*1.5; pks5 = findpeaks(ecg1(sample5), 'MinPeakHeight',0.23); numpks5 = length(pks5)*1.5; hr_ref = [numpks1 numpks2 numpks3 numpks4 numpks5] mean(hr_ref) %% tempref = [98.3,98,98.3,98,98.2,98.3,98.4,98.1,98.2,98.3,98.0,98.3,98.5]; time = [0 15 30 45 60 75 90 105 120 135 150 165 180]; figure(2) plot(time,temps) title('Reference Temperature Data') xlabel('Time (minutes)')

100
ylabel('Temperature (F)') axis([0 180 50 100])
D.2 ref_s2.m
%% Import Data s2_ecg = importdata('bri_ecg2.txt'); ecg1 = s2_ecg(:,2); time_ecg = s2_ecg(:,1); samples = 1:3001; %60 seconds %% Plot Reference Heart Rate figure(1) plot(time_ecg(samples),ecg1(samples)) title('Reference ECG Data from Electrodes for Subject 2') xlabel('Time (seconds)') ylabel('Voltage(mV)') %% Intervals with Heart Rates sample1 = 1:2000; sample2 = 2001:4000; sample3 = 4001:6000; sample4 = 6001:8000; sample5 = 8000:length(s2_ecg); plot(time_ecg(sample1),ecg1(sample1)) plot(time_ecg(sample1),ecg1(sample2)) plot(time_ecg(sample1),ecg1(sample3)) plot(time_ecg(sample1),ecg1(sample4)) plot(time_ecg(sample1),ecg1(sample5)) pks1 = findpeaks(ecg1(sample1), 'MinPeakHeight',0.2); numpks1 = length(pks1)*1.5; pks2 = findpeaks(ecg1(sample2), 'MinPeakHeight',0.2); numpks2 = length(pks2)*1.5; pks3 = findpeaks(ecg1(sample3), 'MinPeakHeight',0.2); numpks3 = length(pks3)*1.5; pks4 = findpeaks(ecg1(sample4), 'MinPeakHeight',0.2); numpks4 = length(pks4)*1.5; pks5 = findpeaks(ecg1(sample5), 'MinPeakHeight',0.2); numpks5 = length(pks5)*1.5; hr_ref = [numpks1 numpks2 numpks3 numpks4 numpks5] mean(hr_ref) %% Temperature Reference Data temps = [96.9 98.1 97.6 97.8 97.8 97.7 97.3 97.5 97.6 97.9 97.8 97.6 97.6];

101
time = [0 15 30 45 60 75 90 105 120 135 150 165 180]; figure(2) plot(time,temps) title('Reference Temperature Data') xlabel('Time (minutes)') ylabel('Temperature (F)') axis([0 180 50 100])
D.3 ref_s3.m
%% Import Data s3_ecg = importdata('erin_ecg2.txt'); ecg1 = s3_ecg(:,2); time_ecg = s3_ecg(:,1); samples = 1:3001; %60 seconds %% Plot Reference Heart Rate figure(1) plot(time_ecg(samples),ecg1(samples)) title('Reference ECG Data from Electrodes for Subject 3') xlabel('Time (seconds)') ylabel('Voltage(mV)') %% Intervals with Heart Rate sample1 = 1:2000; sample2 = 2001:4000; sample3 = 4001:6000; sample4 = 6001:8000; sample5 = 8000:length(s3_ecg); plot(time_ecg(sample1),ecg1(sample1)) pks1 = findpeaks(ecg1(sample1), 'MinPeakHeight',0.6); numpks1 = length(pks1)*1.5; pks2 = findpeaks(ecg1(sample2), 'MinPeakHeight',0.6); numpks2 = length(pks2)*1.5; pks3 = findpeaks(ecg1(sample3), 'MinPeakHeight',0.6); numpks3 = length(pks3)*1.5; pks4 = findpeaks(ecg1(sample4), 'MinPeakHeight',0.6); numpks4 = length(pks4)*1.5; pks5 = findpeaks(ecg1(sample5), 'MinPeakHeight',0.6); numpks5 = length(pks5)*1.5; hr_ref = [numpks1 numpks2 numpks3 numpks4 numpks5] mean(hr_ref)

102
%% Temperature Reference Data temps = [97 97.6 98.7 97.7 97.7 97.6 97.6 97.2 97.6 97.8 97.7 98 97.9]; time = [0 15 30 45 60 75 90 105 120 135 150 165 180]; figure(2) plot(time,temps) title('Reference Temperature Data') xlabel('Time (minutes)') ylabel('Temperature (F)') axis([0 180 50 100])
D.4 ref_s4.m
%% Import Data s4_ecg = importdata('sarah_ecg2.txt'); ecg1 = s4_ecg(:,2); time_ecg = s4_ecg(:,1); samples = 1:3001; %% Plot Reference Heart Rate figure(1) plot(time_ecg(samples),ecg1(samples)) title('Reference ECG Data from Electrodes for Subject 4') xlabel('Time (seconds)') ylabel('Voltage(mV)') %% Intervals with Heart Rate sample1 = 1:2000; sample2 = 2001:4000; sample3 = 4001:6000; sample4 = 6001:8000; sample5 = 8000:length(s4_ecg); plot(time_ecg(sample2),ecg1(sample2)) pks1 = findpeaks(ecg1(sample1), 'MinPeakHeight',1); numpks1 = length(pks1)*1.5; pks2 = findpeaks(ecg1(sample2), 'MinPeakHeight',1.1); numpks2 = length(pks2)*1.5; pks3 = findpeaks(ecg1(sample3), 'MinPeakHeight',1); numpks3 = length(pks3)*1.5; pks4 = findpeaks(ecg1(sample4), 'MinPeakHeight',1); numpks4 = length(pks4)*1.5; pks5 = findpeaks(ecg1(sample5), 'MinPeakHeight',1); numpks5 = length(pks5)*1.5; hr_ref = [numpks1 numpks2 numpks3 numpks4 numpks5] mean(hr_ref)

103
%% Temperature Reference Data tempref = [97.8,98.2,97.7,98.2,98.0,97.9,98.3,98.1,97.7,97.9,97.9,97.8,97.9]; time = [0 15 30 45 60 75 90 105 120 135 150 165 180]; figure(2) plot(time,temps) title('Reference Temperature Data') xlabel('Time (minutes)') ylabel('Temperature (F)') axis([0 180 50 100])
D.5 device_s1.m
%% Import Data s1 = importdata('Sub1_4417.txt'); temp = s1(:,3); absorb = s1(:,1); samples = 1:length(temp); Fs = 150; time = samples/Fs; %% Plots figure(1) plot(time, temp) title('Temperature Reading from Device for Subject 1') xlabel('Time (minutes)') ylabel('Temperature (F)') figure(2) plot(time(1:150), absorb(1:150)) title('Absorbance Reading from Device for Subject 1') xlabel('Time (minutes)') ylabel('Absorbance Level (V)') %% absorb1 = absorb(1:4500); [pks1,loc1] = findpeaks(absorb1); %pks in 30 minutes numpks1 = length(pks1); %number of pks in 30 minutes freq1 =(numpks1/time(loc1(end))); %BPM %% absorb2 = absorb(4501:9000); [pks2,loc2] = findpeaks(absorb2); %pks in 30 minutes numpks2 = length(pks2); %number of pks in 30 minutes freq2 =(numpks2/time(loc2(end))); %BPM %% absorb3 = absorb(9001:13500); [pks3,loc3] = findpeaks(absorb3); %pks in 30 minutes numpks3 = length(pks3); %number of pks in 30 minutes freq3 =(numpks3/time(loc3(end))); %BPM %% absorb4 = absorb(13501:18000); [pks4,loc4] = findpeaks(absorb4); %pks in 30 minutes

104
numpks4 = length(pks4); %number of pks in 30 minutes freq4 =(numpks4/time(loc4(end))); %BPM %% absorb5 = absorb(18001:end); [pks5,loc5] = findpeaks(absorb5); %pks in 30 minutes numpks5 = length(pks5); %number of pks in 30 minutes freq5 =(numpks5/time(loc5(end))); %BPM %% Mean HR hr = [freq1, freq2, freq3, freq4, freq5] mean_hr = mean(hr) stddev = std(hr) %% temp1 = temp(1:1500); mean1 = mean(temp1); %% temp2 = temp(1501:3000); mean2 = mean(temp2); %% temp3 = temp(3001:4500); mean3 = mean(temp3); %% temp4 = temp(4501:6000); mean4 = mean(temp4); %% temp5 = temp(6001:7500); mean5 = mean(temp5); %% temp6 = temp(7501:9000); mean6 = mean(temp6); %% temp7 = temp(9001:10500); mean7 = mean(temp7); %% temp8 = temp(10501:12000); mean8 = mean(temp8); %% temp9 = temp(12001:13500); mean9 = mean(temp9); %% temp10 = temp(13501:15000); mean10 = mean(temp10); %% temp11 = temp(15001:16500); mean11 = mean(temp11); %% temp12 = temp(16501:18000); mean12 = mean(temp12);

105
%% temp13 = temp(18001:end); mean13 = mean(temp13); %% Mean Temp temps = [mean1, mean2, mean3, mean4, mean5, mean6, mean7, mean8, mean9, mean10, mean11, mean12, mean13] mean_t = mean(temps) std_t = std(temps)
D.6 Device_s2.m
%% Import Data s2 = importdata('Sub2_41217.txt'); temp = s2(:,3); absorb = s2(:,1); samples = 1:length(temp); Fs = 150; time = samples/Fs; %% Plots figure(1) plot(time, temp) title('Temperature Reading from Device for Subject 2') xlabel('Time (minutes)') ylabel('Temperature (F)') axis([0 140 50 100]) figure(22) plot(time(1:150), absorb(1:150)) title('Absorbance Reading from Device for Subject 2') xlabel('Time (minutes)') ylabel('Absorbance Level (V)') %% absorb1 = absorb(1:4500); [pks1,loc1] = findpeaks(absorb1); %pks in 30 minutes numpks1 = length(pks1); %number of pks in 30 minutes freq1 =(numpks1/time(loc1(end))); %BPM %% absorb2 = absorb(4501:9000); [pks2,loc2] = findpeaks(absorb2); %pks in 30 minutes numpks2 = length(pks2); %number of pks in 30 minutes freq2 =(numpks2/time(loc2(end))); %BPM %% absorb3 = absorb(9001:13500); [pks3,loc3] = findpeaks(absorb3); %pks in 30 minutes numpks3 = length(pks3); %number of pks in 30 minutes freq3 =(numpks3/time(loc3(end))); %BPM %% absorb4 = absorb(13501:18000);

106
[pks4,loc4] = findpeaks(absorb4); %pks in 30 minutes numpks4 = length(pks4); %number of pks in 30 minutes freq4 =(numpks4/time(loc4(end))); %BPM %% absorb5 = absorb(18001:end); [pks5,loc5] = findpeaks(absorb5); %pks in 30 minutes numpks5 = length(pks5); %number of pks in 30 minutes freq5 =(numpks5/time(loc5(end))); %BPM %% Mean HR hr = [freq1, freq2, freq3, freq4, freq5] mean_hr = mean(hr) stddev = std(hr) %% temp1 = temp(1:1500); mean1 = mean(temp1); %% temp2 = temp(1501:3000); mean2 = mean(temp2); %% temp3 = temp(3001:4500); mean3 = mean(temp3); %% temp4 = temp(4501:6000); mean4 = mean(temp4); %% temp5 = temp(6001:7500); mean5 = mean(temp5); %% temp6 = temp(7501:9000); mean6 = mean(temp6); %% temp7 = temp(9001:10500); mean7 = mean(temp7); %% temp8 = temp(10501:12000); mean8 = mean(temp8); %% temp9 = temp(12001:13500); mean9 = mean(temp9); %% temp10 = temp(13501:15000); mean10 = mean(temp10); %% temp11 = temp(15001:16500); mean11 = mean(temp11); %% temp12 = temp(16501:18000);

107
mean12 = mean(temp12); %% temp13 = temp(18001:end); mean13 = mean(temp13); %% Mean Temp temps = [mean1, mean2, mean3, mean4, mean5, mean6, mean7, mean8, mean9, mean10, mean11, mean12, mean13] mean_t = mean(temps) std_t = std(temps)
D.7 device_s3.m
%% Import Data s3 = importdata('Sub3_41017.txt'); temp = s3(:,3); absorb = s3(:,1); samples = 1:length(temp); Fs = 150; time = samples/Fs; %% Plots figure(1) plot(time, temp) title('Temperature Reading from Device for Subject 3') xlabel('Time (minutes)') ylabel('Temperature (F)') axis([0 140 50 100]) figure(22) plot(time(1:150), absorb(1:150)) title('Absorbance Reading from Device for Subject 3') xlabel('Time (minutes)') ylabel('Absorbance Level (V)') %% absorb1 = absorb(1:4500); [pks1,loc1] = findpeaks(absorb1); %pks in 30 minutes numpks1 = length(pks1); %number of pks in 30 minutes freq1 =(numpks1/time(loc1(end))); %BPM %% absorb2 = absorb(4501:9000); [pks2,loc2] = findpeaks(absorb2); %pks in 30 minutes numpks2 = length(pks2); %number of pks in 30 minutes freq2 =(numpks2/time(loc2(end))); %BPM %% absorb3 = absorb(9001:13500); [pks3,loc3] = findpeaks(absorb3); %pks in 30 minutes numpks3 = length(pks3); %number of pks in 30 minutes freq3 =(numpks3/time(loc3(end))); %BPM %%

108
absorb4 = absorb(13501:18000); [pks4,loc4] = findpeaks(absorb4); %pks in 30 minutes numpks4 = length(pks4); %number of pks in 30 minutes freq4 =(numpks4/time(loc4(end))); %BPM %% absorb5 = absorb(18001:end); [pks5,loc5] = findpeaks(absorb5); %pks in 30 minutes numpks5 = length(pks5); %number of pks in 30 minutes freq5 =(numpks5/time(loc5(end))); %BPM %% Mean HR hr = [freq1, freq2, freq3, freq4, freq5] mean_hr = mean(hr) stddev = std(hr) %% temp1 = temp(1:1500); mean1 = mean(temp1); %% temp2 = temp(1501:3000); mean2 = mean(temp2); %% temp3 = temp(3001:4500); mean3 = mean(temp3); %% temp4 = temp(4501:6000); mean4 = mean(temp4); %% temp5 = temp(6001:7500); mean5 = mean(temp5); %% temp6 = temp(7501:9000); mean6 = mean(temp6); %% temp7 = temp(9001:10500); mean7 = mean(temp7); %% temp8 = temp(10501:12000); mean8 = mean(temp8); %% temp9 = temp(12001:13500); mean9 = mean(temp9); %% temp10 = temp(13501:15000); mean10 = mean(temp10); %% temp11 = temp(15001:16500); mean11 = mean(temp11); %%

109
temp12 = temp(16501:18000); mean12 = mean(temp12); %% temp13 = temp(18001:end); mean13 = mean(temp13); %% Mean Temp temps = [mean1, mean2, mean3, mean4, mean5, mean6, mean7, mean8, mean9, mean10, mean11, mean12, mean13] mean_t = mean(temps) std_t = std(temps)
D.8 Device_s4.m
%% Import Data s4 = importdata('Sub4_4517.txt'); temp = s4(:,3); absorb = s4(:,1); samples = 1:length(temp); Fs = 150; time = samples/Fs; figure(1) %% Plots plot(time, temp) title('Temperature Reading from Device for Subject 4') xlabel('Time (minutes)') ylabel('Temperature (F)') figure(2) plot(time(1:150), absorb(1:150)) title('Absorbance Reading from Device for Subject 4') xlabel('Time (minutes)') ylabel('Absorbance Level (V)') %% absorb1 = absorb(1:4500); [pks1,loc1] = findpeaks(absorb1); %pks in 30 minutes numpks1 = length(pks1); %number of pks in 30 minutes freq1 =(numpks1/time(loc1(end))); %BPM %% absorb2 = absorb(4501:9000); [pks2,loc2] = findpeaks(absorb2); %pks in 30 minutes numpks2 = length(pks2); %number of pks in 30 minutes freq2 =(numpks2/time(loc2(end))); %BPM %% absorb3 = absorb(9001:13500); [pks3,loc3] = findpeaks(absorb3); %pks in 30 minutes numpks3 = length(pks3); %number of pks in 30 minutes freq3 =(numpks3/time(loc3(end))); %BPM

110
%% absorb4 = absorb(13501:18000); [pks4,loc4] = findpeaks(absorb4); %pks in 30 minutes numpks4 = length(pks4); %number of pks in 30 minutes freq4 =(numpks4/time(loc4(end))); %BPM %% absorb5 = absorb(18001:end); [pks5,loc5] = findpeaks(absorb5); %pks in 30 minutes numpks5 = length(pks5); %number of pks in 30 minutes freq5 =(numpks5/time(loc5(end))); %BPM %% Mean HR hr = [freq1, freq2, freq3, freq4, freq5] mean_hr = mean(hr) stddev = std(hr) %% temp1 = temp(1:1500); mean1 = mean(temp1); %% temp2 = temp(1501:3000); mean2 = mean(temp2); %% temp3 = temp(3001:4500); mean3 = mean(temp3); %% temp4 = temp(4501:6000); mean4 = mean(temp4); %% temp5 = temp(6001:7500); mean5 = mean(temp5); %% temp6 = temp(7501:9000); mean6 = mean(temp6); %% temp7 = temp(9001:10500); mean7 = mean(temp7); %% temp8 = temp(10501:12000); mean8 = mean(temp8); %% temp9 = temp(12001:13500); mean9 = mean(temp9); %% temp10 = temp(13501:15000); mean10 = mean(temp10); %% temp11 = temp(15001:16500); mean11 = mean(temp11);

111
%% temp12 = temp(16501:18000); mean12 = mean(temp12); %% temp13 = temp(18001:end); mean13 = mean(temp13); %% Mean Temp temps = [mean1, mean2, mean3, mean4, mean5, mean6, mean7, mean8, mean9, mean10, mean11, mean12, mean13] mean_t = mean(temps) std_t = std(temps)
D.9 analysis.m
%% Subject 1 hr_ref_s1 = [66 70.5 75 72 73.5]; tempref_s1 = [98.3,98,98.3,98,98.2,98.3,98.4,98.1,98.2,98.3,98.0,98.3,98.5]; mean_h1 = mean(hr_ref_s1) mean_t1 = mean(tempref_s1) hr_device_s1 = [58.0462 58.9726 58.3593 58.2592 59.1654]; temps_device_s1 = [94.1176 94.6913 93.8537 93.9386 94.3990 95.0370 94.0196 91.7880 92.0269 94.3066 94.8710
95.0395 94.9805]; mean_h2 = mean(hr_device_s1) mean_t2 = mean(temps_device_s1) l1 = lillietest(hr_ref_s1); l2 = lillietest(tempref_s1); l3 = lillietest(hr_device_s1); l4 = lillietest(temps_device_s1); [h1,p1] = kstest2(hr_ref_s1, hr_device_s1) [h2,p2] = kstest2(tempref_s1,temps_device_s1) %% Subject 2 hr_ref_s2 = [66 70.5 70.5 78 55.5]; tempref_s2 = [96.9 98.1 97.6 97.8 97.8 97.7 97.3 97.5 97.6 97.9 97.8 97.6 97.6]; mean_h7 = mean(hr_ref_s2) mean_t7 = mean(tempref_s2) hr_device_s2 = [57.0253 56.8586 55.8915 56.7586 55.5469]; temps_device_s2 = [74.4947 73.5832 75.0878 77.2359 75.6140 75.7557 76.2967 76.6497 76.9580 77.2351 77.4368
77.0453 77.2628]; mean_h8 = mean(hr_device_s2) mean_t8 = mean(temps_device_s2) l13 = lillietest(hr_ref_s2); l14 = lillietest(tempref_s2); l15 = lillietest(hr_device_s2);

112
l16 = lillietest(temps_device_s2); [h7,p7] = kstest2(hr_ref_s2, hr_device_s2) [h8,p8] = ttest(tempref_s2,temps_device_s2) %% Subject 3 hr_ref_s3 = [58.5 63 70.5 60 57]; tempref_s3 = [97 97.6 98.7 97.7 97.7 97.6 97.6 97.2 97.6 97.8 97.7 98 97.9]; mean_h3 = mean(hr_ref_s3) mean_t3 = mean(tempref_s3) hr_device_s3 = [56.8045 56.8793 56.1916 56.6126 55.9740]; temps_device_s3 = [87.6821 84.9929 78.7120 75.2145 74.4350 74.8841 74.9841 74.9570 75.3032 74.8313 74.3701
74.0661 74.3628]; mean_h4 = mean(hr_device_s3) mean_t4 = mean(temps_device_s3) l5 = lillietest(hr_ref_s3); l6 = lillietest(tempref_s3); l7 = lillietest(hr_device_s3); l8 = lillietest(temps_device_s3); [h3,p3] = kstest2(hr_ref_s3, hr_device_s3) [h4,p4] = kstest2(tempref_s3,temps_device_s3) %% Subject 4 hr_ref_s4 = [63 70.5 54 52.5 73.5]; tempref_s4 = [97.8,98.2,97.7,98.2,98.0,97.9,98.3,98.1,97.7,97.9,97.9,97.8,97.9]; mean_h5 = mean(hr_ref_s4) mean_t5 = mean(tempref_s4) hr_device_s4 = [58.0258 56.2792 56.0582 56.7712 57.1782]; temps_device_s4 = [90.7588 91.7593 90.2998 90.7332 88.8582 87.3467 81.6214 76.5173 73.8657 72.7606 72.6880
72.4798 72.2427]; mean_h6 = mean(hr_device_s4) mean_t6 = mean(temps_device_s4) l9 = lillietest(hr_ref_s4); l10 = lillietest(tempref_s4); l11 = lillietest(hr_device_s4); l12 = lillietest(temps_device_s4); [h5,p5] = ttest(hr_ref_s4, hr_device_s4) [h6,p6] = ttest(tempref_s4,temps_device_s4)