A Longitudinal Analysis Of Shiftwork And Self-Reported ...
75
University of South Carolina Scholar Commons eses and Dissertations 2018 A Longitudinal Analysis Of Shiſtwork And Self- Reported Depression In A Police Cohort Meghan Holst University of South Carolina Follow this and additional works at: hps://scholarcommons.sc.edu/etd Part of the Epidemiology Commons is Open Access esis is brought to you by Scholar Commons. It has been accepted for inclusion in eses and Dissertations by an authorized administrator of Scholar Commons. For more information, please contact [email protected]. Recommended Citation Holst, M.(2018). A Longitudinal Analysis Of Shiſtwork And Self-Reported Depression In A Police Cohort. (Master's thesis). Retrieved from hps://scholarcommons.sc.edu/etd/4693
Transcript of A Longitudinal Analysis Of Shiftwork And Self-Reported ...

University of South CarolinaScholar Commons
Theses and Dissertations
2018
A Longitudinal Analysis Of Shiftwork And Self-Reported Depression In A Police CohortMeghan HolstUniversity of South Carolina
Follow this and additional works at: https://scholarcommons.sc.edu/etd
Part of the Epidemiology Commons
This Open Access Thesis is brought to you by Scholar Commons. It has been accepted for inclusion in Theses and Dissertations by an authorizedadministrator of Scholar Commons. For more information, please contact [email protected].
Recommended CitationHolst, M.(2018). A Longitudinal Analysis Of Shiftwork And Self-Reported Depression In A Police Cohort. (Master's thesis). Retrievedfrom https://scholarcommons.sc.edu/etd/4693
A LONGITUDINAL ANALYSIS OF SHIFTWORK AND SELF-REPORTED DEPRESSION IN A POLICE COHORT
by
Meghan Holst
Bachelor of Arts
University of South Carolina, 2014
Submitted in Partial Fulfillment of the Requirements
For the Degree of Master of Science in
Epidemiology
The Norman J. Arnold School of Public Health
University of South Carolina
2018
Accepted by:
Michael Wirth, Director of Thesis
James Burch, Reader
James Hussey, Reader
Cheryl L. Addy, Vice Provost and Dean of the Graduate School

ii
© Copyright by Meghan Holst, 2018
All Rights Reserved

iii
ABSTRACT
Background: Shiftwork is associated with many chronic diseases stemming from the
disruption of circadian rhythms. Police officers have a high risk for many adverse
conditions including depression. Abnormal bodily functions, such as increased stress and
disturbed sleeping patterns, may play an important role in the development and
severity of depression. This study was designed to assess the association between
depressive symptoms and shiftwork in a police cohort from Buffalo, NY.
Methods: This longitudinal analysis consists of 470 police officers from the Buffalo
Cardio-Metabolic Occupational Police Stress (BCOPS) study. Data were collected during
visit 3 between 2004-2005 and visit 4 in 2010. Officers were classified as working the
day, evening, or night shift based on the shift they spent the most of their work hours
according to electronic payroll records. Other shift work variables included short-term
shiftwork over the previous two weeks and number of shift changes. Two self-reported
depression measures were used as the outcomes, the Center for Epidemiological
Studies – Depression (CES-D) scale and the Beck Depression Inventory (BDI). Generalized
linear models were used to estimate least squares means and odds ratios from repeated
data. Possible effect modification was only assessed for the stress measures.
Results: Linear regression models did not produce significant results. With logistic
regression, those working the evening/night shift had higher odds for depressive
iv
symptoms according to the BDI than those working the day shift (OR = 4.60, 95% CI =
1.15-18.39). Excluding the evening shift, those working the night shift had higher odds
for depressive symptoms according to the BDI than those working the day shift (OR =
4.90, 95% CI = 1.20-19.57).
There were no significant results for short-term shiftwork or number of shift changes in
relation to either depression measure. Crude analyses showed highest depressive
symptoms in the evening shift for the linear and logistic models. Stratifying by the stress
measures did not show significance, however mean values for depressive symptoms
were higher in the high stress categories for Impact of Events (IES) and perceived stress
score (PSS).
Discussion: Associations were only found in the logistic regression model in regard to
long-term shiftwork and depressive symptoms assessed by the BDI. After stratifying by
the stress measures, mean values for depressive symptoms were higher in the high-
stress categories. This may indicate that depressive symptoms are more influenced by
stress than by shiftwork. Further research should include usage of biomarkers for
depression, a longer study design, and assessment of total shiftwork history.

v
TABLE OF CONTENTS
ABSTRACT ............................................................................................................................ iii
LIST OF TABLES .................................................................................................................... vi
LIST OF ABBREVIATIONS .................................................................................................... vii
CHAPTER 1: INTRODUCTION ............................................................................................... 1
CHAPTER 2: LITERATURE REVIEW ....................................................................................... 5
CHAPTER 3: METHODS ...................................................................................................... 18
CHAPTER 4: RESULTS ........................................................................................................ 27
CHAPTER 5: DISCUSSION ................................................................................................... 40
CHAPTER 6: CONCLUSION ................................................................................................. 50
REFERENCES ...................................................................................................................... 52

vi
LIST OF TABLES
Table 4.1 Visit 3 Characteristics of the Study Population by Shift Type, Buffalo Cardio-
Metabolic Police Stress study (BCOPS), 2004-2005 (N=428) ............................................ 42
Table 4.2 Characteristics of the Study Population with Follow-up Data by Shift Type,
Buffalo Cardio-Metabolic Police Stress study (BCOPS), 2010 (N=261) ............................. 43
Table 4.3 Population Characteristics by Attendance at 2010 Clinic Visit, Buffalo Cardio-
Metabolic Police Stress study (BCOPS) (N=428) ............................................................... 44
Table 4.4 Adjusted Mean Values and 95% Confidence Intervals of Depression Measures
for Long-term and Short-term Shiftwork and Shift Changes, Buffalo Cardio-Metabolic
Police Stress study (BCOPS), 2004/2005 – 2010 (N=689) ................................................. 45
Table 4.5 Odds Ratios and 95% Confidence Intervals of Depression Measures for Long-
term and Short-term Shiftwork and Shift Changes, Buffalo Cardio-Metabolic Police
Stress study (BCOPS), 2004/2005 – 2010 (N=689) ........................................................... 46
Table 4.6: Interaction Term P-values of Depression Measures Across Categories of
Shiftwork and Stress Measures, Buffalo Cardio-Metabolic Police Stress study (BCOPS),
2004/2005 – 2010 (N=689)…………………………………………………………………………………………..47
Table 4.6 Adjusted Mean Values and 95% Confidence Intervals of Depression Measures
Across Categories of Shiftwork Stratified by Impact of Events, Buffalo Cardio-Metabolic
Police Stress study (BCOPS), 2004/2005 – 2010 (N=689) ................................................. 48
Table 4.7 Adjusted Mean Values and 95% Confidence Intervals of Depression Measures
Across Categories of Shiftwork Stratified by Perceived Stress Score, Buffalo Cardio-
Metabolic Police Stress study (BCOPS), 2004/2005 – 2010 (N=689) ............................... 49
Table 4.8: Adjusted Mean Values and 95% Confidence Intervals of Depression Measures
Across Categories of Shiftwork Stratified by the Spielberger Police Stress Survey, Buffalo
Cardio-Metabolic Police Stress study (BCOPS), 2004/2005 – 2010
(N=689)……………………………………………………………………………………………………………………..…50

vii
LIST OF ABBREVIATIONS
BCOPS ...................................... Buffalo Cardio-Metabolic Occupational Police Stress study
BDI .............................................................................................. Beck Depression Inventory
BMI ............................................................................................................. Body Mass Index
CES-D .................................................. Center for Epidemiological Studies Depression scale
IES ............................................................................................................... Impact of Events
PSQI ....................................................................................... Pittsburgh Sleep Quality Index
PSS ...................................................................................................... Perceived Stress Scale
SAD ............................................................................................ Seasonal Affective Disorder
SCN ................................................................................................. suprachiasmatic nucleus
SPSS .................................................................................... Spielberger Police Stress Survey

1
CHAPTER 1
INTRODUCTION
1.1 Shiftwork
Shiftwork, inevitable in today’s society, affects over 15 million Americans and is
classified as shifts that are outside the typical working hours of 9:00 am to 5:00 pm
(Centers for Disease Control and Prevention [CDC], 2016). Historically known to only
affect manufacturing and public safety workers, shiftwork is increasingly prevalent in
the food/beverage, medical, and recreation industries within the past decade (Presser,
2004). Many businesses such as gyms, convenience stores and other factory-like
businesses are moving towards providing more operating hours such as 24/7 service. A
difficult trade-off is then presented: an increase of job opportunities and hours of
operation provided to the community results in a higher prevalence of shiftwork.
Because of reversed working hours, shift workers are susceptible to sleep-related
problems and other detrimental health issues. Working abnormal shifts disrupts the
natural 24-hour (24h) cycle that maintains the processes within our bodies, such as body
temperature, hormone production, cell division, and respiratory rate (Harrington, 2001).
This endogenous cycle, also known as our circadian rhythm, is governed by light cues
from the environment that are sent to the suprachiasmatic nucleus (SCN) via retino-
geniculo-hypothalamic pathways. This nucleus, located in the hypothalamus, is the

2
master clock primarily responsible for keeping our bodies in sync and receiving solar
signals (Pett et al., 2016; Manoogian & Panda, 2017).
Melatonin, a hormone secreted by the pineal gland, which coincides with solar
signals, is also vital for our sleep/wake rhythms and sleep propensity. Levels are the
highest during the night time and are gradually suppressed by external light cues which
increase alertness (Pandi-Perumal et al., 2006). Melatonin also is responsible for a
plethora of physiological functions such as blood pressure regulation, control of tumor
growth, and detoxification of free radicals and has even been used to treat depression
(Pandi-Perumal et al., 2006).
Over time, mammals evolved to have 24h rhythms, which are run by over 20
genes creating negative (translational) and positive (transcriptional) feedback loops
(Pett et al., 2016; Manoogian & Panda, 2017). Transcription, the process of genetic code
synthesizing certain proteins, is initiated by CLOCK (circadian locomotor output cycles
kaput) and Bmal1 (brain and muscle aryl hydrocarbon receptor nuclear translocator).
These factors heterodimerize the target period consisting of Period1 (Per1), Per2 and
Per3, in addition to cryptochrome genes Cryptochrome1 (Cry1) and Cry2 (Manoogian &
Panda, 2017). These then provide negative feedback on CLCK and Bmal1; one loop of
interaction between these proteins and heterodimers creates the length of our internal
clock (Haus & Smolensky, 2013). Manoogian and Panda concluded that around 7-13% of
genes within our bodies are dominated by circadian control. For example, CRY controls a
few pro-inflammatory cytokines and chronic behavioral circadian desynchrony, which

3
leads to inflammation: additionally, low levels of Per2 resulted in tumor growth in mice.
(Manoogian & Panda, 2017).
Current research on mental health and shiftwork lacks adequate longitudinal
data greater than 4 years. Many studies also do not have the variety of shiftwork
measures utilized in this project, including number of shift changes (i.e., shifts between
day, evening, and night shifts) quantified over a period of years. Additionally, little
research has been done regarding self-reported depression scales and police officers.
Therefore, longitudinal data, over 5 years, was utilized to assess the possible
relationship between shiftwork and self-reported depression in a police cohort.
Aim 1: To examine the association between (a) long-term shiftwork status and
depressive symptoms as well as (b) short-term shiftwork status and depressive
symptoms.
(a.) Hypothesis: Those working primarily night or evening shift will have higher levels
of self-reported depression, measured by the Center for Epidemiological Studies
– Depression (CES-D) scale and the Beck Depression Inventory (BDI), compared
to those primarily working the day shift.
(b.) Hypothesis: Those working primarily night or evening shift over a 2-week period
will have higher levels of self-reported depression, measured by the Center for
Epidemiological Studies – Depression (CES-D) scale and the Beck Depression
Inventory (BDI), compared to those primarily working the day shift

4
Aim 2: To examine the association between number of shift changes and depressive
symptoms.
Hypothesis: Those with a high number of shift changes will have higher levels of
self-reported depression, measured by the Center for Epidemiological Studies –
Depression (CES-D) scale and the Beck Depression Inventory (BDI), compared to
those with fewer shift changes.
Aim 3: To examine stress as an effect modifier between shiftwork status and depressive
symptoms.
Hypothesis: Those with higher self-reported stress, measured by the Perceived
Stress Scale (PSS), Total Impact of Events (IES), and Spielberger Police Stress
Survey (SPSS), will have a stronger association between shiftwork and depression
compared to those with less self-reported stress.

5
CHAPTER 2
LITERATURE REVIEW
2.1 Shiftwork and Adverse Health Outcomes
A plethora of lifestyle factors play a role in the development of negative health
outcomes in shift workers. Shift workers are more susceptible to inadequate sleep,
physical activity and proper dieting, in addition to smoking and alcohol consumption
(Folkard & Tucker, 2003; Harrington, 2001; Fritschi et al., 2011). Proper meals may be
difficult to obtain for shift workers due to the availability during their work hours.
Additionally, they tend to consume a diet of high energy density to combat fatigue.
Nausea and decreased appetite have been observed in shift workers, which may lead to
a poor, low-nutrient diet (Fritschi et al., 2011).
Smoking and lack of physical activity are more prevalent in the shift working
populations than the general population (Fritschi et al., 2011). Because of disrupted
sleep patterns and regulatory factors, physical activity may be a challenge to most shift
workers. In turn, shift workers exhibit higher BMI levels than non-shift workers. In a
previous meta-analysis, most studies indicated a higher prevalence of smokers in shift
working populations than non-shift working populations (van Amelsvoort et al., 2006).
Partially due to lifestyle factors, shift workers may experience negative emotional,

6
cognitive, and somatic responses which range from mood fluctuations and depressed
states to risk of diabetes and cancer (Wulff et al., 2010).
One potential somatic response resulting from shiftwork is cardiovascular
disease (CVD). An increased risk for CVD is present in police officers who work the night
shift, including myocardial infarction and ischemic stroke (Ma et al., 2015; Harrington,
2001). Additionally, a variety of metabolic disorders such as visceral obesity and atypical
blood pressure are associated with not only current and former shift workers, but also
to those exposed to long-term shiftwork of >10 years (Tucker et al., 2012). A meta-
analysis by Bradley and Rumsfeld found an increased risk for coronary artery disease in
those that had depression (Bradley & Rumsfeld, 2015). Furthermore, depression was
observed within 10% for the healthy population, compared to 20-30% in cardiovascular
patients (Whooley, 2006). In additional to cardio-vascular disease, other chronic
conditions known to be associated with shiftwork include diabetes and colorectal cancer
(Gan et al., 2014; Knutsson & Kempe, 2014; Schernhammer et al., 2003).
Decline in cognitive responses are seen more frequently during the night shift
than the day shift, such as in the incidences of Chernobyl and Three Mile Island (Folkard
& Tucker, 2003). In one study examining this decline, efficiency markers measuring call
response, errors, and action response fell below average for those working between
22:00 h and 6:00 h. In comparison to the morning shift, afternoon and night shift
workers had an increased risk for detrimental incidences related to alertness and
concentration, which could be life-threatening to others on duty: risk was not only the

7
highest in the night shift group but accumulated over working successive night shifts
(Folkard & Tucker, 2003).
Emotional responses influenced by shiftwork include poor mental health and
lower quality of life (Kalmbach et al., 2015). These altered mental states may stem from
an interrupted family and social life in addition to other factors. Certain professions,
such as police officers, are particularly susceptible to work-related stress due to the
nature of the job description. Stress is of academic importance due to the potential
negative effect it has on shift workers, causing a variety of negative outcomes such as
alcoholism, physical illness, suicide and depression (Zukauskas et al., 2009). Stress and
other health consequences of working night shifts may stem from interrupted and
incomplete sleep patterns, which don’t allow the body to fully rejuvenate (Harrington,
2001).
2.2 Shiftwork and Sleep Disruption
Maintaining a regular, healthy sleep pattern may be difficult for shift workers, in
addition to the difficulty of deceiving the body to reverse external light cues and sustain
homeostasis (Costa, 2010). The International Classification of Sleep Disorders, originally
used for research, provides diagnoses for sleep disorders including insomnias, sleep-
related breathing disorders, sleep-related movement disorders and more. One of the
eight sections is dedicated to circadian rhythm sleep disorders which provides a specific
type for shiftwork; it is defined by “complaints of insomnia or excessive sleepiness that
8
occur in relation to work hours being scheduled during the usual sleep period” (Thorpy,
2012).
Because shift workers are forced to reverse their circadian rhythms, hours of
sleep are not only reduced, but so is the quality (Harrington, 2001; Costa, 2010).
Conditions in the environment during the day are not conducive to a proper sleep
session due to traffic noises and natural lighting. It is estimated that shift workers have a
sleep deficit of around 2 – 4 hours of sleep each day and lack the proper REM (rapid eye
movement) sleep needed to rejuvenate the processes of the body (Costa, 2010).
Diminished hours of sleep could result in increased on-site fatigue and accidents in
addition to decreased job performance (Harrington, 2001). Additionally, cumulative
night shifts may cause increased severity of on-site fatigue and accidents (Costa, 2010).
One study examining insomnia and fatigue in shift workers estimates the prevalence to
be around 32% and 26%, respectively (Drake et al., 2004). The disruption of this sleep-
wake cycle increases the chances of developing numerous morbidities including
depression (Drake et al., 2004).
2.3 Shiftwork and Depression
In 2008, the World Health Organization (WHO) estimated that around 151
million will suffer from depression and that it will be the leading cause of disability-
adjusted life years in 2030 (World Health Organization [WHO], 2008). However, WHO
currently estimates the prevalence of depression to be around 300 million people
world-wide (WHO, 2017). With depression increasing at such an alarming rate, mental

9
health has become a focus area in public health. Additionally, the Global Burden of
Disease Study (2010) calculated 2.5 billion disability-adjusted life years (DALYs), which
represents one year of healthy life lost to disability, attributed to mental health. Mental
and substance use disorders represented 7.4% of the DALYs in 2010; 3% of them
attributed to depressive disorders and 2.5% attributed to major depressive disorder
(Ferrari et al., 2013). Depression often does not act alone on the body, but is associated
with other co-morbidities such as diabetes, CVD, cancer, and other physical disorders
(Wirth et al, 2017a; Hansen et al., 2016; Spiegel & Giese-Davis, 2003).
Among South Korean nurses, there was an association between shiftwork and
severity of self-reported symptoms of depression, even after adjusting for
socioeconomic status and health behaviors; many other studies found similar results
(Lee et al., 2015; Yoon &Kim, 2013;Zhao & Turner, 2008; Eldevik et al., 2013). Other
studies noted an association between working hours and depressive symptoms, one
stating that symptoms were seen in those who worked >55 hours per week, with
another one declaring a 17% increase in depressive symptoms for every 10-hour
increase in working hours (Virtanen et al., 2011). Kim et al. (2013) identified a dose-
response relationship between shiftwork and depressive symptoms in those working
≥60 hours per week compared to those who worked <60 hours per week. Many
observational studies have found a relationship between the risk of mental illnesses and
night shiftwork (Bildt & Michélsen, 2002; Driesen et al., 2011; Kim et al., 2011). A recent
meta-analysis by Lee et al., not only found a relationship between overall night shift
10
work and increased levels of depression, but also within subgroups such as gender,
night shift duration, continent, and type of occupation (Lee et al., 2017).
Driesen et al. designed a study to look at the possible association between work
schedule and experiencing a depressed mood. Depression was assessed dichotomously
by “Did you feel down every day over the last two weeks?” (Driesen et al., 2010). Mood
in shift workers was compared to mood in day workers from a sample of 8,843
participants in the Maastricht Cohort Study. A higher prevalence of depressed mood
was observed in shift workers compared to day workers, with more men displaying the
symptoms than women (Driesen et al., 2010). In another study, a higher prevalence of
major depressive disorder was found in women than men when examining those
exposed to shiftwork. An association was not only found in current shift workers,
assessed by two psychiatric scales, but also in former shift workers. An increased
lifetime risk of the depressive disorder was discovered in those with longer durations of
shiftwork (up to 20 years) (Scott et al., 1997).
One study examined the relationship between circadian rhythm sleep disorder
and psychiatric complaints in those who are low sensitive sleepers compared to those
who are high sensitive sleepers, referring to how well they sleep through sleep
disruptions. Findings from this study concluded that highly sensitive sleepers, in relation
to work-related sleep issues, were at a higher risk for depressive symptoms (Kalmbach
et al., 2015). Therefore, sleep-related disorders, frequently linked to adverse health
outcomes, are almost inevitable in shift workers who are sensitive sleepers.
11
In regard to long-term effects, shiftwork performed for ≥ 4 years increased the
risk of poor mental health for men and women (Bara & Arber, 2009). More specifically,
men working nights and women working varied shifts for ≥ 4 years experienced the
increased risk (Bara & Arber, 2009). This association may be explained by stress and/or
disrupted sleep patterns.
2.4 Police Officers and Adverse Health Outcomes
Generally, police officers have worse health prognoses than the general
population (Leischik et al., 2015; Ramey et al., 2012). As previously mentioned, many
outcomes associated with police work stem from poor sleep patterns and stress.
Psychologically speaking, police officers must be in top mental shape in order to excel at
their job and minimize work-related stress and injuries. Poor mental health has the
potential to cause long-term effects such as physical illness, emotional disorders, family
problems such as divorce and domestic violence, excessive drinking and drug use, and
suicide (Kelley, 2005). Reports of mental health are usually self-reported or assessed
from self-reported depression scales and are therefore are underreported. Our current
knowledge of the prevalence of poor mental health and police officers most likely shows
a weak relationship compared to the real prevalence. Suicide rates for police officers are
two to three times the rate of the general population. These incidences are preceded by
depression, feelings of hopelessness, and stressors (Miller, 2005).
Stress, a common factor observed in police officers, plays a major role on sleep
and poor sleep plays a major role on on-site fatigue (Collins & Gibbs, 2003). This endless

12
cycle wreaks havoc on the body and has additional after-affects such as irritability,
inflammation, and risk of chronic diseases. Additionally, many studies conclude that
police officers have a high rate of obesity, which could be due to stress and poor sleep
habits and cause a variety of adverse health outcomes (Charles et al., 2007; Da Silva et
al., 2015). Obesity and depression are co-morbidities that may be a result from stress,
displaying a bidirectional relationship (Jantaratnotai et al., 2017). Many studies show a
relationship between obesity and depression, one study observing depressive symptoms
in >30% of obese subjects compared to healthy subjects (Rosmond 2004; Castanon et
al., 2015; Pan et al., 2012; Lin et al., 2013).
2.5 Police Officers and Risk of Chronic Diseases
A higher prevalence of metabolic disorders was observed in a police cohort
which has been associated with diabetes and CVD (Thayyil et al., 2012; Hartley et al.,
2011). Poor sleep has an impact on carbohydrate metabolism and endocrine function
which may explain the high morbidity of metabolic syndrome (Charles et al., 2007).
Officers working the midnight shift and who had less than 6 hours of sleep had a higher
risk of developing metabolic syndrome components (Violanti et al., 2010). Metabolic
syndrome is accompanied by a variety of anthropological and biochemical abnormalities
that is a dominant predecessor of CVD-related events.
CVD is a common morbidity/mortality in the police field and is associated with
sleep disorders or sleep interruptions, possibly resulting from shiftwork (Ramey et al.,
2012). Additionally, police officers tend to exhibit risk factors associated with CVD such

13
as high waist circumference, BMI, percentage of body fat, and serum levels of insulin
and glucose (Violanti et al., 2010; Thayyil et al., 2012). The slight alteration of circadian
rhythms could result in certain levels of inflammatory biomarkers to fluctuate, resulting
in CVD-related events such as CHD, hypertension, and atherosclerosis (Rajaratnam et al.,
2011). Commonly studied inflammatory biomarkers include C-reactive protein (CRP) and
tumor necrosis factor – α (TNF) and when seen in excess, an injury or infection is
assumed to be present such as a chronic disease (Puttonen, 2011; Khosro et al., 2011).
Subsequently, inflammation is a warning sign for CVD-related events, which are
frequently seen in police officers (Puttonen, 2011; Van Mark et al., 2010).
The prevalence of cancer is high among police officers, more specifically cancers
of the colon, bladder, kidney, lung, skin, and digestive organs (Ramirez et al., 2005;
Wirth et al., 2013). This could be attributed to many occupational exposures such as
radiation from radar guns, exposure to chemical hazards, and ultraviolent radiation (Gu
et al., 2011). However, lifestyle factors may play a carcinogenic role from decreased
physical activity, poor sleep quality, and smoking habits.
2.6 Police Officers and Lifestyle Factors
Police officers tend to exhibit poor health behaviors and live a relatively
sedentary lifestyle, displaying earlier mortality compared to other populations (Violanti
et al., 2013) An earlier study found that on average, white male police officers died
around 7 years earlier compared to the general U.S white male population (Hartley et
al., 2011). Lifestyle factors such as poor diet, lack of beneficial exercise, smoking, and

14
excessive drinking lead to adverse health outcomes associated with the occupation
(Thayyil et al., 2012). One study involving the Buffalo Cardio-Metabolic Occupational
Police Stress study (BCOPS) observed that the number of current smokers among the
cohort of officers was 3.1% higher compared to the general population, and that obesity
among officers was 8.4% higher (Hartley et al., 2011). Due to occupational stress, police
officers are observed to have decreased physical activity and increased food
consumption, therefore consuming a high-fat diet (Violanti et al., 2013). Working night
shifts may trigger shift workers to eat unhealthily and consume extra calories. In order
to deal with stress, officers frequently utilize coping mechanisms such as excessive
alcohol and drugs. When failure to cope appears, a high prevalence of suicide and
divorce is seen in police officers (Anderson et al., 2002). Many of the lifestyle factors and
adverse health outcomes originate from stress, which is almost inevitable in police
officers.
2.7 Stress as a Pathway to Depression
Most literature agrees on the relationship between police officers and stress,
some stating that it is the most stressful law enforcement position (He, 2002; Gershon
et al., 2009). Officers tend to run into “fight-or-flight” situations, which cause a variety
of internal events to happen, including the shutdown of the digestive system, increased
muscular tension, and increased heart rate (Anderson et al., 2002). With repetitive
exposure to these situations, officer’s bodies experience chronic stress. Officers are
particularly susceptible to chronic stress which not only develops into other diseases

15
such as metabolic syndrome and heart disease, but also causes poor job performance
and decreased job satisfaction (Garbarino & Magnavita, 2015; Anderson et al., 2002;
Habersaat at al., 2015; Gershon et al., 2009). Common sources of police stress include
stress from the work environment, availability of peer support and trust, social and
family influence, bureaucratic characteristics of police organizations, and accessibility of
coping mechanisms (He, 2002). For years, the development of depression has been
preceded by long-term psychosocial stress (Chen et al., 2006).
Because officers tend to have poor sleep patterns, they are at a higher risk for
stress. In turn, insomnia is a risk factor for depression (Ramey et al., 2012; Rajaratnam et
al., 2011; Garbarino & Magnavita, 2015; Gershon et al., 2009). Around 26% of medical
retirement in the police forces in due to psychological disorders. Even more alarming, it
appears that levels of stress-related mental health disorders has not improved over the
past 10 years (Collins & Gibbs, 2003; Gershon et al., 2009). It has been shown that
officers have an increased risk for developing psychological problems, with much of the
stress and depressive symptoms occurring as early as their first year of service (Wang et
al., 2010; Habersaat et al., 2015). Because of the overwhelming evidence of stress
leading to depression, stress was examined as a potential effect modifier of depressive
symptoms.
2.8 Police Officers and Depression
Rates of depression appear to be higher in police officers compared to the
general population, with stress being the main culprit (Wang et al., 2010; Habersaat et

16
al., 2015). Habersaat et al. aimed to look at the health of police officers and
dichotomized them into low and high-risk clusters. Those in the high-risk cluster had less
subjective social status, less decision latitude, less social support, and increased
loneliness. The study found that the high-risk cluster had strong associations with poor
mental health and reported more depressive symptoms (Habersaat et al., 2015).
Additionally, suicide rates in police officers are alarmingly high, continue to climb, and
are most often seen in those with a history of depression (Miller, 2005).
2.9 Supporting Research
Relevant to the BCOPS data set, Hartley et al. found an association between
stress and depression in officers. Life events not related to work such as a death of a
close one or an argument with a spouse, were associated with higher depression scores
(Hartley et al., 2007). Events related to work such as exposure to dead bodies, also
displayed monotonic trends with depression scores. This study also observed less
traumatic work-related incidences in those who were older compared to the younger
officers. This could be because older officers have seniority over shift/area so younger
officers are placed in areas with higher criminal activity. In the pilot study from 2001 –
2003, about 16% of the cohort scored 16 points or greater on the CES-D, meaning they
experience depressive symptomology.
Another BCOPS study found a higher prevalence of suicide ideation and
depression in police officers than the general population (Violanti et al., 2008).
Furthermore, Buffalo, NY police officers had a three-fold risk of suicide than a

17
population of municipal workers (Violanti et al., 2009). In the same dataset, exposure to
multiple negative life events was significantly associated with a higher depression score
(Hartley et al., 2007). Past studies serve as evidence of depression and altered mental
states present in police officers.
2.10 Gaps
This study will assess the relationship between shiftwork and self-reported
depression with a longitudinal design. There is limited research on this association with
the longitudinal design, particularly when using police officers as the study population.
Most other studies use nurse cohorts, which are mainly comprised of females, unlike
the BCOPS dataset. Because stress is associated with depression, an advantage to this
study is the number of stress inventories provided at each visit (PSS, IES, and SPSS).
Shiftwork exposures, calculated from electronic payroll records, include long-term and
short-term shiftwork as well as number of shift changes. This study hopes to determine
whether exposure to certain types of shiftwork, or disruptions of circadian rhythms,
modifies scores from self-reported depression inventories

18
CHAPTER 3
METHODS
3.1 Data
The BCOPS study primarily examined work-related stress in relation to subclinical
CVD and metabolic disorders in a cohort of police officers from Buffalo, New York. A
total of 710 active officers were invited to voluntarily participate and provided informed
consent; protocols were approved by the National Institute for Occupational Safety and
Health Human Subjects Review Board (Ma et al., 2015). Data from cross-sectional
analyses were collected for each officer for the baseline analysis (visit 3 [v3]) on a single
examination date between 2004 and 2005 (N=470). Data was then collected for the
second visit (visit 4 [v4]) on a single date in 2010 (N= 271). Collections included
biomarkers for stress and CVD in addition to anthropometric and questionnaire data
(Violanti et al., 2006).
3.2 Self-reported Depression scales
Depression was measured from two self-reported questionnaires, the Beck
Depression Inventory-II (BDI) and the Center for Epidemiological Studies Depression
scale (CES-D). Developed in 1961, the BDI consists of 21 items, measuring severity of
attitudes and symptoms of depression, is tailored to the general population, and can be

19
completed in approximately 10 minutes (Beck et al., 1961; Groth-Marnat, 1990).
Symptoms, including changes in sleep pattern and appetite, are assessed over the
previous 2 weeks. Scores range from 0 – 63; interpreted by mild depression (14-19),
moderate depression (20-28), and severe depression 29-63 (Smarr & Keefer, 2011).
Reliability for the BDI resulted in high alpha coefficients for outpatients (0.92)
and college students (0.93): Coefficients remained significant for most other populations
tested. A correlation of 0.92 was observed in a test-retest reliability study in a group of
26 outpatients (p < .001) where questionnaires were administered at therapy sessions
spaced one week apart (Smarr & Keefer, 2011). To improve the validity, the BDI-II was
derived from a previous scale, the BDI-1A. The BDI-II, referred to as “BDI” in this study, is
worded differently to accommodate DMS-IV criteria for depression. A previous study
evaluated validation between the BDI-II and the BDI-1A (N=191) and resulted with a
correlation of 0.92 (p<.001), with the mean of the BDI-II being 2.92 points higher than
the BDI-1A (Smarr & Keefer, 2011). Additionally, a validity study between the BDI-II and
the Hamilton Rating Scale for Depression yielded a correlation of 0.71 in outpatient
clinics (Smarr & Keefer, 2011). Assessed in a group of patients who had post-stroke
depression, the BDI had an internal consistency of 0.83, sensitivity of 80.0, and
specificity of 61.4. In this population, overall accuracy did not differ for minor and major
depression (Aben et al., 2002).
In this study, BDI was utilized as both continuous and categorical. A cut-off value
of 14 was used to dichotomize results, comparing officers who had no depressive

20
symptoms to those who had mild to severe depressive symptoms. Those with a score of
14 or greater on the BDI were classified as having depressive symptoms. Potential cut-
off points greatly varied between populations with limited research being conducted to
validate cut-off points for the BDI against this study’s specific population (Seignourel et
al., 2008; Dolle et al., 2012; Su et al., 2007; Carney et al, 2009). Therefore, a value of 14
was chosen as the cut-off point because it encompassed all levels of depressive
symptoms (mild, moderate, and severe). From a population of cardiac inpatients,
sensitivity and specificity for a cut off of 14 was 58% and 91%, respectively (Forkmann et
al., 2009).
The CES-D was created in 1977, revised in 2004, and consists of 20 items related
to sadness, loss of interest, appetite, sleep, thinking, guilt, fatigue, agitation, and suicidal
ideation to measure symptoms of depression. Participants respond to the self-
administered questionnaire with choices ranging from “not at all or less than one day
last week” to “nearly every day for 2 weeks”. The responses are scored by an algorithm
and dichotomized; clinical depression is indicated by a score of ≥ 16 (Smarr & Keefer,
2011).
Tests of reliability generated a relatively high internal consistency, with a
coefficient α of 0.85 for the general population. Because the CES-D assesses current
depressive symptoms, the test-retest correlations were between 0.45 and 0.70 with
stronger correlations observed in shorter testing times (Smarr & Keefer, 2011). As for
validity, the CES-D correlated well with other depression scales including the Bradburn

21
Negative Affect and the Lubin manual, with coefficients ranging from 0.51 – 0.61. An
additional correlation of 0.49 was found between clinical interview ratings of depression
and the CES-D (Smarr & Keefer, 2011).
Sensitivity and specificity of the CES-D, which has a current cut-off of 16, were
86.7% and 76.6% respectively (Shean and Baldwin, 2008). One study aimed to assess the
generalizability of the scale over many different populations; it determined the scale
was appropriate for Black and White English-speaking American populations of both
sexes with a wide range of age and socioeconomic status. In this study, a coefficient α of
0.80 or greater was seen across different subgroups. Results declared the scale had high
internal consistency, appropriate test-retest stability (0.40 or above), ample construct
validity, and concurrent validity by clinical criteria (Radloff, 1977).
3.3 Shiftwork Information
Shiftwork information was obtained via electronic payroll records. Shifts were
classified by their start time and categorized into day/morning shift (04:00 -11:00 h),
typically the referent group, evening shift (12:00 - 19:59 h) and night shift (20:00 and
03:59 h) (Wirth et al., 2017b). Length of shift and shift category were then collected
from the first day of work or when records became available (i.e., 1994) until their date
of examination. Shift information was then standardized on a weekly basis and the
officers were classified into one of the three shift categories based on where the largest
percent of work hours fell. For about 85% of officers, 70% of work hours were spent
primarily in one shift type. Consistency of this process was validated over 30, 60, or 90
22
days, and 5 years prior to examination date (Wirth et al., 2011). Shiftwork was examined
as long-term and short-term. Long-term shiftwork was the primary shift the officer
worked from 1994 or start of employment until the clinic date, whereas short-term
shiftwork was the primary shift the officer worked over the past two weeks prior to
their examination. Analyses were done by comparing the day shift to the evening/night
shift, in addition to each category (i.e., evening and night) separately. For these
analyses, the day shift served as the referent level. Number of shift changes is another
shiftwork category utilized in the study which was defined as the number of times an
officer switched shifts during the duration of the study.
3.4 Covariates and Confounders
Covariates from the data set include demographic information (age, sex, race,
education, officer rank), BMI (kg/m2), calories, tobacco and alcohol usage, lipid
biomarkers (glucose and triglycerides(mg/dl)), blood pressure (mmHg), fruit and
vegetable intake, and measures of quality of sleep (Pittsburgh Sleep Quality Index
[PSQI]).
The PSQI assesses sleep quality and patterns over the previous month and
measures 7 aspects such as sleep duration, disruptions, and medications. Responses are
to be applied to the majority of days they experienced the question within the last
month. After calculations, results are dichotomized into poor sleep (≥5) and good sleep
(≤4) (Buysse et al., 1989). The PSQI has high internal homogeneity, reliability, and
validity (Buysse et al., 1989; Grandner et al., 2006). Lipid panels were obtained from a

23
staff phlebotomist after the officer fasted for a minimum of 12 hours. Specimens were
then sent to Kaleida laboratories in Buffalo, NY and analyzed on the Beckman Coulter
LX20.
The Spielberger Police Stress Survey (SPSS) consists of stress ratings applied to
common events prevalent in police work and can be scored from 0 – 100. Scores are
then calculated by multiplying the cumulative rating by the frequency of categories from
the past year or month depending on the frequency, then creating an overall summary
score. The Perceived Stress Scale (PSS) measures global stress levels instead of event-
specific stress. The 14 items of this inventory are responded to by a 5-point scale
ranging from “never” to “very often” and assess situations over the responder’s past
month. Total impact of events (IES) measures PTSD symptoms and is calculated from a
revised impact of events scale (IES-R) and the PTSD Checklist Civilian version (PCL-C).
The IES-R consists of 22 items addressing impact and symptoms related to traumatic
events. Items are assessed over the last 7 days and are rated on a scale of 1 – 5. The
PCL-C, which focuses on how much the individual has been bothered by PTSD events,
consists of 17 items that are assessed on a scale of 1-5.
3.5 Statistical Analysis
All analyses were conducted in SAS v. 9.4 (SAS Institute, Cary, NC, USA).
Outcomes were the CES-D, which ranges from 0-60 with a recommended depression
classification ≥16, and the BDI, which ranges from 0-63 with a recommendation of mild
depression ≥14. Correlation coefficient between both questionnaires was greater than
0.60 (p<0.001). The main exposure was shiftwork, assessed by long-term shiftwork,

24
short-term shiftwork, and number of shift changes. Analyses examined long and short-
term shiftwork on 2 levels (day vs evening/night) and 3 levels (day vs evening vs night).
Descriptive statistics for categorical variables were obtained from frequencies
and chi-squared tests. Means and standard deviations were calculated for numeric
variables. Normality was assessed from skewness (< 3.00), kurtosis (< 7.00), and the
Shapiro-Wilks test (>0.90). If normal, the t-test was utilized. If normality was violated,
the Wilcoxon rank sum test was used. P-values for descriptive tables compared the day
shift to the evening/night shifts. These analyses were repeated for visit 3 (Table 4.1),
visit 4 (Table 4.2), and a comparison of visit 3 characteristics of those who did and did
not attend visit 4 (Table 4.3).
To build the models, covariates with a p-value of ≤0.20 were added a crude
model using PROC MIXED with a compound symmetry covariance matrix. Those with a
p-value > 0.20 were not included in further analyses. Based off high p-values (p ≥ 0.05),
those that didn’t change the beta coefficient for shiftwork more than 10% were
removed from the model one at a time. In circumstances where the beta coefficient was
extremely small, a change of 30% was utilized for variable removal. This built the final
models for the depression scores in numeric form and all 5 exposure variables (long-
term shiftwork – 2 level, long-term shiftwork – 3 level, short-term shiftwork – 2 level,
short-term shiftwork – 3 level, number of shift changes). Time (i.e., clinic visit in
2004/2005 or 2010) was added to all models. Number of shift changes were

25
transformed into tertiles. This created the shift change category of 0-17 (referent), 18-
48, and 49+ shift changes. Final models were used in logistic regression as well.
In the linear regression models, depressive symptoms were assessed as a
numeric variable with greater values indicating more depressive symptoms for both the
BDI and CES-D. Normality was assessed through residuals and histograms. PROC MIXED
was used to calculate least squares means and to obtain mean values and their 95%
confidence intervals and compound symmetry as a covariance structure. Long-term
shiftwork was evaluated by day, evening, and night, in addition to day and
evening/night, with the day shift serving as the referent category (Aim 1). The
categorized number of shift changes also was evaluated, with the referent category 0 –
17 shift changes (Aim 1). Short-term shiftwork was assessed by day, evening, and night
in addition to day and evening/night, with the day shift serving as the referent category
(Aim 2).
In the logistic regression model, results were dichotomized from the CES-D and
BDI. For the CES-D the referent group was < 16 and the BDI had a referent group of < 14.
Logistic regression was used to measure the possible association between the
dichotomized depression measures and the shiftwork measures. PROC GENMOD was
used with an estimate statement to obtain ORs and their 95% confidence intervals.
Shiftwork variables were the same as described above.
Additionally, the stress measures were examined as effect modifiers.
Correlations between all stress measures were performed. All correlations were under

26
0.60 and therefore were assessed separately and treated as effect modifiers. Cut points,
determined from the medians, for the stress measures were 9 on the IES, 27 on the PSS,
and 3,285 for the SPSS; higher scores indicate higher levels of self-reported stress.

27
CHAPTER 4
RESULTS
From the original population of 470 officers, exclusions included those that were
missing all exposure and outcome variables. For visit 3, 37 officers were excluded for
missing all three shiftwork measures and 5 officers were excluded for missing the two
depression measures, resulting in a sample of 428 officers for visit 3. For visit 4, 6
officers were excluded because of missing all three shiftwork measures and 4 officers
because of missing depression measures, resulting in a sample of 261. A total of 199
officers were loss to follow up. The visit 3 (baseline) population consisted of 318 males
and 110 females and visit 4 consisted of 188 males and 73 females. The average age in
this population was 42.6±7.9. Most officers were European-American (78%), never
smokers (50%), a rank of police officers as opposed to captains or detectives (66%) and
had an average BMI (kg/m2) of 29.3±4.8. Compared to the day shift, those who worked
the evening/night shift were more likely to be European-American (89% vs. 68%, p
<0.01), younger (39.9± 7.0 vs. 46.1± 7.6, p<0.01), and a police officer (74% vs. 54%,
p<0.01). Triglyceride levels (mg/dl) were significantly higher in the evening/night shifts
compared to the day shift (139.0±99.5 vs. 123.7±108.4, p<0.01). 11% of officers
classified as depressed on the CES-D and 11% of officers had mild, moderate, or severe
depressive symptomology on the BDI (Table 4.1)

28
Characteristics for the officers in visit 4 were similar, with most officers being
European-Americans (79%), never smokers (59%), and had a rank of police officers as
opposed to captains or detectives (54%). Compared to the day shift, evening/night shift
workers were younger (46.2±6.5 vs. 51.8±7.3, p<0.01), had higher BMI levels (kg/m2)
(30.7±5.1 vs. 29.2±4.7, p = 0.02), and higher triglyceride levels (133.0±95.7 vs.
113.3±79.1, p = 0.01). 13% of officers classified as depressed on the CES-D and 10% of
officers had mild, moderate, or severe depressive symptomology on the BDI (Table 4.2)
Table 4.3 compares those who attended visit 4 to the 167 officers who did not
follow up. Those who did not attend visit 4 were more likely to have less than a college
education (17% vs 9%, p <0.01), a rank categorized as “Other” (18% vs 4%, p <0.01) and
be slightly older (43.8±8.6 vs 41.9±7.3, p = 0.02). Compared to those who attended visit
4, those that did not attend had higher scores on the CES-D (8.0±7.5 vs. 7.7±6.5) and BDI
(7.5±7.8 vs 6.0±5.8) in the samples, although results were not significant
(p=0.72,p=0.71). Additionally, those that did not attend visit 4 had higher sample scores
on IES (12.6±11.8 vs 11.8±13.1, p=0.15) and PSS (20.7±7.9 vs 20.1±7.7, p = 0.51)(Table
4.3).
No associations were found from the repeated measures linear regression
models. When examining the long-term shiftwork and depression measures, no
relationship was found for either outcome. The short-term shiftwork measures in
relation to the CES-D and BDI did not produce any statistically significant results either.
The 3-level long and short-term shiftwork groups for the evening group consistently had

29
the highest crude mean values for depression scores, however, they did not differ from
the day shift. There was no association between number of shift changes and
depression scores (Table 4.7-4.9)
The logistic regression models yielded statistically significant results for long-
term shiftwork and BDI. The odds of having self-reported depressive symptoms by the
BDI among those working the evening shift were 4.90 times the same odds in those
working the day shift (95% CI = 1.20-19.57, p=0.02), after adjusting for sex, race, age,
PSS, IES, and PSQI. Additionally, the odds of BDI-classified mild depression was higher
among the evening/night shift groups compared to the day shift (OR = 4.60, 95% CI =
1.15-18.39, p=0.03). Overall, the odds of depressive symptoms were highest among the
evening shift group using either the CES-D and BDI to define depressive symptoms.
P-values for interaction terms between stress and shiftwork are listed in Table
4.6. Values were obtained for each stress measure. For the CES-D measures, statistically
significant interactions were found between shiftwork and the IES. Statistically
significant interactions were also found between shiftwork and the PSS for the BDI
measurements.
Pearson correlations coefficients between stress measures were all below 0.60.
Because the correlation coefficients were in the low to moderate range, it was assumed
that the stress measures were not highly correlated with one another. Therefore, the
relationship between shiftwork and depression was assessed between all stress
measures separately (Table 4.7-4.9). When stress and sleep measures were removed

30
from models, results did not vary by much. There were no statistically significant results
from the SPSS or IES stratified tables. Significant results were observed for stratification
by the PSS between long-term shiftwork and BDI: For those who scored > 26 on the PSS,
higher depressive symptoms were observed in those who primarily worked the
evening/night shift than those who primarily worked the day shift (p= 0.05)(Table 4.8).
For those that scored ≤ 26 on the PSS, the relationship between 2-level long-term
shiftwork and BDI had a much lower mean value, however, it was not statistically
significant (p=0.99). Overall, those who scored higher on the stress questionnaires had
higher mean values of depressive symptoms.

31
Table 4.1: Visit 3 Characteristics of the Study Population by Shift Type, Buffalo Cardio-Metabolic Police
Stress study (BCOPS), 2004-2005 (N=428)
Characteristics All
(n=428)
Day
(n=188)
Evening+Night
(n=240)
p-value1
Sex <.01
Female 110 (26%) 77 (41%) 33 (14%)
Male 318 (74%) 111 (59%) 207 (86%)
Race
European-American
Other
Education
< College
Some College
Associates Degree
>Bachelor’s Degree
Tobacco Usage
Never
Former
Current
Rank
Police Officer
Serg., Lieut., Capt.
Detective
Other
Age (years)
BMI (kg/m2)
DII
Drinks per week
Systolic BP (mmHg)
Diastolic BP (mmHg)
Glucose (mg/dL)
Global PSQI2
SPSS
PSS
331 (78%)
91 (22%)
52 (12%)
147 (34%)
88 (21%)
141 (33%)
212 (50%)
96 (23%)
115 (27%)
280 (66%)
66 (15%)
42 (10%)
40 (9%)
42.6±7.9
29.3±4.8
-0.7±2.1
5.7±9.7
121.4±12.2
77.8±10.0
92.9±11.7
6.5±3.4
2290.1±1276.1
20.3±7.8
131 (70%)
55 (30%)
25 (13%)
69 (37%)
41 (22%)
53 (28%)
86 (46%)
57 (31%)
42 (23%)
102 (54%)
35 (19%)
22 (12%)
29 (15%)
46.1±7.6
28.9±5.2
-1.0±2.2
5.9±10.3
121.1±12.9
77.3±10.1
93.4±13.1
6.4±3.7
2332.1±1326.2
20.5±7.9
200 (85%)
36 (15%)
27 (11%)
78 (32%)
47 (20%)
88 (37%)
126 (53%)
39 (16%)
73 (31%)
178 (74%)
31 (13%)
20 (8%)
11 (5%)
39.9±7.0
29.7±4.5
-0.4±2.1
5.6±9.3
121.7±11.9
78.3±9.9
92.6±10.5
6.6±3.1
2257.9±1238.2
20.2±7.7
<.01
0.33
<.01
<.01
<.01
0.07
<.01
0.36
0.65
0.31
0.52
0.46
0.55
0.71
IES
Triglycerides (mg/dl)
BDI
CES-D
12.1±12.6
132.3±103.6
5.99±5.76
7.8±6.92
12.6±13.2
123.7±108.4
6.31±5.72
7.57±6.65
11.7±12.1
139.0±99.5
5.75±5.8
7.99±7.12
0.46
<.01
0.44
0.53
Stratum numbers may not equal column total due to missing data.
p-values based off chi-squared tests for categorical variables and t-test/Wilcoxon ranked sums for continuous
variables depending on normality
1comparing day vs. evening and night
Abbreviations: PSQI - Pittsburg Sleep Quality Index, CES-D - The Center for Epidemiological Studies Depression scale,
SPSS – Spielberger Police Stress Survey, PSS – Perceived Stress Scale, DII – Dietary Inflammatory Index, BMI – Body
Mass Index, IES – Impact of Events, BDI – Beck Depression Inventory

32
Table 4.2: Characteristics of the Study Population with Follow-up Data by Shift Type, Buffalo Cardio-
Metabolic Police Stress study (BCOPS), 2010 (N=261)
Characteristics All
(n=261)
Day
(n=126)
Evening+Night
(n=135)
p-value1
Sex <0.01
Female 73(28%) 53(42%) 20(15%)
Male 188(72%) 73(58%) 115(85%)
Race
European-American
Other
Education
< College
Some College
Associates Degree
>Bachelor’s Degree
Tobacco Usage
Never
Former
Current
Rank
Police Officer
Serg., Lieut., or Capt.
Detective
Other
Age (years)
BMI (kg/m2)
DII
Drinks per week
Systolic BP (mmHg)
Diastolic BP (mmHg)
Glucose (mg/dL)
Global PSQI
SPSS
PSS
204(79%)
55 (21%)
23 (9%)
91(35%)
49(19%)
98(37%)
155(59%)
80(31%)
25(10%)
139(54%)
55(21%)
53(21%)
10(4%)
48.9±7.4
29.9±5.0
-1.2±1.9
5.5±9.9
117.2±11.0
78.4±7.8
97.2±22.0
6.5±3.6
18030.8±14416.9
18.7±7.7
85(68%)
40(32%)
13(10%)
49(39%)
23(18%)
41(33%)
69(55%)
45(36%)
11(9%)
66(53%)
27(22%)
26(21%)
5(4%)
51.8±7.3
29.2±4.7
-1.3±2.1
5.6±11.1
118.0±11.4
77.8±7.8
97.1±19.3
6.2±3.8
15986.9±13576.0
18.6±7.7
119(89%)
15(11%)
10(7%)
42(32%)
26(19%)
57(42%)
86(64%)
35(26%)
14(10%)
73(55%)
28(21%)
27(20%)
5(4%)
46.2±6.5
30.7±5.1
-1.1±1.8
5.5±8.6
116.4±10.5
79.1±7.8
97.3±24.2
6.8±3.5
19721.3±14916.3
18.7±7.8
<0.01
0.33
0.21
0.99
<0.01
0.02
0.42
0.16
0.25
0.18
0.41
0.17
0.04
0.94
Total Impact of Events
Triglycerides (mg/dl)
BDI
CES-D
12.0±12.9
123.5±88.5
5.98±5.82
8.54±7.29
12.6±13.1
113.3±79.1
5.87±5.71
8.49±6.45
11.5±12.7
133.0±95.7
6.06±5.94
8.60±8.02
0.56
0.01
0.77
0.90
Stratum numbers may not equal column total due to missing data.
p-values based off chi-squared tests for categorical variables and t-test/Wilcoxon ranked sums for continuous
variables depending on normality
1comparing day vs. evening/night shift groups
Abbreviation: PSQI, Pittsburg Sleep Quality Index, CES-D, The Center for Epidemiological Studies Depression Scale, DII
– Dietary Inflammatory Index, BMI – body mass index, SPSS – Spielberger Police Stress Survey, PSS – Perceived Stress
Scale, BDI – Beck Depression Inventory

33
Table 4.3: Population Characteristics by Attendance at 2010 Clinic Visit, Buffalo Cardio-Metabolic Police
Stress study (BCOPS) (N=428)
Characteristics Yes2
(n=261)
No2
(n=167)
p-value1
(Yes vs. No)
Sex 0.18
Female 73(28%) 37(22%)
Male 188(72%) 130(78%)
Race
European-American
Other
Education
< College
Some College
Associates Degree
>Bachelor’s Degree
Tobacco Usage
Never
Former
Current
Rank
Police Officer
Sergeant, Lieutenant, or Captain
Detective
Other
Age (years)
Body Mass Index (kg/m2)
Dietary Inflammatory Index
Drinks per week
Systolic BP (mmHg)
Diastolic BP (mmHg)
Glucose (mg/dL)
Global PSQI
Total Spielberger Police Stress score
Total Perceived Stress Score
204(79%)
55(21%)
23(9%)
91(35%)
49(19%)
98(37%)
133(51%)
59(23%)
66(26%)
180(69%)
44(17%)
27(10%)
10(4%)
41.9±7.3
29.0±4.6
-0.7±2.1
5.6±9.0
120.9±11.8
77.1±9.8
92.1±10.7
6.5±3.4
2339.9±1243.3
20.1±7.7
127(78%)
36(22%)
29(17%)
56(34%)
39(23%)
43(26%)
79(48%)
37(22%)
49(30%)
100(60%)
22(13%)
15(9%)
30(18%)
43.8±8.6
29.9±5.0
-0.7±2.2
5.9±10.9
122.3±12.9
79.0±10.2
94.3±13.0
6.5±3.2
2211.0±1326.6
20.7±7.9
0.84
<0.01
0.64
<0.01
0.02
0.08
0.95
0.56
0.26
0.06
0.05
0.98
0.31
0.51
Total Impact of Events (IES)
Triglycerides (mg/dl)
Beck Depression Inventory (BDI)
CES-D
11.8±13.1
124.5±92.6
6.0±5.8
7.7±6.5
12.6±11.8
144.8±118.3
7.5±7.8
8.0±7.5
0.15
0.11
0.71
0.72
Stratum numbers may not equal column total due to missing data. 1p-values based on chi-squared tests for categorical variables and t-test/Wilcoxon ranked sums for
continuous variables depending on normality 2Yes = those that attended both visits, No = those that only attended visit 3
Abbreviation: PSQI, Pittsburg Sleep Quality Index, CES-D, The Center for Epidemiological Studies
Depression Scale

34
Table 4.4: Adjusted Mean Values and 95% Confidence Intervals of Depression Measures for
Long-term and Short-term Shiftwork and Shift Changes, Buffalo Cardio-Metabolic Police Stress
study (BCOPS), 2004/2005 – 2010 (N=689)
CES-D p-valueg BDI p-valueg
Short-Term SW
Day 7.29(6.06-8.53)a Ref. 6.02(5.39-6.64)c Ref.
Evening 7.42(5.91-8.92) 0.83 6.70(5.79-7.60) 0.16
Night 6.99(5.24-8.64) 0.66 5.96(4.86-7.07) 0.93
Evening/Night 7.26(5.84-8.67) 0.95 6.44(5.63-7.24) 0.32
Long-term SW
Day 7.93(7.19-8.66)b Ref. 5.72(5.06-6.39)d Ref.
Evening 8.35(7.42-9.28) 0.46 6.37(5.51-7.24) 0.21
Night 7.79(6.72-8.87) 0.83 5.81(4.78-6.84) 0.88
Evening/Night
8.13(7.32-8.94) 0.68 6.16(5.40-6.93) 0.35
Shift Changes
0-17 8.10(7.07-9.13)e Ref. 6.13(5.35-6.91)f Ref.
18-48 8.02(7.04-9.00) 0.88 5.54(4.79-6.29) 0.22
49+ 7.86(6.93-8.79) 0.67 6.21(5.43-6.98) 0.88
Values represent least-square means and 95% confidence intervals via general linear models
All models adjusted for a time point aModel adjusted for sex, race, smoke, rank, age, PSS, BMI, DII, SPPS, drinks per week, IES, and PSQI bModel adjusted for sex, race, age, PSS, SPSS, IES, and PSQI cModel adjusted for sex, race, age, PSS, IES, DII, and PSQI dModel adjusted for sex, race, age, PSS, IES, and PSQI eModel adjusted for sex, race, age, rank, PSS, IES, and PSQ fModel adjusted for sex, race, age, DII, triglycerides, PSS, IES, and PSQI gp-value comparing day to evening, day to night, or day to evening/night
Abbreviations: CES-D – Center for Epidemiological Studies Depression scale, BDI – Beck Depression
Inventory, PSS – perceived stress scale, BMI – body mass index, DII – dietary inflammatory index, SPPS –
Spielberger Police Stress Score, IES – total impact of events, PSQI – Pittsburgh Sleep Quality Index

35
Table 4.5: Odds Ratios and 95% Confidence Intervals of Depression Measures for Long-term
and Short-term Shiftwork and Shift Changes, Buffalo Cardio-Metabolic Police Stress study
(BCOPS), 2004/2005 – 2010 (N=689)
CES-D p-valueg BDI p-valueg
Short-Term SW
Day Ref.a Ref. Ref.c Ref.
Evening 0.87(0.30-2.50) 0.80 1.28(0.33-4.88) 0.72
Night 0.51(0.19-1.38) 0.18 0.97(0.23-4.16) 0.97
Evening/Night 0.75(0.29-1.93) 0.55 1.19(0.34-4.12) 0.79
Long-term SW
Day Ref.b Ref. Ref.d Ref.
Evening 1.75(0.64-4.79) 0.28 4.90(1.20-19.57) 0.02
Night 1.39(0.45-4.28) 0.57 3.74(0.68-20.45) 0.13
Evening/Night
1.64(0.63-4.27) 0.31 4.60 (1.15-18.39) 0.03
Shift Changes
0-17 Ref.e Ref. Ref.f Ref.
18-48 1.50 (0.66-3.42) 0.34 0.77(0.20-3.00) 0.71
49+ 1.09(0.40-2.95) 0.86 1.63(0.41-6.56) 0.49
Exposed groups for the dependent variables are as follows: CES-D ≥ 16 ; BDI ≥ 14
All models adjusted for a time component aModel adjusted for sex, race, smoke, rank, age, PSS, BMI, DII, SPPS, drinks per week, IES, and PSQI bModel adjusted for sex, race, age, PSS, SPSS, IES, and PSQI cModel adjusted for sex, race, age, PSS, IES, DII, and PSQI dModel adjusted for sex, race, age, PSS, IES, and PSQI eModel adjusted for sex, race, age, rank, PSS, IES, and PSQI fModel adjusted for sex, race, age, DII, triglycerides, PSS, IES, and PSQI gp-value comparing day to evening, day to night, or day to evening/night
Abbreviations: CES-D – Center for Epidemiological Studies Depression scale, BDI – Beck Depression
Inventory, PSS – perceived stress scale, BMI – body mass index, DII – dietary inflammatory index, SPPS –
Spielberger Police Stress Score, IES – total impact of events, PSQI – Pittsburgh Sleep Quality Index

36
Table 4.6: Interaction Term P-values of Depression Measures Across Categories of Shiftwork and Stress
Measures, Buffalo Cardio-Metabolic Police Stress study (BCOPS), 2004/2005 – 2010 (N=689)
CES-Da,b,e BDIc,d,f
IES
Long-term (D vs E/N) 0.63 0.75
Long-term (D v E v N) 0.78 0.90
Short-term (D v E/N) 0.04 0.39
Short-term (D v E v N) 0.07 0.55
Number of Shift Changes 0.37 0.63
PSS
Long-term (D vs E/N) 0.34 0.04
Long-term (D v E v N) 0.20 0.10
Short-term (D v E/N) 0.75 0.38
Short-term (D v E v N) 0.08 0.73
Number of Shift Changes 0.19 0.07
SPSS
Long-term (D vs E/N) 0.67 0.31
Long-term (D v E v N) 0.88 0.47
Short-term (D v E/N) 0.35 0.68
Short-term (D v E v N) 0.57 0.99
Number of Shift Changes 0.21 0.18 aModel adjusted for sex, race, smoke, rank, age, PSS, BMI, DII, SPPS, drinks per week, and PSQI
bModel adjusted for sex, race, age, PSS, SPSS, and PSQI
cModel adjusted for sex, race, age, PSS, DII, and PSQI
dModel adjusted for sex, race, age, PSS, and PSQI
eModel adjusted for sex, race, age, rank, PSS , and PSQ
fModel adjusted for sex, race, age, DII, triglycerides, PSS, and PSQI
All models adjusted for a time component
gp-value for interaction between depression scales and shiftwork
Abbreviations: CES-D – Center for Epidemiological Studies Depression scale, BDI – Beck Depression Inventory, PSS –
perceived stress scale, DII – dietary inflammatory index, SPPS – Spielberger Police Stress Score, IES – total impact of
events, PSQI – Pittsburgh Sleep Quality Index
37
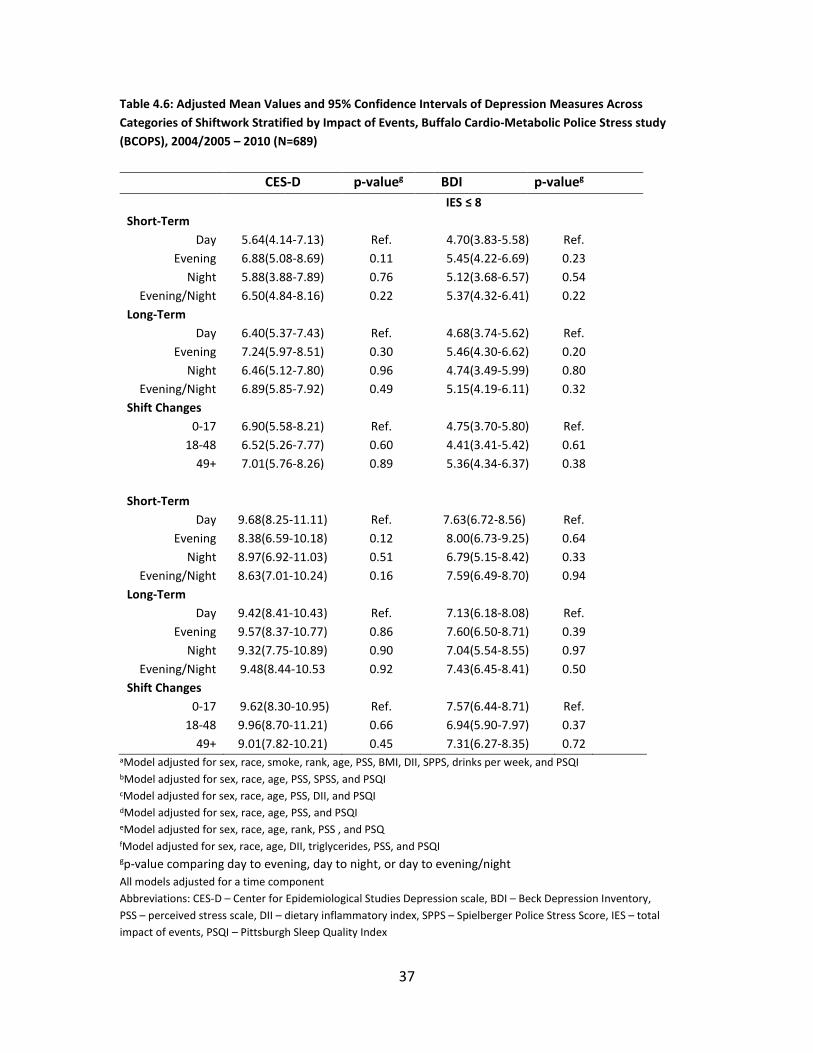
Table 4.6: Adjusted Mean Values and 95% Confidence Intervals of Depression Measures Across
Categories of Shiftwork Stratified by Impact of Events, Buffalo Cardio-Metabolic Police Stress study
(BCOPS), 2004/2005 – 2010 (N=689)
CES-D p-valueg BDI p-valueg
IES ≤ 8
Short-Term
Day 5.64(4.14-7.13) Ref. 4.70(3.83-5.58) Ref.
Evening 6.88(5.08-8.69) 0.11 5.45(4.22-6.69) 0.23
Night 5.88(3.88-7.89) 0.76 5.12(3.68-6.57) 0.54
Evening/Night 6.50(4.84-8.16) 0.22 5.37(4.32-6.41) 0.22
Long-Term
Day 6.40(5.37-7.43) Ref. 4.68(3.74-5.62) Ref.
Evening 7.24(5.97-8.51) 0.30 5.46(4.30-6.62) 0.20
Night 6.46(5.12-7.80) 0.96 4.74(3.49-5.99) 0.80
Evening/Night 6.89(5.85-7.92) 0.49 5.15(4.19-6.11) 0.32
Shift Changes
0-17 6.90(5.58-8.21) Ref. 4.75(3.70-5.80) Ref.
18-48 6.52(5.26-7.77) 0.60 4.41(3.41-5.42) 0.61
49+ 7.01(5.76-8.26) 0.89 5.36(4.34-6.37) 0.38
Short-Term
Day 9.68(8.25-11.11) Ref. 7.63(6.72-8.56) Ref.
Evening 8.38(6.59-10.18) 0.12 8.00(6.73-9.25) 0.64
Night 8.97(6.92-11.03) 0.51 6.79(5.15-8.42) 0.33
Evening/Night 8.63(7.01-10.24) 0.16 7.59(6.49-8.70) 0.94
Long-Term
Day 9.42(8.41-10.43) Ref. 7.13(6.18-8.08) Ref.
Evening 9.57(8.37-10.77) 0.86 7.60(6.50-8.71) 0.39
Night 9.32(7.75-10.89) 0.90 7.04(5.54-8.55) 0.97
Evening/Night 9.48(8.44-10.53 0.92 7.43(6.45-8.41) 0.50
Shift Changes
0-17 9.62(8.30-10.95) Ref. 7.57(6.44-8.71) Ref.
18-48 9.96(8.70-11.21) 0.66 6.94(5.90-7.97) 0.37
49+ 9.01(7.82-10.21) 0.45 7.31(6.27-8.35) 0.72 aModel adjusted for sex, race, smoke, rank, age, PSS, BMI, DII, SPPS, drinks per week, and PSQI
bModel adjusted for sex, race, age, PSS, SPSS, and PSQI
cModel adjusted for sex, race, age, PSS, DII, and PSQI
dModel adjusted for sex, race, age, PSS, and PSQI
eModel adjusted for sex, race, age, rank, PSS , and PSQ
fModel adjusted for sex, race, age, DII, triglycerides, PSS, and PSQI
gp-value comparing day to evening, day to night, or day to evening/night
All models adjusted for a time component
Abbreviations: CES-D – Center for Epidemiological Studies Depression scale, BDI – Beck Depression Inventory,
PSS – perceived stress scale, DII – dietary inflammatory index, SPPS – Spielberger Police Stress Score, IES – total
impact of events, PSQI – Pittsburgh Sleep Quality Index

38
Table 4.7: Adjusted Mean Values and 95% Confidence Intervals of Depression Measures Across
Categories of Shiftwork Stratified by Perceived Stress Score, Buffalo Cardio-Metabolic Police Stress
study (BCOPS), 2004/2005 – 2010 (N=689)
CES-D p-valueg BDI p-valueg
PSS ≤ 26
Short-Term
Day 6.01(4.65-7.37) Ref. 5.68(4.94-6.41) Ref.
Evening 6.29(4.63-7.95) 0.70 5.94(4.91-6.97) 0.61
Night 4.99(3.24-6.75) 0.17 5.18(4.00-6.36) 0.46
Evening/Night 5.70(4.17-7.23) 0.60 5.65(4.76-6.53) 0.98
Long-Term
Day 6.93(6.07-7.79) Ref. 5.49(4.70-6.28) Ref.
Evening 7.08(6.00-8.15) 0.84 5.60(4.61-6.59) 0.74
Night 6.45(5.28-7.63) 0.49 5.10(3.98-6.21) 0.64
Evening/Night 6.80(5.89-7.71) 0.83 5.37(4.55-6.22) 0.99
Shift Changes
0-17 6.84(5.70-7.98) Ref. 5.37(4.50-6.25) Ref.
18-48 7.12(6.00-8.21) 0.66 5.23(4.38-6.08) 0.79
49+ 6.82(5.79-7.86) 0.97 5.47(4.61-6.33) 0.86
PSS > 26
Short-Term
Day 11.45(9.61-13.29) Ref. 7.78(6.55-9.01) Ref.
Evening 10.02(7.63-12.40) 0.24 8.89(7.17-10.61) 0.25
Night 13.53(9.71-17.35) 0.29 7.75(4.29-11.21) 0.99
Evening/Night 10.75(8.53-12.96) 0.54 8.66(7.08-10.24) 0.34
Long-Term
Day 11.95(10.39-13.51) Ref. 7.34(5.91-8.78) Ref.
Evening 12.41(10.69-14.14) 0.69 9.00(7.53-10.47) 0.09
Night 14.48(11.61-17.35) 0.12 9.88(7.35-12.42) 0.08
Evening/Night 12.90(11.35-14.45) 0.37 9.19(7.87-10.51) 0.05
Shift Changes
0-17 13.15(11.02-15.27) Ref. 8.85(6.93-10.77) Ref.
18-48 11.55(9.88-13.22) 0.19 7.12(5.75-8.50) 0.13
49+ 13.47(11.39-15.56) 0.82 9.87(8.21-11.53) 0.43
aModel adjusted for sex, race, smoke, rank, age, BMI, DII, SPPS, drinks per week, IES, and PSQI bModel adjusted for sex, race, age, SPSS, IES, and PSQI cModel adjusted for sex, race, age, IES, DII, and PSQI dModel adjusted for sex, race, age, IES, and PSQI eModel adjusted for sex, race, age, rank, IES, and PSQI fModel adjusted for sex, race, age, DII, triglycerides, IES, and PSQI gp-value comparing day to evening, day to night, or day to evening/night
All models adjusted for a time component
Abbreviations: CES-D – Center for Epidemiological Studies Depression scale, BDI – Beck Depression Inventory,
PSS – perceived stress scale, BMI – body mass index, DII – dietary inflammatory index, SPPS – Spielberger Police Stress Score,
IES – total impact of events, PSQI – Pittsburgh Sleep Quality Index

39
Table 4.8: Adjusted Mean Values and 95% Confidence Intervals of Depression Measures Across
Categories of Shiftwork Stratified by the Spielberger Police Stress Survey, Buffalo Cardio-Metabolic
Police Stress study (BCOPS), 2004/2005 – 2010 (N=689)
CES-D p-valueg BDI p-valueg
SPSS ≤ 3,285
Short-Term
Day 7.15(5.69-8.62) Ref. 6.28(5.37-7.20) Ref.
Evening 7.84(5.98-9.70) 0.39 6.92(5.54-8.30) 0.39
Night 7.16(7.23-9.10) 0.99 6.13(4.75-7.50) 0.83
Evening/Night 7.54(5.84-9.21) 0.57 6.52(5.42-7.63) 0.69
Long-Term
Day 7.84(6.79-8.89) Ref. 6.24(5.24-7.24) Ref.
Evening 8.42(7.19-9.64) 0.44 6.28(5.12-7.44) 0.95
Night 7.95(6.58-9.31) 0.91 6.08(4.80-7.37) 0.84
Evening/Night 8.22(7.17-9.27) 0.56 6.21(5.23-7.19) 0.99
Shift Changes
0-17 8.00(6.74-9.27) Ref. 6.35(5.31-7.39) Ref.
18-48 8.63(7.37-9.89) 0.35 6.19(5.13-7.25) 0.80
49+ 7.62(6.19-9.05) 0.63 5.80(4.51-7.09) 0.47
SPSS > 3,285
Short-Term
Day 7.49(6.09-8.88) Ref. 5.87(5.07-6.67) Ref.
Evening 7.12(5.42-8.82) 0.61 6.57(5.51-7.64) 0.23
Night 6.84(4.75-8.93) 0.52 5.87(4.24-7.49) 0.99
Evening/Night 7.03(5.49-8.58) 0.51 6.39(5.42-7.36) 0.32
Long-Term
Day 8.01(7.05-8.97) Ref. 5.59(4.75-6.44) Ref.
Evening 8.29(7.12-9.47) 0.71 6.64(5.59-7.69) 0.10
Night 7.60(6.16-9.04) 0.63 5.73(4.45-7.02) 0.85
Evening/Night 8.04(7.03-9.05) 0.96 6.31(5.39-7.23) 0.22
Shift Changes
0-17 8.48(7.08-9.89) Ref. 6.16(5.04-7.28) Ref.
18-48 7.61(6.36-8.85) 0.28 5.22(4.25-6.19) 0.18
49+ 8.18(7.06-9.30) 0.70 6.50(5.59-7.42) 0.62
aModel adjusted for sex, race, smoke, rank, age, PSS, BMI, DII, drinks per week, IES, and PSQI bModel adjusted for sex, race, age, PSS, IES, and PSQI cModel adjusted for sex, race, age, PSS, IES, DII, and PSQI dModel adjusted for sex, race, age, PSS, IES, and PSQI eModel adjusted for sex, race, age, rank, PSS, IES, and PSQI fModel adjusted for sex, race, age, DII, triglycerides, PSS, IES, and PSQI gp-value comparing day to evening, day to night, or day to evening/night
All models adjusted for a time component
Abbreviations: CES-D – Center for Epidemiological Studies Depression scale, BDI – Beck Depression Inventory,
PSS – perceived stress scale, BMI – body mass index, DII – dietary inflammatory index, SPPS – Spielberger Police Stress Score,
IES – total impact of events, PSQI – Pittsburgh Sleep Quality Index

40
CHAPTER 5
DISCUSSION
There were no significant results in the linear regression models. However, when
the outcome was dichotomized, long-term shiftwork increased the odds of depressive
symptoms. Significant results between shiftwork and depressive symptoms were not
found at stratums of the IES and SPSS. For the high stress category of PSS, there was an
increase in depressive symptoms between long-term shiftwork and BDI. The general
trend for the stratification of IES and PSS was that higher mean values of depressive
symptoms were associated with the higher stress levels regardless of shiftwork status;
indicating that stress may increase depressive symptoms more than shiftwork. However,
pursuing this hypothesis was outside the scope of this thesis.
Previous studies have found an association between night shiftwork and
depressive symptomology. A meta-analysis of 11 studies that included cross-sectional
and longitudinal study designs found a relationship between shiftwork and risk of
depressive symptomology. Only 1 of these studies adjusted for level of stress and many
were cross-sectional, not being able to assess causality of shiftwork on depression (Lee
et al., 2017). Some of these studies consisted of a female population, which may
produce different results than the predominantly male population of BCOPS (Bildt &
Michelsen 2002; Oyane et al., 2013; Lee et al., 2016). Out of the studies in the meta-
41
analysis, only 2 used the BDI and none used the CES-D. Other inventories used were the
GHQ: Anxiety/Depression, DSM-III: sub-clinical depression, 2 different scales from the
World Health Organization (Bara & Arber, 2009 ; Bildt & Michelsen, 2002; Ohayon and
Hong, 2006; Park et al., 2016). All scales had questions derived from different aspect of
depression, decreasing consistency between questionnaires. Even between the two
depression questionnaires utilized in this study, there were differences in questions and
responses which could account for the variety of results from literature.
From the meta-analysis, the study with the lowest measure of association and
most similar to this study was between shiftwork and depressive symptomology was
from the Korean Working Conditions Survey. Although their study found an association
between shiftwork and depressive symptoms, they also mentioned exposure to stress at
work was associated with depressive symptoms. The relationship between work stress
and depressive symptoms was even found in a general population of shift workers who
may not have as much work-related stress as police officers (Park et al., 2016). Because
depression is related to stress, reverse causation is a possibility meaning that stress may
cause depression or depression may cause stress. Examining reverse causality was not in
the scope of this study but should be assessed in future studies.
A study from the Korean National Health and Nutrition Examination Survey (K-
NHANES) did not find an association between shiftwork and depressive symptoms. The
prevalence of night shift workers and depressive symptoms was very low, 12.1% and
10.2% respectively, which could explain why they did not see a relationship (Kim et al.,

42
2013). Our study also had low levels of those who were classified as having depressive
symptoms, potentially attenuating results. Although the initial sample size was 470, the
final population in this study at time-point two had a relatively small sample size
(N=271) due to survival bias and loss-to-follow up. Those who left the force may have
had more depressive symptoms or switched to the day shift, which could explain the
limited significant results.
Past literature shows a relationship between shiftwork in nurses and depressive
symptomology. The Korean Nurses’ Health Study (KNHS) found a relationship between
shiftwork and depressive symptoms however this study did not have the ability for
temporal ordering or causality due to the study design. This study also had a broad
definition of shiftwork compared the BCOPS cohort that reported shiftwork
electronically (Lee et al., 2015). Another study on nurses that found an association
between shiftwork and depression used self-reported data to determine shift changes,
questioning the validity of exposure (Lee et al., 2016).
On the other hand, longitudinal studies on shiftwork and depression have mixed
results. One study took a nationally representative sample of households in Britain to
assess number of years working night shift and number of years working varied shift
patterns, which were both self-reported. Outcome data on mental health and
anxiety/depression was self-reported as well. With exposure and outcome data self-
reported, it is possible to find results that over or underestimate the true association.
The study also found that performing shiftwork for greater than 4 years is associated

43
with poor mental health for men and women (Bara & Arber, 2009). A causal relationship
between shiftwork and depressive symptoms with the BCOPS data may appear with a
longer study design.
A unique study examined nurses who had no shiftwork history and found a
drastic increase in psychological symptoms for those who worked the night shift (Bohle
& Tilley, 1989). Those that were classified as working the night shift rotated between
day, evening and night compared to those that only rotated between day and evening.
In relation to this BCOPS study, it is possible that those who have experience with
shiftwork have better adapted to the reversal of circadian rhythms and do not have as
apparent depressive symptoms (West et al., 2007; Bohle& Tilley, 1989). Those that
immediately start shiftwork may see the most dramatic effects of psychological issues
(Bohle & Tilley, 1989). We were not able to assess this theory due to the lack of
shiftwork history of the officers.
Biological mechanisms such as melatonin production may affect results, however
a measurement was not available for the cohort. Because of the disturbed sleep-wake
cycle initiated from shiftwork, many physiological functions are disrupted including core
temperature, cortisol levels, and melatonin levels (Pandi-Perumal et al., 2006). The
release of melatonin is reduced in those with depression which may explain the linkage
to an altered sleep/wake cycle. Furthermore, the brain region involved with regulation
of the sleep/wake cycle is also involved with depression (Salgado-Delgado et al., 2011).
Melatonin receptors are located in the SCN, the “master clock” of the body, highly

44
affected by changes in circadian rhythms. Also located in the SCN are neurotransmitters
which greatly affect mood (Monteleone et al., 2011). Light cues are transmitted to the
SCN from retinal cells, which then communicate with neurotransmitters such as
serotonin as well as melatonin (Arendt, 2009). In those not working shifts, circadian
rhythms still alter mood, therefore, by working shifts, this association may become
exacerbated. Those with depression typically have worse episodes in the morning
(Monteleone et al., 2011). In this study, it is possible that those working the day shift
still had relatively high levels of depression occurring in the morning, underestimating
the results for the night and/or evening shifts. Furthermore, the time when the
questionnaires were administered could affect the results, especially if depressive
symptoms were more prevalent in the morning as previous literature states
(Monteleone et al., 2011).
Seasonal affective disorder (SAD) may be present in the officers as well,
however we did not have a variable to adjust for at the time of analysis. SAD is defined
as in increase in depressive symptoms accompanied by hyperinsomnia. Because this
disorder is governed by changes in the amount of light between seasons, SAD occurs
primarily in the winter, when days are shorter and night is longer, and diminishes in the
spring (Sandman et al, 2016; Salgado-Delgado et al., 2011). Those who completed their
questionnaires in the winter may have reported higher depressive symptoms than those
who completed their questionnaires in the spring, summer, and early autumn, especially
those working the night shift. Results from this study may be attenuated if
questionnaires were completed in spring or summer.

45
Other biological mechanisms related to shiftwork include the alteration of
inflammatory biomarkers. Increases in biomarkers such as interleukin-6, tumor necrosis
factor-alpha, and c-reactive proteins and are associated with working the night shift
(Puttonen, 2011; Khosro et al., 2011). These markers have been associated with major
depression as well. Chronic inflammation is a pathway to major depression, therefore,
the lack of sufficient inflammatory biomarkers for analysis in this longitudinal study may
have underestimated the results (Leonard, 2007).
The significant results for 2-level long-term shiftwork and BDI scores in the linear
regression models have relatively large confidence intervals (OR = 4.90, 95% CI = (1.20-
19.57))(Table 4.5). The large confidence intervals may be due to the relatively small
sample size; however, at minimum, we estimate there is a 20% increase in odds for
those working the evening/night shift compared to the day shift in regard to depressive
symptoms. This same concept can be applied to 3-level long-term shiftwork and BDI (OR
= 4.60, 95% CI (1.15-18.39)). We estimate that this group has a least a 15% increase in
odds for the night shift compared to the day shift when examining depressive
symptoms.
It is possible that by only observing significant ORs for long-term shiftwork and
BDI, associations are only present for those exposed to a high-risk long-term shiftwork
category. On the contrary, short-term shiftwork and BDI did not produce significant
results. Previous studies observed depressive symptoms in those working shiftwork for
>4 years and >20 years, establishing a potentially long latency period for depressive

46
symptoms (Scott et al., 1997; Bara & Arber, 2009). An overall trend from the models is
that the highest ORs or crude mean values are observed in the evening group compared
to the day or night group (Tables 4.4-4.5). Officers who work the night shift and have
severe depressive symptoms may be moved to a lower-risk shiftwork category such as
the evening which could be a reasoning for these results. Many times, shifts are
assigned based on seniority. If day shifts weren’t available for those with severe
depression or psychological issues, they may be placed on the evening shift or leave the
occupation all together.
The two significant results only from the BDI may be due to the design of the
questionnaires. Responses for the BDI are direct such as “0 – I don’t feel disappointed in
myself”, “1 – I’m disappointed in myself”, “2 – I am disgusted with myself”, and “3 – I
hate myself” while the CES-D has frequency responses of “Rarely or None of the Time”,
“Some of Little of the Time”, “Moderately or Much of the time”, and “Most or Almost All
the Time”. It may be that by reading the statement of emotion, officers were better able
to assess their lifestyle than the quantitative responses from the CES-D.
Another rationale for observing a relationship in long-term shift and BDI
compared to the CES-D is due to the cut-point utilized. Because of the distribution of
scores, 14 was used as the cut-off which encompasses mild, moderate, and severe
depression. For the BDI, an association was found for the logistic model but not for the
linear model. Because most of the data was around the median of the data set, there
may not be a linear relationship between the depression scales and shiftwork. For

47
instance, at visit 3, there were no officers who scored between 29 and 63, classified as
severe depression. Most scores (89%) were between 0 and 13.
Associations were not present between the number of shift changes and the
outcomes. Because the variable only accounts for shift changes, regardless of what shift,
it is possible that few of them experienced many night shifts or rapid changes between
the night and day shift, which would result in irregular circadian rhythmicity. For BDI,
crude results were significantly higher for those at the high-risk groups (49+ shift
changes), however for CES-D, the low-risk group had significantly greater depressive
symptoms (Table 4.4). This may be further evidence of the difference between each
questionnaire. The BDI measures severity of attitudes of depressive symptoms which
may provide a better assessment of symptomology than the quantitative responses
from the CES-D. The BDI also is tailored to the general population, so those who have
many shift changes, may drastically score higher than the average person and higher
than the typical cut-points. As for the high crude values for the CES-D in the 0-17
category, it is possible that survivor bias was present because those that don’t have
many shift changes are assigned to one primary shift and do not move around because
they have more depressive symptoms.
Results also were stratified by the stress measures because stress in general is
associated with depression (Duman, 2014; Monroe et al, 2014). Those that did not
attend visit four had slightly higher scores for the IES and PSS, which could bias results
towards the null in addition to the self-reported design of the questionnaires. However,

48
in the stratification tables for IES and PSS, higher crude depression scores were
observed in the high stress category compared to the low stress category. This could be
due to the variability between stress inventories. SPSS measures events specifically
related to police work, PSS measures non-specific stressful events, and IES measures
stress related to traumatic events. It is not surprising that scores from these stress
measures were not highly correlated due to the different stressful events they assess. It
is possible that stress has more of an impact on depression than shiftwork.
Strengths of this study include the variety of covariates available. Shiftwork
status was reported electronically, allowing for accurate reporting and creation of
different shiftwork variables. Additionally, shift duration was known which minimized
exposure misclassification. The results of this study are generalizable to other police
departments, although some utilize different work scheduling. Results may also be
applicable to other high-stress, shift working populations such as the military. It is
unlikely that depressive symptoms led someone to want to work the night shift. The use
of repeated measures more accurately estimates the standards errors of our estimated
values, leading to more precise testing.
Responder and survivor bias may have underestimated the outcome. Because
the outcomes were self-reported, officers may feel the need to suppress their feelings
of depression due to social desirability. Furthermore, it was not possible to clinically
define the outcome with the current data. The outcome questionnaires assessed
behaviors over the last 2 weeks. Events such as marriage, birth of a child, the death of a

49
close one, or divorce could under or over-estimate results. Because of the nature of this
job, survivor bias also may be present, especially since there was a 36% decrease in the
population between visits and percentage of those with depressive symptoms were all
lower than 15%. Those who would classify as severely depressed may have chosen to
leave the occupation or primarily work the day shift, underestimating associations.
Another limitation to this study is the absence of total shiftwork history. Because some
literature states an exacerbated state of depression for those working shifts greater
than 10 years, total shiftwork history may have led to misclassification (Scott et al.,
2007).

50
CHAPTER 6
CONCLUSION
Due to mixed results of associations between shiftwork and mental health
problems, there may not have been an association because work in general has a
positive effect, monetarily and socially (Hall et al., 2017). Although models were
adjusted for sex, it should be noted that previous literature describes different effects of
shiftwork on males and females (Bara and Arber, 2009; Driesen et al., 2011; Moon et al.,
2015). From a previous study involving the BCOPS data, women who primarily worked
the day shift had higher prevalence of suicide ideation than those working the evening
or night shifts, whereas an increase in suicide ideations for males were present in those
who primarily worked the night shift (Violanti et al., 2008). Future studies should
examine the effects of shiftwork and the biological differences of males and females,
using biomarkers instead of self-reported data.
Future studies should perform a longitudinal analysis over a greater time frame
due to literature citing as association for longer durations of shiftwork associated with
depression. A study involving the military may help limit confounders due to the
probable uniformity of lifestyle factors and documented shiftwork histories. More
research is needed on biomarkers of depression to increase validity of the outcome and
association with shiftwork. Future action should include policies regulating night

51
shiftwork and irregular patterns of shiftwork not only in police populations but other
shift working occupations as well. Interventions should be implemented that target
stress reduction, tools for healthy sleep patterns and resources for mental health issues.
Partnering with local psychologists may offer an outlet for stress and traumatic events
associated with police work in hopes of reducing suicide and the development of
depression.

52
REFERENCES
Aben I, Verhey F, Lousberg R, et al. (2002). Validity of the Beck Depression Inventory,
Hospital Anxiety and Depression Scale, SCL-90, and Hamilton Depression
Rating Scale as Screening Instruments for Depression in Stroke Patients.
Psychosomatics. 43(5): 386-393
Anderson GS, Litzenberger R, Plecas D. (2002). Physical evidence of police officer
stress. Policing: An International Journal of Police Strategies & Management.
25(2): 399-420
Arendt J. (2009). Melatonin and Human Rhythms. The Journal of Biological and Medical
Rhythm Research. 23(1): 21-37
Bara AC, Arber S. (2009). Working shifts and mental health – findings from the British
Household Panel Survey (1995-2005). Scandinavian Journal of Work,
Environmental & Health. 35(5): 361-367
Beck, A.T., Ward, C. H., Mendelson, M., Mock, J., & Erbaugh, J. (1961). An inventory
for measuring depression. Archives of General Psychiatry. 4: 561-57

53
Bohle P, Tilley AJ. (1989). The impact of night work on psychological well-being.
Ergonomics. 32(9): 1089-109
Bradley SM, Rumsfeld JS. (2015). Depression and cardiovascular disease. Trends in
Cardiovascular Medicine. 25(7): 614-62
Bildt C, Michélsen H. (2002). Gender differences in the effects from working conditions
on mental health: a 4-year follow-up. International Archives of Occupational and
Environmental Health. 75: 252-8
Buysse, DJ. Reynolds CF, Monk TH, Berman SR, Kupfer DJ. (1989). The Pittsburgh
Sleep Quality Index (PSQI): A new instrument for psychiatric research and
practice. Psychiatry Research. 28(2): 193-213
Carney CE, Ulmer C, Edinger JD, Krystal AD, Knauss F. (2009). Assessing depression
symptoms in those with insomnia: An examination of the beck depression
inventory second edition (BDI-II). Journal of Psychiatric Research. 43(5): 576-
582
Castanon N, Luheshi G, Laye S. (2015). Role of neuroinflammation in the emotional and
cognitive alterations displayed by animal models of obesity. Frontiers in
Neuroscience. 9:1-14

54
Centers for Disease Control and Prevention. (2016). NIOSH Data and Statistics Gateway.
Retrieved from: https://www.cdc.gov/niosh/data/default.html
Charles LE, Burchfield CM, Fekedulegn, et al.(2007). Obesity and sleep: The
Buffalo Police health study. Policing: An International Journal of Police
Strategies and Management. 30(2): 203-214
Chen H, Chou FH, Chen M, et al. (2006). A survey of quality of life and depression
for police officers in Kaohsiung, Taiwan. Quality of Life Research.15: 925-
932
Collins PA, Gibbs ACC. (2003). Stress in police officers: a study of the origins,
prevalence and severity of stress-related symptoms within a county police
force. Occupational Medicine. 53(4): 256-264
Costa G. (2010). Shift Work and Health: Current Problems and Preventive Actions.
Safety and Health at Work. 1(2): 112-123
Da Silva F, Hernandez S, Concalves E, et al. (2015). Anthropometric indicators of
obesity in policemen: A systematic review of observational studies. International
Journal of Occupational Medicine and Environmental Health. 27(6):891-901
Dolle K, Schulte-Korne G, O’Leary AM, et al. (2012). The Beck Depression Inventory-II

55
in adolescent mental health patients: Cut-off scores for detecting depression and
rating severity. Psychiatry Research. 200(2-3):843-848
Drake CL, Roehrs T, Richardson G et al. (2004). Shift work sleep disorder: prevalence
and consequences beyond that of symptomatic day workers. Sleep. 27(8):1453-
62
Driesen K, Jansen N, Kant I, Mohren D, van Amelsvoort L. (2010). Depressed Mood in
the Working Population: Associations with Work Schedules and Working Hours.
The Journal of Biological and Medical Rhythm Research. 27(5):1062-1079
Driesen K, Jansen NW, van Amelsvoort LG et al. (2011). The mutual relationship
between shift work and depressive complaints – a prospective cohort study.
Scandinavian Journal of Work and Environmental Health. 37: 402 – 410
Duman RS. (2014). Neurobiology of Stress, Depression, and Rapid Acting
Antidepressants: Remodeling Synaptic Connections. Depression and Anxiety.
31(4): 291-296
Eldevik M.F., Flo E., Moen B., Pallesen S. & Bjorvatn B.(2013). Insomnia, excessive
sleepiness, excessive fatigue, anxiety, depression and shift work disorder in
nurses having less than 11 hours in-between shifts. PLoS . 8(8): e70882

56
Ferrari AJ, Charlson FJ, Norman RE et al. (2013). Burden of Depressive Disorders by
Country, Sex, Age, and Year: Findings from the Global Burden of Disease Study
2010. PLOS. 10(11): e1001547
Folkard S, Tucker P. (2003). Shift work, safety and productivity. Occupational Medicine.
53:95-101
Forkmann T, Vehren T, Boecker M, et al. (2009). Sensitivity and specificity of the Beck
Depression Inventory in cardiologic inpatients: How useful is the conventional
cut-off score? Journal of Psychosomatic Research. 67(4): 347-352
Fritschi L, Glass DC, Heyworth JS, Aronson K et al. (2011). Hypotheses for mechanisms
linking shiftwork and cancer. Medical Hypotheses. 77(3):430-436
Garbarino S, Magnavita N. (2015). Work Stress and Metabolic Syndrome in Police
Officers. A Prospective Study. PLOS. 10(12) e0144318
Gan Y, Yang C, Tong X, et al (2014).Shift work and diabetes mellitus: a meta-analysis of
observational studies. Journal of Occupational and Environmental Medicine.
72:161-162
Gershon RR, Barocas B, Canton AN, et al. (2009). Mental, physical, and behavioral
outcomes associated with perceived work stress in police officers. Criminal

57
Justice and Behavior. 36(3): 275-289
Grandner M, Kripke D, Yoon I, Youngstedt S. (2006). Criterion Validity of the
Pittsburgh Sleep Quality Index: Investigation in a Non-Clinical Sample. Sleep and
Biological Rhythms. 4: 129-136
Groth-Marnat G. (1990). The handbook of psychological assessment (2nd ed.). New
York: John Wiley & Son
Gu JK, Charles LE, Burchfiel CM, Violanti JM. (2011). Cancer Incidence Among Police
Officers in a U.S Northeast Region: 1976 – 2006. International Journal of
Emergency Mental Health. 13(4): 279-289
Hall AL, Franche R, Koehoorn M. (2017). Examing Exposure Assessment in Shift Work
Research: A Study on Depression Among Nurses. Annals of Work Exposures and
Health
Habersaat SA, Geiger AM, Abdellaoui S, et al. (2015). Health in police officers: Role of
risk factor clusters and police divisions. Social Science and Medicine. 143: 213-
222
Hansen AB, Stayner L, Hansen J, Andersen ZJ. (2016). Night shift work and incidence of
diabetes in the Danish Nurse Cohort. Journal of Occupational and Environmental

58
Medicine. 73(4): 262-8
Hartley TA, Burchfiel CM, Fekedulegn, Andrew ME, Violanti JM. (2011). Health
Disparities in Police Officers: Comparisons to the U.S General Population.
International Journal of Emergency Mental Health and Human
Resilience. 13(4):211-220
Harley TA, Violanti JM, Fekedulegn D, Andrew ME, Burchfiel CM. (2007).
Associations Between Major Life Events, Traumatic Incidents, and Depression
Among Buffalo Police Officers. International Journal of Emergency Mental
Health. 9(1): 25-35
Harrington JM. (2001). Health Effects of Shift Work and Extended Hours of Work.
Journal of Occupational and Environmental Medicine. 58: 68-72
Haus EL, Smolensky MH. (2013). Shift work and cancer risk: Potential mechanistic roles
of circadian disruption, light at night, and sleep deprivation. Sleep Medicine
Reviews. 17(4):273-284
He N, Zhao J, Archbold CA. (2002). Gender and police stress: The convergent and
divergent impact of work environment, work-family conflict and stress coping

59
mechanisms of female and male police officers. Policing. 25(4):687-708
Jantaratnotai N, Mosikanon K, LeeY, McIntyre RS. (2017). The interface of depression
and obesity. Obesity Research & Clinical Practice. 11(1): 1-10
Kalmbach DA, Pillai V, Arnedt JT, Drake CL. (2015). Shift work disorder, depression,
and anxiety in the transition to rotating shifts: the role of sleep reactivity. Sleep
Medicine. 16(12): 1532-1538
Kelley TM. (2005). Mental health and prospective police professional. Policing: An
International Journal of Police Strategies & Management. 28(1):6-29
Khosro S, Alireza S, Omid A, Forough S. (2011). Night work and inflammatory markers.
Indian Journal of Occupational and Environmental Medicine. 15(1):38-41
Kim I, Heo HT, Kim S, Jang S.(2011). Night duty and depressive symptoms of white collar
workers in the public sector. Journal of Occupational and Environmental
Medicine. 68(1): A100-1
Kim I, Kim H, Lim S, et al. (2013). Working hours and depressive symptomatology
among full-time employees: Results from the fourth Korean National Health and
Nutrition Examination Survey (2007-2009). Scandinavian Journal of Work,
Environment and Health. 39(5):515-520
Knutsson A, Kempe A. (2014). Shift work and diabetes – A systematic review.
Chronobiology International. 31(10): 1146-1151

60
Knutson KL, Rathouz PJ, Yan LL, Liu K, Lauderdale DS. (2006). Stability of the Pittsburgh
Sleep Quality Index and the Epworth Sleepiness Questionnaires over 1 year in
early middle-aged adults: the CARDIA study. Sleep. 29(11): 1503-1506
Lee A, Myung S, Cho JJ, et al. (2017). Night Shift Work and Risk of Depression: Meta-
analysis of Observational Studies. Journal of Korean Medical Science. 32: 1091-
1096
Lee SG, Kim I, Kim D, et al. (2016). Association between shift work and severity of
depressive symptoms among female nurses: the Korea Nurses’ Health Study.
Journal of Nursing Management. 24: 192-200
Lee HY, Kim MS, KIM O, et al. (2015). Associations between shift work and severity of
depressive symptoms among female nurses: the Korea Nurses’ Health Study.
Journal of Nursing Management. 24(2):192-200
Leischik R, Foshag P, Straub M, et al. (2015). Aerobic Capacity, Physical Activity and
Metabolic Risk Factors in Firefighters Compared with Police Officers and
Sedentary Clerks. PLOS. 10(8): e0136224
Leonard BE. (2007). Inflammation, Depression, and Dementia: Are they Connected?
Neurochemical Research. 32: 1749-1756
Lin HY, Huang CK, Tai CM et al. (2013). Psychiatric disorders of patients seeking obesity
treatment. BMC Psychiatry. 13(1)

61
Ma CC, Andrew ME, Fekedulegn D, Gu JK, Hartley TA, Charles LE, Violanti JM, Burchfiel
CM. (2015). Shift Work and Occupational Stress in Police Officers. Safety and
Health at Work. 6(1):25-29
Manoogian E, Panda S. (2017). Circadian rhythms, time-restricted feeding, and healthy
aging. Ageing Research Reviews. 39:59-67
Miller L. (2005). Police Officer Suicide: Causes, Prevention, and Practical Intervention
Strategies. International Journal of Emergency Mental Health. 7(2): 101-114
Monroe SM, Slavich GM, Georgiades K. (2014). The social environment and depression:
The roles of life stressors. Handbook of depression. 296-314
Monteleone P, Martiadis V, Maj M. (2011). Circadian rhythems and treatment
implications in depression. Progress in Neuro-Psychopharmacology & Biological
Psychiatry. 35: 1569-1574
Moon HJ, Lee SH, Lee HS, Lee K, Kim JJ. (2015). The association between shift work and
depression in hotel workers. Annals of Occupational and Environmental
Medicine. 27(1):1-11
Ohayon MM, Hong SC. (2006). Prevalence of major depressive disorder in the general
population of South Korea. Journal of Psychiatry Research. 40: 30 - 36
Oyane NM, Pallesen S, Moen BE et al. (2013). Associations between night work and
anxiety, depression, insomnia, sleepiness and fatigue in a sample of Norwegian

62
nurses. PLoS One. 8:e70228
Pan A, Keum N, Okereke OI, et al. (2012). Bidirectional association between depression
and metabolic syndrome: a systematic review and meta-analysis of
epidemiological studies. Diabetes Care. 35(5):1171-1180
Pandi-Perumal SR, Srinivasan V, Maestroni GJM, et al. (2006). Melatonin. FEBS.
273(13):2813-2838
Park JN, Han MA, Park J, Ryu SY. (2016). Prevalence of Depression Symptoms and
Related Factors in Korean Employees: The Third Korean Working Conditions
Survey (2011). International Journal of Environmental Research and Public
Health. 13(4): 424
Pett JP, Korencic A, Wesener F, et al. (2016). Feedback Loops of the Mammalian
Circadian Clock Constitute Repressilator. PLOS. 12(12): e1005266
Presser HB. (2004). The Economy That Never Stops. The American Sociology Association.
3(2):42-49
Puttonen S, Viitasalo K, Harma M. (2011). Effect of Shiftwork on Systemic Markers of
Inflammation. The Journal of Biological and Medical Rhythm Research.
28(6):528-535
Radloff LS. (1977). The CES-D Scale: A Self-Report Depression Scale for Research in the
General Population. Applied Psychological Measurement. 1(3): 385-401

63
Rajaratnam S, Barger LK, Lockley SW, et al. (2011). Sleep Disorders, Health, and Safety in
Police Officers. JAMA. 306(23):2567-2578
Ramey SL, Perkhounkova Y, Moon M, et al. (2012). The Effect of Work Shift and Sleep
Duration on Various Aspects of Police Officers’ Health. Workplace Health and
Safety. 60(5): 215-222
Ramirez CC, Federman DG, Kirsner RS. (2005). Skin cancer as an occupational disease:
the effect of ultraviolent and other forms of radiation. International Journal of
Dermatology. 44(2):95-100
Rosmond R. (2004). Obesity and depression: Same disease, different names? Medical
Hypotheses. 62(6):976-979
Salgado-Delgado R, Osorio AT, Saderi N, Escobar C. (2011). Disruption of Circadian
Rhythms: A Crucial Factor in the Etiology of Depression. Depression Research
and Treatment. ID 839743
Sandman N, Merikanto I, Maattanen et al. (2016). Winter is coming: nightmares and
sleep problems during seasonal affective disorder. Journal of Sleep Research.
25(5): 612-619
Schernhammer ES, Laden F, Speizer FE, Willett WC, Hunter DJ, Kawachi I, Fuchs CS,
Colditz GA. (2003). Night Shift Work and Risk of Colorectal Cancer in the Nurses’
Health Study. Journal of the National Cancer Institute. 95(110: 825-828

64
Scott AJ, Monk TH, Brink LL. (1997). Shiftwork as a Risk Factor for Depression: A Pilot
Study. International Journal of Occupational and Environmental Health. 2:2-9
Seignourel PJ, Green C, Schmitz JM. (2008). Factor structure and diagnostic efficiency of
the BDI-II in treatment-seeking substance users. Drug and Alcohol Dependence.
93(3):271-278
Shean G, Baldwin G. (2008). Sensitivity and specificity of depression questionnaires in
college-age sample. Journal of Genetic Psychology. 169(3): 281-292
Smarr KL, Keefer AL. (2011). Measures of depression and depressive symptoms. Arthritis
Care and Research. 63(11):454-466
Spiegel D, Giese-Davis J. (2003). Depression and Cancer: Mechanisms and Disease
Progression. Biological Psychiatry. 54(1): 269-282
Su K, Chiu T, Huang C, et al. (2007). Different cutoff points for different trimesters?
General Hospital Psychiatry. 29(5): 436-441
Thayyil J, Jayakrishnan TT, Raja M, Cherumanalil JM. (2012). Metabolic Syndrome and
Other Cardiovascular Risk Factors Among Police Officers. North American Journal
of Medical Sciences. 4(12): 630-635
Thorpy MJ. (2012). Classification of Sleep Disorders. Neurotherapeutics. 9(4):687-701
Thun E, Bjorvatn B, Torsheim T et al. (2014). Night work and symptoms of anxiety and
depression among nurses: A Longitudinal study. Work and Stress. 28(4) 376-386

65
Tucker P, Marquie J, Folkard S, et al. (2012). Shiftwork and Metabolic Dysfunction.
Chronobiology International. 29(5): 549-555
Van AmelsvoortL, Jansen N, Kant I. (2006). Smoking among Shift Workers: More Than a
Confounding Factor. Chronobiology International. 23(6):1105-1113
Van Mark A, Weiler SW, Schroder M, Otto A et al. (2010). The impact of shift work
induced chronic circadian disruption on IL-6 and TNF-a immune responses.
Journal of Occupational Medicine and Toxicology. 5(18)
Virtanen M, Ferrie JE, Singh-Manoux A,et al. (2011). Long working hours and symptoms
of anxiety and depression: a 5-year follow-up of the Whitehall II study.
Scandinavian Journal of Work, Environment and Health. 41(12):2485-2494
Violanti JM, Charles LE, Hartley TA, et al. (2008). Shift-Work and Suicide Ideation Among
Police Officers. American Journal of Industrial Medicine. 51: 758-768
Violanti JM, Fekedulegn D, Charles LE, et al. (2009). Suicide in Police Work: Exploring
Potential Contributing Influences. American Journal of Criminal Justice. 34(1-2):
41-53
Violanti JM, Burchfiel CM, Harley TA, et al. (2010). Atypical Work Hours and Metabolic
Syndrome Among Police Officers. Archives of Environmental & Occupational
Health. 64(3): 194-201
Violanti JM, Hartley TA, Gu JK, et al. (2013). Life Expectancy in Police Officers: A
Comparison with the U.S General Population. International Journal of Emerging
Mental Health. 15(4): 217-228

66
Violanti JM, Burchfiel CM, Miller DB, et al. (2006). The Buffalo Cardio-Metabolic
Occupational Police Stress (BCOPS) Pilot Study: Methods and Participant
Characteristics. Annals of Epidemiology. 16(2): 148-156
Wang Z, Inslicht SS, Metzler TJ, et al. (2010). A prospective study of predictors of
depression symptoms in police. Psychiatry Research. 175(3):211-216
West SH, Ahern M, Byrnes M, Kwanten L. (2007). New Graduate Nurses Adaptation to
Shift Work: Can We Help? Collegian. 14(1): 23-30
Whooley MA. (2006). Depression and cardiovascular disease: healing the broken-
hearted. JAMA. 295(240): 2874-2881
Wirth MD, Vena JE, Smith EK, et al. (2013). The Epidemiology of Cancer Among Police
Officers. American Journal of Industrial Medicine. 56(4):439-453
Wirth MD, Shivappa N, Burch J, et al. (2017a). The Dietary Inflammatory Index, shift
work and depression: Results from NHANES. Health Psychology. 36(8): 760-769
Wirth MD, Andrew ME, Burchfiel CM, Burch JB et al. (2017b). Association of shiftwork
and immune cells among police officers from the Buffalo Cardio-Metabolic
Occupational Police Stress study. Chronobiology International. 36(4):721-731
Wirth MD, Burch J, Violanti J, et al. (2011). Shiftwork duration and the awakening
cortisol response among police officers. Chronobiology International. 28(5):446-
457
World Health Organization. (2008). The Global Burden of Disease 2004 update. Geneva,
Switzerland.

67
World Health Organization. (2017). Depression. Retrieved from:
http://www.who.int/mediacentre/factsheets/fs369/en/
Wulff K, Gatti S, Wettstein JG, Foster RG. (2010). Sleep and circadian rhythm disruption
in psychiatric and neurodegenerative disease. Nature Reviews Neuroscience.
11:589-599
Yoon S.L. & Kim J.H. (2013) Job-related stress, emotional labor, and depressive
symptoms among Korean nurses. Journal of Nursing Scholarship. 45 (2):169–176
Zhao I. & Turner C. (2008). The impact of shift work on people’s daily health habits and
adverse health outcomes. Australian Journal of Advanced Nursing. 25 (3):8–22
Zukauskas G, Ruksenas O, Burba B, Grigaliuniene V, Mitchell JT. (2009). A Study of Stress
Affecting Police Officers in Lithuania. International Journal of Emergency Mental
Health and Human Resilience. 11(4): 205 – 214