
A Literature Review of Crop Area Estimation · A Literature Review of Crop Area Estimation by ......
22
A Literature Review of Crop Area Estimation by Michael Craig and Dale Atkinson July 2013 For UN-FAO Introduction and Overview Crop production forecasts/estimates are generally portrayed as the product of two components: area (to be) harvested and (expected) yield per unit area. The accurate forecasting/estimation of both harvested area and yield are equally important in ensuring the accurate determination of their product. Although the yield part of the equation gets most of the attention, there are many complexities to the estimation of area that might not be readily apparent. This report will focus on the area side of the equation; in it, the word “estimate” will be used interchangeably for estimates and/or forecasts. Timing qualifiers will be associated with the term estimation to distinguish the early or mid-season (and even prior-to-season) efforts from those at end-of-season. First, the area planted for harvest of a given crop may change throughout the growing season. Such issues as use for purposes other than grain, abandonment, extreme weather damage, or unusual economic conditions may cause this change. It is usually necessary to make estimates several times throughout the crop season even for a given crop. You might measure prospective or intended plantings before they actually take place, next you could measure actual plantings early in the crop season, and then measure actual harvested area at the end-of-season [Vogel, 1999]. Certainly the most significant challenge in estimating crop production is in doing so early in the season. Area estimation can create problems especially in countries prone to drought or flooding problems. However, very severe events in any country can take planted area out of production, since it either can’t be harvested or it’s economically infeasible to do so. These unforeseen, one-time conditions may cause a need for a special, one-time measurement of area. Having more than one crop adds another layer of complexity also, with widely different seasons between types of crops, planting more than one crop in a field (both consecutively and planted together at the same time). Landscape factors such as elevation and/or soil type also create problems; for example, terraced crops versus those planted on a steep incline. Throughout the years there have been many approaches to crop area estimation. Agricultural statistics are collected both by censuses, which require enumeration of the total population of interest, and by samples requiring enumeration of only a small part of the population. Early types involved expert opinion of voluntary crop reporters by local area, such as villages, communes, or parishes. This is one of the cheapest forms, but not always accurate. Complete censuses of all people, and later of all ‘farms’, is
-
Upload
nguyentruc -
Category
Documents
-
view
215 -
download
0
Transcript of A Literature Review of Crop Area Estimation · A Literature Review of Crop Area Estimation by ......

A Literature Review of Crop Area Estimation
by
Michael Craig and Dale Atkinson
July 2013
For UN-FAO
Introduction and Overview Crop production forecasts/estimates are generally portrayed as the product of two components: area (to be) harvested and (expected) yield per unit area. The accurate forecasting/estimation of both harvested area and yield are equally important in ensuring the accurate determination of their product. Although the yield part of the equation gets most of the attention, there are many complexities to the estimation of area that might not be readily apparent. This report will focus on the area side of the equation; in it, the word “estimate” will be used interchangeably for estimates and/or forecasts. Timing qualifiers will be associated with the term estimation to distinguish the early or mid-season (and even prior-to-season) efforts from those at end-of-season. First, the area planted for harvest of a given crop may change throughout the growing season. Such issues as use for purposes other than grain, abandonment, extreme weather damage, or unusual economic conditions may cause this change. It is usually necessary to make estimates several times throughout the crop season even for a given crop. You might measure prospective or intended plantings before they actually take place, next you could measure actual plantings early in the crop season, and then measure actual harvested area at the end-of-season [Vogel, 1999]. Certainly the most significant challenge in estimating crop production is in doing so early in the season. Area estimation can create problems especially in countries prone to drought or flooding problems. However, very severe events in any country can take planted area out of production, since it either can’t be harvested or it’s economically infeasible to do so. These unforeseen, one-time conditions may cause a need for a special, one-time measurement of area. Having more than one crop adds another layer of complexity also, with widely different seasons between types of crops, planting more than one crop in a field (both consecutively and planted together at the same time). Landscape factors such as elevation and/or soil type also create problems; for example, terraced crops versus those planted on a steep incline. Throughout the years there have been many approaches to crop area estimation. Agricultural statistics are collected both by censuses, which require enumeration of the total population of interest, and by samples requiring enumeration of only a small part of the population. Early types involved expert opinion of voluntary crop reporters by local area, such as villages, communes, or parishes. This is one of the cheapest forms, but not always accurate. Complete censuses of all people, and later of all ‘farms’, is

another approach; census information is usually not cheap or timely [Meyer-Roux, 1992; Bosecker 1988]. Statistical methods have made clear that the enumeration of small samples can greatly reduce the cost of the collection of agricultural statistics while increasing their accuracy. A well designed sample, for which the data are carefully collected, can provide much cheaper statistics than a census and provide more timely information on current conditions. Sampling procedures provide the means for controlling both sampling and non-sampling errors to meet the specific requirements for estimates, permitting the allocation of resources to those areas and those statistics where the needs for more and improved data are the greatest. The ability to tailor the accuracy of estimates to specific need is especially important to developing countries which have very limited resources to apply to the collection of agricultural data. As sampling evolved as a science, lists of farms were sampled to obtain crop information. However, lists are expensive to maintain and are usually out of date and incomplete leading to biased estimates. Area sampling evolved as another approach; area defined populations are complete and their estimates are unbiased. However they have their own set of costs and problems, such as poor small area estimates for minor crops and the initial cost of creating the area sampling frame. Combining area and list frames, known as multiple frame sampling, has some very good qualities and solves some of the problems with each of them individually. Other sources of crop area estimation may be derived from administrative sources or as by-products of administrative data. For example, farm program sign-ups or mail surveys may ask for changes from last year, leading to ratio estimates based on the prior year’s numbers. Processors of raw crop inputs (such as cotton gins) provide information. Legislative actions limiting area planted for specific crops may be present. Individual countries approach estimation differently also, some publish survey data directly and some publish only official estimates based on a panel of experts (who review all available data inputs). Technology has greatly aided crop area estimation. Remote sensing has evolved from sporadic aerial over-flights to frequent repeat high resolution coverage and from black and white film coverage to multispectral digital scanners. Computer processing has progressed from just being able to add up survey sampling information to digitally classifying points on the ground to crop types and other land covers. Geographic Information Systems (GIS’s) have evolved from marks hand drawn on photo mosaics to devices showing digital locations down to centimeters. These technology advances have greatly increased the ease of area frame construction, maintenance, and sampling; decreased associated costs and have reduced sampling variation both through better stratification and later through regression estimates. Estimates have progressed from being sums of local area information, direct expansions of statistically sampled data, crop specific pixel classifications, through error corrected regression and/or calibration estimation. Small area estimation is much more accurate and timely. Classification outputs also allow users more access to location information, such as needed for planning railroad cars placing during crop harvest periods. This review will attempt to address crop estimation from two aspects: systems that involve ground data only in the final process and systems which utilize remote sensing data as a prime input into the final product.

Ground Data Only Systems for Crop Area Estimation
Ground surveys have long been the underpinning of estimates of crop area and production. An early paper [Huddleston, H., 1978] which documented sampling and estimation strategies for crop forecasting and estimation is still very relevant today. There is a rich literature history of systems for crop area estimation based solely upon ground gathered data systems. The focus of this section will be to discuss those methods further. In general, estimation systems might include: complete censuses, sample survey systems based upon farmer reported data, large point samples with observed data, conventional area frame systems, and the use of administrative data. Timing of estimation can range from years (censuses) to months (expert reports) or somewhere in between. Some discussion or examples of estimation systems follow. There are Censuses of Agriculture conducted around the world. The results, based upon farmer reported data, are quite thorough and detailed. The results are usually well after harvest though and not timely for a crop production forecasting and estimation system. They are a great source of small area estimates and can serve as a bench mark for ratio estimates in periods between censuses. When sampling is being considered, there has been much debate on point samples versus area polygon samples. Both are quite useful, but usually for different purposes or goals. One needs to look at the cost benefit portfolio, taking the overall goals into account. Otherwise, you may be comparing apples and oranges. Estimation systems approaches do vary around the world, but in many ways are still quite similar. In fact, USDA has large programs using both approaches but with separate goals for each. The USDA’s Natural Resource Conservation Service (NRCS) has an extremely large point sample and survey known as the National Resources Inventory (NRI). The NRI collects data in all counties and parishes of the 50 states and Puerto Rico, the Virgin Islands, the District of Columbia and areas of the Pacific Basin. The NRI was conducted at five year intervals beginning in 1977 and has been conducted annually since 2000 [Boryan, 2012]. The objective of the NRI is to monitor “status, conditions and trends in soil, water and other natural resources data on non-Federal lands in the United States” [Breidt, F. and W. Fuller,1999]. Data collected include broad land use and land cover categories such as irrigated and not irrigated cropland. These categories are then evaluated in terms of land capability class and subclass such as prime farmland; erosion and potential erodibility. Annual data collection is conducted primarily using photo interpretation and by ancillary data sources in house [Nusser and Goebel, 1997]. The USDA’s National Agricultural Statistics Service (NASS) has a conventional area frame based program which uses natural boundary sample segments with personal interviews of the farmers operating the land in those segments [Davies, 2009; Cotter, et al., 2010]. The NASS program has multiple goals. They are an excellent and timely source for crop area estimation. However, they also serve a very important statistical goal of measuring what is not available from a list of farmers (known as NOL for ‘not on list’) for hundreds of variables. It is the combination of area and list based information through a multiple frame sampling approach that leads to complete and cost efficient results for agricultural statistics of all sorts. There are similar dichotomies for systems around the world, with France and also JRC being excellent examples of the point system and Morocco for the area frame and multiple frame approach. There are some well-one statistical comparisons by Gallego and Carfagna which support the JRC method over the

area frame method, but they do not take into account all of the benefits of the two types of systems. It is difficult to quantify the value of the NOL component the area frame provides for all types of agricultural statistics. Both approaches play their important role in agricultural statistics programs. The discussion here does not even address the role of such systems when combined with remotely sensed data. That will be discussed in another section. Another source discussed by Carfagna [2004] in general is the use of timely administrative where it is available. The USDA Farm Service Agency (FSA) has such a system as do many other national systems around the world. The timeliness of access to such information has improved over the years, especially since geographic information systems have been used. It can be used to statistically combine results, where comparable to sample surveys, or more simply as a quality control for both the administrative and sample survey data. This is a way for saving money, reducing response burden producing figures for very detailed domains and allowing estimation of transition over time. However, definitions, coverage and quality of administrative data depend on administrative requirements; thus they change as these requirements change. Then information acquired is not exactly the one needed for statistical purposes and sometimes objects in the registers are partly the statistical units of the population for which statistics have to be produced and partly something else; thus evaluating under-coverage is difficult. In nearly all countries in which ground surveys are conducted, either for stand-alone estimation or for ground truth data for remote sensing training (or often, both), area surveys are an obvious and popular choice. In [Gallego, 1995], the author describes the area frame sampling methodology developed in preparation for Activity A (Regional Inventories) of the MARS Project, launched with the support of the Directorate General VI (Agriculture) of the European Commission and Eurostat. The document provides an excellent overview of sampling frames in general and discusses in great detail the characteristics of area frames used by various countries for their ground data collection. The MARS Project implemented area frames in 1988 [Gallego, 1999] on five pilot regions of approximately 20,000 Km2 each. Priority was given to crop area and production estimation of annual crops: soft and durum wheat, barley, rape seeds, dried pulses, sunflower, maize, cotton, tobacco, sugar beet, potatoes, rice and soya, as well as fallow on arable land. The pilot regions later expanded in number as well as size. The initiative was progressively transferred to regional or national administrations that wished to use area frame surveys based on segments. In general, the activities have been shifted to the south of the European Union (EU) {Spain and Greece use the method operationally and extensively} and to Central and Eastern Europe. After 1992, the technique was considered evaluated and JRC involvement was also reduced to sporadic contacts with national bodies. A number of projects funded by different organizations have chosen the JRC sampling approach. In particular, JRC support has been given to projects that have adopted sampling frames of square segments in countries such as Turkey, Indonesia, Morocco, Zimbabwe and Iran.
In the early 2000s, the JRC’s area survey focus shifted to the Land Use/Cover Area Frame Statistical (LUCAS) Survey, as a EU strategy to get EU wide crop acreages harmonized across the member countries [Delincé, 2001]. LUCAS Surveys have been conducted in various countries since 2001. Surveys were conducted in 2001, 2002, 2003, 2005, 2006, 2008, 2009, and most recently in 2012, with the number of participating EU member countries since its initiation growing from 13 in 2001 to all 27 in 2012 [Gallego, 2011]. The unstratified two-stage sampling design used in 2001 and 2003 was changed to a two-phase sampling of unclustered points with stratification after the first phase in 2006 [Gallego, 2006]. This two-phase sample design allows straightforward calculation of the estimates and improves the efficiency of the stratification. It was also expected to reduce the variance by approximately a factor of three and

avoid the problems of incomplete PSUs. It was also considered to be more logical from the implementation perspective, and the new design has served to reduce survey costs. The base sample for LUCAS corresponds to an initial 1 Km grid of about 4,000,000 points for the entire area of the EU. The LUCAS master sample is a subset of the base sample from a 2 Km grid created by using all the even points of the base sample, consisting of around 1,000,000 points. Points located on small islands are excluded from the sample. The master sample is then stratified by land cover classes and sub-sampled for ground data collection. The basic size of the data collection unit is a circle of 3m diameter, but additional observations are taken on an extended observation area of 40 meters. Further observations are made on transects between the basic data collection units. The LUCAS survey was designed for spring and fall surveys [Bettio, 2002] for area and yield estimation, respectively. The Statistical Service of the European Commission, EUROSTAT, carried out the LUCAS 2012 survey on land use and land cover in the European Union, covering all 27 EU countries. The total point sample consisted of 270,389 points, most of which were visited in the LUCAS 2009 survey. The field work was carried out in March-September 2012. Surveyors were requested to map and photograph the point with a minimum of disturbance and not to damage the crop covering the survey point. A sample point could fall on any land cover type (cropland, grassland, forest, built-up areas, transport network etc.). The surveyors examined land cover and land use, irrigation management and structural elements in the landscape. The survey procedures were designed to produce European scale statistics. The primary data release was planned for the first quarter of 2013 and the release of statistics for the second quarter of 2013. Area surveys, sometimes used in conjunction with lists in a multiple frame context, are conducted in many countries is support of agriculture surveys in general, and crop acreage and production surveys in particular. Two excellent references on this are [FAO, 1996a, 1998]. These documents contain a very comprehensive description of area frame techniques (as well as those for list surveys) and include chapters by country on their own individual implementations of area frames and crop surveys. Table 1 is a summarization from the FAO, 1998 document. FAO, 1998 provides extensive information on the agricultural surveys conducted within the structure described above. The information presented should be current enough to be reflective of the basic approach used in the various countries yet today, although economic issues as well as technological advances over the ensuing years have undoubtedly resulted in some adjustments in procedures. [Bettio, et al 2002] is an excellent descriptive paper on area frames and several operational surveys using them. In addition to further discussion of LUCAS (including Spain’s implementation of it), the paper provides an update on the French TERUTI and introduces a description of the Bulgarian BANCIK.
So what is the current approach for area estimation used in the EU? Even with the establishment of LUCAS, there is no single approach used across the EU. Each member state has its own approach [Gallego, 2011]. The most frequently used approach continues to be list frame surveys, since they are relatively cheap and can obtain a lot of information in one interview. France, Italy, Spain and Greece, however, are all estimating crop area based on area surveys. The Southern African Development Community (SADC) countries use a combination of subjective procedures (i.e., extension officer’s and/or grower’s assessment) and objective ones involving direct measurement. In [SADC Secretariat, 2009] the SADC Secretariat’s Food, Agriculture and Natural Resources Directorate prepared a handbook National Early Warning Units (NEWUs) for Food Security. It
compiles selected technical papers presented and discussed at a joint SADC-FAO Technical Workshop on Methodology for Food Crop Production Forecasting held on April 10-11, 2000 in Harare, Zimbabwe. The workshop was mostly attended by statisticians working in the SADC countries’ National Early Warning Units. Since the report of this joint SADC-FAO Workshop was not published, the FANR Directorate decided to publish several papers from the workshop dealing with crop forecasting methodologies being used in SADC countries, to facilitate the sharing of best practices among the countries and to preserve the methodologies which have been in use in the region. In most of the SADC countries, even those with some of the better crop forecasting procedures in place, crop forecasting has been limited to cereals and other major crops. Few countries have extended or are even considering extending crop forecasting to minor agricultural commodities. Experts at the workshop expressed the need to develop new methods of crop production forecasting that include minor crops. The procedures discussed in the handbook are predominantly statistical surveys utilizing list and area sampling, where villages or enumeration districts are primary sampling units, with households (and sometimes fields) subsampled for enumeration. Year to year change estimates are commonly used. While statistically sound procedures are presented in the papers of this handbook, they also highlight practical problems the countries are having in effectively carrying out these procedures on an on-going basis – one of the largest is the economic stress in carrying out expensive ground surveys. There is a growing need to develop and use forecast methods that are sound, but also cost-effective and sustainable, given the general financial difficulties countries in the region are facing. Finally, the handbook indicated that the central statistical offices (CSO), in most countries, do not have the structure in place at the sub-national levels to conduct objective methods of crop estimation. The countries, therefore, rely on extension workers for the crop estimation and to report on crop damage due to both natural and unnatural causes. Also, in most cases, there is lack of coordination between the CSO and extension services to properly conduct the surveys. One of the conclusions from the workshop was that most SADC countries do not have reliable methods of crop forecasting/estimation.
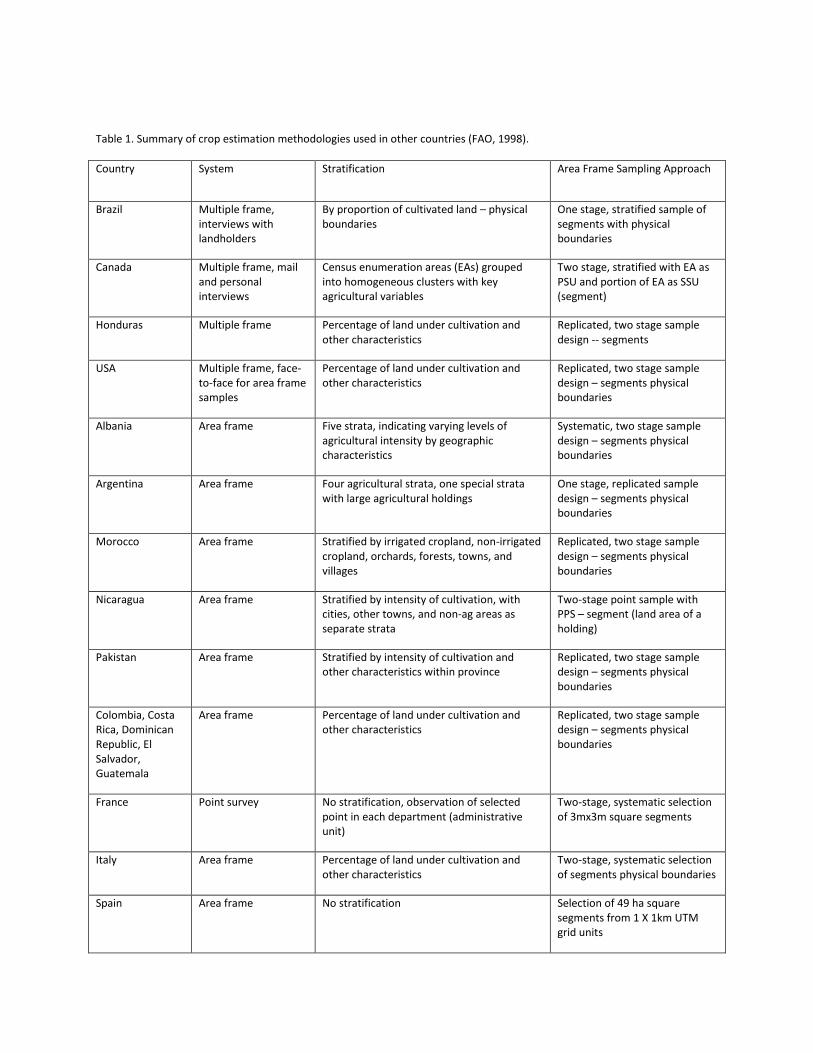
Table 1. Summary of crop estimation methodologies used in other countries (FAO, 1998).
Country System Stratification Area Frame Sampling Approach
Brazil Multiple frame, interviews with landholders
By proportion of cultivated land – physical boundaries
One stage, stratified sample of segments with physical boundaries
Canada Multiple frame, mail and personal interviews
Census enumeration areas (EAs) grouped into homogeneous clusters with key agricultural variables
Two stage, stratified with EA as PSU and portion of EA as SSU (segment)
Honduras Multiple frame Percentage of land under cultivation and other characteristics
Replicated, two stage sample design -- segments
USA Multiple frame, face-to-face for area frame samples
Percentage of land under cultivation and other characteristics
Replicated, two stage sample design – segments physical boundaries
Albania Area frame Five strata, indicating varying levels of agricultural intensity by geographic characteristics
Systematic, two stage sample design – segments physical boundaries
Argentina Area frame Four agricultural strata, one special strata with large agricultural holdings
One stage, replicated sample design – segments physical boundaries
Morocco Area frame Stratified by irrigated cropland, non-irrigated cropland, orchards, forests, towns, and villages
Replicated, two stage sample design – segments physical boundaries
Nicaragua Area frame Stratified by intensity of cultivation, with cities, other towns, and non-ag areas as separate strata
Two-stage point sample with PPS – segment (land area of a holding)
Pakistan Area frame Stratified by intensity of cultivation and other characteristics within province
Replicated, two stage sample design – segments physical boundaries
Colombia, Costa Rica, Dominican Republic, El Salvador, Guatemala
Area frame Percentage of land under cultivation and other characteristics
Replicated, two stage sample design – segments physical boundaries
France Point survey No stratification, observation of selected point in each department (administrative unit)
Two-stage, systematic selection of 3mx3m square segments
Italy Area frame Percentage of land under cultivation and other characteristics
Two-stage, systematic selection of segments physical boundaries
Spain Area frame No stratification
Selection of 49 ha square segments from 1 X 1km UTM grid units

For the South African countries that are using objective yield methods, much of the resemblance to the USDA-NASS program results from USDA assistance to the south African countries in the early 2000s. USDA-NASS’ International Program Office was an active participant in this effort in serving as a consultant through all aspects of survey design, stratification of the area frame, sample allocation, selection, and field implementation. The design was a stratified, gridded point sample. The stratification was accomplished through updating the most recent national land cover dataset for South Africa (1:250,000) with 1998 or later Landsat imagery and expert knowledge of the area. The stratification was designed to break out various levels of cultivation, as well as irrigated vs. non-irrigated areas. Seventeen strata were identified, which could be combined and amalgamated, depending on the objective of the estimation needs. The stratification, as designed, was expected to remain constant for at least five years, and it would be thereafter be revised periodically. The first-year surveys from this effort spanned two time periods in 2002, to accommodate the summer and winter crops. For each of the two crop seasons, a subjective farmer interview was conducted and objective yield plots were laid out, although for the first year of the surveys (due to a time-crunch issue in implementing the program), farmer interviews were conducted after, rather than before, objective yield sampling. Indications of area planted to each crop were obtained from point, field and farm estimates. The point estimates were derived from the percentage of sample points that fell in fields with the crop of interest; the field estimates were based on field expansions for points hitting a target crop; and farm estimates were derived using the open concept, where the farmer operating each selected field reported for his entire operation. Quality control was conducted for a sampling of the points, primarily through interpretation of monthly-acquired SPOT imagery. As expected, for all crops surveyed, the provincial and national CVs for the farm indications were substantially below those of the point and field indications. Overall, the results were fairly close to the target CVs for the farm indication at both the provincial and national level, although the authors noted that some improvement was needed. In particular, provinces contributing 62% to total maize production were well sampled, but the higher CVs for the remaining provinces indicated that stratification must be improved and sample sizes increased. Geographic Information Systems (GIS’s) began to make a real impact in area estimation in the 1980’s. Early versions of GIS’s were mainly used to store final area sampling frames in a digital form, but as the technology increased, they became a part of the construction process. Information stored in digital form began to be readily accessible. Early digital data was usually in the form of scanned documents, such as maps or paper photos. Later, remotely sensed images would load directly into GIS’s and related image processing programs. Being able to review and store boundaries derived from or overlain on different data sources greatly aided area frame construction. This technology is still advancing today at a furious pace; increases in computer power make many processes much more manageable. They are becoming a standard tool for all levels of data users. New devices such as Global Positioning System (GPS) receivers and various types of handheld computer tablets, etc., allow data processing anywhere with some limitations [Carfagna and Keita, 2009]. As an excellent example of technology on the move, a recent paper [Ferreira, et al, 2006] indicates that at least some of the data for crop area estimation in South Africa is now being collected by aerial survey. Farmer cooperation (in support of the farm estimate) became a problem after the first couple years of the point sample, and alternatives were necessary. To address this issue, an integration of remote sensing, point frame sampling, GIS, and aerial observations became the Producer Independent Crop

Estimate System (PICES). This system was developed as a pilot project over the Gauteng province to demonstrate its feasibility. As a first step satellite imagery (Landsat 5) over three seasons was used to capture field boundaries for all cultivated fields in the province. The field boundaries were mapped, replaced the cultivation density stratum, and defined a frame for a random geographic systematic selection of sample points across each province. The crop type for each sampled field/point was determined by aerial observations by trained observers (predominantly farmers) using light aircraft. The crop information was recorded on a digital tablet PC in combination with a GPS navigation instrument. Information gathered during the aerial survey was used both to calculate a statistical area for each crop type per province and as a training set for satellite imagery for classification purposes, the latter use of which resulted in a complete set of classified fields for each province. The methodology has been expanded and implemented on an operational level in the four major summer grain producing provinces of Northwest, Mpumalanga, Free State, and Gauteng, and it is reportedly providing reliable crop area estimates.
The Ever Increasing Role of Remote Sensing in Crop Area Estimation In its general context, remote sensing may be defined as the collection of information about an object or area without being in physical contact with the object or area. Aircraft and satellites are the most common vehicles from which remote sensing observations are made. Aerial photography is the original and most familiar form of remote sensing and is widely used for topographic mapping, engineering and environmental studies, agricultural estimation, crop disease information, military observations, and exploration for oil and minerals. Glued or taped paper photo index coverage was an early source of stratification information for area frames. Later, imagery of the earth's surface taken from space provided a comprehensive overlook of large areas first in paper prints and later in digital form. Area estimation throughout the crop season is typically accomplished through ground surveys or ground surveys supplemented with remotely sensed data. The remote sensing imagery is generally used for stratification and is often used directly in estimation as well. Remote sensing techniques have become very popular in area estimation over the past few decades, as the technology and methodologies have matured. An excellent document on the issues of area estimation in general as well as those from the earth observation (EO) perspective was published by the Group on Earth Observations (GEO) following a June 2008 conference on the topic [Gallego, 2008]. One of the key issues highlighted in this conference was the importance of quality ground surveys. In spite of the technological developments and capabilities of remote sensing, quality ground surveys, where at all possible, are an extremely important (and nearly indispensable) piece of the area estimation process. In practice, high-resolution imagery with image interpretation is sometimes substituted for ground surveys, but this proxy for a ground survey is generally used only in response to budgetary limitations, access restrictions, or simply the desire for more timeliness (i.e., avoiding the time of collecting and processing the ground data). Most of these efforts have been less than totally successful. For example, [Gallego, 2006] and [Narciso, et al, 2008] describe two recent research efforts focused on avoiding or minimizing ground data collection that ultimately proved unsatisfactory. Remote sensing has a long history of use in crop acreage estimation and assessment dating back to the 70s. With technology improvements in sensor quality and availability and processing advances, it has become an even stronger player in countries’ efforts to estimate crop area and production. It is not a

panacea, however. Issues, especially in regard to timing, efficiency, and assurances of continuing availability remain with its use. According to GEO Ag Task 07 03 [Gallego, 2008], the timing or schedule of crop area estimation or early estimation depends on the following elements 1) the number of days after sowing a crop can be detected by a remote sensor, 2) the spatial variability in sowing practices of the region, 3) the crop calendars of competing crops, 4) the characteristics of remote sensors (revisiting time), 5) the date in which the crop can be reliably recognized in the field, 6) the time needed for the ground survey, and 7) the time needed for ground data processing. There is has been much literature written on the various uses of remote sensing in crop area and yield estimation. A nice paring of papers on the principal uses of remote sensing in the production of agricultural statistics are detailed in [Carfagna, 2005] and [Gallego, 2006]. The Carfagna paper describes the main uses of remote sensing at both the design level and the estimation stage. At the design level, remote sensing imagery can be very effective in area frame construction and stratification, often even when a previous ground survey hasn’t been conducted. In this situation, spatial characteristics are estimated through photo-interpretation of remote sensing images. In terms of estimation, remotely sensed data are generally used as auxiliary variables in regression or calibration estimators, and sometimes in the context of confusion matrixes. Gallego builds on the Carfagna paper in relating some of what MARS has done in these areas. Specifically, MARS has 1) produced regional crop inventories, that combined ground surveys and satellite images with a statistically consistent regression estimator, 2) initiated the Rapid Crop Area Change Estimates (Action 4 or Activity B) process, which was an attempt to provide area estimates without ground surveys, and 3) stratified a large, first-stage sample of points by photo-interpretation on aerial orthophotos for Eurostat’s LUCAS 2006 survey. As described in the paper, the third activity was probably more successful than the other two. Computations of the relative efficiency of the LUCAS 2006 approach showed generally satisfactory results. However, in the case of the regression estimator, the MARS Project concluded in the late 90s that the remote sensing contribution did not consistently reach a satisfactory cost-efficiency threshold with Landsat TM for operational use at that time [Gallego, 1999]. The relative efficiency was lower than in the U.S., due to the more complex landscape in Europe. The author concludes that the cost-efficiency situation could change in the future with new sensors of comparable resolution and possibly wider swath. According to [Gallego, 2011], the cost efficiency might, indeed, be there today, but there are no guarantees of image availability. For the rapid crop area change estimates, a stated long term objective of the activity was to develop a method that could be applied outside the EU as an alternative to the approach of the USDA’s Foreign Agricultural Service, that combines reports from the agricultural attachés in the embassies around the world with satellite image analysis to identify or quantify major anomalies [FAO, 1996]. This proposed alternative pure remote sensing approach involved a comparison the results of the image analysis and ground data collected from a sample of 60 sites of size 40 km × 40 km. There were 3-4 images per site per year (mainly SPOT). The performance of this pure remote sensing approach was analyzed by crop for the 1996 crop season in terms of monthly mean squared error of the estimates vs. the official end-of-year Eurostat estimates and in terms of R2. The analyses showed that the average mean squared error did generally not converge as the season went on, and for some crops actually got worse. Also, the values of R2 were lower than 0.1 for most crops, meaning that the change estimated for each site by remote sensing was essentially independent of what was observed on the ground. Overall, there were some good results for dominant crops, with a 1-1.5 % error for the total area of cereals, but the margin
for subjectivity was around ± 20%. There were also much weaker results when the changes were difficult to forecast. Overall, the analyses indicate less than desirable results, due primarily to subjectivity in pixel classification without the support of ground data. [Cayrol, et al., 2006] reported on Infoterra France’s efforts to map the winter, spring, and root crops in Belgium, Poland, and the Rostov oblast of Russia in the framework of the Geoland-OFM project. Overall, Infoterra France in 2006 mapped the distribution of annual crops on a total area of 700,000 km² with their MERIS-based application, as a pre-operational Global Monitoring for Environmental Security (GMES) service. This mapping service is designed to be delivered annually, either at the end of the crop season or as progressively refined maps at key dates during the growing season. The product is generated from medium-resolution MERIS data by an operational and automatic production chain. The MERIS sensor is very well adapted to covering large areas, therefore, the resulting maps can cover a whole country, or a smaller area, typically anything from 7.000 to 300.000 km2. The small scale maps generated with MERIS are complementary to the large scale maps typically obtained with high resolution sensors, which can be used to identify crops within field boundaries. The mapping method of this paper exploits the MERIS capability to measure frequently (normally twice per month) the Fraction of green vegetation (GLCV) covering the soil, as well as its variance (GCVV) within each MERIS pixel. The temporal series of GLCV and GCVV observed throughout the vegetation season, are averaged at the scale of the desired administrative or hydrographical unit, and input to a model. The model itself combines the phenological development models of the various groups of crops, and is driven by the meteorological conditions of the crop season. An inversion-based process calculates the proportions the various groups of crops in the unit represent of the total arable land and identifies those that produce the best fit between the observed and modeled temporal composite profiles of GLCV and GCVV. Arable land is isolated via a mask created with land cover information. Validation of the results proved somewhat difficult, since in some cases land cover data bases differed, making the masking for arable land problematic. Also in some cases benchmark agricultural statistics were missing. Ultimately, the validation was performed at the national level from information provided by the MOCA study from the JRC. While there were a few issues with its initial use, this study showed that the approach produced generally good results for areas which are predominantly agricultural and with only a few dominant crops. The approach was limited when land cover was fragmented and there were a lot of mixed classes and crops. On the other hand, the results obtained in Poland demonstrate that the approach is capable of estimating areas of major crops in regions where limited information is available. [Rembold, Maselli, 2006] describes the development and testing of a methodology for using multi-temporal, low spatial resolution images to update crop area changes on a regional scale. The primary issue with using low-resolution imagery in this way is dealing with the large number of resultant mixed land-use pixels. The methodology presented in this paper is based on the assumption that the variations within mixed pixels are reflected in changes in the shape of the multi-temporal NDVI pixel profiles. Specifically, the methodological approach described is based on the sequential use of spectral angle mapping (SAM) and a linear regression estimator. The procedure was tested in Tuscany, Italy using high resolution Landsat TM and ETM+ imagery and Corine land cover to create an accurate, masked mapping base. The low resolution updating imagery was AVHRR. The estimates from the AGRIT survey were used as benchmarks for performance evaluation of the resulting wheat area estimates. The process ultimately proved effective late in the season in accurately updating a reference crop area map, demonstrating that it can be used to obtain accurate area estimates of winter wheat a few months after harvest. Based on these results, the method seems to be suitable for cases where no area
measurement surveys have been carried out during the season and for retrospective analyses. It is, however, of limited value for crop area prediction in the early stages of the season. The authors also indicated the following other limitations of the process: 1) distinct NDVI profiles must exist for the classes to be updated, which makes the procedure applicable only to broad vegetation categories with characteristic phenological behavior; 2) accurate maps describing the reference distribution of the main crops must be available; and 3) good quality low-resolution images must be available to provide correct multi-temporal NDVI updating information. [Kussul, et al, 2012] describes crop area estimation and condition assessment work currently being done in the Ukraine, under the auspices of the Joint Experiment for Crop Assessment and Monitoring (JECAM) project of the Global Earth Observation System of Systems (GEOSS). Remote sensing information from various satellites is being used in the process, including MODIS data from the Terra and Aqua satellites (from the RC Agri4Cast Image Server at http://cidportal.jrc.ec.europa.eu/thematicportals/agri4cast); Thematic Mapper (TM) data from Landsat-5, which currently is the main basis for agricultural monitoring; Earth Observer 1 data, provided by the National Aeronautics and Space Agency (NASA); and data from the Ukrainian satellite Sich-2 launched in 2011. As the source for ground truth data, three Ukrainian test sites were set up and are being used. The first and perhaps most versatile of these is in the Kyivska oblast, on which scientific investigations are provided the by Space Research Institute NASU-NSAU. The second test site is in the Khmelnitsky oblast, and investigations on this test site are provided by the Center of the Special Information Receiving and Processing, State Space Agency of Ukraine. The third of these test sites is in the countryside of Pshenychne, which is run by the National University of Life and Environmental Sciences of Ukraine. Ground data for the Ukrainian experiments were collected through a combination of stratified area frame sample (AFS) surveys of segments and observational surveys along the roads. Stratification was used to improve sampling efficiency, following the NASS-USDA approach with percentage of cropland as the primary stratification factor. Stratification was done using the ESA GLOBCOVER land cover map. During the AFS surveys, extensive information was collected, including land use, crop type, ground photos, type of observation, and accessibility. The surveys along the roads collected information on crop types and geo-location data with GPS units. In this study, the entire area was covered with a regular grid of sampling units of 40x40 km. Each sampling unit was further divided into segments of 4x4 km. As the field area in Ukraine is 50 to 150 ha each segment was expected to average 15 to 20 fields. For any segments with more than 20 fields, the segment area was reduced to 2x2 km. During ground surveys surveyors were assisted with up-to-date satellite images (mostly Landsat-5). Based on data from the ground surveys, satellite images were classified using neural networks and decision trees. [Ünal, 2006] describes a pilot study to use remote sensing imagery in conjunction with a ground survey to estimate wheat acreage in the provinces of Konya and Adana in Turkey. The approach taken for acreage estimation was to determine the proportional distribution of the crops in the sampled segments (500 x 500 m), over the agricultural areas and apply this proportion to the total agricultural land area from the classification. The classification used Landsat TM and ATM data in conjunction with data from the ground survey. Image materials for the ground survey were prepared using high resolution imagery (SPOT 5 in Konya and IKONOS for Adana). Wheat acreage alone was estimated in Adana, but a wheat-barley combination was estimated in Konya, since it is difficult to separate wheat and barley through satellite imagery classification. In both provinces wheat (Adana) and wheat-barley (Konya) acreage was below official figures for both the classified and extrapolated (from segment proportions) estimates.

Crop area estimation from extrapolation yielded an estimate within 16.3% for Adana and within 13% for Konya. Classification estimates were within 5% for Adana, but only within 27% in Konya. USDA-NASS’ remote sensing program has for many years provided significant input into the Agency’s acreage setting process through a remote sensing regression estimate, in which reported June Area Survey (JAS) acreage of the various crops is regressed on counted pixels of the crop. Intuitively, crop acreage can be derived directly from counting pixels of a specific crop type. However, pixel counting estimates consistently underestimate the actual area under crop, a problem that can be remedied through regression. USDA-NASS initiated its remote sensing acreage estimation program in the 1970s and early 1980s with the Large Area Crop Inventory Experiment (LACIE) and Agriculture and Resources Inventory Surveys through Aerospace Remote Sensing (AgRISTARS), to determine if crop acreage estimates could be derived using multispectral imagery and ground truth data [Bailey and Boryan, 2010]. These programs were successful at generating unbiased statistical estimates of crop area at the state and county level and reducing the statistical variance of acreage indications from farmer reported surveys (Craig, 2010). NASS’ remote sensing acreage estimation program evolved over the years paving the way for the current GIS-based Cropland Data Layer (CDL) program which has been in existence since 1997. In addition to the many other uses of the CDLs [Mueller, Seffrin, 2006], a primary use is serving as a convenient platform for its regression process of deriving supplementary crop acreage estimates. With the CDL process in place the regression estimator becomes JAS crop acreage in its segments regressed on CDL pixel classified acreage in the segments. In the modeling process, segments identified as outliers that do not fit the linear regression relationship are reviewed and removed from consideration if in error. This JAS-CDL regression estimation improves upon the JAS estimate by leveraging the correlation between the JAS reported acres and the CDL pixel count in each stratum and results in an independent acreage estimate with a lower coefficient of variation than direct expansion alone. With improved software and the increased availability of both imagery and “ground truth” data (some of the latter of which is now coming from another USDA agency) over the past few years, the extent and timeliness of the remote-sensing indications of acreage supplied to the Agricultural Statistics Board for use in setting the official estimates has increased dramatically. [Boryan, et al 2011] provides an overview of the USDA-NASS CDL program. It describes the various input data sources, processing procedures, classification and validation procedures, accuracy assessment, CDL product specifications, dissemination venues, and the crop acreage estimation methodology. In general, total crop mapping accuracies for the 2009 CDLs ranged from 85% to 95% for the major crop categories. The NASS area sampling frames are based on the stratification of US land cover by percent cultivation. Recently, an automated stratification method based on the NASS CDL was developed to efficiently and objectively stratify US land cover [Boryan and Yang, 2012 and 2013]. This method achieved higher accuracies in all cultivated strata with statistical significance at a 95% confidence level. This project developed crop specific covariate data based on 2007 – 2010 CDLs. Crop (corn, soybeans, wheat and cotton) and non-crop (forest, urban and water) covariate data were derived and validated for six states. Producer and user accuracies for the covariate data sets were based on independent 2011 Farm Service Agency Common Land Unit data and 2011 CDLs. Non crop covariate data were validated using the USGS National Land Cover Data 2006.

While NASS and many other countries use regression to adjust for remote sensing misclassification in creating area estimates, procedures based on confusion matrices [Card, 1982] and calibration are also options. Within the category of calibration, there are two different classes of calibration estimators 1) classical models that predict the known but imperfect measurements using the unknown true state and 2) inverse models that predict the true but unknown state using known but imperfect measurements. [Czaplewski, Catts, 1992] presents the results of a Monte Carlo simulation study comparing the performance of the classical versus inverse calibration models. For this simulation study the sampling was from a population based on detailed remotely sensed classifications from photo-interpretation of 1:12,000 23cmx23cm color infrared stereo transparencies from the Piedmont and Coastal plain of North Carolina. While this study was in the context of forest classification, certainly the techniques discussed apply equally well to crop classification. The results in this study showed a clear advantage of the inverse calibration models over the classical ones in terms of both precision and bias given the conditions of the simulation study. The authors also estimated the number of reference (i.e., ground truth) plots required. The authors did point out, however, that their sites were a simple random sample of homogeneous and accurately registered reference plots. The use of heterogeneous reference sites, stratified sampling, or purposefully selected reference sites could yield different results. The choice of calibration vs. regression basically comes down to the characteristics of the ground truth sample you’re working with. Calibration estimators are the better choice if the field data are sampled as unclustered points. Regression estimators work better if the field data sample is of clustered points or segments [Gallego, 2011}. Various researchers, including [Marshal, et al, 2011] have proposed procedures for crop area estimation in which visual interpretation of high resolution imagery of a sample of grid points is substituted for ground observations. This particular report trumpets the advantages of this in developing countries where a structured statistical ground survey may be too costly or otherwise infeasible. While the Marshal, et al. approach shows some promise, validation efforts showed sizable omission errors for crop detection, especially for irrigated crops. The major problem, as shown with similar attempts at using this approach, stem from the fact that commission and omission errors in the visual interpretation are generally not offsetting and the subjectivity introduced through this process is often of the magnitude of the larger of these – often resulting in area estimates that are off by 10 percent or more. One other weakness of the Marshall, et al. study for general crop estimation use is that it used a binary, logistic modelling process that simply modelled crop vs. non-crop, with no further actual crop identification. [Csornai, et al, 2006] discusses a pure remote sensing approach to area and yield estimation, CROPMON, which was adopted in Hungary operationally starting in 1997. It operated primary on a combination of multi-temporal low, medium and high resolution imagery. The only ground data were 100-200 samples to train the classifiers and to validate the accuracy of the derived maps. Up until 2004, when it was suspended due to a redirection of financial resources, the CROPMON program was run parallel to the crop estimation program operated by the Central Statistical Office of Hungary. According to the report the results compared very favorably. For crop area estimation, [Fritz, et al, 2006] described a “pure pixel sampling” approach to estimate class proportions, when using a combination of high and medium/low resolution imagery. After describing this methodology, it was compared to approaches used by GEOLAND partners Infoterra France (ITF) and
VITO. The ITF process uses a neural network (NN), while VITO uses an inversion model. The testing was based on both qualitative (e.g. amount and cost of input data) and quantitative (i.e., RMSE, mean absolute error, a significance test, and R2) measures. The three methods compared in this study used medium/low resolution data with a high temporal resolution, specifically, SPOT-VEGETATION (VGT), MODIS and MERIS. Landsat TM was the high resolution imagery used. The alternative area estimate methodologies were compared for Belgium for maize and sugar beets/potatoes for the 2003 crop season. The Russian test site, in which winter crops for 2005 were targeted, consisted of six sub-oblast districts. The main difference between the Belgian and Russian test sites were the relative sizes of the crop fields, with the Russian fields typically much larger than those found in Belgium. The test results for the six Southwest Rostov districts indicated that all methods worked reasonably well for large fields, and there was no significant difference between the methods. The test results for Belgium, however, were somewhat more interesting, showing: 1) the ITF inversion model did not work very well, particularly for maize, likely due to the geo-location problem of MERIS data at the time of analysis, combined with the complexity of the landscape and its small fields; 2) the VITO NN tended to perform best, and, in general, better results were obtained when using VGT, rather than MODIS data. The authors concluded that further investigation should be made to clarify this latter result, and to verify the performance of NN in conditions where less extensive ground training data are available. [Jiao, et al., 2006] presents an interesting approach to paddy rice area estimation that was used operationally in China in 2005. This was a nearly pure remote sensing operation, although some ground data were collected to train the classification, which was based on MODIS imagery. In this application a large-scale survey was conducted to estimate paddy rice area, but all of the data collection for the survey was done through interpretation of high-resolution imagery. The authors described the full setup of the stratified design, including the stratification, stratum creation, and the sampling procedure. The sampling units in this case were the areas represented on standard 1:50000-scale topographic maps and the maps themselves were sampled. Stratification was based on a highest to lowest ordering of the maps based on the indicated percentage of the area of the map planted to paddy rice, based on the classification. Proportional sampling was done in six strata formed through the cumulative square root of frequency process. Survey data were “collected” through interpretation of high-resolution Landsat TM imagery and synthetic aperture radar (SAR) data from ASAR and RADARSAT. SAR was deemed to be necessary for this application data because of its robustness to cloudiness, and the fact that there is considerable rain and cloudiness in the paddy rice growing area during the growing season. Apparently, the flooding of the target crop during the growing season, with water signatures mixed with the green plants, made SAR imagery more useful in this effort than it might be for a non-flooded crop. Overall, the results of this crop area estimation effort seemed to be very good for the 2005 crop season. In [Lochan, R., 2006] the survey approach used for crop production forecasting in India is described, as well as initiatives that have been undertaken over the years to improve it, including the most current one called Forecasting Agricultural output using Space, Agro-meteorology, and Land (FASAL). The predecessor of this initiative was Crop Acreage and Production Estimates (CAPE), which was first launched in 1987 to utilize remote sensing techniques in crop area and production forecasting. The CAPE project has successfully achieved national-level forecasts of wheat and kharif rice, in addition to making district level pre-harvest production forecasting of cotton, sugarcane, rapeseed/mustard and rabi sorghum in their major growing regions in the country by using remote sensing technology and other auxiliary information. It has overcome the problem of persistent cloud cover during the kharif season by using SAR data from RADARSAT.

According to Lochan, FASAL is designed to further and expand the work of CAPE and aims at multiple in-season forecasts of crop area and production. Crop forecasts at the planting stage are made via econometric and agro-meteorological models using the previous year’s crop acreage and production, market price, current season weather forecast/observed data, and other auxiliary information. Remote sensing techniques for crop assessment will begin about 45 days after planting. Econometric data, remote sensing information, weather data, and field observations all provide complementary data, which FASAL will integrate into a common system. [Hooda, et al, 2006] provides additional information on the Indian experience at crop forecasting using remote sensing technology, in particular, focusing on wheat production in the state of Haryana. The authors present a time series of how well remote sensing based estimates have compared over the years for both crop area and production since their inception in 1986. Improvement in the resolution of sensors and methodology, as well as increased computing power, has clearly improved their estimates over time. They’re currently using LISS-III of Resourcesat with 23.5m resolution. Remote sensing imagery is used for both stratification and estimation. The stratification is on intensity of agriculture and is updated every 3-5 years. Segment sizes have decreased from 10 x 10 m, to 7.5 x 7.5 m, and finally to 5 x 5 m, while sampling rates have increased. Some of the small districts in the state of Haryana are now completely enumerated. Overall, Hooda reports that the area and production district-level estimates are within 5 percent of official Indian estimates and are produced about a month before harvest. Further research into improvement will focus on model improvement through possibly improving crop parameter retrieval from satellite sensors by incorporating atmospheric correction using geophysical products on ozone, water vapor, and aerosols. Two excellent, descriptive, and up-to-date documents on the crop production forecasting and estimation system in Pakistan published jointly by the FAO, the UN and the Pakistan Space & Upper Atmosphere Research Commission (SUPARCO), are [FAO, UN, SUPARCO, 2012a, 2012b]. These documents provide very comprehensive and detailed information on the remote sensing processes as well as the survey ground data collection in Pakistan. [Narciso, et al, 2008] presents the results of a feasibility study in using SAR data in the Tuscany region of Italy for crop production estimation. In the interest of avoiding the time required for ground data collection and processing, the research hoped to leverage the properties of SAR data to explore the possibility of accurate crop classifications through a pure remote sensing approach. On the surface, SAR’s unique characteristics are attractive for a crop production estimation program. In particular, SAR images are 5 to 10 times cheaper than optical images with a similar spatial resolution, making a multi-temporal approach with full coverage of large areas affordable. In this study, ancillary data in the form of land cover data (Corine), meteorological data, elevation data, and statistical data on planted areas during 2004-2005 were used to improve the interpretation and classification of the images. The study itself was largely deemed unsuccessful, since the resulting classifications were not sufficiently accurate for operational use, especially early in the crop season. However, the classifications did seem to resolve over the course of the season. Overall, the accuracy in identifying single land use classes was not encouraging. However, it did appear possible to discriminate between broad groups of crops. New Direction Research: One of the real challenges in USDA-NASS is to assimilate estimates from a variety of survey mechanisms into the best crop estimate for a given month. For example, crop yield

estimation at the Agency is primarily based upon three probability-based survey programs: the Agricultural Yield Survey (AYS), Objective Yield Survey (OYS), and December Agricultural Survey (DAS). The AYS and OYS, both of which are panel surveys, sub-sampled from the June Agricultural Survey, are conducted monthly for in-season reports from August through November, and the OYS also occurs in December. During any given month, USDA official estimates are set by the Agricultural Statistics Board, a panel of Agency employees, who evaluate the various survey estimates (often referred to as indications) along with other available information on weather, from remote sensing, etc. and come up with the best possible estimate. To a large extent this process is qualitative and subjective. It’s also not necessarily reproducible, and it doesn’t allow for a true indication of uncertainty on the final result. There’s currently research being conducted in the Agency’s Research and Development Division to synthesize all the inputs in a quantifiable way. [Adrian, 2012] is a very recent paper written on this issue, presenting a possible modeling approach to address it. USDA-NASS has focused some of its recent research efforts on combining models that utilize survey and administrative with remote sensing data. [Bellow, Lahiri, 2010] is one such paper that describes a process of incorporating remotely sensed NDVI data into an empirical Bayes model. Such efforts to combine the best available survey data, administrative data (such as precipitation and temperature), and remotely sensed information into modeling efforts would appear to hold strong potential for improvement in forecasting and estimating crop production. As can be seen in [Bellow, Lahiri, 2010], the basic approach of combining data from a variety of sources in estimating area and yield is being explored by NASS, at least in part, from the standpoint of small area estimation. Obtaining accurate estimates of area and yield for small areas, which in the case of the U.S. are counties, is very important for a number of reasons, not the least of which is implementing farm policy. A couple of follow-on papers building on the small area estimation in this evolving research are [Bellow, Lahiri, 2011] and [Bellow, Lahiri, 2012]. Conclusions/Recommendations The topic of crop area estimation is very mature and multiple methods (area sampling, list sampling, point sampling with or without a grid) have proven to be successful. Thus, there is less of a GAP opportunity than for crop yield forecasting and estimation. One area that probably may need continuous research is for more cost effective methods, especially in developing or under-developed nations. Thus any research aimed at reducing the cost of sampling frame construction or data collection would seem to have a role. Perhaps even transect sampling or road grid sampling could be studied as well in an attempt to reduce costs in the future. New technologies have played a major role with GIS, GPS, remote sensing etc., but there seems to be new ones every year or so that could be examined. One area is emergency surveys when a major flood or drought occurs after the initial measuring of crop area. Having an infrastructure ready could be very important. There may even be a useful role for peaceful non-military airborne drones with remote sensing capability.
GAP Analysis For Crop Area Estimation
The GAP analysis for crop area estimation is easier than for crop yield forecasting by the nature of the task and the status of the art. Crop area estimation, at the national level, is more established and mature than crop yield forecasting. However, globally, there is still substantial variation in methods and practices. Addressing accuracy first, it is important to address national versus small area estimation. Nationally, there are many fairly mature systems based upon farmer reported censuses and sample surveys, to area frame and multiple frame based sample surveys, to grid and point based systems such as JRC, and regression estimates based upon some combination of ground-gathered data and remotely sensed data. It may be a matter of addressing which methods apply to certain nations. In terms of accuracy, it seems to be a choice between accuracy and cost, assuming each has an approximate level of timeliness. Currently, accuracy measures seem to vary at the national level between 1-5 percent or worse. At the small area level, statistical measures are rarely available and are generally unknown. Over the next five to ten years, there seems to be great opportunity for new measurable accuracy measures of small area crop estimation to the 5 percent level. This seems to be a major GAP analysis opportunity. One of the major issues seems to be the cost and complexity of the state of the art solutions. It is recommended that some of the upcoming research be aimed at cost reduction options. These may include use of technology such as tablets and GPS, or new sampling methods such as transect or road network sampling. Another major GAP analysis opportunity seems to be the development of emergency survey infrastructure for major flood and drought situations after planting and before harvest.

References Adrian, D. (2012) “A model-based approach to forecasting corn and soybean yields”, Proceedings of the Fourth International Conference on Establishment Surveys (ICES), Montreal, Canada, available through the American Statistical Association, Bethesda Maryland, June 2012
Bellow, M., and Lahiri, P. (2010) “Empirical Bayes Methodology for the NASS County Estimation Program”. Section on Survey Research Methods, JSM 2011, American Statistical Association, Bethesda Maryland. Bellow, M., and Lahiri, P. (2011) “An Empirical Best Linear Unbiased Prediction Approach to Small-Area
Estimation of Crop Parameters”, Section on Survey Research Methods, JSM 2011, American Statistical
Association, Bethesda Maryland.
Bellow, M., and Lahiri, P. (2012) “Evaluation of Methods for County Level Estimation of Crop Harvested
Area that Employ Mixed Models”, Proceedings of the DC-AAPOR / WSS Summer Conference, American
Statistical Association, Bethesda Maryland.
Bailey, J. and Boryan, C. (2010) “Remote Sensing Applications in Agriculture at the USDA National Agricultural Statistics Service”, Research and Development Division, USDA, NASS, Fairfax, VA. Bettio, Manola; Bruyas, Pierre; Delincé, Jacques; Croi, Willibald; and Eiden, Gerd. (2002) “Area frame surveys: Aim, Principals and Operational Surveys”, internal report, European Community, Joint Research Center, Ispra, Italy. Boryan, Claire and Yang, Zhengwei. (2013) “Deriving Crop Specific Covariate Data Sets From Multi-Year NASS Geospatial Cropland Data Layers”, Proceedings of the IEEE International Geoscience and Remote Sensing Symposium, IGARSS 13, Melbourne, Australia, July 2013. Boryan, C. G., and Yang, Z. (2012) “A new land cover classification based stratification method for area sampling frame construction”, Proc. in First Intl. Conf. on Agro-Geoinformatics, Shanghai, China, August 2-4th, 2012. Boryan, Claire. (2012) “A Review of Four Area Sample Designs”, Paper prepared for course GGS796 at George Mason University; Available from Research Division, National Agricultural Statistics Service, USDA, Fairfax,
Virginia.
Boryan, Claire; Yang, Zhengwei; Mueller, Rick; and Craig, Mike. (2011) “Monitoring US agriculture: the US Department of Agriculture, National Agricultural Statistics Service, Cropland Data Layer Program”, Geocarto International, 26, (5): pg. 341-358. Breidt, F. and Fuller, W. (1999) “Design of supplemented panel surveys with application to the National Resources Inventory”, Journal of Agricultural, Biological, and Environmental Statistics, 4(4): 391 – 403. Card, D.H. (1982) “Using known map categorical marginal frequencies to improve estimates of thematic map accuracy”, Photogrammetric Engineering and Remote Sensing, 46: pg. 431-439.

Carfagna, E. and Keita, N. (2009) ”Use of modern geo-positioning devices in agricultural censuses and surveys” Bulletin of the International Statistical Institute, the 57th Session, Proceedings, Special Topics Contributed Paper Meetings (STCPM22) organised by Naman Keita (FAO), Durban, August 16-22, 2009. Carfagna, E. (2004) "List frames, area frames and administrative data, are they complementary or in competition?" Proceedings of the MEXSAI Conference organized by Eurostat, FAO, OCSE, UN/ECE, NASS/USDA, JRC, ISI, Istat, SAGARPA, Cancun (Mexico), 2-4 November 2004. Carfagna, E. and Gallego, F.J. (2005) “Using Remote Sensing for Agricultural Statistics”, International Statistical Review, volume 73, number 3, December 2005, pp. 389-404, ISSN 0306-7734. Cotter, J.; Davies, C.; Nealon, J.; and Roberts, R. (2010) “Chapter 11. Area Frame Design for Agricultural Surveys”, Agricultural Survey Methods, Edited by Benedetti, R., Bee, M., Espa, G., Piersimoni, F., John Wiley & Sons, Ltd. Published Online: 25 March 2010. Craig, Mike (2010) “A History of the Cropland Data Layer at NASS”, Unpublished manuscript, Research and Development Division, USDA, NASS, Fairfax, VA. Csornai, G.; Wirnhardt, Cs.; Suba, Zs.; Nádor, G.; Tikász, L.; Martinovich, dr. L.;, Kocsis, A.; Zelei, Gy.;
László, I.; and Bognár, E. (2006) “CROPMON: Hungarian Crop Production Forecast by Remote Sensing”,
Compilation of ISPRS WG VIII/10 Workshop 2006, Remote Sensing Support to Crop Yield Forecast and
Area Estimates, EC/JRC, Stresa, Italy.
Czaplewski, R. and Catts, G. (1992) “Calibration of Remotely Sensed Proportion or Area Estimates for Misclassification Error”, Remote Sens. Environ. 39: pg. 29-43. Davies, C. (2009) “Area Frame Design for Agricultural Surveys”, RDD Research Report, Research and Development Division, USDA-NASS, Fairfax, VA. Delincé, Jacques. (2001) “A European Approach to Area Frame Surveys”, Proceedings of the Conference on Agricultural and Environmental Statistical Applications in Rome (CAESAR), Joint Research Centre of the European Communities (JRC); June 5-7, 2001. Food and Agriculture Organization. (1996) “Multiple frame agricultural surveys. Volume 1: Current surveys based on area and list sampling methods”, United Nations FAO Statistical Development Series No. 7, Rome, Italy, 119p. Food and Agriculture Organization. (1998) “Multiple frame agricultural surveys. Volume 2: Agricultural survey programs based on area frame or dual frame (area and list) sample designs”, United Nations FAO Statistical Development Series No. 7, Rome, Italy, 242p. Food and Agriculture Organization. (2012a) “Pakistan: How SUPARCO Makes Crop Forecasts and Estimates based on integral use of RS data”, UN FAO & SUPARCO Publication. Food and Agriculture Organization. (2012b) “Advanced Training on Monitoring of Crops through Satellite Technology”, UN FAO & SUPARCO Publication.
Ferreira, S. L.; Newby, T.; and du Preez, E. (2006) “ Use of Remote Sensing in Support of Crop Area
Estimates in South Africa”, Compilation of ISPRS WG VIII/10 Workshop 2006, Remote Sensing Support to
Crop Yield Forecast and Area Estimates, EC JRC, Stresa, Italy.
Fritz,S.; Massart,M.; Savin,I.; and Leo,O. (2006) “The Use of MODIS Data in Southern Russia for Crop
Acreage Estimations and Inter-Comparison of Results from Various Crop Acreage Estimation Methods”,
Compilation of ISPRS WG VIII/10 Workshop 2006, Remote Sensing Support to Crop Yield Forecast and
Area Estimates, EC JRC, Stresa, Italy.
Gallego, F. J., (2011) “The use of area frame surveys and remote sensing”, Agriculture unit, IPSC, JRC. Gallego, J.; Craig, M.; Michaelsen, J.; Bossyns, B.; and Fritz, S. (2008) “Workshop on Best Practices for Crop Area Estimation with Remote Sensing Data: Summary of Country Inputs”, Group on Earth Observations (GEO), GEOSS Community of Practice Ag Task 0703a, EC JRC, Ispra, Italy. Gallego, F. J. (2006) “Review of the Main Remote Sensing Methods for Crop Area Estimates Agriculture
unit”, Compilation of ISPRS WG VIII/10 Workshop 2006, Remote Sensing Support to Crop Yield Forecast
and Area Estimates, Stresa, Italy, Agriculture Unit, IPSC, JRC.
Gallego, F. J. (1999) “Crop Area Estimation in the MARS Project”, Agriculture and Regional Information Systems, Space Applications Institute, JRC. Gallego, F. J. (1995) “Sampling Frames of Square Segments”, MARS Project, Institute for Remote Sensing Applications, JRC, Report EUR 16317, ISBN 92-827-5106-6. Hanuschak, G. and Delincé, J. (2004) “Utilization of Remotely Sensed Data and Geographic Information
Systems (GIS) for Agricultural Statistics in the United States and the European Union”, Proceedings of
the MEXSAI Conference, Cancun, Mexico November 2004.
Hooda, R.S.; Yadav, M.; and Kalubarme, M.H. (2006) “Wheat Production Estimation Using Remote
Sensing Data: An Indian Experience”, Compilation of ISPRS WG VIII/10 Workshop 2006, Remote Sensing
Support to Crop Yield Forecast and Area Estimates, Stresa, Italy, Agriculture Unit, IPSC, JRC.
Huddleston, H. F. (1978) “Sampling Techniques for Measuring and Forecasting Crop Yields”, Economics, Statistics and Cooperative Service (now NASS), USDA, Washington, DC. Jacques, P. and Gallego, Javier (2006) “The LUCAS 2006 project – A new methodology”, Compilation of ISPRS WG VIII/10 Workshop 2006, Remote Sensing Support to Crop Yield Forecast and Area Estimates, Stresa, Italy, JRC-ISPRA – MIPSC/AGRIFISH unit. Jiao, X.; McNairn, H.; Yang, B.; Jiali Shang, J.; and Zhiyuan PEI, Z. (2006) “Operational crop acreage
estimation at a national scale based on statistics and remote sensing”, Compilation of ISPRS WG VIII/10
Workshop 2006, Remote Sensing Support to Crop Yield Forecast and Area Estimates, Stresa, Italy.

Jonsson, P. and Eklundh, L. (2004) “TIMESAT––A program for analyzing time-series of satellite sensor data”, Computer & Geosciences, vol 30: pg. 833– 845. Kussul, N., Shelestov, A., Skakun, S., Kravchenko, O., Moloshnii, B. (2012) “Crop State and Area Estimation in Ukraine Based on Remote and Insitu Observations”, EC JRC, Ispra, Italy. Lochan, R. (2006) “System of Collection of Agricultural Statistics in India Including Land Use and Area Statistics” Internal report, Directorate of Economics and Statistics, New Delhi, India. Marshall, M. (2011) “A High Resolution Satellite Interpretation Technique for Crop Area Monitoring in Developing Countries”, Report to the Climate Hazards Group, University of California, Santa Barbara. Mueller, R. and Seffrin, R. (2006) “New Methods and Satellites: A Program Update on the NASS
Cropland Data Layer Program”, Compilation of ISPRS WG VIII/10 Workshop 2006, Remote Sensing
Support to Crop Yield Forecast and Area Estimates, Stresa, Italy.
Narciso, G., Baruth, B., Klisch, A. (2008) “Crop Area Estimates with Radarsat: Feasibility Study in the Toscana Region – Italy”, Internal report, JRC, IPSC – Agriculture Unit. Nusser, S. and J. Goebel (1997) "The National Resources Inventory: A Long-Term Multi-Resource Monitoring Programme," Environmental and Ecological Statistics, 4(3):181- 204. Rembold, F. and Maselli, F. 2006. “Estimation of Inter-annual Crop Area Variation by the Application of
Spectral Angle Mapping to Low Resolution Multitemporal NDVI Images”, Photogrammetric Engineering
& Remote Sensing Vol. 72, No. 1, pp. 55–62.
SADC Secretariat (2009) “Regional Early Warning System for Food Security”, Selected Technical Papers
on Methodology of Food Crop Forecasting in SADC, South African Development Community, FANDR
Directorate.
NASS-SMB (2012) “The Yield Forecasting and Estimating Program of NASS”, NASS Staff Report No. SMB 12-01, Statistical Methods Branch, Statistics Division, National Agricultural Statistics Service, U.S. Department of Agriculture, Washington, D.C. Ünal, E., Mermer, A., Urlaa, Ö., Ceylan, N., Yıldız, H., Aydoğdu M., (2006) “Pilot Study on Wheat Area Estimate in Turkey”, Internal report, Central Research Institute for Field Crops, GIS and RS Department, Yenimahalle, Ankara, Turkey. 2006.


