A Liquid Assay for Screening Fungal Virulence Factors
36
i A Liquid Assay for Screening Fungal Virulence Factors A Major Qualifying Project Submitted to the faculty Of WORCESTER POLYTECHNIC INSTITUTE In partial fulfillment of the requirements for the Degree of Bachelor of Science In Biology and Biotechnology By __________________ Pamela Levandowsky Submitted and Approved on April 24, 2008 By ________________________________ Samuel M. Politz Ph.D, Project Advisor ________________________________ Reeta Prusty Rao Ph.D, Project Advisor
Transcript of A Liquid Assay for Screening Fungal Virulence Factors

i
A Liquid Assay for Screening Fungal Virulence Factors
A Major Qualifying Project
Submitted to the faculty
Of
WORCESTER POLYTECHNIC INSTITUTE
In partial fulfillment of the requirements for the
Degree of Bachelor of Science
In Biology and Biotechnology
By
__________________
Pamela Levandowsky
Submitted and Approved on
April 24, 2008
By
________________________________
Samuel M. Politz Ph.D, Project Advisor
________________________________
Reeta Prusty Rao Ph.D, Project Advisor

ii
Abstract It is difficult to develop drugs against fungal infections due to the fact that both
fungi and their hosts are eukaryotic. Using a model host-pathogen system, factors
involved in the infection can be identified and studied. By using these two genetic model
organisms and this assay in high-throughput screens of genetic knockouts, fungal
virulence factors can be identified. We are developing a liquid culture assay for studying
the effects of co-culturing Caenorhabditis elegans with Saccharomyces cerevisiae
mutants. We tested several different conditions including different liquid media, E.coli to
Yeast mass ratios, and C. elegans mutant strains. From the results of all the experiments,
we concluded that there are other factors that can cause the death of the C. elegans in
liquid assay which are not S. cerevisiae related.

iii
Acknowledgements
We would like to thank Professors Sam Politz and Reeta Prusty Rao for their
help, direction and insight on this project. We would also like to thank Charu Jain for her
help in the lab. We would also want to thank Meijiang Yun for her help with Sigma Stat
and mek-1 data.

iv
Table of Contents
Abstract .................................................................................................................................... ii Acknowledgements ................................................................................................................ iii Table of Contents ................................................................................................................... iv
Table of Figures ...................................................................................................................... iv Introduction .......................................................................................................................... - 1 -
Fungal Infections ............................................................................................................. - 1 -
Saccharomyces cerevisiae............................................................................................... - 1 - Caenorhabditis elegans ................................................................................................... - 3 - Model Host ...................................................................................................................... - 5 -
Previous Projects in the Politz and Prusty Rao laboratories ......................................... - 5 - Methodology ........................................................................................................................ - 7 -
Stock Plate Maintenance ................................................................................................. - 7 -
C. elegans Egg Preparation ............................................................................................. - 7 - Preparation of Liquid Assay ........................................................................................... - 8 - Assay Procedure .............................................................................................................. - 9 -
Data Analysis using Sigma Stat ..................................................................................... - 9 - Results ................................................................................................................................ - 11 -
S. cerevisiae Mutants .................................................................................................... - 11 -
Varying Mass Ratios ..................................................................................................... - 13 - C. elegans Mutants ........................................................................................................ - 16 -
Discussion .......................................................................................................................... - 21 -
Appendix 1: Raw Data ...................................................................................................... - 23 - Appendix 2: SigmaStat Set-Up......................................................................................... - 25 - References .......................................................................................................................... - 31 -
Table of Figures Figure 1 S. cerevisiea Life Cycle ........................................................................................ - 2 -
Figure 2: Anatomy of a C. elegans adult hermaphrodite ................................................. - 3 -
Figure 3: Life cycle of C. elegans ...................................................................................... - 4 -
Figure 4: Survival curve of C. elegans with S. cerevisiae mutants and E.coli in NGM- 11 -
Figure 5: Survival curve of C. elegans with different mass ratio of S. cerevisiae to E. coli
in S. medium ....................................................................................................................... - 13 -
Figure 6: Survival curves of N2 C.elegans at different mass ratios of S. cerevisiae to E.
coli with re-feeding ............................................................................................................ - 15 -
Figure 7: Survival curves of N2 and mek-1 C.elegans at different mass ratios of S.
cerevisiae to E.coli with re-feeding .................................................................................. - 17 -
Figure 8: Survival curves of N2 and fer-1 C.elegans at different mass ratios of S.
cerevisiae to E.coli at 20°C with re-feeding..................................................................... - 19 -

- 1 -
Introduction
In this project, we are developing a liquid culture assay for studying the effects of
co-culturing Caenorhabditis elegans with Saccharomyces cerevisiae mutants.
Saccharomyces cerevisias is a unicellular fungus, commonly known as baker’s yeast
(Daum, 2000). This host-pathogen model system will allow us to do a high-throughput
screen of the entire yeast genome. We expect to find the fungal virulence factors
involved in fungal infection.
Fungal Infections
Fungi are prevalent in the environment, many of which are pathogens that can
infect plants and animals, including humans. For example, fungi are the most common
cause of plant disease (Prescott et al., 2005). Fungi such as Sclerotinia sclerotorium can
cause infection of many crops (Huang et al., 2000). About fifty fungal species have been
found to cause disease in humans (Prescott et al., 2005), among which Candida albicans
is the most common human fungal pathogen (Heitman and Howlett, 2008). Statistics
have also shown that more than half of AIDS patients have infections caused by
pulmonary Pneumocystis carinii (Yang and Kerdel, 2006) and the occurrence of invasive
fungal infections in organ transplant patients continues to be high with a high mortality
rate (Gabardi et al., 2007). The rise of fungal diseases has many scientists working hard
on development of novel antifungal drugs. However, the task has not been easy due to
the fact that fungal pathogens are also eukaryotic with cellular machinery very similar to
that of their hosts. This makes drug target identification difficult thereby slowing the
process of drug development (Heitman, 2005).
Saccharomyces cerevisiae
Saccharomyces cerevisiae, a widely used eukaryotic genetic model, was chosen
as the pathogen in this project. S. cerevisiae was used instead of a human pathogen, such
as Candida albicans, because S. cerevisiae is the best studied eukaryotic cell (Prescott et
al., 2005), with its genome fully sequenced and its biology well understood (Forsburg,

- 2 -
1999). Compared with S. cerevisiae, the genomic sequence determination of human
fungal pathogen genomes is proceeding very slowly, one reason being that the genome of
S. cerevisiae is very similar to that of human fungal pathogens, so it is unnecessary to
find the genome of the human fungal pathogens (Goffeau et al., 1996). S. cerevisiae has
16 chromosomes and a small genome size of about 12 Mbp. About 6000 genes are
predicted to be in the genome, and the function of 80% of the predicted genes has been
characterized (Miller-Fleming, 2008). Major pathways such as cell cycle, regulation and
signal transduction first identified in S. cerevisiae are also conserved in higher
eukaryotes (Cooper and Hausman, 2007). This has made yeast a very good genetic
model for studying higher eukaryotes with more complex genomes. Besides all these
advantages, yeast is a safe, fast, and facile organism to culture in the laboratory that
makes it an attractive model system. Its fast reproduction cycle accelerates experiment
completion (Angier, 1986). Another advantage of using S. cerevisiae is that it provides
us with an available deletion library of more than 5000 genes that can be used in the
screening process of the project.
Figure 1 S. cerevisiae Life Cycle
S.cerevisiae has a budding mode of growth. It is normally a diploid with a long
G1 phase and overlapped S and M phases. When the cells have enough nutrients, they

- 3 -
will proceed with the cell cycle. When there is a lack of nutrients, the cells will either go
into a quiescent state or begin sporulation to become haploid. Haploid cells can go
through conjugation to become diploid again (Pringle, 1997).
Caenorhabditis elegans
C. elegan, are free-living in soil and are about 1mm in length. In the lab, they can
be maintained on agar plates or liquid cultures. They eat bacteria in the soil and are fed
with E. coli in the laboratory (Introduction to C. elegans Anatomy, 2006).
There are two sexes, hermaphrodite and male. The hermaphrodite is the most
abundant sex and males compose only about 0.1% of the time (Introduction to C. elegans
Anatomy, 2006).
Figure 2: Anatomy of a C. elegans adult hermaphrodite
The main shape is an unsegmented, cylindrical body that is tapered at the ends
(shown in Figure 1). In the body wall, there is a cuticle which surrounds the worm.
Within the wall there are four different systems; epithelial, nervous, muscle and
excretory. The internal organs are incorporated into two systems; alimentary and
reproductive. The alimentary includes the pharynx, intestine, rectum and anus. The
Reproductive System consists of the somatic gonad, the germ line and the egg-laying
apparatus (Introduction to C. elegans Anatomy, 2006).

- 4 -
Figure 3: Life cycle of C. elegans
Figure 3 shows the life cycle of a C. elegans hermaprhodite. This entire cycle
takes only three days at 20 degrees C. The stages of the life cycle are the embryonic
stage, larvae (L1-L4) stages, and adult (Introduction to C. elegans Anatomy, 2006).
The embryonic stage can be separated into two parts; proliferation and
organogenesis/morphogenesis. During the four postembryonic larval stages, the
development of the nervous system and the reproductive system occurs. If the egg
hatches and there is no food available, the larva stays at the L1 stage. The adult is the
fully developed reproductive form. (Introduction to C. elegans Anatomy, 2006).
The dauer larva is formed under conditions of food limitation, starvation, or a
high temperature. This stage is non-aging if the environment stays unfavorable for
growth. When the dauer larva is exposed to food or a more favorable environment, then
the worm exits the dauer stage and develops to the L4 and then into an adult,
(Introduction to C. elegans Anatomy, 2006).

- 5 -
Model Host
C. elegans has been used to provide important insights into how animals
perceived threats in the environment and defend themselves against infection. This
nematode has been very useful in many different aspects in biology such as
developmental biology, neurobiology, and ageing (Gravato-Nobre and Hodgkin, 2005).
C. elegans is an ideal model host for many reasons. From the practical standpoint
the advantages are low cost, easy maintenance, minimal lab space, and suitability for
automated animal sorting (Gravato-Nobre and Hodgkin, 2005).
They also have a small genome size. This has helped scientists to determine the
complete DNA sequence of the genome. Self-fertilization is an important aspect of C.
elegans for genetic analysis. Another aspect that is important for studying development
is that their body is transparent allowing observation of all cells and cell divisions from
egg to adult. This also makes it easier to observe the infection process (Gravato-Nobre
and Hodgkin, 2005).
Either in the soil or in the laboratory, C. elegans eats bacteria, which constitutes a
convenient route for infection by microbes, as well as the application of RNA interface-
based gene silencing (Gravato-Nobre and Hodgkin, 2005).
C. elegans is a very important model in studying innate immunity. There are
at least four different pathways that are involved in the innate immunity; DBL-1, DAF-
2/DAF-16, p38 MAP kinase, and ERK. There is a common theme with all the pathways,
in that the signaling pathways involved in innate defenses involve protein cassettes that
play essential roles in other, seemingly unrelated developmental or physiological
processes (Ewbank, 2006).
Previous Projects in the Politz and Prusty Rao laboratories
Previous studies have identified S. cervisiae mutants that are virulent as well as
worm mutants that show altered susceptibility to yeast infection. It was found that S.
cerevisiae could infect C .elegans and induce the Dar phenotype. C. elegans produces
reactive oxygen species (ROS) which are produced by the product of the bli-3 gene, a

- 6 -
NADPH-dependent oxidase required for normal cuticle formation. Preliminary evidence
suggests that production of ROS by BLI-3 may protect C. elegans against yeast
pathogenesis (Charu Jain and R. Prusty Rao, unpublished). S. cerevisiae may then use
gene products of YAP 1 and SOD 1 to neutralize the effect of ROS. YAP 1 is a
transcription factor in S. cerevisiae that is critical for oxidative-stress response (Maeta et
al., 2004). SOD1 encodes the protein superoxide dismutase, which can neutralize ROS by
converting superoxide radicals to hydrogen peroxide and molecular oxygen (Cox et al.,
2002).
These results suggest that a high-throughput assay would allow us to conduct an
unbiased whole genome screen for novel fungal virulence factors as well as host
immunity modulators. However, experiments on agar plates are labor intensive and time
consuming. In order to screen the deletion libraries of S. cerevisiae, a more efficient
assay is needed. We decided to try to develop a liquid culture assay in microtiter plates.

- 7 -
Methodology
Stock Plate Maintenance
The stocks of C. elegans strains were kept on 60 mm agar plates of NGM medium
with an E. coli OP50 lawn at 16oC. Three hermaphrodites were transferred every 5 to 7
days to fresh plates. The plates were transferred to 20oC four days before egg
preparations were done (Kelly and O’Brien, 2007).
Mutant C.elegans
Fer-1 mutant C. elegans is temperature-sensitive fertilization defective. At 20 °C,
fer-1 hermaphrodites are infertile. The fer-1 gene product is required for Ca2+
-mediated
membrane fusion during C.elegans spermiogenesis. Fer-1 mutation alters the sensitivity
to Ca2+
, which affects the membranous organelle fusion and results in abnormal sperm
(Washington and Ward, 2006).
C. elegans Egg Preparation
Egg preparations were used to start developmentally synchronous liquid cultures
in microtiter wells. Use of egg preparations also helped avoid contamination due to the
use of bleach treatment to lyse worms, which sterilized the egg preparation. To make
sure the worms were exposed to yeast are at the same stage of development, eggs were
harvested as follows.
The egg preparation stock plates were prepared three to five days earlier to obtain
the maximum number of eggs on plates. Plates were not used if they did not contain
enough eggs or if the plates had starved. These plates were washed with M9 buffer to
remove eggs and worms. Then the liquid was transferred to a 15mL conical tube. It was
centrifuged into a pellet for two minutes at 900xg. The supernant was removed using a
Pasteur pipette. Twelve milliliters of bleach solution, which consisted of 0.25M NaOH
dissolved in a 1:4 dilution of commercial bleach in dH2O, was added to the conical tube
to lyse the worms. The eggs were more resistant to the bleach solution, so they stayed
intact. The tube was rocked for three minutes and centrifuged for another two minutes at

- 8 -
900xg. The superntant was removed quickly, and then sterile M9 was added to wash the
eggs free of traces of bleach. Between washes, samples were centrifuged for two minutes
at 900xg and the supernatants were removed.
After the second wash, the pellet was resuspended in 5 mL of M9 buffer. Three
10µL drops were added to an unused agar plate to determine the average egg count for a
giving volume. A volume containing about fifteen to twenty eggs was then transferred
into the microtiter wells and incubated at 20oC to mature.
Preparation of Liquid Assay
A single colony from a streaked plate of E. coli OP50 was added to 5 mL of LB
and incubated in 37oC for three days. A single colony from a streaked plate of S.
cerevisiae, such as RPY101 strain, was added to 5 mL of YPD and incubated at 30oC for
three days.
After the three days, the tubes were removed from the incubators and the
absorbance at _600__ nm was taken. For S. cerevisiae, YPD was used as a blank and for
E. coli, LB was used as a blank. The dilution for the absorbance was 1:10. It is important
to take into account that S. cerevisiae yeast cells are very large compared to E. coli cells.
To determine the number of cells per milliliter for S. cerevisiae and E. coli, the
absorbance that was determined was converted to cells/mL using the factor 8 x 10⁸
cells/OD unit for E. coli and 2 x 10⁷ cells/OD unit for S. cerevisiae, also taking into
account the dilution factor, which was 10.
The mass ratio was determined by divided the calculated value of S. cerevisiae’s
cells/mL by the calculated value of E. coli’s cells/mL, then multiply the result by 10 since
one S. cerevisiae cell weigh 10 times more than an E.coli cell.
The total volume of liquid in each well was 750 μL. The volume of S. media
added equals to the total volume minus the volume of S. cerevisiae and E. coli together.
To each well there was an addition of 1 μL streptomycin 50 mg/mL to stop the growth of
E. coli and bacterial contaminants. Components were added to each sample in the
amounts indicated in Table 1.

- 9 -
Component Added Amount
E. coli 50 μL
Yeast 15 μL - 150 μL (depending on absorbance
and concentration)
S. medium 750 μL – (yeast + E. coli)
Streptomycin 1 μL of 50 mg/mL
Eggs 5-10 μL (depending on the egg count)
Total Volume 750 μL+ egg volume + Strep volume
Table 1: Assay Set-Up
Assay Procedure
The microtiter plates were incubated at 20oC for ten to twelve days, during which
observations and data were recorded daily. The total number of live and dead worms was
recorded. Worms, that were not moving or that had larvae hatched inside of bodies, were
considered to be dead.
Data Analysis using Sigma Stat
A computer program called Sigma Stat was used to plot survival percentage as a
function of time. The statistics that were used is called LogRank. This compares the
survival distributions of two samples. It constructed by comparing the observed and
expected number of events in one of the groups at each observed event time and then
adding these to obtain an overall summary across all time points where there is an event.
Data were arranged in three columns; group, time and status. The group was each
condition to be compared. Time was the number of days since plating of eggs. Status
was alive or dead. For each day, each death was recorded in a separate line in the
spreadsheet. Each worm had to be entered in as an individual. For every worm that had
died that day there would be a one for the status and the number of rows for that day
would coincide with the number of worms that died that day. For each row there would
be the group name, the day, and a one for the status. If no worms died within a 24 hour
period then there would be a group name, the day, and for the status it would be left
blank.

- 10 -
To plot the graph and calculate significance between groups, the log-rank test was
used. Groups to be compared pairwise were chosen, and because worms could not
escape the microtiter wells, no data were censored (the set-up is also shown in Appendix
2).

- 11 -
Results All the Figures in this section are survival curves plotted using Sigma Stat.
C.elegans arrested at L1 stage when S. cerevisiae served as the only food
In wells that C.elegans were fed with 100% S. cerevisiae, the eggs hatched but
were all arrested at L1 stage in development (data not shown). This is consistent with
results from previous projects on agar plates.
S. cerevisiae Mutants
Wild type S. cerevisiae (Y101), S. cerevisiae SOD1 mutant and Sigma strain
(Y196) were used in this experiment. Sod1Δ is a superoxide dismutase deletion mutant.
Sigma (Y196) is a wild strain that is more virulent than Y101. The mass ratio of all S.
cerevisiae to E.coli was 1:30. NGM was used in all the wells.
Figure 4: Survival curve of C. elegans with S. cerevisiae mutants and E.coli in NGM
The Y axis is the percentage of live C.elegans each day. The X axis is the time of experiment in days. The C. elegans
were counted every day for 8 days. The mass ratio of S. cerevisiae: E.coli was 1:30.

- 12 -
Results of this experiment are shown in Figure 4. C. elegans grown on Y101 and
SOD1 were significantly different (P=<0.001). Sigma and Sod 1Δ were significantly
different from each other (P=<0.001). Sigma was not significantly different from the
Y101 control (P=0.141). However, C elegans grown on Sigma, which were expected to
die faster than Sod 1Δ, actually had a higher survival percentage by the end of the
experiment. This was probably due to difficulty encountered in counting. S. cerevisiae
became very dense in the center of wells during experiments, which made the field under
the microscope unclear for counting for all the conditions.

- 13 -
Varying Mass Ratios
The mass ratios used for the first experiment were 1:30, 1:60, 1:120, and 1:24 S.
cerevisiae: E. coli. After this first experiment the media was changed because the
S.cerevisiea was very thick due to the use of rich medium NGM. S. medium was used
subsequently because it contains no carbon or nitrogen source for S. cerevisiae to grow
and the counting would be more accurate.
Figure 5: Survival curve of C. elegans with different mass ratio of S. cerevisiae to E.
coli in S. medium
Y1E30 is a 1:30 mass ratio of S. cerevisiae to E.coli. The same notation was used for the other ratios of 1:60, 1:120,
and 1:240. The Y axis is the percentage of live C.elegans each day. The X axis is the time of experiment in days. The
C. elegans were counted every day for 8 days.
Results of an experiment to test the effects of different mass ratios of S.cerevisiea
and E.coli are shown in Figure 5. With a better view of the plate, 1:60, 1:120 and1:240
mass ratios of S. cerevisiae to E.coli were significantly different from1:30 (P = <0.001),
using pair wise comparisons. However, the majority of dead C.elegans had larva hatched

- 14 -
within their bodies. Whether the C.elegans died from S. cerevisiae infection or from the
hatching larva was unclear.

- 15 -
For the next experiment (Figure 6), C.elegans were fed on the third day of the
experiment with the same amount of S. cerevisiae used to start the experiment. Control
wells with E.coli only were fed with same amount E.coli.
Figure 6: Survival curves of N2 C.elegans at different mass ratios of S. cerevisiae to E.
coli with re-feeding
Y1E30 is the mass ratio of S. cerevisiae to E.coli, 1:30. The same notation is used for 1:60 mass ratios. The Y axis is
the percentage of live C.elegans on each day. The X axis is the time of experiment in days

- 16 -
C.elegans in re-feeding wells did live longer than the non-feeding ones in the
E.coli only condition (P = 0.038). But in 1:30 and 1:60 mass ratios, there was no
significant differences between re-feeding and non-feeding conditions (for 1:30, P =
0.176; for 1:60, P=0.134). However, dead C.elegans with larva hatched within bodies
were still observed during the experiment.
C. elegans Mutants
The C. elegans mutants that were used were mek-1(ks54) and fer-1(b232). Mek-1
encodes a MAP kinase that is required for resistance to killing by S. cerevisiae in agar
plate cultures (Meijiang Yun, unpublished results).

- 17 -
Figure 7: Survival curves of N2 and mek-1 C.elegans at different mass ratios of S.
cerevisiae to E.coli with re-feeding
The Y axis is the percentage of live C.elegans on each day. The X axis is the time of experiment. The number of
worms was counted each day for 11 days.
The experiment was done with three different conditions: an amount of equivalent
to that mixed with yeast in other samples, a mass ratio of S. cerevisiae to E. coli of 1:30,
and a mass ratio of S. cerevisiae to E. coli of 1:60. Results are shown in Figure 7. Mek-1
- 18 -
died significantly faster than N2 (P =<0.001) in both E.coli control and 1:60 mass ratio
conditions. The P value of 1:30 mass ratio was 0.958, from which we concluded that the
1:30 survival curve is not great enough to exclude the possibility that mek-1 lived longer
than the N2 strand is due to random sampling variability. Both mek-1 and N2 had many
dead C.elegans with larva hatched inside the bodies.
Fer-1 is a C. elegans mutant that is temperature-sensitive fertilization defective.
At 20 °C, fer-1(b232) hermaphrodites are infertile.

- 19 -
Figure 8: Survival curves of N2 and fer-1 C.elegans at different mass ratios of S.
cerevisiae to E.coli at 20°C with re-feeding
The Y axis is the percentage of live C.elegans on each day. The X axis is the time of experiment in days. The C.
elegans were counted everyday for 12 days.
The experiment was done with three different conditions: same amount of E. coli,
a mass ratio of S. cerevisiae to E. coli of 1:30, and a mass ratio of S. cerevisiae to E. coli
of 1:60. Y1E30 notation means a S. cerevisiae to E. coli mass ratio of 1:30. The same

- 20 -
notation is used for mass ratio of 1:60. Fer-1 lived significantly longer than N2 in the
experiment (All curves have a P value of <0.001). About 80% of the fer-1 C.elegans
lived till the 13th
day of the experiment.
- 21 -
Discussion
Using a liquid culture assay would be ideal for identifying fungal virulent factors
because it would make the high-throughput screening of the deletion library more
efficient. However, the assay has not been fully developed.
When using different mass ratios of S. cerevisiae to E. coli, C. elegans did not die
significantly faster at a lower concentration of S. cerevisiae compared to a higher
concentration of S. cerevisiae. Death could be accounted for fertilized eggs hatching
inside the body. While viewing this, there was uncertainty of whether the C. elegans died
because of S. cerevisiae or because of starvation. When the environment is not ideal, C.
elegans does not lay eggs (Schafer, 2005).
When observing the results obtained with N2 and mek-1, mek-1 died faster
compared to N2. There were other factors that influenced the dying of the C. elegans
such as larva hatching inside of the body. This mutation in the MAP kinase cascade in
the immune system may still be useful for high throughput assays because it is weaker
and more susceptible to infection.
To eliminate death due to fertilized eggs hatching within the worm’s body, we
used fer-1, a temperature-sensitive fertilization-defective mutant. At the restrictive, 20oC,
fer-1(b232) sperm are inactivated and eggs consequently are not fertilized. This would
prevent the effects of S. cerevisiae infection from being obscured and allow the real
effects of yeast to be observed. The fer-1 C. elegans stayed alive throughout the
experiment; only about 20% of the fer-1 C. elegans died within 12 days while more than
70% of the N2 died. The only reason that 100% of the N2 did not die is that the
experiment was terminated at 12 days. This experiment allowed us to conclude that wild
type C.elegans was not dying due to S. cerevisiae but due to the fertilized eggs hatching
within the body.

- 22 -
Further Experiment
From the results of experiments using different C.elegans mutants, a fer-1; mek-1
double mutant of C.elegans would be a good strain to test for further liquid assay
development.
Fer-1 mutant C. elegans will not lay any fertilized eggs at 20°C, the temperature
used for our liquid assay, which helps exclude the death-causing factor of fertilized eggs
hatching inside C.elegans bodies from experiment results. Therefore, experiments using
fer-1 mutant C.elegans should represent the influence of Saccharomyce cerevisiae more
accurately.
Mek-1 mutant C.elegans is more sensitive to fungal infection due to its mutation
in a gene that was previously shown to be important for innate immune responses to
bacterial infections (Nicholas and Hodkin, 2004). The effects of fungal infection on
C.elegans may be more obvious and thus easier to study using this strain of C.elegans in
liquid assay. The experiment time could also be shortened due to mek-1mutant C.elegans’
sensitivity.

- 23 -
Appendix 1: Raw Data
Day 1 Day 2 Day 3 Day 4 Day 5 Day 6 Day 7
E.coli only 65 86 105 106 98 64 15
Yeast:E.coli 1:30 48 113 112 104 108 100 21
Yeast:E.coli 1:60 68 147 142 141 135 107 48
Yeast:E.coli 1:120 136 151 154 153 125 103 24
Yeast:E.coli 1:240 80 100 95 98 82 67 6
Various Mass Ratios Without Feeding
Day 1 Day 2 Day 3 Day 4 Day 5 Day 6 Day 7 Day 8 Day 9 Day 10
E.coli only 61 81 82 82 82 80 67 26 5 5
E. coli only
Fed 60 68 69 69 69 64 60 34 9 8
Yeast:E.coli
1/30 53 87 92 92 92 92 83 52 15 14
Yeast:E.coli
1/30 fed 54 81 86 86 86 86 83 53 27 17
Yeast:E.coli
1/60 86 109 111 114 114 114 114 98 67 26
Yeast:E.coli
1/60 fed 63 96 96 96 96 96 96 88 53 35
Various Mass Ratios With Feeding
Day 1 Day 2 Day 3 Day 4 Day 5 Day 7
Y101 + E.coli 48 67 101 106 91 68
SOD1+ E.coli 77 99 146 168 192 52
Sigma+ E.coli 39 97 129 116 115 73
E. coli only 37 102 107 128 114 50
Different Yeast Mutants and Stains

- 24 -
N2 day 1 day2 day 3 day4 day5 day6 day7 day8 day9 day10
E.coli re-
feed 24 28 28 28 29 29 21 3 2 2
1Y:30E re-
feed 19 25 26 26 25 25 25 23 16 8
1Y:60E re-
feed 18 25 27 28 28 28 27 23 16 10
Mek-1 day 1 day 2 day 3 day4 day5 day 6 day 7 day8 day9 day10
E.coli re-
feed 38 49 58 57 57 56 19 1 0 0
1Y:30E re-
feed 13 27 35 41 41 41 41 34 19 14
1Y:60E re-
feed 28 40 54 54 57 56 53 18 13 6
mek-1 and N2 With Feeding
N2 day 1 day 2 day 3 day4 day5 day 6 day 7 day8 day9 day 10 day 11
E.coli re-
feed 16 17 19 19 19 16 12 7 2 1 1
1Y:30E re-
feed 19 21 28 29 29 29 27 25 23 13 8
1Y:60E re-
feed 16 26 21 21 18 18 18 15 14 10 6
fer-1 day 1 day 2 day 3 day4 day5 day 6 day 7 day8 day9 day10 day 11
E.coli re-
feed 23 31 31 31 31 31 31 28 28 24 24
1Y:30E re-
feed 15 32 42 42 42 42 42 41 38 37 37
1Y:60E re-
feed 23 31 37 37 40 40 40 37 36 33 33
fer-1 and N2

- 25 -
Appendix 2: SigmaStat Set-Up
Step 1: Enter Data in Columns

- 26 -
Step 2: Select LogRank Test
- 27 -
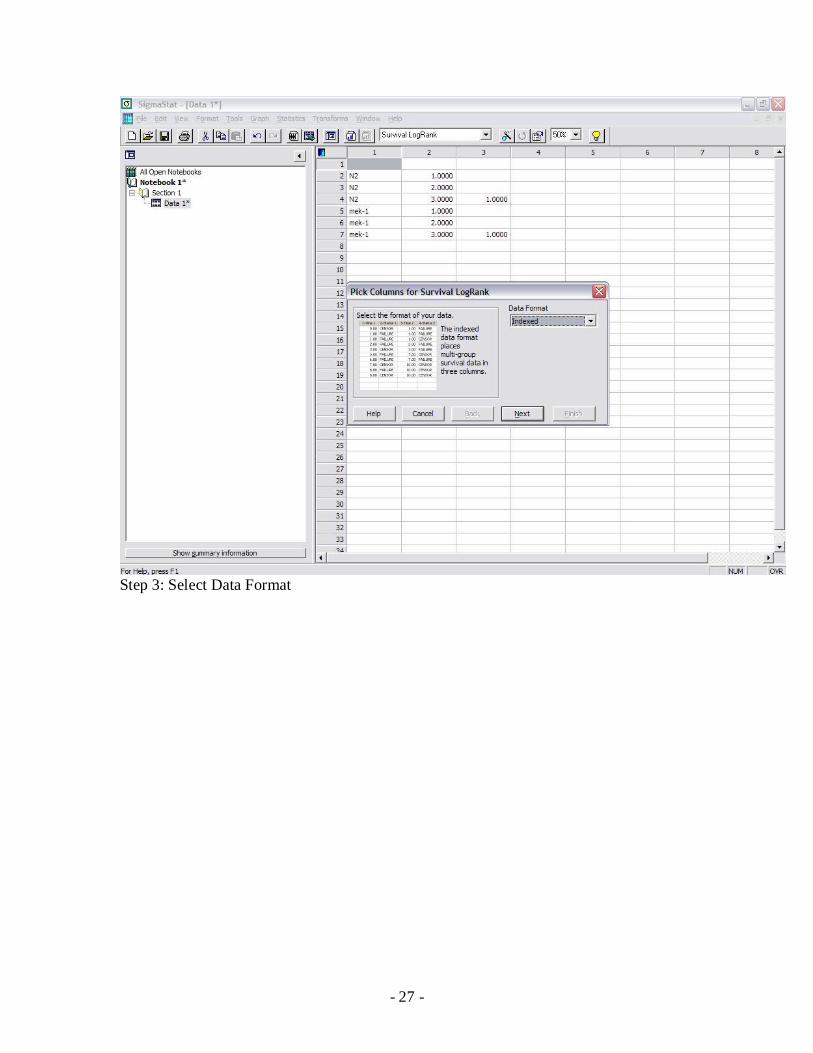
Step 3: Select Data Format

- 28 -
Step 4: Select Group, Time, and Status Columns

- 29 -
Step 5: Select Groups for Comparison

- 30 -
Step 6: Select Event (nothing is censored) and Click Finish

- 31 -
References
Angier, N. (1986) A Stupid Cell with All the Answers. Discover 7: 70-83
Cooper, G.M. and Hausman, R.E. (2007) The Cell A Molecular Approach. Washington
DC: ASM Press.
Cox, G. M., Harrison, T. S., McDade, H. C., Taborda, C. P. Heinrich, G., Casadevall, A.
and Perfect, J. R. (2002) Superoxide Dismutase Influences the Virulence of
Cryptococcus neoformans by Affecting Growth within Macrophages. Infection
and Immunity 71: 173-180
Forsburg, S. (1999) The Best Yeast? Trends in Genetics 15: 340-343
Daum, G. (2000) The Yeast Saccharomyces cerevisiae, a Eukaryotic Model for Cell
Biology. Microscopy Research and Technique 51: 493-495
Ewbank, J. J. (2006) Signaling in the immune response. Wormbook.org
Garbadi, S., Kubiak, D.W., Chandraker, A. K. And Tullius, S. (2007) Invasive fungal
infections and antifungal therapies in solid organ transplant recipients. European
Society for Organ Transplantation 20: 993-1015
Goffeau, A., Barrell, B. G., Bussey, H., Davis, R.W., Dujon, B., Feldmann, H., Galibert,
F., Hoheisel, J.D., Jacq, C., Johnston, M., Louis, E.J.,Mewes, H.W., Murakami,
Y., Philippsen, P., Tettelin H. and Oliver, S.G. (1996) Life with 6000 genes.
Science.274: 563–547.
Gracato-Nobre, M. J., Hodgkin, J. (2005) Caenorhabditis elegans as a model for innate
immunity to pathogens. Cellular Microbiology, 7(6), 741-751
Kelly, Linsley, O’Brien, Brendan. (2007) C. elegans Mutants with Decreased Pathogenic
Response to Yeast. Major Qualifying Project, Worcester Polytechnic Institute.
Heitman, J. (2005) A Fungal Achilles’ Heel. Science 309: 2175-2176
Heitman, J. and Howlett, B. (2008) Fungal Horizons: The Asilomar Fungal Genetics
Conference 2007. Fungal Genetics and Biology 45: 77-83
Huang, H. C., Bremer, E., Hynes, R. K., and Erickson, R. S. (2000) Foliar Application of
Fungal Biocontrol Agents for the Control of White Mold of Dry Bean Caused by
Sclerotinia sclerotiorum. Biological Control 18: 270-276
Introduction to C. elegans Anatomy. (2006) Wormbook.org

- 32 -
Maeta, K., Izawa, S. Okazaki, S., Kuge, S. and Inoue Y. (2004) Activity of the Yap1
Transcription Factor in Saccharomyces cerevisiae Is Modulated by
Methylglyoxal, a Metabolite Derived From Glycolysis. Molecular and Cellular
Biology 24: 8755-8764
Miller-Fleming, L., Giorgini, F. and Outeiro, T.F. (2008) Yeast as A Model for Studying
Human Neurodegenerative Disorders. Biotechnology Journal. 3: 325–338
Nicholas, H.R. and Hodgkin, J. (2004) The ERK MAP Kinase Cascade Mediates Tail
Swelling and a Protective Response to Rectal Infection in C.elegans. Current
Biology 14: 1256-1261
Prescott, L.M., Harley, J.P., and Klein, D.A. (2005) Microbiology. New York: McGraw-
Hill.
Pringle, J. R., Broach, J.R., Jones, E.W. (1997) The Molecular and Cellular Biology of
the yeast Saccharomyces. Cold Spring Harbor, New York: Cold Spring Harbor
laboratory
Schafer, W. R. Egg-laying (December 14, 2005), WormBook, ed. The C. elegans
Research Community, WormBook, doi/10.1895/wormbook.1.38.1,
http://www.wormbook.org.
Washington, N. L. and Ward, S. (2006) FER-1 regulates Ca2+
-mediated membrane fusion
during C. elegans spermatogenesis. Journal of Cell Science 119: 2552-2562
Yang, A. and Kerdel F.A. (2006) Infectious Disease Update: New Anti-Microbials.
Semin Cutan Med Surg 25: 94-99