A Linearized constraint based approach for … · A Linearized constraint based approach for...
41
Tel-Aviv University The Raymond and Beverly Sackler Faculty of Exact Sciences The Blavatnik School of Computer Science A Linearized constraint based approach for modeling signaling networks This thesis is submitted in partial fulfillment of the requirements towards the M.Sc. degree Tel-Aviv University The Blavatnik School of Computer Science by Liram Vardi The research work in this thesis has been carried out under the supervision of Prof. Eytan Ruppin and Prof. Roded Sharan October, 2011
Transcript of A Linearized constraint based approach for … · A Linearized constraint based approach for...
Tel-Aviv University
The Raymond and Beverly Sackler Faculty of Exact Sciences
The Blavatnik School of Computer Science
A Linearized constraint based approach for modeling
signaling networks
This thesis is submitted in partial fulfillment of the
requirements towards the M.Sc. degree
Tel-Aviv University
The Blavatnik School of Computer Science
by
Liram Vardi
The research work in this thesis has been carried out
under the supervision of Prof. Eytan Ruppin and Prof. Roded Sharan
October, 2011

2
Acknowledgments
First and foremost, I wish to thank my advisers, Profs. Roded Sharan and Eytan
Ruppin: To Roded, for encouraging me to move forward and for his amazing ability
to simplify any problem, To Eytan, for motivating and inspiring me, for our
fascinating meetings, and for his continual support. Roded and Eytan, you have been
amazing guides along the path. You’ve provided me exceptional knowledge and new
ways of thinking, and, most of all, you’ve taught me to believe in myself.
I wish to thank Tomer Benyamini and Keren Yizhak for unconditional willingness to
help and to advise me, and Matthew Oberhardt for providing helpful feedback.
I especially would like to thank two of my lab members: Shiri Stempler and Omer
Eilam for their close friendship.
Finally, I would like to thank my family and Tami Zelovich, for their encouragement
and support during my studies.

3
Abstract
With the unparalleled increase in the availability of biological data over the last
couple decades, accurate and computable models are becoming increasingly
important for unraveling complex biological phenomena. Past efforts to model
signaling networks have utilized various computational methods, including Boolean
and constraint-based modeling (CBM) approaches. These approaches are based on
solving mixed integer linear programs and, hence, may not scale-up for the analysis
of large networks and are not amenable for applications based on sampling the full
spectrum of the solution space. Here we propose a new CBM approach that is fully
linear and does not involve integer variables, thereby overcoming the
aforementioned limitations. We describe a novel optimization procedure for model
construction and demonstrate the utility of our approach on a reconstructed model
of the human epidermal growth factor receptor (EGFR) pathway, spanning 322
species and 211 connections. We compare our model’s predictions to experimental
phosphorylation data and to the predictions inferred via an additional Boolean-
based EGFR signaling model. Our results show high prediction accuracy (75%) and
high similarity to the Boolean model. Considering the marked computational
advantages in terms of scalability and sampling utilization obtained by having a
linear model, these results demonstrate the potential promise of this framework for
the study of cellular signaling.

4
stnotnoC
Abstract ............................................................................................................ 3
Introduction ...................................................................................................... 5
Modeling cellular signaling .............................................................................. 5
Constraints based modeling ............................................................................. 7
Previous work on signaling CBM ..................................................................... 12
Methods ......................................................................................................... 15
Model formulation ........................................................................................ 15
Model construction procedure ....................................................................... 20
Removing spurious stimulation loops .............................................................. 21
Addition of proper exchange reactions ........................................................... 24
Predicting system state ................................................................................. 26
Results ............................................................................................................ 27
Modeling EGFR signaling ............................................................................... 27
Translation of the Boolean model to CBM ....................................................... 27
Comparison to Boolean approaches ............................................................... 29
Future Directions ............................................................................................. 35
Discussion ....................................................................................................... 36
Bibliography .................................................................................................... 38
Supplementary Materials ................................................................................. 41

5
Introduction
Modeling cellular signaling
Working models of cellular signaling are a key to understanding information
processing and regulation in cells. On the topological level, many pathways have
been mapped in detail and are deposited in large-scale databases such as KEGG
(Kanehisa and Goto 2000). However, our understanding of their underlying logic and
workings is still in its infancy.
Kinetic models based on differential equations are the current gold standard for
modeling network events such as signaling, but as they are practical only in small
scale cases and require knowledge of many hard-to-assess parameters, mid- to
large-scale signaling models have been developed, the latter mainly focusing on
static rather than dynamic descriptions. Such static models include Petri nets
(Steggles et al. 2007) and Boolean (logic) networks (Li et al. 2009; Saez-Rodriguez et
al. 2009). Recently it has been suggested that the CBM approach could be adopted
for exploring the properties of cellular signaling networks (Papin and Palsson 2004b).
Until now, the vast majority of CBM studies in biology have focused on (i) generating
genome scale metabolic models for various organisms; and (ii) developing analytical
tools to use these models to learn about metabolism, with high level of prediction
accuracy for variety of networks responses and phenotypes (Price et al. 2004a).
CBM models have been used in the past to describe signaling networks, mainly
employing topological methods of extreme pathways analysis to elucidate central
modes of signaling in the networks studied (Papin and Palsson 2004a, b). A recent
6
study also indicated that the CBM framework can help elucidate combinations of
inputs that will create a desirable phenotype or intervention strategies that can help
prevent undesirable phenotypes (Dasika et al. 2006).
Here we take this computational framework one step forward. Previous signaling
CBM studies included a combination of linear programming (LP) and the use of
integer variables. The latter is NP-hard and one of the Karp's 21 NP-complete
problems (Karp et al. 1974) and therefore a significant disadvantage is the inability to
computationally contend with large and multivariate systems. Furthermore, due to
the non-convexity of these mixed integer systems, uniform sampling of the entire
solution space to provide an unbiased assessment of reaction network states is
impossible (Price et al. 2004a; Price et al. 2004b). As an alternative, we provide a
purely linear CBM formulation and a detailed automatic reconstruction procedure to
translate a static signaling network to a working signaling model. We demonstrate
our approach in a model reconstruction of one of the most studied systems in
mammalian cell signaling: the epidermal growth factor receptor (EGFR). We show
that we compare favorably to the state-of-the-art Boolean (logic) model on an
experimentally-derived validation data set (Samaga et al. 2009), while enjoying
some of the inherent modeling and analysis advantages associated with having a
linearized CBM framework.
7
Constraints based modeling
Constraint-based modeling (CBM) imposes the set of suitable constraints on the
space of possible biochemical behaviors and allows filtering out behaviors that are
not biologically feasible in a large-scale manner. CBM was previously shown to
successfully predict various metabolic phenotypes, including growth rates, nutrient
uptake rates, by-product secretion rates, gene essentiality, and intracellular fluxes,
etc (Price et al. 2004a). The essence of the CBM mathematical representation is the
underline biochemical reactions, while the major role of CBM model is to identify the
system metabolic steady state. The metabolic state is represented by a feasible flux
distribution through all reactions in the network (i.e., a vector of steady-state flux
rates), denoted as (where R is the reactions set in the network). While
metabolic networks have a straightforward definition for chemical reaction, signaling
CBM requires a more subtle approach. The signaling network interactions can be
separated into mass-flow reactions (which more resemble metabolic ones) and to
another type which is signaling CBM unique: signal-flow interactions. Mass flow
interactions are chemical reactions in which the participating components are
actually consumed or produced during the reactions. However, in signal flow
interactions, certain species (e.g. proteins) are not consumed during the interaction,
they are recycled and therefore mediate the signal transfer continuously, until they
are degraded. The interaction itself can be positive or negative, as we will explain
later. Traditional CBM of metabolic networks has only considered mass flow
interactions, therefore, a signaling CBM framework has to define a set of rules for

8
the implementation of signal-flow interactions (Dasika et al. 2006; Lee et al. 2008; Li
et al. 2009).
The CBM constraints can be dived into the following:
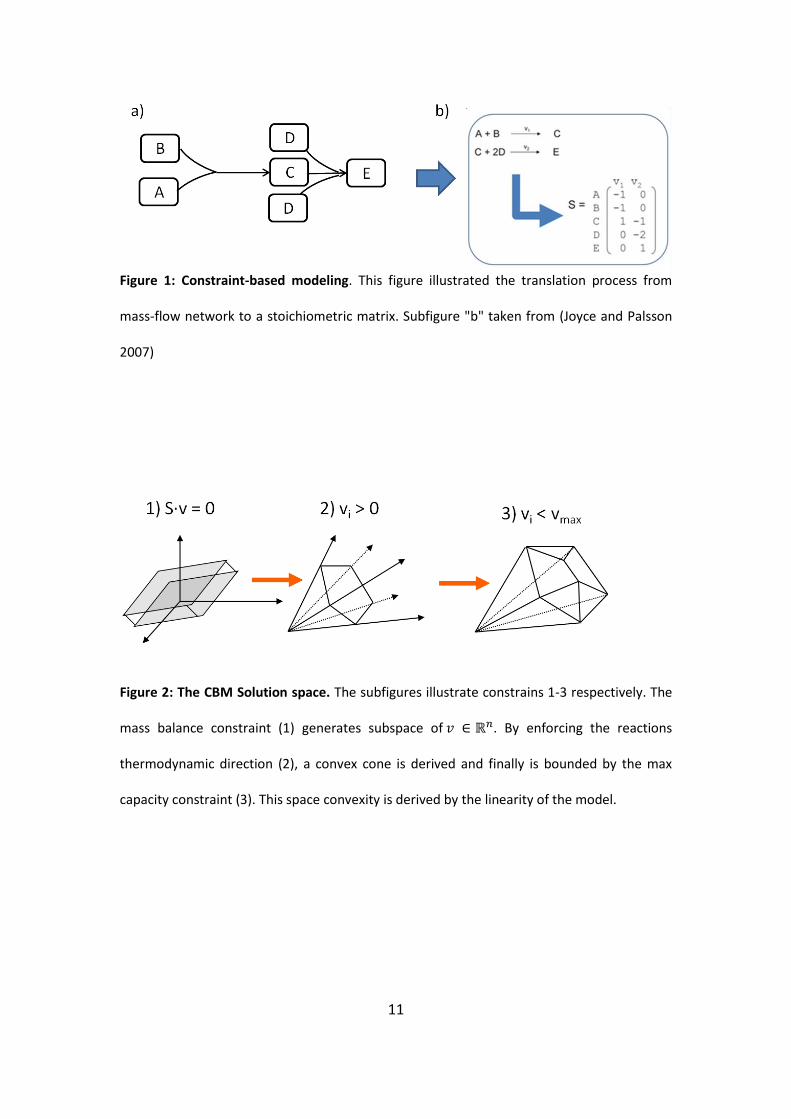
1) Mass balance constraints – impose the metabolic steady-state during which
there is no accumulation or depletion of species within the network.
Therefore, the production rate of each species should be equal to its
consumption rate. This is mathematically formulated by the stoichiometric
matrix (denoted by S ; M is the number of species), which
represents both the topology of the network and the stoichiometry of the
biochemical reactions (proportions of substances involved in the reactions;
see figure 1). Each row in this matrix represents a species and each column a
reaction where represents the stoichiometric coefficient of species i in
reaction j. The mass balance constraint is therefore enforced by the
equation: (figure 2.1).
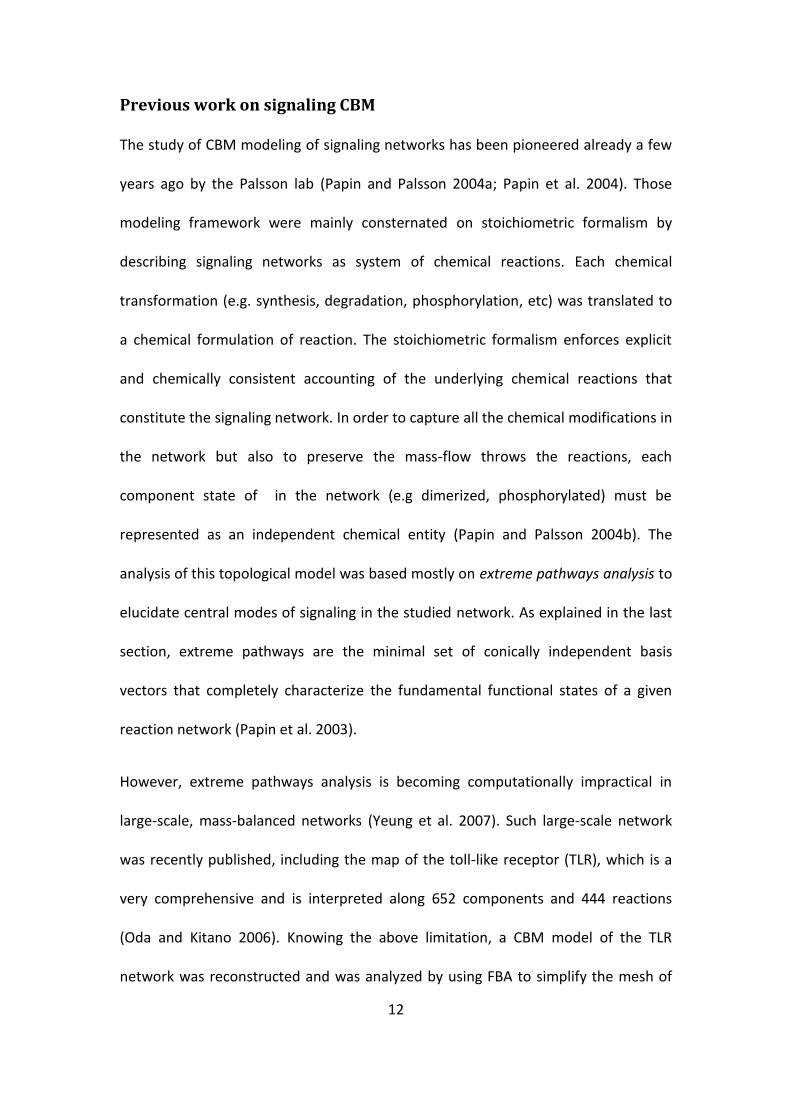
2) Thermodynamic constraints – limit the directionality of many biochemical
reactions based on thermodynamic considerations, leading to non-negative
fluxes for these reactions (i.e. for each reaction j for which
thermodynamic information is available, see figure 2.2).
3) Max capacity constraints – limit the upper bound flux level in each reaction
(i.e. for each reaction j), enforcing, for instance, the enzyme
capacity in reaction j for some bound (figure 2.3).
9
4) Stimulation availability constraints – allow the definition of different ligand
combinations as a signal initiator by imposing constraints on the maximal and
minimal allowed uptake rates of the relevant ligands.
5) Activation and Inhibition constraints - As part of the signal-flow interactions
in the network, there are species which their presentence is required for
none-negative flux (e.g. activation interaction), or the inverse case, enforces
zero flux (e.g. inhibition interactions) throw others affected reactions. The
mathematical representation of those "non-standard" CBM reactions is not
trivial and varies between the different approaches. Previews works has used
Mixed Integer Linear Programming (MILP), mostly on the inhibition
interaction (Dasika et al. 2006). In this thesis work, I developed a novel pure
linear formulation for those interactions.
Constraints 1-4 define a feasible convex and linear flux distribution solution space.
Our formulation for constraint 5 preserves the convexity of the solution space. This
space can be explored in several main ways:
1) Solution space characterization methods. One method allows the identifying
the solution space’s extreme pathways, one can characterize the edges of a
convex space (Papin et al. 2003). Any point inside the solution space can be
represented as a non-negative linear combination of extreme pathways.
2) Due to the convexity and linearity of the solution space, it can be explored by
solving a linear programming (LP) problem. Therefore, flux variability analysis
(FVA) is used to determine the feasible range of each reaction independently
within the solution space by formulating an LP problem to minimize or

10
maximize the flux through the reaction of interest (Mahadevan and Schilling
2003).
3) Optimization methods – are popular when an objective function can be
defined on the LP problem, therefore allow a solution space reduction to the
optimal solution space only. In the signaling CBM the objective function, for
instance, can be maximization of some phenotype reaction. The most
popular optimization method is Flux Balance Analysis (FBA) (Orth et al. 2010).
4) Sampling - Common questions require the exploration of the solution space,
which is derived from the system constraints. Moreover, in many cases there
is no predefined objective function that can serve as an indicator to the
general system state (For instance, growth rate reaction). Therefore, uniform
random sampling of the space of feasible flux distributions which is satisfying
the stoichiometric mass-balance, allows the unbiased appraisal of its
contents (Price et al. 2004a). Importantly, this analysis tool requires a convex
solution space (Papin and Palsson 2004a, b).
11
Figure 1: Constraint-based modeling. This figure illustrated the translation process from
mass-flow network to a stoichiometric matrix. Subfigure "b" taken from (Joyce and Palsson
2007)
Figure 2: The CBM Solution space. The subfigures illustrate constrains 1-3 respectively. The
mass balance constraint (1) generates subspace of . By enforcing the reactions
thermodynamic direction (2), a convex cone is derived and finally is bounded by the max
capacity constraint (3). This space convexity is derived by the linearity of the model.
12
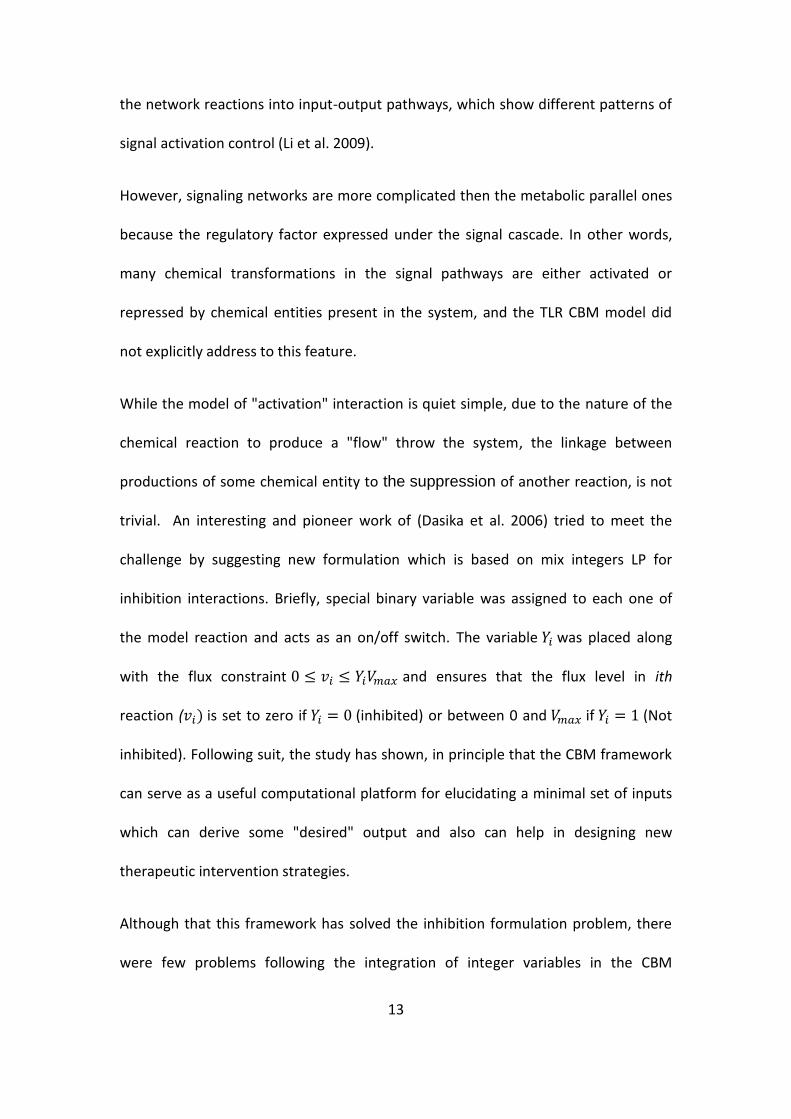
Previous work on signaling CBM
The study of CBM modeling of signaling networks has been pioneered already a few
years ago by the Palsson lab (Papin and Palsson 2004a; Papin et al. 2004). Those
modeling framework were mainly consternated on stoichiometric formalism by
describing signaling networks as system of chemical reactions. Each chemical
transformation (e.g. synthesis, degradation, phosphorylation, etc) was translated to
a chemical formulation of reaction. The stoichiometric formalism enforces explicit
and chemically consistent accounting of the underlying chemical reactions that
constitute the signaling network. In order to capture all the chemical modifications in
the network but also to preserve the mass-flow throws the reactions, each
component state of in the network (e.g dimerized, phosphorylated) must be
represented as an independent chemical entity (Papin and Palsson 2004b). The
analysis of this topological model was based mostly on extreme pathways analysis to
elucidate central modes of signaling in the studied network. As explained in the last
section, extreme pathways are the minimal set of conically independent basis
vectors that completely characterize the fundamental functional states of a given
reaction network (Papin et al. 2003).
However, extreme pathways analysis is becoming computationally impractical in
large-scale, mass-balanced networks (Yeung et al. 2007). Such large-scale network
was recently published, including the map of the toll-like receptor (TLR), which is a
very comprehensive and is interpreted along 652 components and 444 reactions
(Oda and Kitano 2006). Knowing the above limitation, a CBM model of the TLR
network was reconstructed and was analyzed by using FBA to simplify the mesh of
13
the network reactions into input-output pathways, which show different patterns of
signal activation control (Li et al. 2009).
However, signaling networks are more complicated then the metabolic parallel ones
because the regulatory factor expressed under the signal cascade. In other words,
many chemical transformations in the signal pathways are either activated or
repressed by chemical entities present in the system, and the TLR CBM model did
not explicitly address to this feature.
While the model of "activation" interaction is quiet simple, due to the nature of the
chemical reaction to produce a "flow" throw the system, the linkage between
productions of some chemical entity to the suppression of another reaction, is not
trivial. An interesting and pioneer work of (Dasika et al. 2006) tried to meet the
challenge by suggesting new formulation which is based on mix integers LP for
inhibition interactions. Briefly, special binary variable was assigned to each one of
the model reaction and acts as an on/off switch. The variable was placed along
with the flux constraint and ensures that the flux level in ith
reaction ( is set to zero if (inhibited) or between 0 and if (Not
inhibited). Following suit, the study has shown, in principle that the CBM framework
can serve as a useful computational platform for elucidating a minimal set of inputs
which can derive some "desired" output and also can help in designing new
therapeutic intervention strategies.
Although that this framework has solved the inhibition formulation problem, there
were few problems following the integration of integer variables in the CBM
14
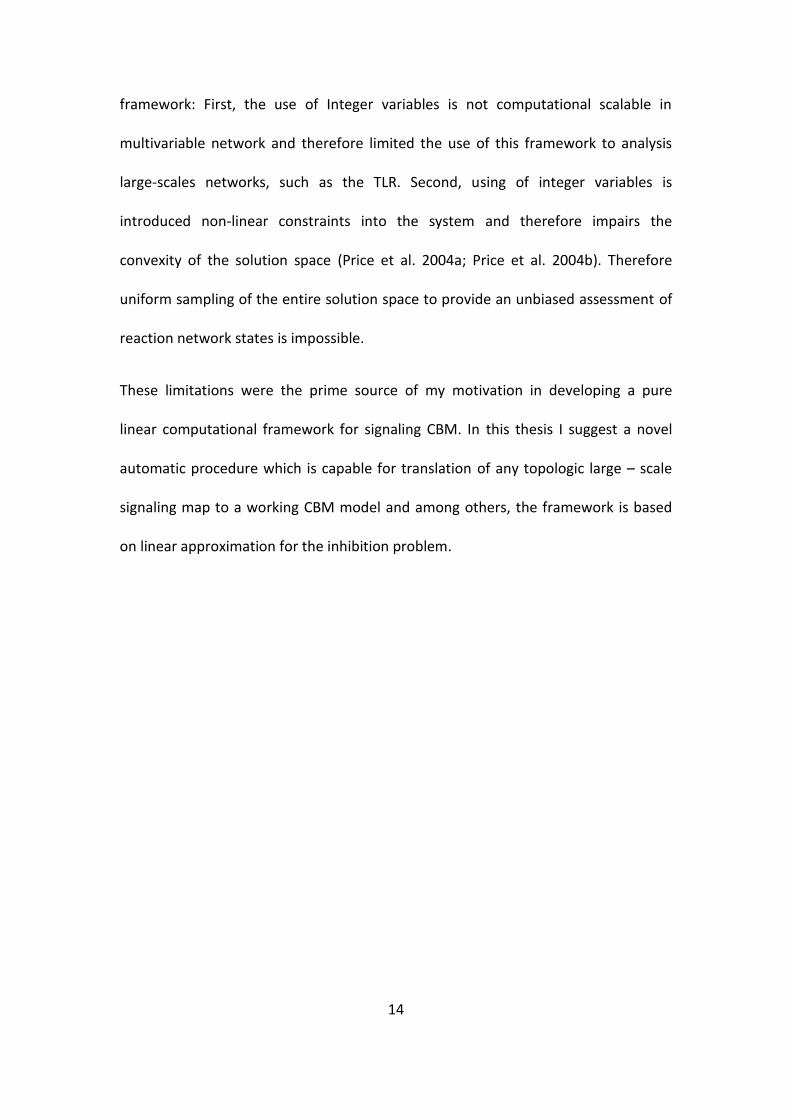
framework: First, the use of Integer variables is not computational scalable in
multivariable network and therefore limited the use of this framework to analysis
large-scales networks, such as the TLR. Second, using of integer variables is
introduced non-linear constraints into the system and therefore impairs the
convexity of the solution space (Price et al. 2004a; Price et al. 2004b). Therefore
uniform sampling of the entire solution space to provide an unbiased assessment of
reaction network states is impossible.
These limitations were the prime source of my motivation in developing a pure
linear computational framework for signaling CBM. In this thesis I suggest a novel
automatic procedure which is capable for translation of any topologic large – scale
signaling map to a working CBM model and among others, the framework is based
on linear approximation for the inhibition problem.
15
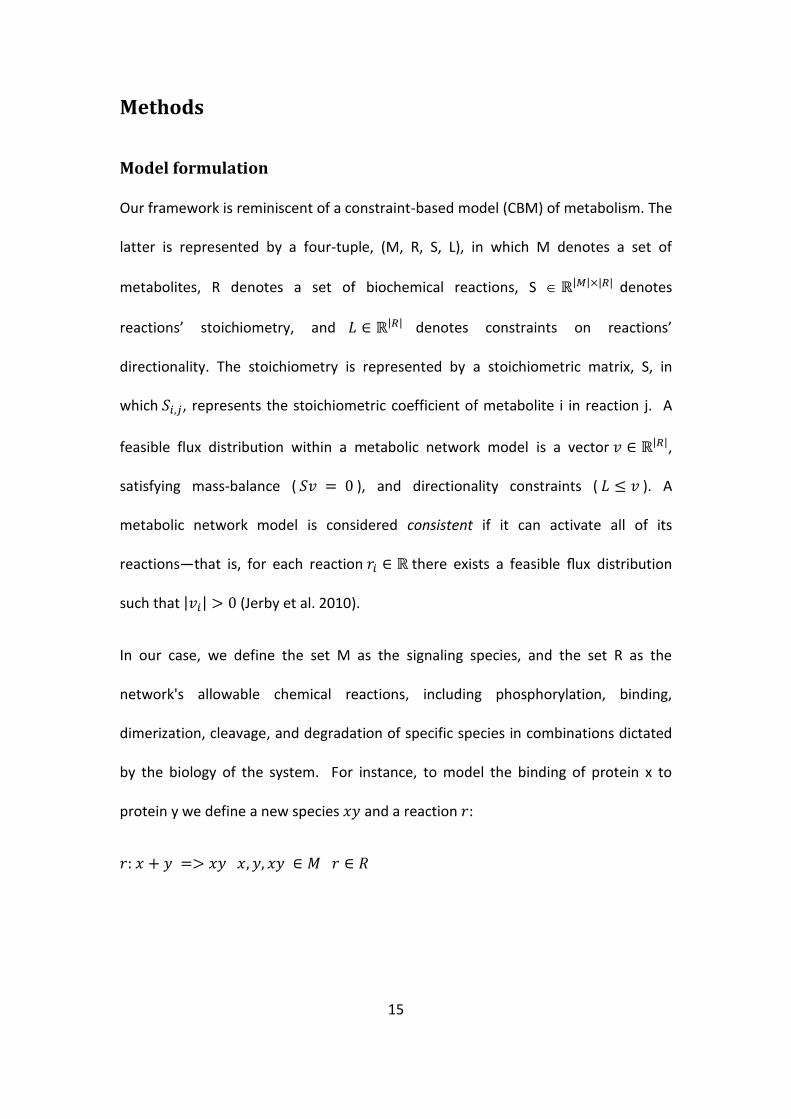
Methods
Model formulation
Our framework is reminiscent of a constraint-based model (CBM) of metabolism. The
latter is represented by a four-tuple, (M, R, S, L), in which M denotes a set of
metabolites, R denotes a set of biochemical reactions, S denotes
reactions’ stoichiometry, and denotes constraints on reactions’
directionality. The stoichiometry is represented by a stoichiometric matrix, S, in
which , represents the stoichiometric coefficient of metabolite i in reaction j. A
feasible flux distribution within a metabolic network model is a vector ,
satisfying mass-balance ( ), and directionality constraints ( ). A
metabolic network model is considered consistent if it can activate all of its
reactions—that is, for each reaction there exists a feasible flux distribution
such that (Jerby et al. 2010).
In our case, we define the set M as the signaling species, and the set R as the
network's allowable chemical reactions, including phosphorylation, binding,
dimerization, cleavage, and degradation of specific species in combinations dictated
by the biology of the system. For instance, to model the binding of protein x to
protein y we define a new species and a reaction :

16
Following (Dasika et al. 2006), we impose a steady state assumption where the
species concentrations remain constant, represented by the constraints
Our model differs the most from that of Dasika et al. in the representation of
inhibition constraints; While that of Dasika et al. relies on integer constraints, our
representation is fully linear. Formally, we define activators as all the species that
are necessary to carry out some chemical transformation (Dasika et al. 2006). Unlike
“regular” reactants, activators do not function as integral components of a reaction,
and usually are not consumed during the transformation. Consider the chemical
transformation , which is activated by a chemical entity . As C is not
consumed by the reaction, it should be both a substrate and a product. Similarly to
(Dasika et al. 2006), is duplicated to and , for "reactant" and "product",
respectively; an artificial direct reaction is then added between the two copies of C.
Rather than modeling the conditional activation of the reaction by incorporating the
activator into the reaction to tie between the activator and the regulated reaction,
as in (Dasika et al. 2006), we reformulate this conditioning using constraints on the
fluxes of the two reactions involved:
a) ,
b)
c)
Constraint (c) forces a zero flux on in a case . In the general case,
there may be more than one activator. Thus, we define as the set of the
17
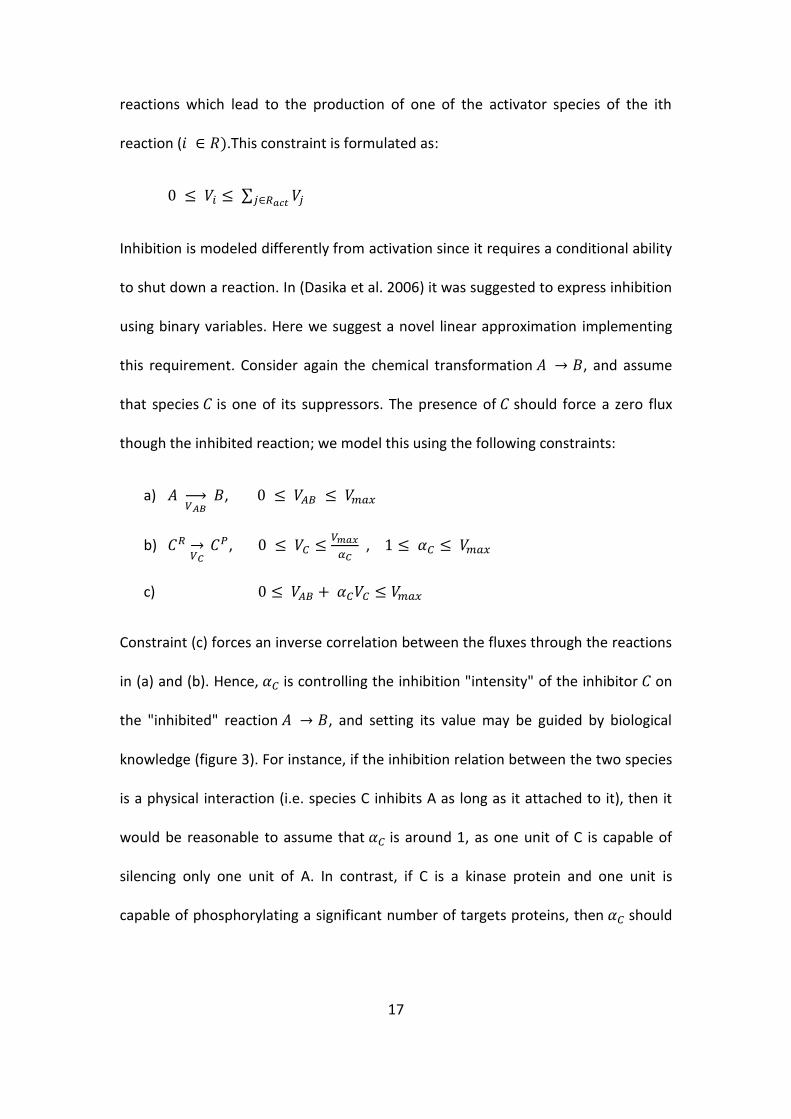
reactions which lead to the production of one of the activator species of the ith
reaction ( .This constraint is formulated as:
Inhibition is modeled differently from activation since it requires a conditional ability
to shut down a reaction. In (Dasika et al. 2006) it was suggested to express inhibition
using binary variables. Here we suggest a novel linear approximation implementing
this requirement. Consider again the chemical transformation , and assume
that species is one of its suppressors. The presence of should force a zero flux
though the inhibited reaction; we model this using the following constraints:
a) ,
b)
,
,
c)
Constraint (c) forces an inverse correlation between the fluxes through the reactions
in (a) and (b). Hence, is controlling the inhibition "intensity" of the inhibitor on
the "inhibited" reaction , and setting its value may be guided by biological
knowledge (figure 3). For instance, if the inhibition relation between the two species
is a physical interaction (i.e. species C inhibits A as long as it attached to it), then it
would be reasonable to assume that is around 1, as one unit of C is capable of
silencing only one unit of A. In contrast, if C is a kinase protein and one unit is
capable of phosphorylating a significant number of targets proteins, then should

18
be close to . In the absence of additional information, our default setting for the
ith inhibitor is .
19
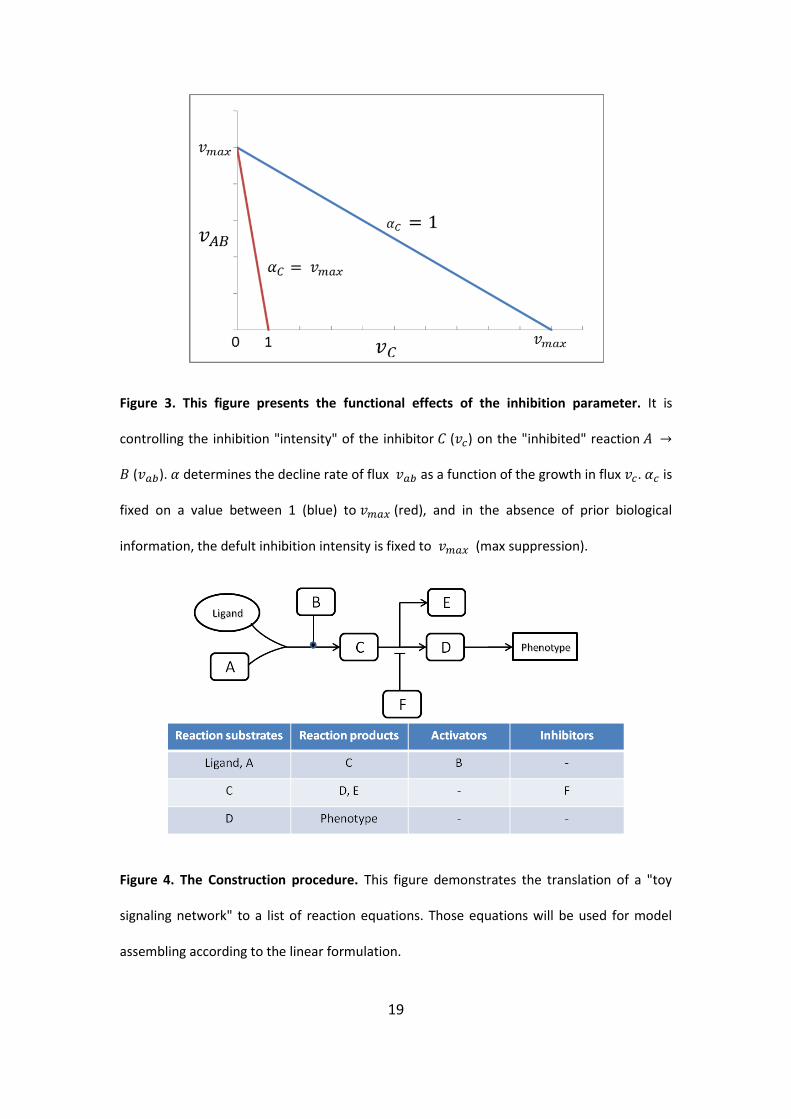
Figure 3. This figure presents the functional effects of the inhibition parameter. It is
controlling the inhibition "intensity" of the inhibitor ( ) on the "inhibited" reaction
( ). determines the decline rate of flux as a function of the growth in flux . is
fixed on a value between 1 (blue) to (red), and in the absence of prior biological
information, the defult inhibition intensity is fixed to (max suppression).
Figure 4. The Construction procedure. This figure demonstrates the translation of a "toy
signaling network" to a list of reaction equations. Those equations will be used for model
assembling according to the linear formulation.
20
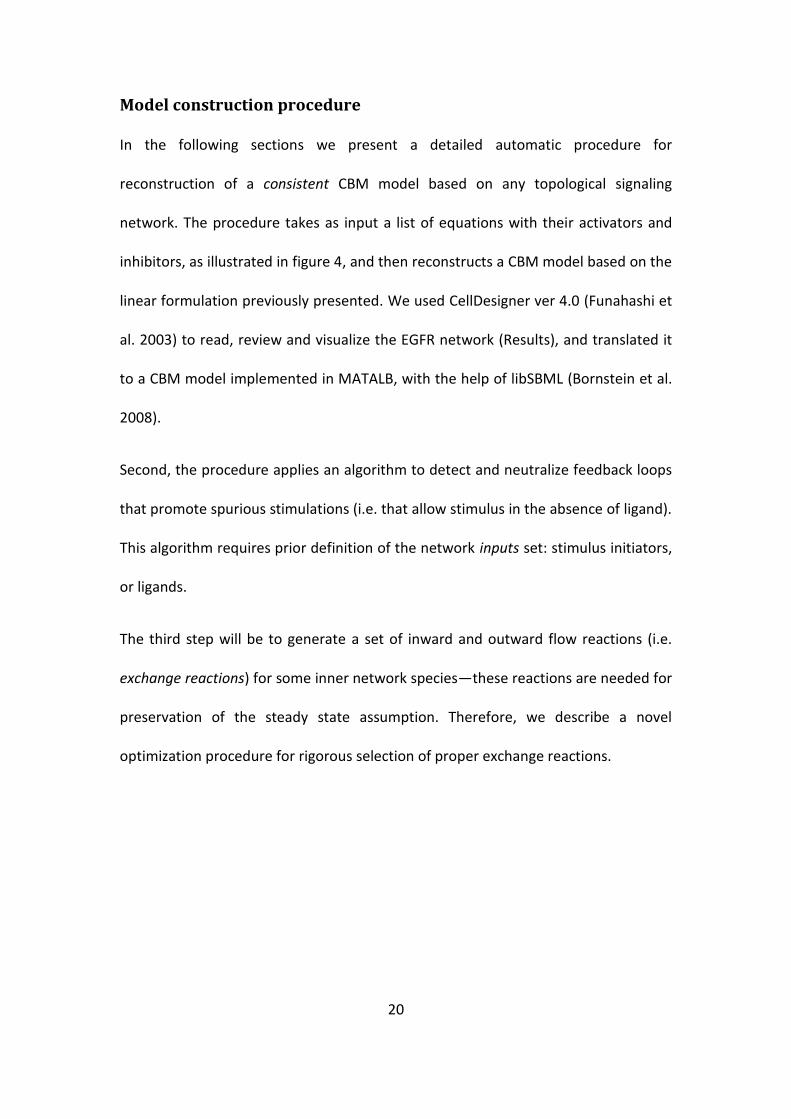
Model construction procedure
In the following sections we present a detailed automatic procedure for
reconstruction of a consistent CBM model based on any topological signaling
network. The procedure takes as input a list of equations with their activators and
inhibitors, as illustrated in figure 4, and then reconstructs a CBM model based on the
linear formulation previously presented. We used CellDesigner ver 4.0 (Funahashi et
al. 2003) to read, review and visualize the EGFR network (Results), and translated it
to a CBM model implemented in MATALB, with the help of libSBML (Bornstein et al.
2008).
Second, the procedure applies an algorithm to detect and neutralize feedback loops
that promote spurious stimulations (i.e. that allow stimulus in the absence of ligand).
This algorithm requires prior definition of the network inputs set: stimulus initiators,
or ligands.
The third step will be to generate a set of inward and outward flow reactions (i.e.
exchange reactions) for some inner network species—these reactions are needed for
preservation of the steady state assumption. Therefore, we describe a novel
optimization procedure for rigorous selection of proper exchange reactions.
21
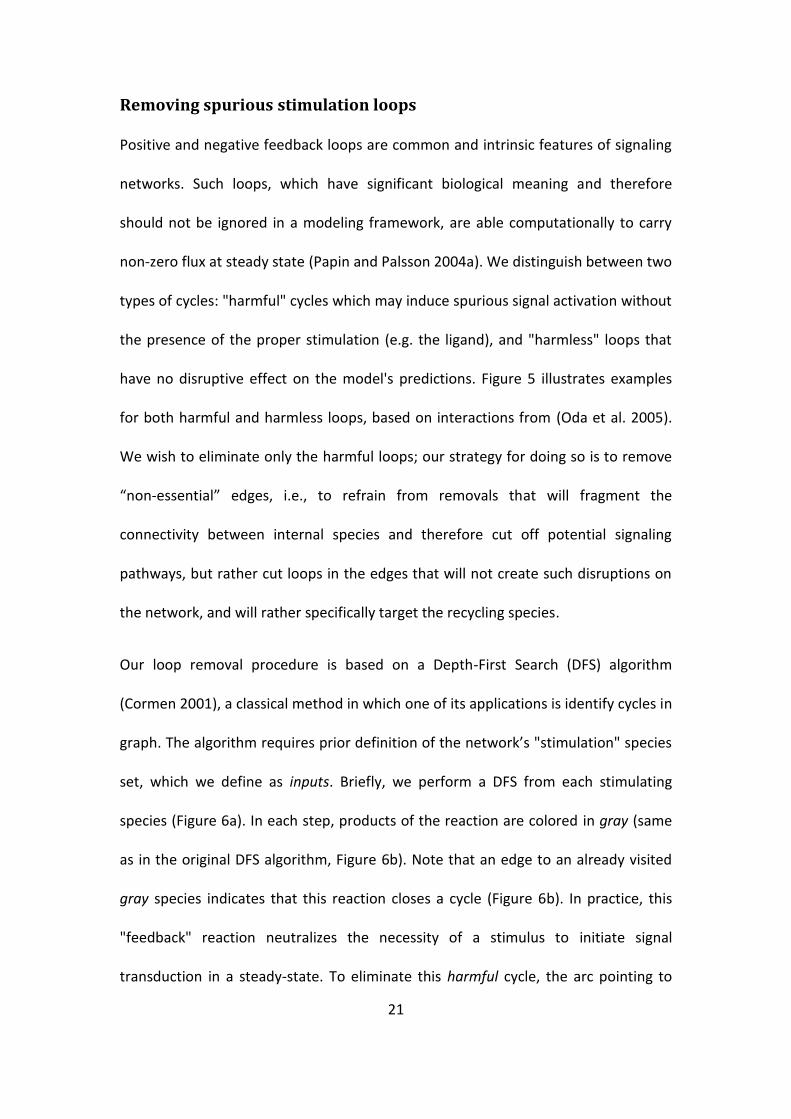
Removing spurious stimulation loops
Positive and negative feedback loops are common and intrinsic features of signaling
networks. Such loops, which have significant biological meaning and therefore
should not be ignored in a modeling framework, are able computationally to carry
non-zero flux at steady state (Papin and Palsson 2004a). We distinguish between two
types of cycles: "harmful" cycles which may induce spurious signal activation without
the presence of the proper stimulation (e.g. the ligand), and "harmless" loops that
have no disruptive effect on the model's predictions. Figure 5 illustrates examples
for both harmful and harmless loops, based on interactions from (Oda et al. 2005).
We wish to eliminate only the harmful loops; our strategy for doing so is to remove
“non-essential” edges, i.e., to refrain from removals that will fragment the
connectivity between internal species and therefore cut off potential signaling
pathways, but rather cut loops in the edges that will not create such disruptions on
the network, and will rather specifically target the recycling species.
Our loop removal procedure is based on a Depth-First Search (DFS) algorithm
(Cormen 2001), a classical method in which one of its applications is identify cycles in
graph. The algorithm requires prior definition of the network’s "stimulation" species
set, which we define as inputs. Briefly, we perform a DFS from each stimulating
species (Figure 6a). In each step, products of the reaction are colored in gray (same
as in the original DFS algorithm, Figure 6b). Note that an edge to an already visited
gray species indicates that this reaction closes a cycle (Figure 6b). In practice, this
"feedback" reaction neutralizes the necessity of a stimulus to initiate signal
transduction in a steady-state. To eliminate this harmful cycle, the arc pointing to

22
the gray species should be removed (figure 6c). Since each (hyper-) edge can have
more than a single source or target, we avoid a second revisit of a reaction through
another source by marking reactions as well upon visiting them (Figure 6d).
Figure 5. Examples of harmful and harmless feedback loops. This figure introduces two
ways to activate Apoptosis (Oda et al. 2005). In (a) there is an example of a harmful loop. In
steady state, the internal non-zero flux (in red) is “activating” NOD1 without any stimulation,
because the loop fully recovers the initial NOD1 species and therefore requires no net input
of that biologically necessary substrate. In contrast, (b) depicts a harmless loop. The
reaction between FADD and pro-caspase9 completely depends on the input stimulation (in
blue). In (c), removal of the marked edge will guide Apoptosis only upon an external
stimulation, and remedy the problem introduced in (a).

23
Figure 6. Illustration of the loop removal procedure. The algorithm starts from an input (a).
In each subsequent step, newly discovered species are painted in gray (b) and examined
reactions are marked (in red). In (c), a reaction with an arc to a product which is already
marked in gray is discovered. Therefore, the arc (and only it) will be removed. In (d), the last
step of the algorithm is illustrated.
Figure 7. Choosing a minimal exchange reaction set. The figure illustrates the exchange
reaction construction procedure. First, input and output reactions are added to each species.
Then, the optimization procedure suggests some minimal selection for an exchange reaction
set for a consistent model.
24
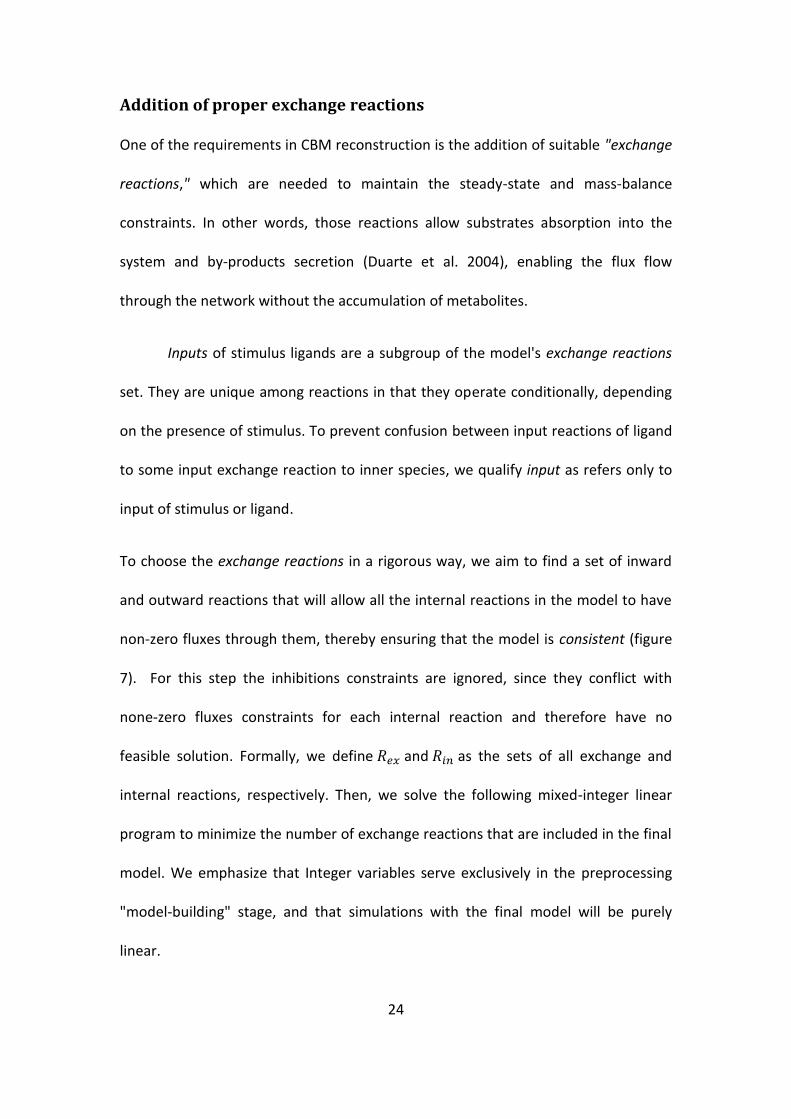
Addition of proper exchange reactions
One of the requirements in CBM reconstruction is the addition of suitable "exchange
reactions," which are needed to maintain the steady-state and mass-balance
constraints. In other words, those reactions allow substrates absorption into the
system and by-products secretion (Duarte et al. 2004), enabling the flux flow
through the network without the accumulation of metabolites.
Inputs of stimulus ligands are a subgroup of the model's exchange reactions
set. They are unique among reactions in that they operate conditionally, depending
on the presence of stimulus. To prevent confusion between input reactions of ligand
to some input exchange reaction to inner species, we qualify input as refers only to
input of stimulus or ligand.
To choose the exchange reactions in a rigorous way, we aim to find a set of inward
and outward reactions that will allow all the internal reactions in the model to have
non-zero fluxes through them, thereby ensuring that the model is consistent (figure
7). For this step the inhibitions constraints are ignored, since they conflict with
none-zero fluxes constraints for each internal reaction and therefore have no
feasible solution. Formally, we define and as the sets of all exchange and
internal reactions, respectively. Then, we solve the following mixed-integer linear
program to minimize the number of exchange reactions that are included in the final
model. We emphasize that Integer variables serve exclusively in the preprocessing
"model-building" stage, and that simulations with the final model will be purely
linear.

25
1)
2)
3)
4)
In this formulation, constraint (1) represents mass-balance. Constraints (2)
and (3) define the integer variables for inclusion of each exchange reaction, and
constraint (4) forces non-zero flux through internal reactions. The weights allow
prioritization of the reactions. In practice we set each to 1 (default value) but if
we wish to minimize the selection of incoming exchange reaction to some species
groups (for instance, phosphorylated or in complex proteins), we may impose a
higher to each ith species in those groups.
26
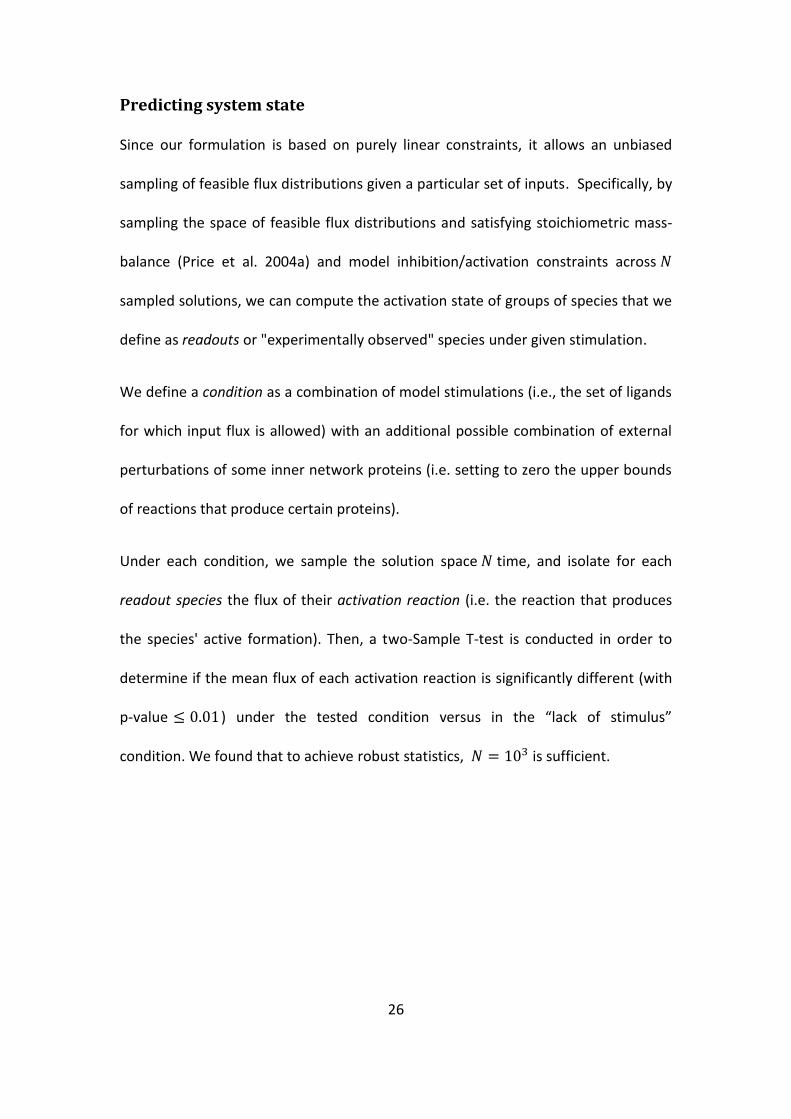
Predicting system state
Since our formulation is based on purely linear constraints, it allows an unbiased
sampling of feasible flux distributions given a particular set of inputs. Specifically, by
sampling the space of feasible flux distributions and satisfying stoichiometric mass-
balance (Price et al. 2004a) and model inhibition/activation constraints across
sampled solutions, we can compute the activation state of groups of species that we
define as readouts or "experimentally observed" species under given stimulation.
We define a condition as a combination of model stimulations (i.e., the set of ligands
for which input flux is allowed) with an additional possible combination of external
perturbations of some inner network proteins (i.e. setting to zero the upper bounds
of reactions that produce certain proteins).
Under each condition, we sample the solution space time, and isolate for each
readout species the flux of their activation reaction (i.e. the reaction that produces
the species' active formation). Then, a two-Sample T-test is conducted in order to
determine if the mean flux of each activation reaction is significantly different (with
p-value ) under the tested condition versus in the “lack of stimulus”
condition. We found that to achieve robust statistics, is sufficient.
27
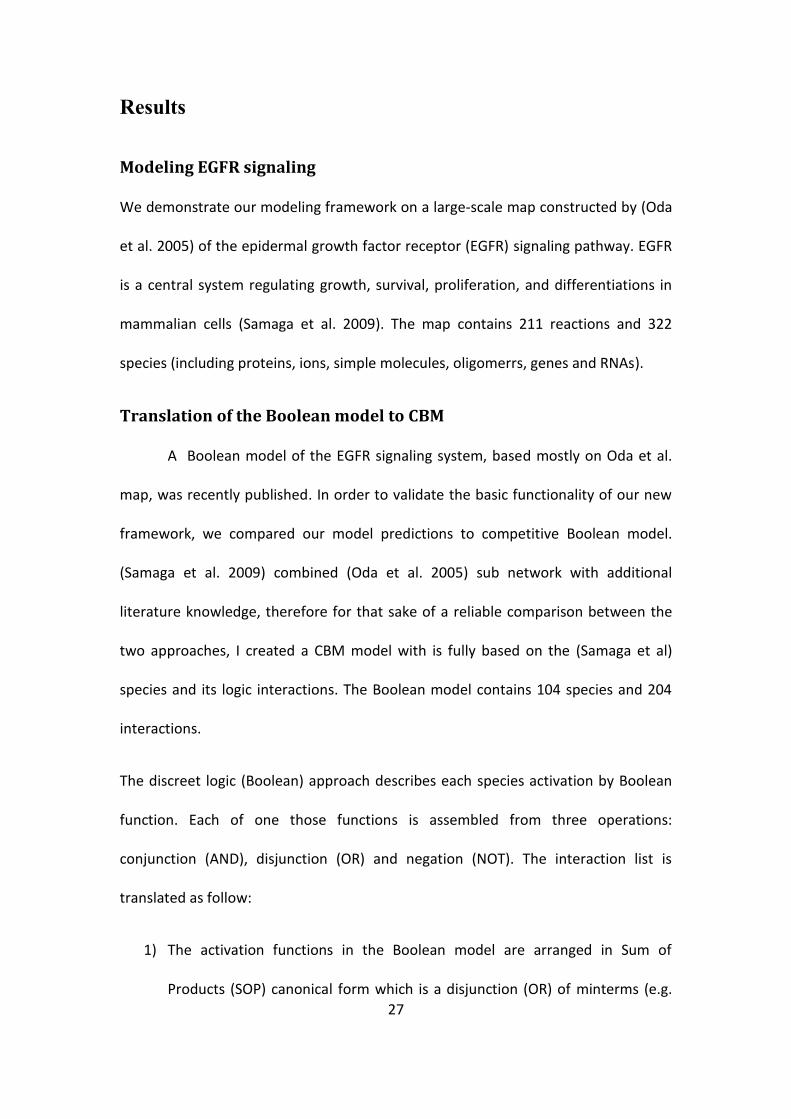
stRuseR
Modeling EGFR signaling
We demonstrate our modeling framework on a large-scale map constructed by (Oda
et al. 2005) of the epidermal growth factor receptor (EGFR) signaling pathway. EGFR
is a central system regulating growth, survival, proliferation, and differentiations in
mammalian cells (Samaga et al. 2009). The map contains 211 reactions and 322
species (including proteins, ions, simple molecules, oligomerrs, genes and RNAs).
Translation of the Boolean model to CBM
A Boolean model of the EGFR signaling system, based mostly on Oda et al.
map, was recently published. In order to validate the basic functionality of our new
framework, we compared our model predictions to competitive Boolean model.
(Samaga et al. 2009) combined (Oda et al. 2005) sub network with additional
literature knowledge, therefore for that sake of a reliable comparison between the
two approaches, I created a CBM model with is fully based on the (Samaga et al)
species and its logic interactions. The Boolean model contains 104 species and 204
interactions.
The discreet logic (Boolean) approach describes each species activation by Boolean
function. Each of one those functions is assembled from three operations:
conjunction (AND), disjunction (OR) and negation (NOT). The interaction list is
translated as follow:
1) The activation functions in the Boolean model are arranged in Sum of
Products (SOP) canonical form which is a disjunction (OR) of minterms (e.g.
28
logical AND of set of variables). Therefore each minterm in the activation
function of some species X will be translated to a separate reaction which
produces species X.
2) If some species X has N minterms in its activation function, its CBM
representation will be N separated reactions which lead to species X
production.
3) Species with negation (NOT) relationship in some minterm, will be defined as
an inhibitor of the minterm corresponding reaction.
29
Comparison to Boolean approaches
In order to validate basic functionality of our method, we first compared the
performance of our algorithm against that of a Boolean modeling approach (Hyduke
and Palsson 2010) that was recently applied to the EGFR system (Samaga et al.
2009), in accuracy of predicting phenotypes of an in vivo phosphorylation dataset.
The Boolean approach represents each node in the network using one of two
possible states – active and inactive. The state of a node is derived from its
"ancestors" in the network. While the Boolean formulation can effectively describe
activation and inhibition rules, the linear model, as discussed above, is amenable to
an assortment of tools that provide efficient and powerful model analysis options
(Price et al. 2004a). We applied both methods to the original model of (Oda et al.
2005) and constructed two versions of the EGFR system. In the first one, we omitted
the additional species and reactions that were added in (Samaga et al. 2009), and in
the second one, we translated the full interaction list, taken from (Samaga et al.
2009). We compare the two methods in their ability to predict the phenotypes of a
phosphorylation experimental data set, in which cells of the hepatocarcinoma cell
line HepG2 were treated with a variety of drugs and growth factor alpha ( )
(Samaga et al. 2009), and the phosphorylation states of several proteins included in
the EGFR network were measured. We use the normalized readout data supplied in
(Samaga et al. 2009), in which the activation states of 11 proteins are given binary
values and assessed under 38 experimental conditions. Each condition represents a
combination of stimulations (i.e., input ligands) and external perturbations of some
inner network proteins. Our model is based purely on (Oda et al. 2005) while the

30
original Boolean model has integrated additional literature knowledge. As a result,
on the first version we were able to test only 31 conditions and to monitor the
activation states of only 7 proteins, while on the second one we tested the full
conditions list and monitored all readout proteins.
On the first set of the tested conditions, we predicted the activation state of the 7
readouts (Methods). The Boolean model predicted correctly 68.7% of the states,
while our approach achieved an accuracy rate of 75% (Figure 8). We assumed that
the difference in performance is due to the difference between the model of Oda et
al. that we used and that of Samaga et al., as described above. Therefore we
validated this hypothesis by constructing a model which is fully based on Samaga et
al. Indeed, by converting the logical interaction list, we got 100% similarity rate
between the two models in the most runs. Nevertheless, focusing on prediction
errors that are common to both models it is possible to test the potential advantages
of the linear formulation over the binary one, as its continuous representation may
include useful information that is missing in the binary, discrete Boolean realization.
For instance, under some conditions the protein PI3K is inhibited and shown in
Figure 10; this inhibition affects the activation level of Mek1/2 (on the fully based
Samaga et al. network). Thus, While PI3k is not necessary for the MEK12 activation,
it clearly affects it. Examination of the flux level on MEK12 activation reaction points
out that PI3K inhibition has a negative effect on MEK12 (Figure 9-10). Another
example is the protein Creb. In comparison to stimulation with "no inhibition"
(condition 6), p38 or Pi3k inhibition (conditions 8-9, respectively, figure 9) has a
minor effect on Creb activation (figure 11). Yet, we can notice that PI3k has a more

31
decided influence (375.65 under PI3k versus 367.72). Network examination
confirmed that Pi3k is indeed located higher upstream to Creb then P38, therefore
its inhibition effects on more pathways which lead eventually to Creb activation.
Such insights can be easily gleaned only from a continuous framework, such as those
generate by a CBM approach.

32
Figure 8. Performance evaluation. This table describes the simulations results on HepG2
cells (Samaga et al. 2009). Each row represents a condition; there are two columns for each
readout, representing the predictions of the CBM and Boolean models. Dark green:
predicted correctly inactive. Light green: predicted correctly active. Dark red: predicted
incorrectly inactive. Light red: predicted incorrectly active. Black: On the tested condition,
the readout was externally inhibited; therefore its measurement is not relevant.

33
Figure 9. The examined species fluxes in their activation reactions (odd columns) versus
the experimental data (even columns). The conditions are ordered as in Figure 8. Each
column is colored by the values gradient (from yellow to green). The black squares are
irrelevant due to experimental inhibition. Conditions with inhibited PI3K are marked with
red and with inhibited P38, in blue.
34
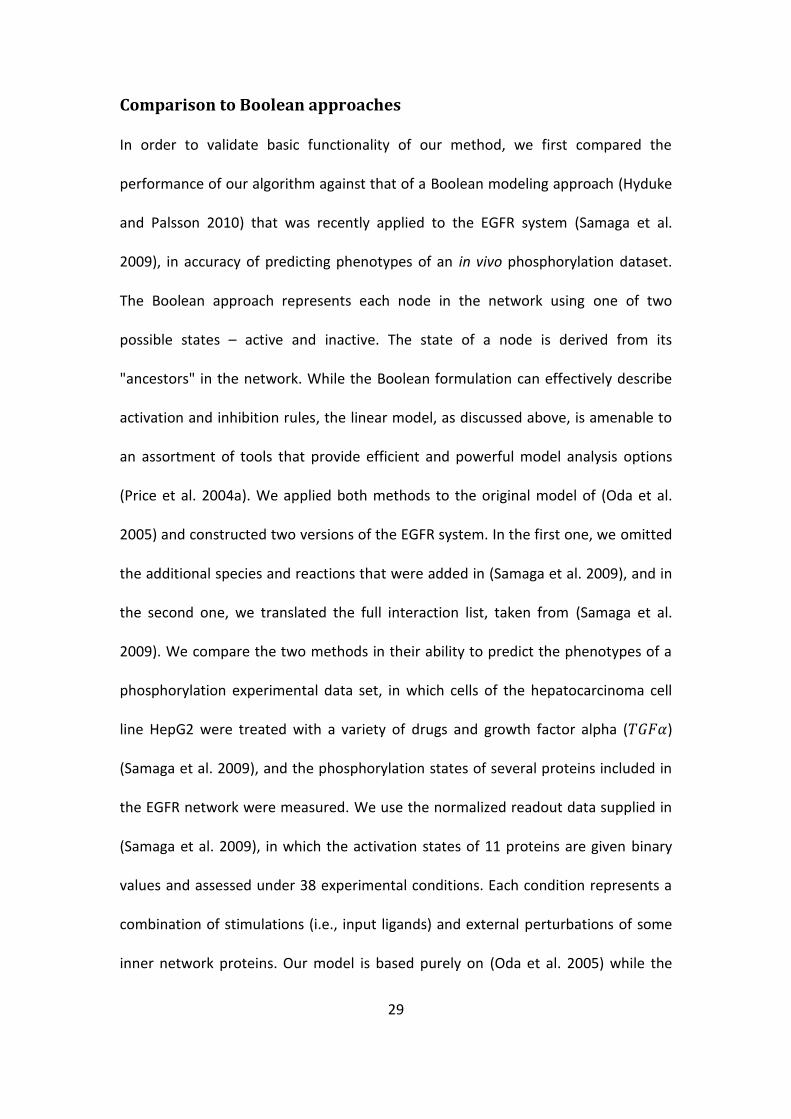
Figure 10. Activation level of MEK12. This figure presents the fluxes level of MEK12 under
38 conditions in sorted order. Each data point represents flux level of MEK12 under some
condition. Some of the conditions are sampled under PI3K inhibition (red) and some are not
(blue). The green and red line represents the Boolean prediction (active\inactive).
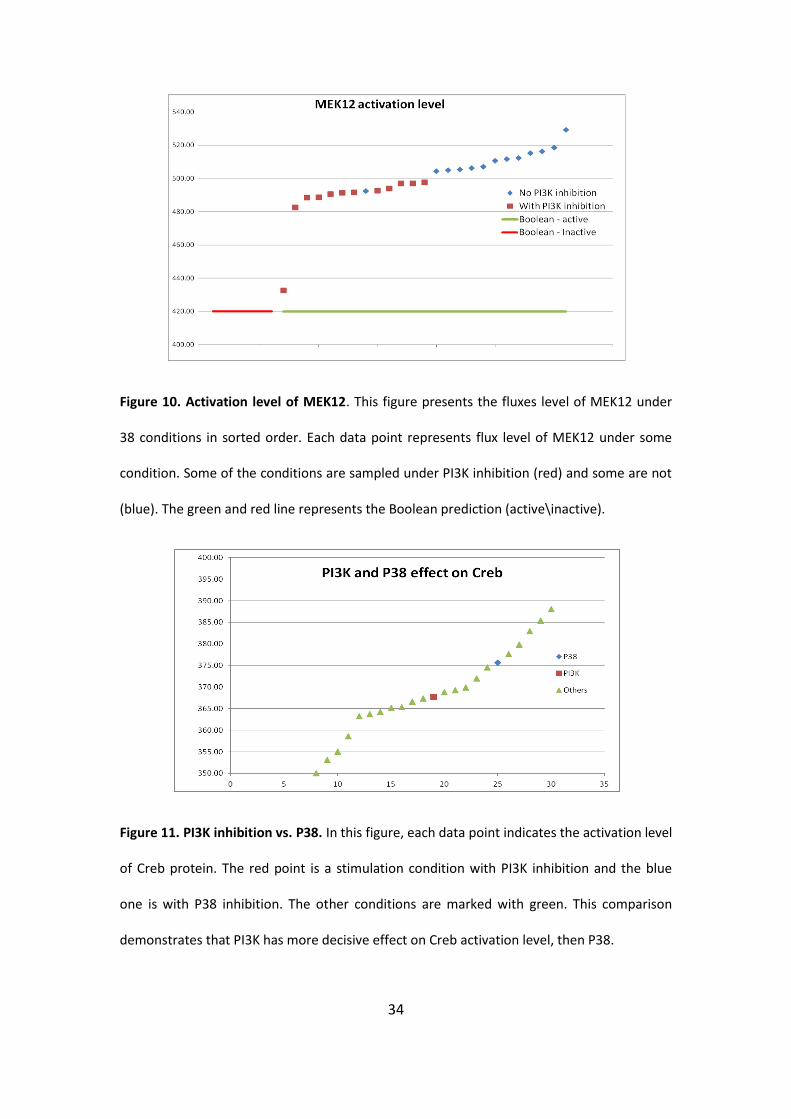
Figure 11. PI3K inhibition vs. P38. In this figure, each data point indicates the activation level
of Creb protein. The red point is a stimulation condition with PI3K inhibition and the blue
one is with P38 inhibition. The other conditions are marked with green. This comparison
demonstrates that PI3K has more decisive effect on Creb activation level, then P38.
35
sueuDteruDteeutuR
Modeling and analysis of large scale signaling systems by a CBM framework has been
already proposed in the past and potential benefits were discussed (Dasika et al.
2006; Papin and Palsson 2004b), but until this work, there was no real attempt to
objectively compare between this pioneered framework to the Boolean logic, which
is one of the leading formalisms available today for genome-scale analysis of
signaling networks (Hyduke and Palsson 2010).
The main contribution of this work was presentation of linear scalable formalisms
for signaling modeling and proofs its efficiency by conducting a comparison against
parallel non-linear CBM model and experimental data. Hence, a possible future work
could take a network of interest and utilize this linear framework as a computational
tool for the design of an experimental system that identifies interesting "case
studies". Then, one can test those computational predications experimentally, and
subsequently refine the model as needed.
For instance, an interesting goal of future work employing our approach could try to
predict the response of normal and cancerous cells to different cell signals under
different genomic contexts. Different genomic contexts can be gene knock-outs
which are occurring in cancer and have known disrupt effect on the system
operation and these genes KOs can be implemented by different available model
reactions. This will open the possibility of choosing the right combination of drugs
capable of targeting cancerous cells.

36
ruReuRRutu
We devised a novel approach for modeling genome-scale signaling networks based
on constraint-based modeling (Dasika et al. 2006). The novelty of our formulation is
the utilization of purely linear constraints, without relying on Integer programming in
the modeling stage. The approach also supports graded constraints and variable
strengths of activation and inhibition, which enable accurate capture of otherwise
elusive phenotypes. Thus, our modeling approach allows the scale-up to large multi-
variable networks. Our basic CBM formulation can be used to efficiently solve
diversified optimization problems, relying on the existing tool-box for the analysis of
genome-scale metabolism.
We introduce a comprehensive translation procedure to a signaling constraint-based
model, which can serve to reconstruct a working model for any given signaling
system. The proposed procedure removes harmful feedback loops which can
generate spurious predictions, and rigorously chooses a minimal set of internal
exchange reactions which is needed to maintain the mass-balance CBM provision.
Having automatically constructed a linearized version of a given signaling
network, we model the network effects of any given input condition by sampling the
full spectrum of the resulting solution space derived from the given stimulation
and/or perturbation. Even though our framework embodies strictly linear
approximations in its run time, we show that it can be used to efficiently and
accurately predict the in silico current state of the network species.
37
We demonstrate the reconstruction process by a translation of a detailed
EGFR/ErbB map (Oda et al. 2005) to a constraint based model. We used a previous
Boolean logic model and related phosphorylation data (Samaga et al. 2009) to
validate the ability of our linear framework to model this system. Importantly, we
show the power of uniform sampling of the solution space in providing informative
predictions, emphasizing the utility of a linearized signaling CBM approach.
Our simulation scheme, combined with all others optimization machinery of CBM
models, can be recruited to cope with host of key questions, such as identify system
perturbations as potential drugs targets with minimal influence on the other
network species, marking new potential unknown interactions between system
proteins in order to narrow experimental work and suggest new signaling pathways
using extant CBM gap filling technologies (Satish Kumar et al. 2007).
38
yupsutoDlbiB
Bornstein, B.J., Keating, S.M., Jouraku, A., et al. 2008. LibSBML: an API library for SBML.
Bioinformatics 24, 880-881.
Cormen, T.H. 2001. Introduction to algorithms. MIT Press, Cambridge, Mass. ; London.
Dasika, M.S., Burgard, A., and Maranas, C.D. 2006. A computational framework for the
topological analysis and targeted disruption of signal transduction networks. Biophys J 91,
382-398.
Duarte, N.C., Herrgård, M.J., and Palsson, B. 2004. Reconstruction and validation of
Saccharomyces cerevisiae iND750, a fully compartmentalized genome-scale metabolic
model. Genome Res 14, 1298-1309.
Funahashi, A., Morohashi, M., Kitano, H., et al. 2003. CellDesigner: a process diagram editor
for gene-regulatory and biochemical networks. BIOSILICO 1, 159-162.
Hyduke, D.R., and Palsson, B. 2010. Towards genome-scale signalling network
reconstructions. Nat Rev Genet 11, 297-307.
Jerby, L., Shlomi, T., and Ruppin, E. 2010. Computational reconstruction of tissue-specific
metabolic models: application to human liver metabolism. Mol Syst Biol 6, 401.
Joyce, A.R., and Palsson, B.O. 2007. Toward whole cell modeling and simulation:
comprehensive functional genomics through the constraint-based approach. Prog Drug Res
64, 265, 267-309.
Kanehisa, M., and Goto, S. 2000. KEGG: kyoto encyclopedia of genes and genomes. Nucleic
Acids Res 28, 27-30.
Karp, R.M., American Mathematical Society., and Society for Industrial and Applied
Mathematics. 1974. Complexity of computation. American Mathematical Society,
Providence, R.I.
39
Lee, J.M., Min Lee, J., Gianchandani, E.P., et al. 2008. Dynamic analysis of integrated
signaling, metabolic, and regulatory networks. PLoS Comput Biol 4, e1000086.
Li, F., Thiele, I., Jamshidi, N., et al. 2009. Identification of potential pathway mediation
targets in Toll-like receptor signaling. PLoS Comput Biol 5, e1000292.
Mahadevan, R., and Schilling, C.H. 2003. The effects of alternate optimal solutions in
constraint-based genome-scale metabolic models. Metab Eng 5, 264-276.
Oda, K., and Kitano, H. 2006. A comprehensive map of the toll-like receptor signaling
network. Mol Syst Biol 2, 2006.0015.
Oda, K., Matsuoka, Y., Funahashi, A., et al. 2005. A comprehensive pathway map of
epidermal growth factor receptor signaling. Mol Syst Biol 1, 2005.0010.
Orth, J.D., Thiele, I., and Palsson, B. 2010. What is flux balance analysis? Nat Biotechnol 28,
245-248.
Papin, J.A., and Palsson, B.O. 2004a. The JAK-STAT signaling network in the human B-cell: an
extreme signaling pathway analysis. Biophys J 87, 37-46.
Papin, J.A., and Palsson, B.O. 2004b. Topological analysis of mass-balanced signaling
networks: a framework to obtain network properties including crosstalk. J Theor Biol 227,
283-297.
Papin, J.A., Price, N.D., Wiback, S.J., et al. 2003. Metabolic pathways in the post-genome era.
Trends Biochem Sci 28, 250-258.
Papin, J.A., Reed, J.L., and Palsson, B.O. 2004. Hierarchical thinking in network biology: the
unbiased modularization of biochemical networks. Trends Biochem Sci 29, 641-647.
Price, N.D., Reed, J.L., and Palsson, B. 2004a. Genome-scale models of microbial cells:
evaluating the consequences of constraints. Nat Rev Microbiol 2, 886-897.
Price, N.D., Schellenberger, J., and Palsson, B.O. 2004b. Uniform sampling of steady-state
flux spaces: means to design experiments and to interpret enzymopathies. Biophys J 87,
2172-2186.
40
Saez-Rodriguez, J., Alexopoulos, L.G., Epperlein, J., et al. 2009. Discrete logic modelling as a
means to link protein signalling networks with functional analysis of mammalian signal
transduction. Mol Syst Biol 5, 331.
Samaga, R., Saez-Rodriguez, J., Alexopoulos, L.G., et al. 2009. The logic of EGFR/ErbB
signaling: theoretical properties and analysis of high-throughput data. PLoS Comput Biol 5,
e1000438.
Satish Kumar, V., Dasika, M.S., and Maranas, C.D. 2007. Optimization based automated
curation of metabolic reconstructions. BMC Bioinformatics 8, 212.
Steggles, L.J., Banks, R., Shaw, O., et al. 2007. Qualitatively modelling and analysing genetic
regulatory networks: a Petri net approach. Bioinformatics 23, 336-343.
Yeung, M., Thiele, I., and Palsson, B.O. 2007. Estimation of the number of extreme pathways
for metabolic networks. BMC Bioinformatics 8, 363.
41
lubbstatuelDBeeletDulss
S. Table 1: Excel file which contains the model description of the EGFR CBM model
that is based full on (Oda et al. 2005) model. The file contains the model reactions
and metabolites.
See http://www.cs.tau.ac.il/~liramvar/EGFR_model_based_oda_et_al.xlsx
S. Table 2: Excel file which contains the model description of the CBM model which
is fully based on (Samaga et al. 2009) model. The Boolean model interaction list has
been translated to CBM model. The file contains the model reactions and
metabolites.
See http://www.cs.tau.ac.il/~liramvar/EGFR_model_based_boolean.xlsx
S. Model files: This link follows to a zip file which contains the mat file of the both
models: The original EGFR model which is based on (Oda et al. 2005) and the one
which is based on (Samaga et al. 2009).
See http://www.cs.tau.ac.il/~liramvar/models_mat_file.zip